
HIV in Canada, Surveillance Report to December 31, 2020
Download the entire report
(PDF format, 1.36 MB, 56 pages)
Organization: Public Health Agency of Canada
Date published (Web): July 2022
Date published (PDF): January 2023
Acknowledgments
The publication of this report would not have been possible without the collaboration of public health surveillance and epidemiology units in all provinces and territories, whose continuous contribution to national HIV/AIDS surveillance is gratefully appreciated. This report is possible because of the close collaboration and participation of all partners in HIV and AIDS surveillance. Appendix 1 contains a complete list of all data contributors.
This report was prepared by the Centre for Communicable Diseases and Infection Control, Infectious Diseases Programs Branch, Public Health Agency of Canada. Any comments and suggestions that would improve the usefulness of future publications are welcome and can be sent to the attention of the HIV/AIDS Surveillance System (HASS) within the Centre for Communicable Diseases and Infection Control, Public Health Agency of Canada, at hass@phac-aspc.gc.ca.
On this page
- List of report figures
- List of report tables
- List of data tables
- List of acronyms
- Executive summary
- Introduction
- Methods
- Surveillance data at a glance
- Discussion
- Conclusion
- Data tables
- Supplementary tables
- Appendix 1: Data contributors
- Appendix 2: Technical notes
- Appendix 3: Exposure category hierarchy
- References
List of report figures
- Figure 1: Schematic showing the data flow for first-time and previously diagnosed cases from all provinces and territories for 2020
- Figure 2: Number of first-time diagnoses of HIV and diagnosis rates overall, by sex and year, Canada, 2011 to 2020
- Figure 3: HIV diagnosis rate per 100,000 population, by province or territory, Canada, 2020
- Figure 4: HIV diagnosis rate per 100,000 population, by sex and age group, Canada, 2020
- Figure 5: HIV diagnosis rate per 100,000 population, by age group and year, Canada, 2011 to 2020
- Figure 6a: Percentage distribution of HIV cases among adult males (≥ 15 years old), by exposure category and year of diagnosis, Canada, 2011 to 2020
- Figure 6b: Percentage distribution of HIV cases among adult females (≥ 15 years old), by exposure category and year of diagnosis, Canada, 2011 to 2020
- Figure 7: Proportion of reported HIV cases (≥15 years of age), by exposure category and age group, Canada, 2020
- Figure 8: Number of perinatally HIV-exposed infants and proportion of perinatally HIV-exposed infants whose mothers were receiving antenatal antiretroviral therapy, by year of birth, Canada, 2013 to 2020
- Figure 9: Number of migrants who tested positive for HIV during an Immigration Medical Exam conducted in Canada, 2011 to 2020
- Figure A1: Status of reporting on first-time diagnoses and previously diagnosed cases in all Canadian provinces and territories, 2011 to 2020
- Figure A2: All reported HIV Cases (including first-time and previously diagnosed) by year of diagnosis, Canada, 2011 to 2020
- Figure A3: Status of reporting of AIDS diagnoses in all Canadian provinces and territories, 2011 to 2020
List of report tables
- Table 1: Number and proportion of HIV cases (≥15 years of age), by sex and exposure category, Canada, 2020
- Table 2: Number and percentage distribution of HIV cases, by sex and race/ethnicity, Canada, 2020
- Table 3: Number of AIDS cases (all ages), by sex and year of diagnosis, from reporting Canadian provinces and territories, 2011 to 2020
- Table 4: Number of deaths attributed to HIV infection, by age at death and sex, Canada, 2011 to 2019
- Table 5: Number of deaths attributed to HIV infection among adults (≥ 15 years), by sex, Canada, 2000 to 2019
List of data tables
- Data Table 1: Number of first-time diagnoses of HIV and diagnosis rates overall, by sex and year, Canada, 2011 to 2020
- Data Table 2: HIV diagnosis rate (per 100,000 population) by province and territory, Canada, 2020
- Data Table 3: HIV diagnosis rate per 100,000 population, by sex and age group, Canada, 2020
- Data Table 4: Number and rate of HIV diagnosis (per 100,000 population) by age group and year, Canada, 2011 to 2020
- Data Table 5a: Percentage distribution of HIV cases among adults (≥ 15 years old) by exposure category and year of diagnosis, Canada, 2011 to 2020
- Data Table 5b: Percentage distribution of HIV cases among adult males (≥ 15 years old) by exposure category and year of diagnosis, Canada, 2011 to 2020
- Data Table 5c: Percentage distribution of HIV cases among adult females (≥ 15 years old) by exposure category and year of diagnosis, Canada, 2011 to 2020
- Data Table 6: Proportion of reported HIV cases (≥15 years of age) by exposure category and age group, Canada, 2020
- Data Table 7: Number of Canadian perinatally HIV-exposed infants by year of birth, current status and use of antiretroviral therapy (ART) for prophylaxis, 1984 to 2020
- Data Table 8: Number and percentage distribution of immigration applicants to Canada diagnosed with HIV as a result of an Immigration Medical Exam (IME) by year and location of test, 2011 to 2020
- Data Table 9: Number and percentage distribution of immigration applicants to Canada diagnosed with HIV as a result of an Immigration Medical Exam (IME) by location of test, sex, age group, and province, 2012 to 2020
- Data Table 10: International statistics on reported HIV cases by country, 2020
List of acronyms
- AIDS
- Acquired Immunodeficiency Syndrome
- ART
- Antiretroviral Therapy
- COVID-19
- SARS-CoV2/ Coronavirus Disease 2019
- CPHSP
- Canadian Perinatal HIV Surveillance Program
- CVSD
- Canadian Vital Statistics Death Database
- gbMSM
- Gay, bisexual and other men who have sex with men
- GCMS
- Global Case Management System
- HASS
- HIV/AIDS Surveillance System
- HIV
- Human Immunodeficiency Virus
- ICD
- International Classification of Diseases
- IDU
- Injection Drug Use
- IME
- Immigration Medical Exam
- IRCC
- Immigration, Refugees and Citizenship Canada
- OOC
- Out of Country
- OOP
- Out of Province
- PHAC
- Public Health Agency of Canada
- PrEP
- Pre-exposure Prophylaxis
- PT
- Province or Territory
- SC
- Statistics Canada
- STBBI
- Sexually Transmitted and Blood-Borne Infections
- STI
- Sexually Transmitted Infection
Executive summary
The HIV in Canada, Surveillance Report to December 31, 2020 published by the Public Health Agency of Canada (PHAC) presents and describes national epidemiological trends on HIV diagnoses in Canada regarding geographic region, age at diagnosis, sex, race/ethnicity and exposure category between 2011 and 2020. This surveillance report is the first national surveillance report to present information on first-time diagnoses, allowing PHAC to provide evidence for the planning, evaluation and implementation of HIV prevention programs.
The specific changes to the national dataset used in routine surveillance include:
- The inclusion of only first-time diagnosed HIV cases in order to examine acquisition and transmission of HIV in Canada.
- Exposure category information was provided from all provinces and territories for 2020.
Data for the year 2020 should be interpreted with caution due to the effect of the COVID-19 pandemic on access to sexually transmitted and blood-borne infection (STBBI) services such as HIV testing and harm reduction; and an impact on HIV surveillance activities in Canada during this period. The true impact and lasting effects of the COVID-19 pandemic on HIV transmission in Canada may become clearer with continued collection and analysis of HIV surveillance data in the years to come.
Key findings include:
- In 2020, 1,639 newly diagnosed cases of HIV were reported in Canada. This is a decrease of 21.0% compared to 2019 (2,071 cases), the largest year-over-year decrease in the last ten years. This decrease may be related to the observed impact of COVID-19 public health measures on the delivery of and access to sexually transmitted and blood-borne infections (STBBI) testing services and may also be in part, due to inclusion of only first-time diagnoses in these analyses.
- The national rate of reported HIV cases was 4.3 per 100,000 population in 2020, a decrease from 5.5 per 100,000 population in 2019.
- The overall trends of the past five years show the number of first-time HIV diagnoses in Canada had increased from 1,930 cases in 2015 to a peak of 2,285 cases in 2018 before decreasing to 1,639 cases in 2020. Similarly, the national HIV diagnosis rate had increased from 5.4 per 100,000 population in 2015 to 6.2 per 100,000 population in 2018, before decreasing to 4.3 per 100,000 population in 2020.
- The HIV diagnosis rate was 6.2 per 100,000 population in males and 2.4 per 100,000 population in females in 2020; showing a decrease for both sexes from rates reported in 2019 (which were 7.8 and 3.3 HIV diagnoses per 100,000 population, respectively).
- Recent trends in the HIV diagnosis rate among males show a continued decline in rates that peaked at 9.2 per 100,000 males, in 2016; while among females, the trend shows a more subtle decline from a peak rate of 3.4 per 100,000 females, in 2018.
- When broken down into ten-year age groups, the HIV diagnosis rate in the 30 to 39 years age group continues to be the highest among all age groups with 9.8 per 100,000 population in 2020.
- The highest HIV diagnosis rate across provinces and territories was in Saskatchewan, with 15.7 per 100,000 population. The lowest diagnosis rate was in the Atlantic region with 1.3 per 100,000 population.
- According to reported exposure category, male-to-male sexual contact continues to account for the highest proportion of diagnoses in males, at 60.8% of diagnoses in 2020. Heterosexual contact continues to account for the highest proportion of diagnoses in females, at 65.7% of diagnoses.
- In terms of available race/ethnicity information, white and Indigenous race/ethnicities accounted for 12.5% and 7.4%, respectively, of all HIV diagnoses in males. Indigenous and Black race/ethnicities accounted for 19.5% and 6.6% of the HIV diagnoses in females. Findings should be interpreted with extreme caution as a substantial portion of race/ethnicity data is missing or not reported (63.9%). Race/ethnicity data were submitted by eleven of thirteen provinces and territories and only available for 36.1% of all first-time diagnoses in 2020.
- The total number of migrants who tested positive for HIV during an Immigration Medical Exam (IME) was 743 in 2020 (either in Canada or overseas). This is a decrease from 1,188 migrants who tested positive for HIV during an IME in 2019. It is likely that this decrease is due to the impact of the COVID-19 pandemic on immigration patterns in 2020.
- Of perinatally exposed infants, 97.2% received antiretroviral therapy (ART) in 2020. There were five infants confirmed perinatally infected with HIV in 2020: two with 'any' perinatal ART treatment, two without treatment, and one infant with unknown treatment status.
- In 2020, there were 88 cases of AIDS reported, a continued decrease since 2011. However, findings should be interpreted with caution, as AIDS data are currently limited to four provinces in 2020 (New Brunswick, Nova Scotia, Ontario and Saskatchewan).
- In 2019 (the most recent year where data is available from Statistics Canada), there were 103 deaths attributed to HIV. This represents a continuing decrease in HIV mortality.
Introduction
Human Immunodeficiency Virus (HIV) infection is a serious global public health issue. There were an estimated 37.7 million people living with HIV at the end of 2020.Footnote 1 While new HIV infections have decreased by 52% since the peak of the epidemic in 1997, it is estimated that 1.5 million people globally became newly infected with HIV in 2020.Footnote 2 Increased access to antiretroviral therapy (ART) has significantly improved the lives of people living with HIV, and 27.5 million people accessed treatment by the end of 2020.Footnote 2 However, certain populations, including women and sexual minorities, continue to face barriers to appropriate care due to a variety of factors.Footnote 2Footnote 3
In Canada, the HIV epidemic has evolved in recent years due to changes in the uptake of ART, an observed shift in diagnosis rates among key populations, and an increase in the uptake of HIV Pre-Exposure Prophylaxis (PrEP). First, the availability of ART since the 1990s has led to decreased HIV-related mortality and morbidity. For people living with HIV who are aware of their infection status and can access and adhere to treatment, ART has transformed HIV from a fatal disease into a manageable chronic illness.Footnote 4 Second, there has been a noted increase in HIV diagnosis rates among women in recent years.Footnote 5 However, in line with previous reports, gay, bisexual and other men who have sex with men (gbMSM) have had the largest proportion of estimated new HIV infections (2018), representing just under half of all new HIV infections;Footnote 4 this was similarly observed in HIV diagnoses, as reported in 2019.Footnote 5
In 2018, the Public Health Agency of Canada (PHAC) published Reducing the health impact of sexually transmitted and blood-borne infections in Canada by 2030: A pan-Canadian STBBI framework for actionFootnote 6. This framework and the associated Government of Canada five-year action plan on sexually transmitted and blood-borne infectionsFootnote 7 demonstrate a commitment to reducing the burden of sexually transmitted and blood-borne infections (STBBI) in Canada, including HIV, by 2030, using four core pillars of action: prevention, testing, initiation of care and treatment, and ongoing care and support. The framework also emphasizes the importance of monitoring trends in newly diagnosed infections to inform and evaluate prevention and care programs. In addition, the framework delineates the importance of a common approach to addressing key populations disproportionately affected by HIV. Understanding the trends in HIV diagnoses contributes to ensuring Canada's progress in meeting the goals of the STBBI framework.
This report focuses on describing the epidemiology of first-time HIV diagnoses in Canada, with the aim of improving surveillance methodology. Variations in reporting practices among provincial and territorial public health authorities over time, such as the inclusion of HIV cases with previous evidence of HIV infection (i.e., moving into a new province or territory or from outside of Canada) have been described previously.Footnote 8 This reporting variation creates a challenge in providing an accurate interpretation of trends in national HIV surveillance. While previously diagnosed cases contribute to our understanding of prevalence and inform health care needs, understanding the trends in domestic transmission offers direction on where to focus prevention activities. This reporting modification (to first-time HIV diagnoses in Canada) also assists in ensuring the alignment of national surveillance with recent changes in reporting practices by provincial and territorial public health authorities and supports continuous improvement in surveillance practices.Footnote 9
The nature of the collection of public health surveillance data means that it is continuously reviewed and updated at all jurisdictional levels (local, provincial or territorial and national). As such, this report replaces all previously published national surveillance reports as it reflects the most recent surveillance data compiled for HIV and AIDS (with case data included up to December 31, 2020). It should also be noted that additional challenges in the collection of surveillance data in 2020, due to public health efforts focused on the SARS-CoV-2 (COVID-19) pandemic, may have affected local public health surveillance practices including data collection. Future data updates and reviews will improve the quality of the data over time.
The objectives of this surveillance report are to describe the epidemiology of first-time HIV diagnoses reported in Canada in 2020, by geographic region, age at diagnosis, sex, race/ethnicity and exposure category; as well as describe trends between 2011 and 2020. In addition, updated information on Immigration Medical Screening results for HIV, the number of infants perinatally exposed and infected with HIV are presented, as well as the number of AIDS diagnoses and HIV mortality.
This report presents HIV and AIDS surveillance data in two parts:
- The first part focuses on first-time HIV diagnoses reported in Canada in 2020, and when possible, by geographic region, age at diagnosis, sex, race/ethnicity and exposure category. In addition, selected trend analyses from 2011 to 2020 are presented.
- The second part presents data from the Canadian Perinatal HIV Surveillance Program (2013 to 2020), Immigration Medical Screening for HIV (2011 to 2020), AIDS case surveillance (2011 to 2020), and HIV mortality (2011 to 2019).
Methods
Data sources
This report presents data from four different sources on HIV and AIDS:
- The national HIV/AIDS Surveillance System (HASS), maintained by the Public Health Agency of Canada (PHAC);
- The Canadian Perinatal HIV Surveillance Program (CPHSP), maintained by the Canadian Pediatric and Perinatal HIV and AIDS Research Group;
- Immigration Medical Screening, maintained by Immigration, Refugees and Citizenship Canada (IRCC);
- The Canadian Vital Statistics Death Database (CVSD), maintained by Statistics Canada.
National HIV/AIDS Surveillance System (HASS)
The National HIV/AIDS Surveillance System (HASS) is a passive, case-based surveillance system that collects non-nominal data (data with identifying information removed to ensure anonymity) on people diagnosed with HIV infection who meet the national case definition.Footnote 10 Data in each province and territory are obtained through provincial/territorial HIV surveillance systems, which may include both public health and laboratory reporting. Each province and territory provides data to PHAC either through the National Case Report FormFootnote 11 or a secure electronic dataset transmission. All raw data (paper forms and electronic datasets) are retained in compliance with the Directive for the Collection, Use and Dissemination of Information relating to Public Health (PHAC, 2013, unpublished document).
PHAC receives information on data elements including, but not limited to, age, sex, race/ethnicity and risks associated with the transmission of HIV (exposure categories) that are voluntarily shared by provincial and territorial (PT) public health authorities. The following provinces and territories resubmitted updated historical data this year: British Columbia (since 2018), Nova Scotia (since 2018), Prince Edward Island (since 1986), Ontario (since 1985) and New Brunswick (since 1984).
In recent years, some jurisdictions have been refining their annual data submissions to include only cases identified as a first-time HIV diagnosis within that jurisdiction. PHAC requested that for 2020, provincial and territorial public health authorities provide a variable indicating whether a case was diagnosed for the first time in that jurisdiction, previously diagnosed in another Canadian jurisdiction (also known as out of province, OOP), or previously diagnosed outside of Canada (also known as out of country, OOC). While some jurisdictions routinely exclude 'duplicate' cases, i.e., those previously diagnosed in another province or territory, from their annual data submission to PHAC, sometimes this is not always possible. Further details about 2020 data submissions from PT public health authorities are found in Appendix 2.
The data in this surveillance report represent newly reported HIV cases diagnosed on or before December 31, 2020. Data was submitted to PHAC by provincial and territorial surveillance programs up to August 17, 2021 and validated as of September 3, 2021. Observed differences in the data published in this report and the data published in provincial and territorial surveillance reports (such as variation in reporting of first time diagnoses) may be due to reporting delays, differences in the date data were extracted from the provincial and territorial surveillance databases or other reporting variations. Where such differences are noted, it is recommended that data and results from provincial and territorial reports be used.
Canadian Perinatal HIV Surveillance Program (CPHSP)
The Canadian Perinatal HIV Surveillance Program (CPHSP) is an initiative of the Canadian Pediatric AIDS Research Group, which collects data nationally on the HIV status of infants born to mothers living with HIV infection. Support for the CPHSP is provided by PHAC and the Canadian Institutes of Health Research-Canadian HIV Trials Network. The CPHSP is a sentinel-based, active surveillance system that collects data on two groups of children: infants born to women living with HIV and children living with HIV receiving care at any participating site (whether born in Canada or abroad).Footnote 12 Data on mother-infant pairs were obtained through a national, non-nominal, confidential survey on infants known to participating pediatricians in 22 pediatric and adult HIV centres or public health units from all Canadian provinces and territories. These sites represent approximately 95% of the HIV exposed infants born in Canada.
Data on mother-infant pairs were captured and initial data were entered by participating sites upon obstetric or pediatric referral for care. Initial data include: maternal country of birth, self-reported race/ethnicity, maternal risk category for acquiring HIV, antiretroviral regimen and duration of therapy administered, mode of delivery, gestational age and birth weight. The HIV status of the infant is reported with confirmation by virologic testing for HIV using polymerase chain reaction (confirmed on at least two separate samples) and/or by HIV serology beyond 18 months of age. The HIV status of infants is reported as "confirmed infected", "confirmed not infected", or "infection status not confirmed", and is updated annually.
Surveillance data for 2020, including data updates for previous years, were submitted to PHAC in March 2021. While data collection continued in 2020, reporting activities were partially curtailed due to the COVID-19 pandemic.
Immigration medical screening
Immigration, Refugees and Citizenship Canada (IRCC) maintains the Global Case Management System, which contains the Immigration Medical Exam (IME) information for all applicants screened in Canada or overseas who tested positive for HIV during the immigration medical screening process. All foreign nationals applying for permanent residence and some applying for temporary residence in Canada must undergo an IME administered by third-party panel physicians on behalf of IRCC, either in Canada or overseas. In 2002, IRCC added mandatory routine HIV screening to the IME for all applicants 15 years of age and older, as well as for applicants under the age of 15 years who have certain risk factors.Footnote 13 Data on individuals tested in Canada were obtained from IMEs conducted in 2020. Also provided are data concerning individuals who tested positive for HIV during their IME outside of Canada and who arrived in Canada in 2020. Aggregate data were provided to PHAC in July 2021.
IRCC provides PHAC with non-nominal data collected during the IME on migrants who tested positive for HIV. Data includes demographic information (which includes country of birth, sex, age group, and the province or territory where the IME was conducted), as well as the year tested (for those tested in Canada) or the year the applicant landed in Canada (for those tested outside of Canada). The term "migrant" is used broadly and includes the following: immigrants (permanent residents in the economic and family classes); refugees (resettled refugees, protected persons and asylum claimants); and temporary residents (visitors, international students, temporary foreign workers and temporary resident permit holders).
IRCC routinely shares nominal data from overseas and in-Canada IME test results with participating provinces and territories for all clients who have been diagnosed with HIV and have a valid Canadian residential address on file that indicates their current province/territory of residence. This is done to support the continuity of care for clients living with HIV. Historically, these data were incorporated into the provincial/territorial routine HIV case-based surveillance systems to varying degrees, with some jurisdictions reporting these HIV-positive migrant cases as new diagnoses and others excluding them from provincial/territorial reporting on HIV cases to PHAC. Improved efforts were made to differentiate these cases in the 2020 data submission.
Canadian Vital Statistics Death Database (CVSD)
Under federal/provincial/territorial agreement, all deaths, regardless of cause, must be registered with the provincial and territorial registrars of the offices of vital statistics.Footnote 14 The central registry in each province and territory provides data from death registration forms to the Health Statistics Division of Statistics Canada, which maintains the Canadian Vital Statistics Death Database (CVSD), a cumulative record of death statistics. Information on cause of death is coded using the International Classification of Diseases (ICD). The 9th revision of the ICD (ICD-9) was used for deaths that occurred between 1979 and 1999; codes 042 to 044 included deaths attributed to HIV infection. The 10th revision (ICD-10) is used for deaths that occurred from 2000 onward; codes B20 to 24 include deaths attributed to HIV infection. Deaths are not comparable between the two coding systems because of changes in coding definitions.
Publicly available data on year of death, cause of death, sex and age were obtained from "Deaths and age-specific mortality rates, by selected grouped causes"Footnote 15 extracted from the CVSD on October 1, 2021.
Data analysis
To develop a national dataset, standardized data verification and recoding procedures were applied to all submitted provincial and territorial datasets. As part of this process, each province and territory is provided their specific validation tables for review. Upon resolution of any discrepancies (if applicable) and final agreement from the provinces/territories, national datasets were prepared.
Data are presented as case counts and rates (per 100,000 population) in total and stratified by geographic region, age group, and sex. Rates were calculated using population data extracted from the Annual Demographic Statistics dataset from Statistics Canada, Demography Division, on July 1, 2020.
In this report, no statistical procedures were used for comparative analyses or to account for missing data. For data with small cell sizes (n ≤ 5), strategies such as data suppression or collapsing data categories were used if deemed necessary by provincial and territorial providers.
Data used for analyses include cases of first-time HIV diagnoses reported in Canada from 2011 until the end of 2020. In order to develop a national dataset for first-time diagnosed HIV cases, the following definitions were used:
- First-time diagnosis: HIV diagnosed and reported for the first time ever for the individual in the given reporting year and with no evidence of previous diagnosis, neither in another country nor in another Canadian jurisdiction.
- Previous diagnosis: individuals who had evidence of a known previous HIV diagnosis in another country or in another Canadian province or territory, as reported by an indicator in individual case records.
Finalizing the first-time HIV diagnoses dataset
Twelve of the thirteen jurisdictions provided an indicator of out of country (OOC) or out of province (OOP) cases within a dataset or provided only first-time diagnosed case data in their 2020 data submission. One province was unable to provide an indicator about previously diagnosed cases within the dataset, thus all diagnoses were considered 'first-time' for that province and included in the national dataset. The total count of first-time HIV diagnoses for the surveillance period, January 1 to December 31, 2020 was produced by including first-time diagnosed cases (for two provinces); including all reported cases for the remaining provinces and territories; and then excluding cases with previously diagnosed HIV, based on the OOC and OOP indicator (available for ten provinces and territories). In 2020, there were 1,726 total reported HIV cases, of which 71 were classified as OOC and 16 were classified as OOP. With the OOC and OOP cases removed, there were a total of n=1,639 cases classified as first-time HIV diagnoses and used for further analyses in this report (Figure 1).
PT public health authorities were asked to provide an OOC and OOP indicator for previous years as well; however, only eight jurisdictions were able to provide this information for 2019 and fewer jurisdictions were able to provide historical updates for previous years that included this indicator. Figure A1 (Appendix 2) provides an overview of jurisdictions that provided OOC and OOP indicators for historical data by year of report. To develop a first-time diagnoses dataset for 2011 to 2019, all known OOC and OOP cases were excluded. This resulted in a total of 20,075 first-time diagnoses for the 2011 to 2019 trend analyses. Since not all jurisdictions provided the OOC/OOP flag for previous years, trend analyses should be interpreted with caution. As PT public health authorities update historic data in future data submissions, there will be further refinement of first-time diagnosis measures in future reports.
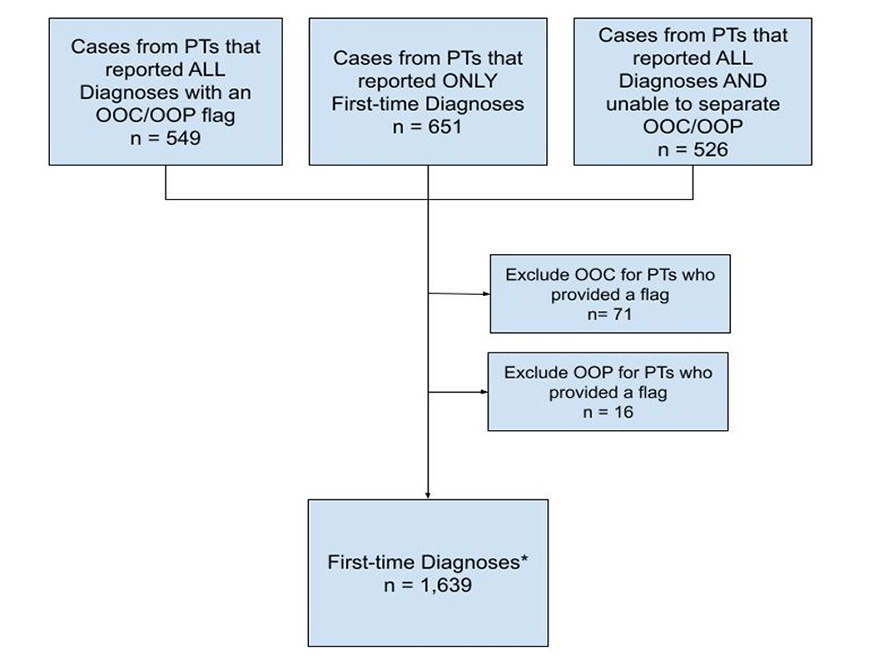
Figure 1: Text description
This flowchart breaks down HIV case data submitted by provinces and territories (PTs) for cases diagnosed in 2020. It details how data was handled to create the final national dataset that includes only first time diagnoses.
Three data types were combined: 1) cases from PTs that reported all diagnoses with an out of country or out of province flag (OOC/OOP), with an n value of 549; 2) cases from PTs that reported only first-time diagnoses, with an n value of 651; and 3) cases from PTs that reported all diagnoses and that were unable to separate OOC/OOP, with an n value of 526.
Previously diagnosed cases were excluded from the final dataset. This included 71 OOC cases from PTs that provided a flag as well as 16 OOP cases from PTs who provided a flag.
The final national dataset consisted of only first-time diagnosesFigure 1 *, with a final n value of 1,639.
Abbreviations: PT = Province or Territory; OOC = Out of Country; OOP = Out of Province; n = count
Surveillance data at a glance
First-time HIV diagnoses
Overall Trends
In 2020, there were 1,639 cases of first-time HIV diagnoses reported in Canada. This is a decrease of 21% compared to the number of cases reported in 2019 (2,071 cases were reported). The national HIV diagnosis rate was 4.3 per 100,000 population (6.2 per 100,000 population in males and 2.4 per 100,000 population in females). Between 2011 and 2019, the national diagnosis rate fluctuated within a narrow range (between 5.3 and 6.2 per 100,000). From 2019 to 2020, the HIV diagnosis rates decreased sharply overall, as well as in males and females. In the five-year period before the COVID-19 pandemic, the HIV diagnosis rate in males decreased overall from 8.3 per 100,000 population in 2015 to 7.8 per 100,000 population in 2019. In comparison, the HIV diagnosis rate in females increased from 2015 to 2019, with a rate of 2.6 per 100,000 population in 2015 to 3.3 per 100,000 population in 2019 (Figure 2, Data Table 1).
Note that data tables for figures are found at the end of this report (Data Tables, 1-10).
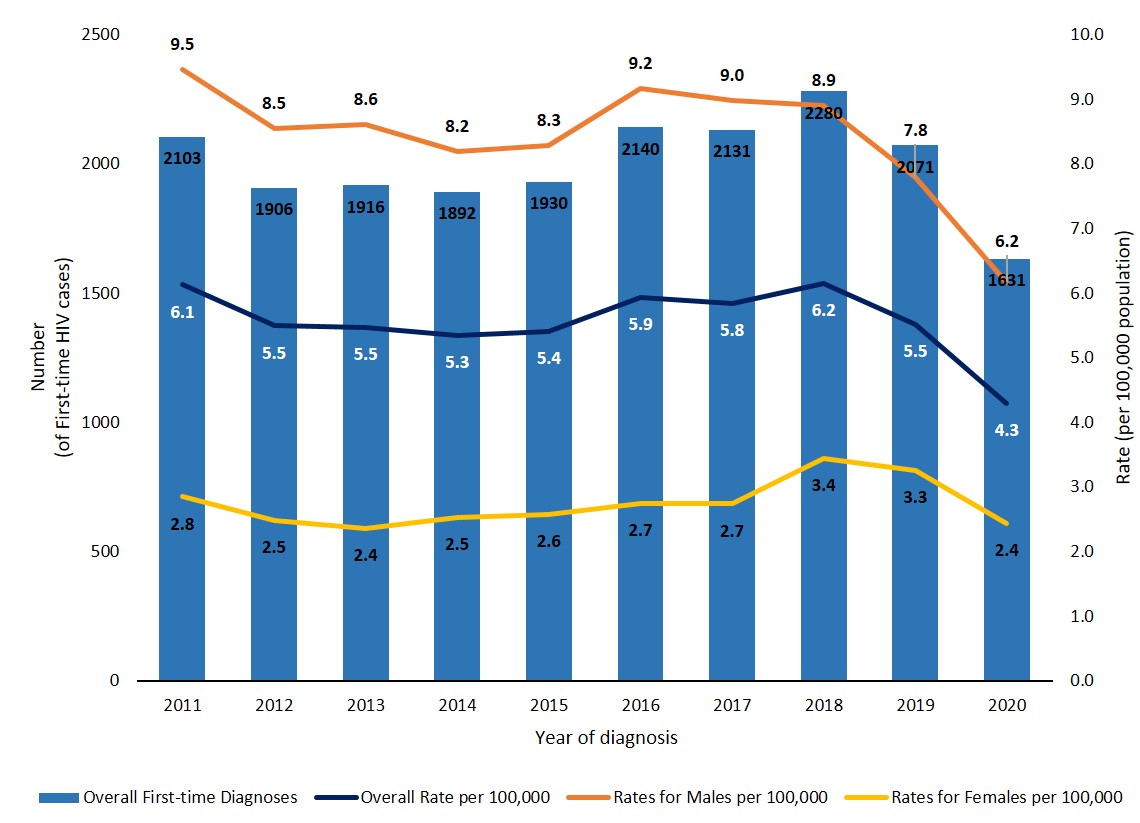
Figure 2: Text description
| Year of diagnosis | Overall first-time diagnosesFigure 2 b | Overall rate per 100,000 | Males rate per 100,000 | Females rate per 100,000 |
|---|---|---|---|---|
| 2011 | 2,103 | 6.1 | 9.5 | 2.8 |
| 2012 | 1,906 | 5.5 | 8.5 | 2.5 |
| 2013 | 1,916 | 5.5 | 8.6 | 2.4 |
| 2014 | 1,892 | 5.3 | 8.2 | 2.5 |
| 2015 | 1,930 | 5.4 | 8.3 | 2.6 |
| 2016 | 2,140 | 5.9 | 9.2 | 2.7 |
| 2017 | 2,131 | 5.8 | 9.0 | 2.7 |
| 2018 | 2,280 | 6.2 | 8.9 | 3.4 |
| 2019 | 2,071 | 5.5 | 7.8 | 3.3 |
| 2020 | 1,631 | 4.3 | 6.2 | 2.4 |
Geographic distribution
The first-time HIV diagnosis rates across Canada are shown in Figure 3. Rates for the Territories region (Northwest Territories, Nunavut and Yukon) and Atlantic region (New Brunswick, Newfoundland and Labrador, Nova Scotia and Prince Edward Island) are presented as regional averages. Saskatchewan continues to have the highest rate, however nearly all provinces and regions showed a decrease in rates in 2020 compared to that of 2019 (Figure 3, Data Table 2).
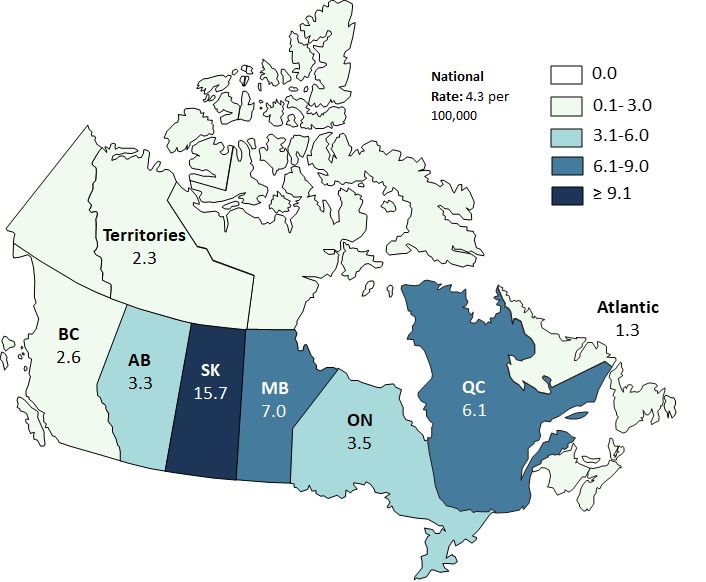
Figure 3: Text description
| Province | HIV diagnosis rate (per 100,000 population) |
|---|---|
| Alberta | 3.3 |
| Atlantic Region | 1.3 |
| British Columbia | 2.6 |
| Manitoba | 7.0 |
| Ontario | 3.5 |
| Quebec | 6.1 |
| Saskatchewan | 15.7 |
| Territories | 2.3 |
Abbreviations: BC, British Columbia; AB, Alberta; SK, Saskatchewan; MB, Manitoba; ON, Ontario; QC, Quebec; ≥, greater than or equal
Age group and sex distribution
In 2020, males accounted for 71.4% of all HIV diagnoses (n = 1,164), while females accounted for 28.6% (n = 467). First-time HIV diagnosis rates were also stratified based on age group and sex. The highest observed HIV diagnosis rate was in the male 30 to 39 year age group, with a rate of 14.0 per 100,000 population. Similarly, the 30 to 39 year age group had the highest diagnosis rate among female cases at 5.4 per 100,000 population. In all age groups, HIV diagnosis rates were observed to be at least two times greater in males than in females, with the exception of the 15 to 19 year age group, in which females had a higher HIV diagnosis rate (Figure 4, Data Table 3).
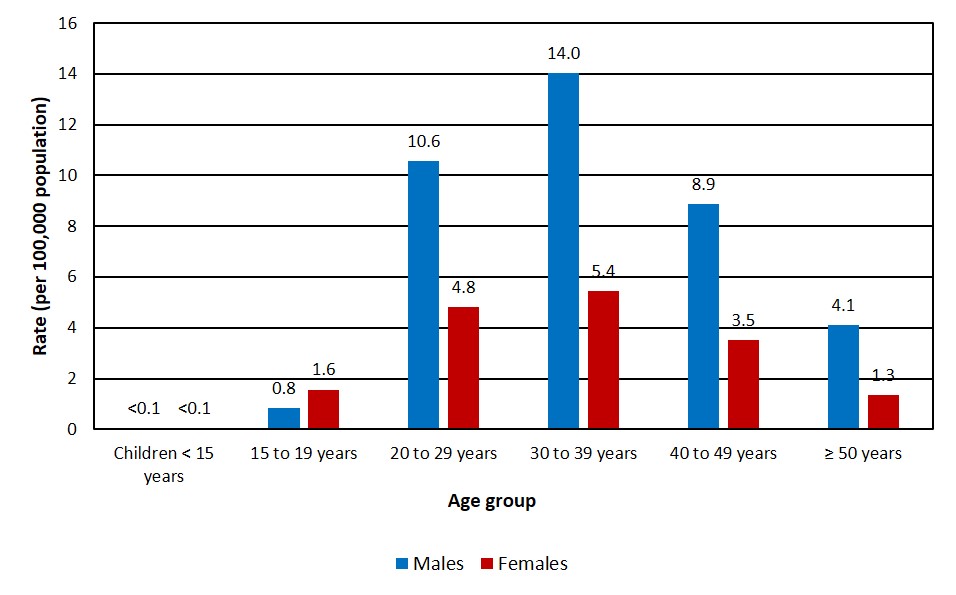
Figure 4: Text description
| Age groups | Rate per 100,000 population | |
|---|---|---|
| Males | Females | |
| Children < 15 years | <0.1 | <0.1 |
| 15 to 19 years | 0.8 | 1.6 |
| 20 to 29 years | 10.6 | 4.8 |
| 30 to 39 years | 14.0 | 5.4 |
| 40 to 49 years | 8.9 | 3.5 |
| ≥ 50 years | 4.1 | 1.3 |
Abbreviations: ≤ less than; ≥, greater than or equal
In recent years, HIV diagnosis rates have decreased in all age groups overall. As in previous years, in 2020 the highest diagnosis rate was observed in the 30 to 39 years old age group, with a rate of 9.8 per 100,000 population. The majority of HIV cases diagnosed in 2020 were between the ages of 20 and 49 years, which reflects trends observed in the previous ten years. The HIV diagnosis rate was 7.8 and 6.2 per 100,000 population in age groups 20 to 29 and 40 to 49, respectively. The lowest HIV diagnosis rate in adults was observed among those aged 15 to 19 years of age, with a diagnosis rate of 1.2 per 100,000 population (Figure 5, Data Table 4).
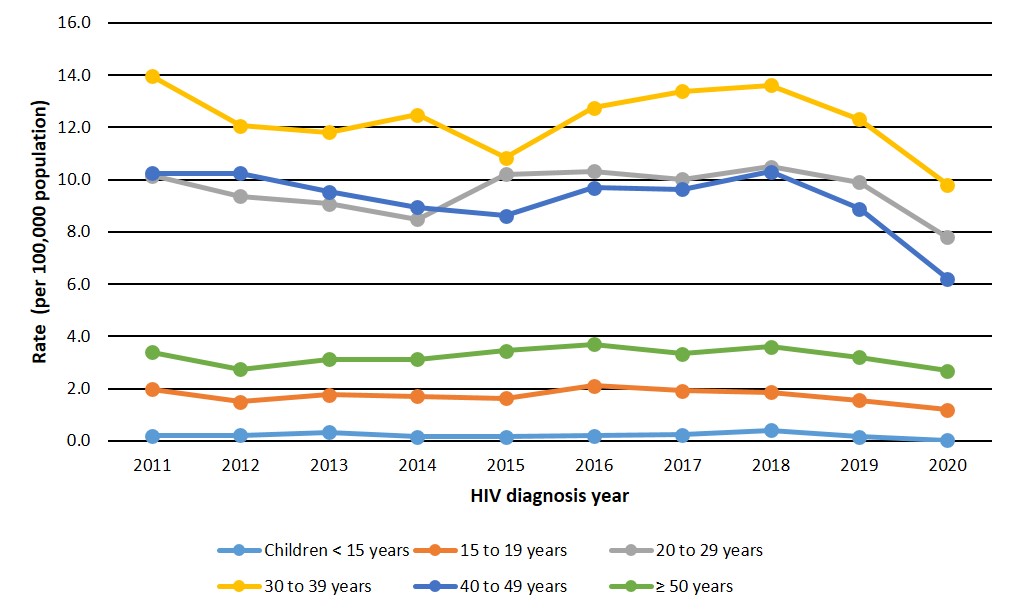
Figure 5: Text description
| Age group | Rate per 100,00 population by year of diagnosis | |||||||||
|---|---|---|---|---|---|---|---|---|---|---|
| 2011 | 2012 | 2013 | 2014 | 2015 | 2016 | 2017 | 2018 | 2019 | 2020 | |
| Children < 15 years | 0.2 | 0.2 | 0.3 | 0.2 | 0.2 | 0.2 | 0.2 | 0.4 | 0.2 | <0.1 |
| 15 to 19 years | 2.0 | 1.5 | 1.8 | 1.7 | 1.6 | 2.1 | 1.9 | 1.9 | 1.6 | 1.2 |
| 20 to 29 years | 10.1 | 9.4 | 9.1 | 8.5 | 10.2 | 10.3 | 10.0 | 10.5 | 9.9 | 7.8 |
| 30 to 39 years | 14.0 | 12.1 | 11.8 | 12.5 | 10.8 | 12.8 | 13.4 | 13.6 | 12.3 | 9.8 |
| 40 to 49 years | 10.2 | 10.2 | 9.5 | 8.9 | 8.6 | 9.7 | 9.6 | 10.3 | 8.9 | 6.2 |
| ≥ 50 years | 3.4 | 2.7 | 3.1 | 3.1 | 3.4 | 3.7 | 3.3 | 3.6 | 3.2 | 2.7 |
Abbreviations: ≤ less than; ≥, greater than or equal
Exposure category distribution
As in previous years, the largest proportion of adult HIV diagnoses was attributed to male-to-male sexual contact (43.7%, n = 605); followed by heterosexual contact at 34.2% (n = 474) (Table 1). In 2020, the proportion of HIV diagnoses attributed to injection drug use (IDU) increased to 18.3% (n = 254) from 14.8% (n = 273) in 2019. As the number of cases attributed to IDU slightly decreased (from 2019 compared to 2020), the increase in the proportion may be partially explained by concurrent decreases in the 'Other' exposure category. In 2019, the proportion of 'Other' exposure category was 5.1% (n = 94 cases); while in 2020, it accounted for 1.6% (n = 22 cases); (Data Table 5a). It should be noted that in past years, the 'Other' category included cases with exposures outside of Canada, which as noted previously, were removed from the dataset.
In males (≥ 15 years of age), in 2020, the majority of cases were attributed to male-to-male sexual contact (60.8%, n = 605), followed by heterosexual contact (21.8%, n = 217) and IDU (12.8%, n = 127). Among females (≥ 15 years of age), exposure through heterosexual contact accounted for the highest proportion at 65.7% (n = 255), followed by IDU (32.7%, n = 127) (Table 1).
| Exposure category | Male | Female | TotalTable 1 footnote a | |||
|---|---|---|---|---|---|---|
| n | %Table 1 footnote b | n | %Table 1 footnote b | n | %Table 1 footnote b | |
| Male-to-male sexual contact | 605 | 60.8 | n/a | n/a | 605 | 43.7 |
| Male-to-male sexual contact and IDU | 30 | 3.0 | n/a | n/a | 30 | 2.2 |
| IDU | 127 | 12.8 | 127 | 32.7 | 254 | 18.3 |
| Heterosexual contactTable 1 footnote c | 217 | 21.8 | 255 | 65.7 | 474 | 34.2 |
| OtherTable 1 footnote d | 16 | 1.6 | 6 | 1.5 | 22 | 1.6 |
| Subtotal | 995 | 86.1 | 388 | 84.0 | 1,385 | 85.2 |
| No identified riskTable 1 footnote e | 26 | 2.2 | 22 | 4.8 | 49 | 3.0 |
| Exposure category unknown or not reported ("missing") | 135 | 11.7 | 52 | 11.3 | 192 | 11.8 |
| Total | 1,156 | n/a | 462 | n/a | 1,626Table 1 footnote f | n/a |
Abbreviations: n, number; n/a, not applicable; IDU, injection drug use Refer to Appendix 3 for details regarding exposure categories. |
||||||
The distributions for exposure categories in males and females for the last ten years are shown in Figure 6a and 6b. In males, the distribution of diagnoses within the different exposure categories fluctuated slightly since 2011 but remained relatively stable overall (Figure 6a, Data Table 5b). For females, in the last ten years, the proportion of cases attributed to the IDU exposure category remained stable between 2011 and 2018, followed by increases in 2019 and 2020 (26.0% in 2019 to 32.7% in 2020) (Figure 6b, Data Table 5c). However, the actual number of cases attributed to IDU slightly decreased from n = 139 (2019) to n = 127 (2020). The increase in the proportion may be partially explained by concurrent decreases in the 'Other' exposure category. For females in 2019, the proportion of cases in the 'Other' exposure category was 9.6% (n = 51 cases); while in 2020, it accounted for 1.5% (n = 6 cases). It is possible that removal of OOC cases from the 'Other' category and the overall reduction in number of first-time diagnoses have had an effect on the proportion of IDU among female cases.
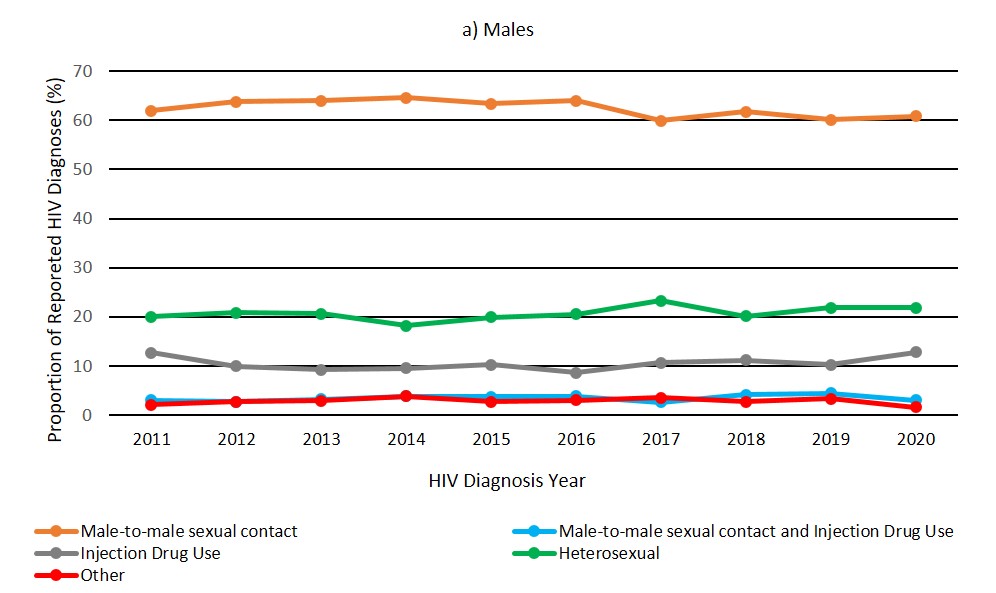
Figure 6a: Text description
| Exposure category | Percentage distribution of HIV cases among males (≥ 15 years old) by year | |||||||||
|---|---|---|---|---|---|---|---|---|---|---|
| 2011 | 2012 | 2013 | 2014 | 2015 | 2016 | 2017 | 2018 | 2019 | 2020 | |
| Male-to-male sexual contact | 62.0 | 63.8 | 64.0 | 64.5 | 63.3 | 64.0 | 59.9 | 61.7 | 60.1 | 60.8 |
| Male-to-male sexual contact and injection drug use | 3.1 | 2.7 | 3.2 | 3.8 | 3.7 | 3.8 | 2.6 | 4.2 | 4.5 | 3.0 |
| Injection drug use | 12.7 | 10.0 | 9.2 | 9.6 | 10.3 | 8.6 | 10.7 | 11.2 | 10.3 | 12.8 |
| Heterosexual contact | 20.1 | 20.8 | 20.7 | 18.2 | 19.9 | 20.5 | 23.3 | 20.1 | 21.8 | 21.8 |
| Other | 2.1 | 2.8 | 2.9 | 3.9 | 2.7 | 3.0 | 3.6 | 2.7 | 3.3 | 1.6 |
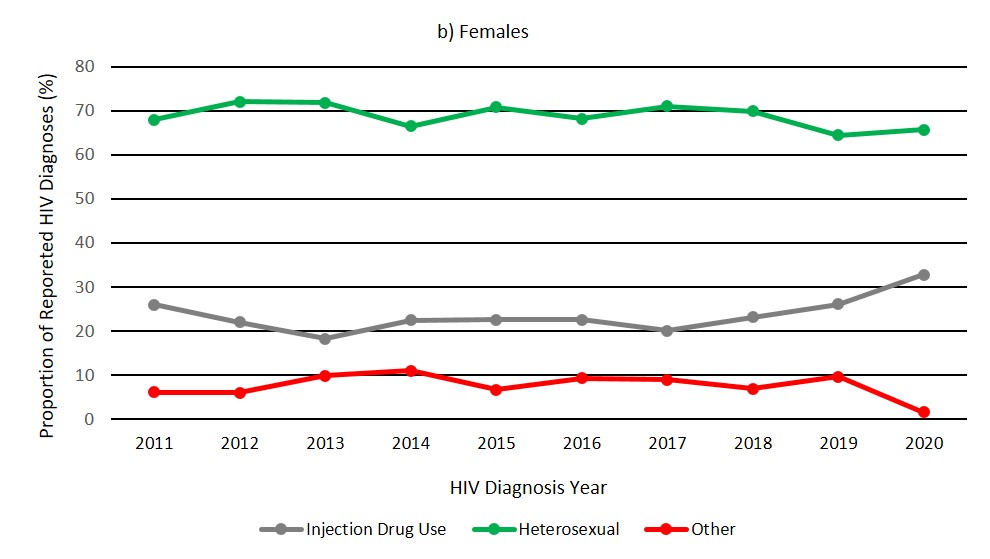
Figure 6b: Text description
| Exposure category | Percentage distribution of HIV cases among females (≥ 15 years old) by year | |||||||||
|---|---|---|---|---|---|---|---|---|---|---|
| 2011 | 2012 | 2013 | 2014 | 2015 | 2016 | 2017 | 2018 | 2019 | 2020 | |
| Injection drug use | 25.9 | 22.0 | 18.3 | 22.5 | 22.6 | 22.5 | 20.0 | 23.2 | 26.0 | 32.7 |
| Heterosexual contact | 68.0 | 72.1 | 71.9 | 66.5 | 70.8 | 68.2 | 71.1 | 69.9 | 64.4 | 65.7 |
| Other | 6.1 | 6.0 | 9.8 | 11.0 | 6.6 | 9.3 | 8.9 | 6.9 | 9.6 | 1.5 |
Exposure category and age group
Among all age groups 20 years and older, male-to-male sexual contact was the largest exposure category reported, ranging from 40.8% to 49.6% of cases. In contrast, heterosexual contact accounted for 45% of reported exposures in the 15 to 19 year age group. Those 50 years and older had nearly equal proportions of male-to-male sexual contact (42.8%, n = 158) and heterosexual contact (42.3%, n = 156) exposure categories (Figure 7, Data Table 6).
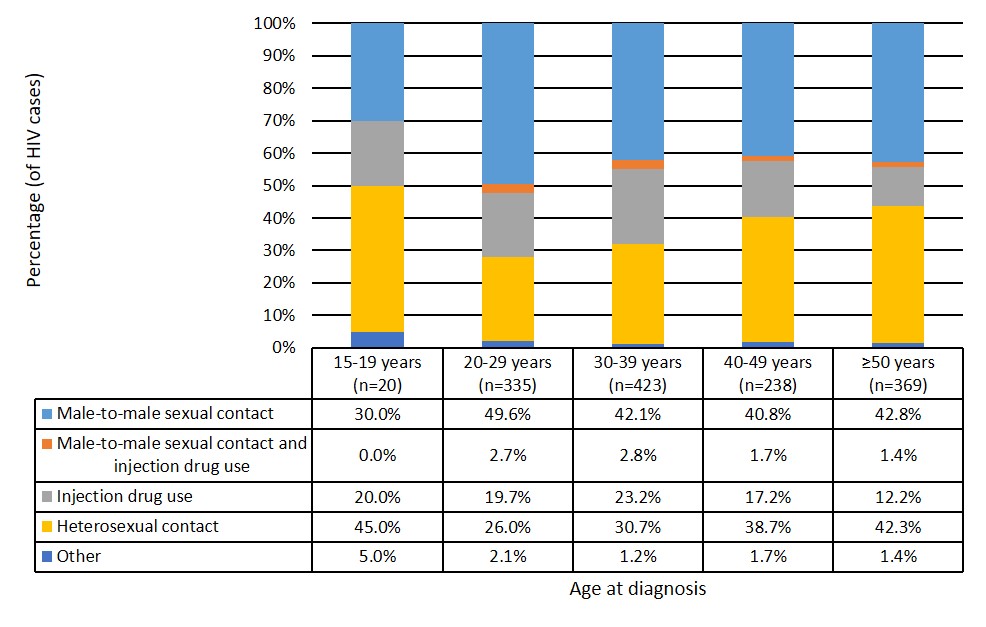
Figure 7: Text description
| Exposure category | Age group | ||||
|---|---|---|---|---|---|
| 15-19 years (n=20) | 20-29 years (n=335) | 30-39 years (n=423) | 40-49 years (n=238) | ≥50 years (n=369) | |
| Male-to-male sexual contact | 30.0% | 49.6% | 42.1% | 40.8% | 42.8% |
| Male-to-male sexual contact and injection drug use | 0.0% | 2.7% | 2.8% | 1.7% | 1.4% |
| Injection drug use | 20.0% | 19.7% | 23.2% | 17.2% | 12.2% |
| Heterosexual contact | 45.0% | 26.0% | 30.7% | 38.7% | 42.3% |
| Other | 5.0% | 2.1% | 1.2% | 1.7% | 1.4% |
Abbreviations: ≤ less than; ≥, greater than or equal
Race/ethnicity distribution
In 2020, race/ethnicity information was submitted by all provinces and territories except for British Columbia and Quebec; however, race/ethnicity was only available for 36.1% of cases (n = 592 cases). There has been a decreasing trend in available race/ethnicity information for reported cases since the last full surveillance report in 2014 (49.6%). Therefore, results should be interpreted or used with extreme caution given the large amount of missing data (63.9%) and is likely not fully representative of the national picture of race/ethnicity data for HIV cases. Refer to Appendix 2 for details on race/ethnicity categories reported.
Of all cases (n = 1,639), 10.8% were reported as Indigenous (First Nations, Métis, Inuit, or Indigenous-not otherwise specified), 10.6% as White, and 6.0% as Black. The distribution of cases across race/ethnicity categories varied based on sex. Among males, the highest proportion of cases was reported among White males (12.5%), followed by Indigenous males (7.4%). Comparatively, in females, the highest proportion of cases was reported among Indigenous females (19.5%), followed by Black females (6.6%) (Table 2).
| Race/ethnicity | Male | Female | TotalTable 2 footnote a | |||
|---|---|---|---|---|---|---|
| n | % | n | % | n | % | |
| Indigenous | 86 | 7.4 | 91 | 19.5 | 177 | 10.8 |
| a) First Nations | 41 | 3.5 | 43 | 9.2 | 84 | 5.1 |
| b) Métis | 5 | 0.4 | 2 | 0.4 | 7 | 0.4 |
| c) Inuit | 0 | 0.0 | 0 | 0.0 | 0 | 0.0 |
| d) Indigenous, not otherwise specified | 40 | 3.4 | 46 | 9.9 | 86 | 5.2 |
| South Asian/West Asian/Arab | 28 | 2.4 | 3 | 0.6 | 31 | 1.9 |
| Asian | 40 | 3.4 | 1 | 0.2 | 42 | 2.6 |
| Black | 68 | 5.8 | 31 | 6.6 | 99 | 6.0 |
| Latin American | 45 | 3.9 | 1 | 0.2 | 46 | 2.8 |
| White | 146 | 12.5 | 28 | 6.0 | 174 | 10.6 |
| Other | 20 | 1.7 | 3 | 0.6 | 23 | 1.4 |
| Subtotal | 433 | 37.2 | 158 | 33.8 | 592 | 36.1 |
| Not reported | 731 | 62.8 | 309 | 66.2 | 1,047 | 63.9 |
| Total | 1,164 | n/a | 467 | n/a | 1,639 | n/a |
Abbreviations: n, number; n/a, not applicable Refer to Appendix 2 for details on race/ethnicity categories reported. |
||||||
Additional surveillance data
Canadian Perinatal HIV Surveillance Program (CPHSP)
In 2020, 250 infants were perinatally exposed to HIV and there were five new perinatal HIV infections in children born in Canada with an infection rate of 2% among pregnancies in women living with HIV. Of these five infants, two infants were born to mothers who received some antepartum or intrapartum ART, two infants were born to mothers who did not receive any ART, and one infant was born to a mother whose ART status was not known.
Since 2013, there has been an average of 254 perinatal exposures per year (range: 218 to 279) with an average of 5.6 infections per year (range: 1 to 13). While the number of perinatal exposures fluctuated yearly, there was an overall increase from 218 exposures in 2013 to 250 in 2020 (Figure 8). The proportion of women living with HIV who received ART during pregnancy in 2020 was 97.2%, which is slightly higher than the average between 2013 and 2019 (95.7%; range: 93.2% to 98%) (Figure 8). Additional results from the CPHSP can be found in Data Table 7.
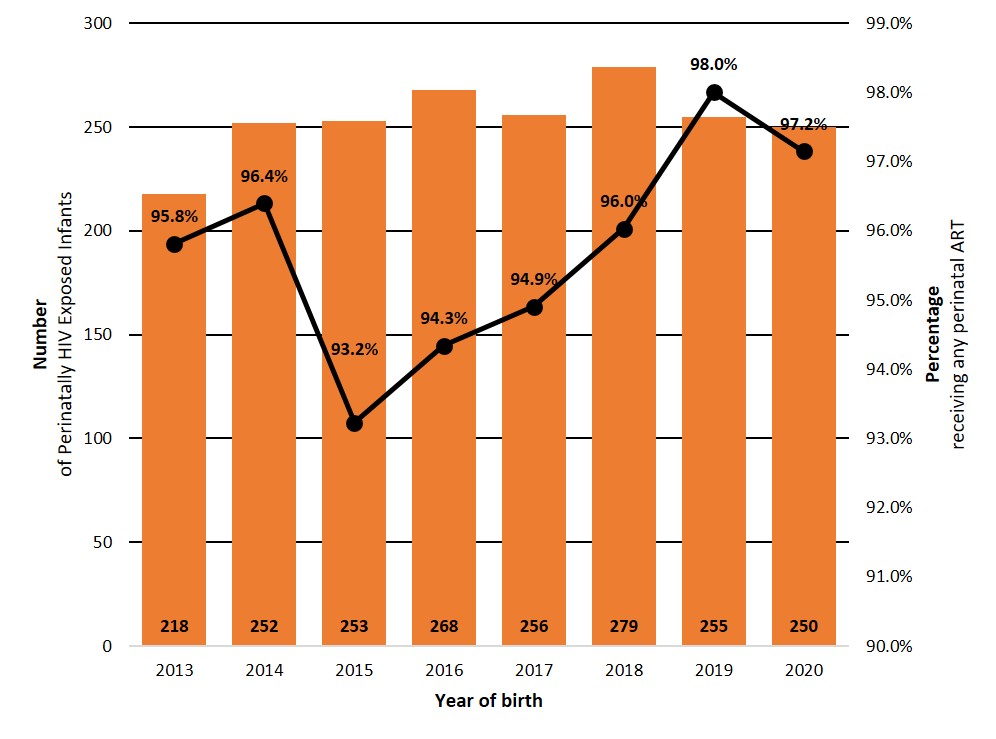
Figure 8: Text description
| Year | Number of perinatally exposed infants | Percentage receiving any perinatal ART |
|---|---|---|
| 2013 | 218 | 95.8% |
| 2014 | 252 | 96.4% |
| 2015 | 253 | 93.2% |
| 2016 | 268 | 94.3% |
| 2017 | 256 | 94.9% |
| 2018 | 279 | 96.0% |
| 2019 | 255 | 98.0% |
| 2020 | 250 | 97.2% |
Source: CPHSP
HIV cases identified through immigration medical screening
In 2020, 743 migrants tested positive for HIV during an Immigration Medical Exam (IME) in Canada or abroad. This is much lower than the 1,188 migrants who tested positive for HIV during an IME in 2019, resulting in a 37.4% decrease. Out of all migrants who tested positive for HIV during the IME, the proportions of migrants who tested positive (in 2020) prior to arrival in Canada (46.3%) and after arriving in Canada (53.7%) remained similar compared to the previous year, as there were 47.3% who tested positive outside of Canada and 52.7% who tested positive in Canada in 2019 (Data Table 8).
There was a total of 4,258 individuals who tested positive through an IME conducted in Canada in the last 10 years with an average of 426 per year (range: 210 to 696) (Figure 9). Between 2012 and 2020, of the applicants who tested positive for HIV during an IME in Canada, males accounted for a higher proportion, at 58.7% (n = 2,373). Overall, for both sexes, migrants in the 30 to 39 years old age group accounted for the highest proportion of positive tests at 38.9% (n = 1,573). This is followed by the 40 to 49 years old age group at 26.3% (n = 1,063) and the 20 to 29 years old age group, 18.6% (n = 753) (Data Table 9).
Of the IMEs conducted in Canada between 2012 and 2020 where HIV was detected, 53.5% were completed in Ontario, followed by 25.9% conducted in Quebec, 9.2% in Alberta and 8.2% in British Columbia. Among HIV-positive applicants tested in Canada, 63.7% were from what historically would be considered an HIV-endemic country.Footnote 16 In 2020, IRCC public health notifications sent to the provinces or territories were most commonly sent to Ontario.
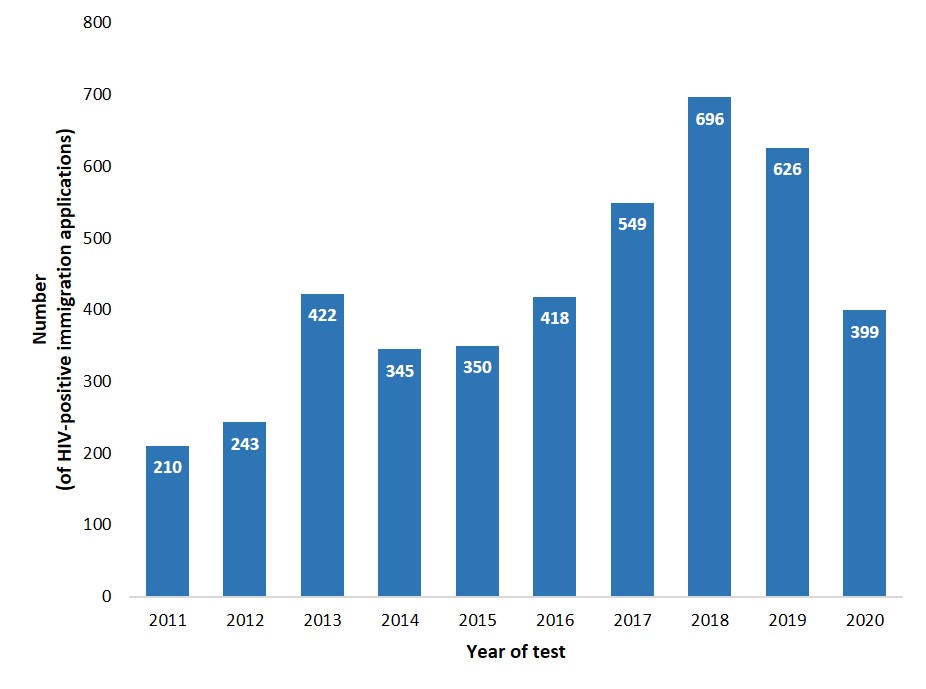
Figure 9: Text description
| Year | Number diagnosed with HIV |
|---|---|
| 2011 | 210 |
| 2012 | 243 |
| 2013 | 422 |
| 2014 | 345 |
| 2015 | 350 |
| 2016 | 418 |
| 2017 | 549 |
| 2018 | 696 |
| 2019 | 626 |
| 2020 | 399 |
Source: IRCC
AIDS cases
A total of 88 AIDS cases were reported in 2020, a decrease from 106 cases reported in the previous year (Table 3). Between 2011 and 2020, 1,960 AIDS cases were reported to PHAC. Over the years, AIDS reporting practices have changed and a noted decrease in AIDS reporting since 2011 may partially be due to reduced reporting by PT public health authorities. Refer to Figure A3 (Appendix 2) for information on the reporting of AIDS cases. The number of AIDS diagnoses decreased in both males and females between 2011 and 2019 in the provinces that consistently report AIDS data to PHAC (British Columbia, New Brunswick, Nova Scotia, Ontario and Saskatchewan). Additional AIDS data are available on the Notifiable Diseases website, Notifiable Diseases Online (canada.ca).
| Year of diagnosis | Males | Females | TotalTable 3 footnote a |
|---|---|---|---|
| 2011 | 226 | 52 | 291 |
| 2012 | 205 | 46 | 263 |
| 2013 | 184 | 63 | 263 |
| 2014 | 179 | 48 | 243 |
| 2015 | 162 | 49 | 212 |
| 2016 | 138 | 52 | 193 |
| 2017 | 119 | 38 | 158 |
| 2018 | 112 | 30 | 143 |
| 2019 | 83 | 23 | 106 |
| 2020 | 58 | 30 | 88 |
| Total | 1,466 | 431 | 1,960 |
HIV mortality
Based on Vital Statistics death data (Statistics Canada, SC), a total of 1,777 deaths were attributed to HIV in Canada between 2011 and 2019. The number of HIV-attributed deaths has decreased from 306 in 2011 to 103 in 2019 (the most recent year for which data are available). Among those aged 15 years and older, 75.9% (n = 1,348) of the HIV-attributed deaths were in males. While the number of HIV-attributed deaths decreased annually in both males and females, the proportion of HIV-attributable deaths in females compared to males decreased from 24.5% (n = 75) to 22.3% (n = 23) from 2011 to 2019 (Table 4 and Table 5).
| Age group | Males | Females | Total | ||
|---|---|---|---|---|---|
| n | % | n | % | n | |
| Under 15 years | 0 | 0.0 | 1 | 100.0 | 1 |
| 15 years and older | 1,348 | 75.9 | 428 | 24.1 | 1,776 |
| Total | 1,348 | 75.9 | 429 | 24.1 | 1,777 |
Source: SC Abbreviations: n, number |
|||||
| Year of death | Males | Females | Total |
|---|---|---|---|
| 2000-2010 | 3,772 | 849 | 4,621 |
| 2011 | 231 | 75 | 306 |
| 2012 | 206 | 70 | 276 |
| 2013 | 189 | 52 | 241 |
| 2014 | 149 | 56 | 205 |
| 2015 | 131 | 59 | 190 |
| 2016 | 134 | 40 | 174 |
| 2017 | 116 | 23 | 139 |
| 2018 | 112 | 30 | 142 |
| 2019 | 80 | 23 | 103 |
| Total | 5,120 | 1,277 | 6,397 |
| Source: SC | |||
Discussion
A total of 1,639 first-time HIV diagnoses were reported in 2020 in Canada and the national diagnosis rate was 4.3 per 100,000 population. Over the past decade, the national diagnosis rate has remained stable over time with some minor fluctuations. However, notable decreases were observed between 2018 and 2020. This decrease was consistent for males and females as these rates mirror the overall trend. In addition, HIV diagnosis rates have decreased in all age groups overall, notably between 2019 and 2020. These changes in the 2020 rates may be partially explained by the change in surveillance practices to focus on domestic transmission of HIV (first-time diagnoses). Additionally, this decrease may be due to reported decreased access to sexually transmitted and blood-borne infection (STBBI) related health services, such as testing, due to the COVID-19 pandemic.
First, since 2019, many provinces and territories have begun to enhance their surveillance practices to focus mainly on domestic transmission of HIV, therefore, reporting on first-time diagnosed HIV cases within their respective jurisdictions. The identification and exclusion of previously diagnosed cases has decreased the number of HIV cases attributed to most jurisdictions, which has led to a decrease in the total number of cases at the national level. However, not all jurisdictions were able to consistently provide information on previously diagnosed cases for the past ten years, and as a result, reported trends should be interpreted with caution. Over time, as surveillance practices continue to improve and the national dataset is further refined, the analyses of trends in first-time diagnoses over the past ten years will also reflect this more accurately.
Second, recent studies have shown decreased access to STBBI-related health services during the COVID-19 pandemic due to a variety of factors. A study of patients attending the British Columbia Centre for Disease Control STI clinics indicated that during the initial phases of the pandemic, of the 59% of respondents who required clinic services, 52% were not able to access services.Footnote 17 A survey of the impact of the COVID-19 pandemic on access to STBBI-related health services among STBBI service and care providers in Canada demonstrated that nearly 31% reported stopping HIV testing services at some point during the pandemic and 44% reported decreasing HIV testing services.Footnote 18
These barriers to accessing STBBI-related health services may have led to a decrease in the number of tests administered, as reported by provinces and territories. Manitoba and Saskatchewan both reported a decrease in the number of tests between 2019 and 2020.Footnote 19Footnote 20 Similarly, British Columbia reported a decrease in the number of HIV screening tests per 100,000 population, between 2019 and 2020.Footnote 21 A decrease in testing may reduce the number of cases identified and represented in national surveillance, however, this may not accurately reflect the true incidence of HIV. In conjunction with improved surveillance practices, these factors may explain the decrease in the national HIV diagnosis rates in 2020, though more time and data are needed to determine whether this is the beginning of a continuing trend.
When compared to international counterparts, Canada's national HIV diagnosis rate of 4.3 per 100,000 population is comparable to the United Kingdom (4.1 per 100,000 population)Footnote 22, but higher than that of Australia (2.5 per 100,000 population);Footnote 23 (Data Table 10). All three countries observed a decrease in the counts and rates of HIV diagnoses between 2019 and 2020, which may be attributed in part to the COVID-19 pandemic.Footnote 22Footnote 23 Rates from these countries also include only first-time HIV diagnoses. The UK also reported that fewer people accessed HIV care in 2020 and overall decreases in testing.Footnote 22
Canada welcomed 184,624 migrants in 2020, a decrease of almost half from 2019 and the lowest in any year since 1998.Footnote 24 This decrease is not unique to CanadaFootnote 24 and is similar to reports from the United KingdomFootnote 22 and Australia.Footnote 25 These trends reflect the decrease in international migration following border and travel restrictions implemented in March 2020 to mitigate the transmission of COVID-19. It is not surprising that in 2020, the number of HIV cases, identified by overseas IMEs that arrived in Canada decreased by just over one third compared to 2019 (36.3%; n=399 in 2020, n=626 in 2019) as overseas clients were prevented from travel to Canada due to border restrictions.
In 2020, exposure category information was included for all jurisdictions in Canada, which contributes to a more complete national picture of HIV exposure routes. For males, the male-to-male sexual contact exposure category continued to account for the highest proportion of HIV diagnoses (at 60.8%), followed by heterosexual contact and injection drug use (IDU). Past reports indicate awareness of HIV prevention measures among gbMSM and an increase in PrEP use in Canada since 2014.Footnote 26 This increased awareness and PrEP uptake has the potential to decrease transmission among gbMSM; however, the persistently high diagnosis rates indicate barriers to prevention continue to exist.Footnote 26
For women, heterosexual contact and IDU continue to be the predominant exposure categories, similar to previous years. In 2020, the overall proportion of HIV diagnoses attributed to IDU appears to have increased while the absolute number of reported IDU cases decreased. This was likely a data artifact created by the removal of a number of OOC cases from the 'Other' exposure category (which in the previous year had included OOC cases), having a net effect on proportions within exposure categories. However, it has also been reported that substance use and treatment service providers experienced an increase in demand for their services during the COVID-19 pandemic, while some reported that specific services also decreased or stopped at some point during that period.Footnote 18 It is unknown what impact the decreases in services for both harm reduction and testing during the first year of the pandemic may have had on the number of cases attributed to IDU.
Perinatal transmission of HIV in Canada remains low;Footnote 27Footnote 28 however, there were five infected infants reported in 2020. There was an indication of incomplete ART prophylaxis for the mothers of two infants, no treatment for mothers of another two infants and a fifth infant with unknown maternal treatment status at time of report (received in early March 2021). The Canadian Perinatal HIV Surveillance Program (CPHSP) presented an analysis on the impact of the COVID-19 pandemic on access to optimal HIV treatment that showed the support and care of pregnant women living with HIV was adversely affected.Footnote 27Footnote 28 There were also limitations in CPHSP data collection in 2020 due to the pandemic that future data updates may help to resolve.
Strengths
In addition to providing an epidemiological profile of Canadian first-time HIV diagnoses and AIDS cases on a national level, this report also provides a detailed view of HIV infection among migrants to Canada and perinatal transmission. As more provinces and territories are focusing on domestic transmission of HIV, the report presents information on first-time HIV diagnoses by year of diagnosis, age, sex, race/ethnicity and exposure category for 2020. This change to first-time diagnoses also reflects what is being done internationally (such as in the UK and Australia), and allows for stronger international comparisons.
Limitations
Limitations of the surveillance report have been previously detailedFootnote 4Footnote 10 and they include a lower proportion of data completed for race/ethnicity, variation in reporting previously diagnosed cases in historical data (in particular prior to 2019) and the under-reporting of cases of AIDS.
It should also be noted that due to the impacts of the COVID-19 pandemic, report findings should be interpreted with caution, and in particular, the reported trends. Due to increased demands on public health organizations in response to the COVID-19 pandemic, there have been various challenges noted that may have had an impact on the reporting of 2020 HIV cases both nationally and regionally. For example, efforts focused on responding to the pandemic may have had an effect on local public health surveillance processes, including data collection. Additionally, decreases in delivery of and access to STBBI testing services have been experienced both nationally and internationally. Activities were partially curtailed for the CPHSP due to the pandemic, while Immigration, Refugees, and Citizenship Canada (IRCC) noted decreases in international migration for 2020. As the COVID-19 pandemic is still ongoing, more time and data are needed to accurately assess the full effects of the COVID-19 pandemic on the HIV epidemic.
Given the high proportion of missing race/ethnicity data in 2020, any and all interpretation and uses of this information should be carefully considered. The proportions of reported race/ethnicity likely do not provide an accurate representation of the national picture of race/ethnicity among people living with HIV, as nearly two thirds of this data for newly diagnosed cases of HIV were missing.
In 2020, most jurisdictions were able to provide indicators of previous diagnosis within their datasets. However, due to challenges in available capacity for changes to reporting in many jurisdictions, fewer were able to provide this information consistently for 2011 through 2019. Over time, it is expected that there will be a gradual increase in the removal of previously diagnosed cases from the national dataset used in analysis of first-time diagnosed cases. This will improve the monitoring of first-time diagnoses rates and analyses of trends prior to 2020. While diagnosis out of country or out of province does not always indicate the true measure of out of country or out of province transmission, given the limitations of HIV surveillance data received (IRCC and HIV surveillance data cannot be linked at the national level), the methods used in this present surveillance report provide the most accurate picture possible of domestic transmission. Data included in this surveillance report should be considered provisional, as national surveillance data are updated annually. If discrepancies exist between data summarized in this report and provincial or territorial reports, the most recent provincial or territorial report should be utilized.
Conclusion
The number and rate of first-time HIV diagnoses in Canada decreased in 2020 compared to previous years. Two main reasons may explain this decrease: the exclusion of previously diagnosed cases in most jurisdictions to focus national reporting on first-time diagnoses and the effect of the COVID-19 pandemic on access to HIV testing. It is also unknown what lasting effects the COVID-19 pandemic may have on the epidemiology of HIV in Canada in future years. In addition to meeting its global reporting requirements (including estimates of HIV prevalence and the 90-90-90s), these surveillance data assist in monitoring progress against the pan-Canadian STBBI Framework and the associated Government of Canada Five-Year Action Plan on STBBI. Observing trends in domestic transmission offer direction on where to focus prevention activities; this requires ongoing improvements to surveillance of HIV, including first-time diagnoses. Moving forward, PHAC will continue to collaborate with provinces, territories, and other surveillance partners to describe the epidemiology of HIV in Canada.
Data tables
The following data tables provide information that support the figures and results presented in this report.
| Year of diagnosis | Overall first-time diagnosesData Table 1 footnote b | Overall rate per 100,000 | Males first-time diagnoses | Males rate per 100,000 | Females first-time diagnoses | Females rate per 100,000 |
|---|---|---|---|---|---|---|
| 2011 | 2,103 | 6.1 | 1,610 | 9.5 | 493 | 2.8 |
| 2012 | 1,906 | 5.5 | 1,471 | 8.5 | 435 | 2.5 |
| 2013 | 1,916 | 5.5 | 1,498 | 8.6 | 418 | 2.4 |
| 2014 | 1,892 | 5.3 | 1,441 | 8.2 | 451 | 2.5 |
| 2015 | 1,930 | 5.4 | 1,467 | 8.3 | 463 | 2.6 |
| 2016 | 2,140 | 5.9 | 1,641 | 9.2 | 499 | 2.7 |
| 2017 | 2,131 | 5.8 | 1,627 | 9.0 | 504 | 2.7 |
| 2018 | 2,280 | 6.2 | 1,639 | 8.9 | 641 | 3.4 |
| 2019 | 2,071 | 5.5 | 1,454 | 7.8 | 617 | 3.3 |
| 2020 | 1,631 | 4.3 | 1,164 | 6.2 | 467 | 2.4 |
| Province | Number of first-time diagnoses | HIV diagnosis rate (per 100,000 population) |
|---|---|---|
| Alberta | 147 | 3.3 |
| Atlantic Region | 30 | 1.3 |
| British Columbia | 136 | 2.6 |
| Manitoba | 97 | 7.0 |
| Ontario | 515 | 3.5 |
| Quebec | 526 | 6.1 |
| Saskatchewan | 185 | 15.7 |
| Territories | 3 | 2.3 |
| Age group | Males | Females | ||
|---|---|---|---|---|
| Number of diagnoses | Rate per 100,000 | Number of diagnoses | Rate per 100,000 | |
| Children < 15 years | 1 | <0.1 | 1 | <0.1 |
| 15 to 19 years | 9 | 0.8 | 16 | 1.6 |
| 20 to 29 years | 281 | 10.6 | 119 | 4.8 |
| 30 to 39 years | 374 | 14.0 | 143 | 5.4 |
| 40 to 49 years | 213 | 8.9 | 86 | 3.5 |
| ≥ 50 years | 286 | 4.1 | 102 | 1.3 |
Abbreviations: <, less than |
||||
| Age group | Year of diagnosis |
|||||||||||||||||||
|---|---|---|---|---|---|---|---|---|---|---|---|---|---|---|---|---|---|---|---|---|
| 2011 | 2012 | 2013 | 2014 | 2015 | 2016 | 2017 | 2018 | 2019 | 2020 | |||||||||||
| n | Rate | n | Rate | n | Rate | n | Rate | n | Rate | n | Rate | n | Rate | n | Rate | n | Rate | n | Rate | |
| Children < 15 years | 11 | 0.2 | 12 | 0.2 | 19 | 0.3 | 9 | 0.2 | 9 | 0.2 | 12 | 0.2 | 14 | 0.2 | 24 | 0.4 | 10 | 0.2 | 2 | <0.1 |
| 15 to 19 years | 44 | 2.0 | 33 | 1.5 | 38 | 1.8 | 36 | 1.7 | 34 | 1.6 | 44 | 2.1 | 40 | 1.9 | 39 | 1.9 | 33 | 1.6 | 25 | 1.2 |
| 20 to 29 years | 479 | 10.1 | 447 | 9.4 | 437 | 9.1 | 410 | 8.5 | 492 | 10.2 | 501 | 10.3 | 492 | 10.0 | 526 | 10.5 | 505 | 9.9 | 400 | 7.8 |
| 30 to 39 years | 642 | 14.0 | 562 | 12.1 | 559 | 11.8 | 599 | 12.5 | 524 | 10.8 | 625 | 12.8 | 665 | 13.4 | 690 | 13.6 | 638 | 12.3 | 519 | 9.8 |
| 40 to 49 years | 523 | 10.2 | 516 | 10.2 | 472 | 9.5 | 435 | 8.9 | 413 | 8.6 | 462 | 9.7 | 460 | 9.6 | 493 | 10.3 | 428 | 8.9 | 301 | 6.2 |
| ≥ 50 years | 409 | 3.4 | 339 | 2.7 | 397 | 3.1 | 409 | 3.1 | 461 | 3.4 | 503 | 3.7 | 462 | 3.3 | 510 | 3.6 | 460 | 3.2 | 392 | 2.7 |
Abbreviations: n = number; <, less than; ≥, greater than or equal |
||||||||||||||||||||
| Exposure category | 2011 | 2012 | 2013 | 2014 | 2015 | 2016 | 2017 | 2018 | 2019 | 2020 | ||||||||||
|---|---|---|---|---|---|---|---|---|---|---|---|---|---|---|---|---|---|---|---|---|
| n | % | n | % | n | % | n | % | n | % | n | % | n | % | n | % | n | % | n | % | |
| Male-to-male sexual contact | 924 | 48.5 | 948 | 48.9 | 988 | 50.1 | 897 | 49.8 | 924 | 48.7 | 971 | 49.3 | 899 | 45.6 | 857 | 44.3 | 788 | 42.8 | 605 | 43.7 |
| Male-to-male sexual contact and Injection drug use | 46 | 2.4 | 40 | 2.1 | 50 | 2.5 | 53 | 2.9 | 54 | 2.8 | 58 | 2.9 | 39 | 2.0 | 58 | 3.0 | 58 | 3.1 | 30 | 2.2 |
| Injection drug use | 297 | 15.6 | 247 | 12.7 | 221 | 11.2 | 227 | 12.6 | 249 | 13.1 | 233 | 11.8 | 255 | 12.9 | 282 | 14.6 | 273 | 14.8 | 254 | 18.3 |
| Heterosexual contact | 580 | 30.0 | 635 | 32.8 | 628 | 31.9 | 527 | 29.2 | 601 | 31.6 | 621 | 31.5 | 684 | 34.7 | 661 | 34.2 | 629 | 34.1 | 474 | 34.2 |
| Other | 57 | 3.0 | 68 | 3.6 | 87 | 4.5 | 99 | 6.0 | 70 | 3.8 | 88 | 4.5 | 96 | 4.9 | 76 | 3.9 | 94 | 5.1 | 22 | 1.6 |
Abbreviations: n = number; ≥, greater than or equal |
||||||||||||||||||||
| Exposure category | 2011 | 2012 | 2013 | 2014 | 2015 | 2016 | 2017 | 2018 | 2019 | 2020 | ||||||||||
|---|---|---|---|---|---|---|---|---|---|---|---|---|---|---|---|---|---|---|---|---|
| n | % | n | % | n | % | n | % | n | % | n | % | n | % | n | % | n | % | n | % | |
| Male-to-male sexual contact | 924 | 62.0 | 948 | 63.8 | 988 | 64.0 | 897 | 64.5 | 922 | 63.3 | 969 | 64.0 | 899 | 59.9 | 854 | 61.7 | 782 | 60.1 | 605 | 60.8 |
| Male-to-male sexual contact and Injection drug use | 46 | 3.1 | 40 | 2.7 | 50 | 3.2 | 53 | 3.8 | 54 | 3.7 | 58 | 3.8 | 39 | 2.6 | 58 | 4.2 | 58 | 4.5 | 30 | 3.0 |
| Injection drug use | 190 | 12.7 | 148 | 10.0 | 142 | 9.2 | 133 | 9.6 | 150 | 10.3 | 131 | 8.6 | 160 | 10.7 | 155 | 11.2 | 134 | 10.3 | 127 | 12.8 |
| Heterosexual contact | 299 | 20.1 | 310 | 20.8 | 319 | 20.7 | 253 | 18.2 | 290 | 19.9 | 311 | 20.5 | 349 | 23.3 | 278 | 20.1 | 284 | 21.8 | 217 | 21.8 |
| Other | 32 | 2.1 | 41 | 2.8 | 45 | 2.9 | 54 | 3.9 | 40 | 2.7 | 46 | 3.0 | 54 | 3.6 | 38 | 2.7 | 43 | 3.3 | 16 | 1.6 |
Abbreviations: n = number; ≥, greater than or equal |
||||||||||||||||||||
| Exposure category | 2011 | 2012 | 2013 | 2014 | 2015 | 2016 | 2017 | 2018 | 2019 | 2020 | ||||||||||
|---|---|---|---|---|---|---|---|---|---|---|---|---|---|---|---|---|---|---|---|---|
| n | % | n | % | n | % | n | % | n | % | n | % | n | % | n | % | n | % | n | % | |
| Injection drug use | 107 | 25.9 | 99 | 22.0 | 78 | 18.3 | 92 | 22.5 | 99 | 22.6 | 102 | 22.5 | 94 | 20.0 | 127 | 23.2 | 139 | 26.0 | 127 | 32.7 |
| Heterosexual contact | 281 | 68.0 | 325 | 72.1 | 307 | 71.9 | 272 | 66.5 | 311 | 70.8 | 309 | 68.2 | 334 | 71.1 | 383 | 69.9 | 344 | 64.4 | 255 | 65.7 |
| Other | 25 | 6.1 | 27 | 6.0 | 42 | 9.8 | 45 | 11.0 | 29 | 6.6 | 42 | 9.3 | 42 | 8.9 | 38 | 6.9 | 51 | 9.6 | 6 | 1.5 |
Abbreviations: n = number; ≥, greater than or equal |
||||||||||||||||||||
| Age group | Male-to-male sexual contact | Male-to-male sexual contact and injection drug use | Injection drug use | Heterosexual contact | Other | |||||
|---|---|---|---|---|---|---|---|---|---|---|
| n | % | n | % | n | % | n | % | n | % | |
| 15-19 years | 6 | 30.0 | 0 | 0.0 | 4 | 20.0 | 9 | 45.0 | 1 | 5.0 |
| 20-29 years | 166 | 49.6 | 9 | 2.7 | 66 | 19.7 | 87 | 26.0 | 7 | 2.1 |
| 30-39 years | 178 | 42.1 | 12 | 2.8 | 98 | 23.2 | 130 | 30.7 | 5 | 1.2 |
| 40-49 years | 97 | 40.8 | 4 | 1.7 | 41 | 17.2 | 92 | 38.7 | 4 | 1.7 |
| ≥ 50 years | 158 | 42.8 | 5 | 1.4 | 45 | 12.2 | 156 | 42.3 | 5 | 1.4 |
Abbreviations: n = number; ≥, greater than or equal |
||||||||||
| Year of birth | Total | |||||||||
|---|---|---|---|---|---|---|---|---|---|---|
| 1984-2012 | 2013 | 2014 | 2015 | 2016 | 2017 | 2018 | 2019 | 2020 | ||
| No perinatal ART prophylaxis | ||||||||||
| Confirmed infected | 656 | 4 | 4 | 11 | 5 | 3 | 5 | 1 | 2 | 691 |
| Asymptomatic | 64 | 4 | 2 | 8 | 4 | 0 | 5 | 1 | 0 | 88 |
| Symptomatic | 16 | 0 | 1 | 2 | 1 | 0 | 0 | 0 | 1 | 21 |
| Died of AIDS | 100 | 0 | 0 | 0 | 0 | 0 | 0 | 0 | 0 | 100 |
| Died of other | 10 | 0 | 0 | 0 | 0 | 0 | 0 | 0 | 0 | 10 |
| Lost to follow-upData Table 7 footnote a | 196 | 0 | 1 | 1 | 0 | 3 | 0 | 0 | 1 | 202 |
| Adult careData Table 7 footnote b | 270 | 0 | 0 | 0 | 0 | 0 | 0 | 0 | 0 | 270 |
| Confirmed not infected | 503 | 5 | 5 | 6 | 10 | 10 | 6 | 4 | 3 | 552 |
| Infection status not confirmed | 26 | 0 | 0 | 0 | 0 | 0 | 0 | 0 | 2 | 28 |
| Indeterminate | 0 | 0 | 0 | 0 | 0 | 0 | 0 | 0 | 1 | 1 |
| Lost to follow-upData Table 7 footnote c | 26 | 0 | 0 | 0 | 0 | 0 | 0 | 0 | 1 | 27 |
| Subtotal | 1,185 | 9 | 9 | 17 | 15 | 13 | 11 | 5 | 7 | 1,271 |
| Any perinatal ART prophylaxis | ||||||||||
| Confirmed infected | 29 | 0 | 2 | 2 | 0 | 1 | 2 | 0 | 2 | 38 |
| Asymptomatic | 9 | 0 | 1 | 1 | 0 | 1 | 2 | 0 | 0 | 14 |
| Symptomatic | 2 | 0 | 0 | 0 | 0 | 0 | 0 | 0 | 1 | 3 |
| Died of AIDS | 1 | 0 | 0 | 0 | 0 | 0 | 0 | 0 | 0 | 1 |
| Died of other | 1 | 0 | 0 | 0 | 0 | 0 | 0 | 0 | 0 | 1 |
| Lost to follow-upData Table 7 footnote a | 11 | 0 | 1 | 1 | 0 | 0 | 0 | 0 | 1 | 14 |
| Adult careData Table 7 footnote b | 5 | 0 | 0 | 0 | 0 | 0 | 0 | 0 | 0 | 5 |
| Confirmed not infected | 2,640 | 206 | 239 | 228 | 246 | 237 | 255 | 234 | 204 | 4,489 |
| Infection status not confirmed | 26 | 0 | 0 | 4 | 4 | 4 | 9 | 12 | 33 | 92 |
| Indeterminate | 0 | 0 | 0 | 0 | 0 | 0 | 0 | 0 | 31 | 31 |
| Lost to follow-upData Table 7 footnote c | 26 | 0 | 0 | 4 | 4 | 4 | 9 | 12 | 2 | 61 |
| Subtotal | 2,695 | 206 | 241 | 234 | 250 | 242 | 266 | 246 | 239 | 4,619 |
| Perinatal ART prophylaxis exposure unknown | 44 | 3 | 2 | 2 | 3 | 1 | 2 | 4 | 4Data Table 7 footnote d | 65 |
| Total | 3,924 | 218 | 252 | 253 | 268 | 256 | 279 | 255 | 250 | 5,955 |
Data source: CPHSP data received March 26, 2021 |
||||||||||
| Tested in CanadaData Table 8 footnote b | Tested overseasData Table 8 footnote b | |||
|---|---|---|---|---|
| YearData Table 8 footnote b | Number diagnosed with HIV | % | Number diagnosed with HIV | % |
| 2011 | 210 | 63.8 | 119 | 36.2 |
| 2012 | 243 | 63.4 | 140 | 36.6 |
| 2013 | 422 | 67.7 | 201 | 32.3 |
| 2014 | 345 | 67.9 | 163 | 32.1 |
| 2015 | 350 | 63.6 | 200 | 36.4 |
| 2016 | 418 | 55.7 | 333 | 44.3 |
| 2017 | 549 | 65.7 | 286 | 34.3 |
| 2018 | 696 | 67.8 | 330 | 32.2 |
| 2019 | 626 | 52.7 | 562 | 47.3 |
| 2020 | 399 | 53.7 | 344 | 46.3 |
| Total | 4,258 | 61.4 | 2,678 | 38.6 |
| Tested in CanadaData Table 9 footnote b | Tested overseasData Table 9 footnote b | |||
|---|---|---|---|---|
| Number diagnosed with HIV | % | Number diagnosed with HIV | % | |
| Sex | ||||
| Male | 2,373 | 58.7 | 1,306 | 54.0 |
| Female | 1,672 | 41.3 | 1,111 | 46.0 |
| Age group | ||||
| <20 | 61 | 1.5 | 160 | 6.6 |
| 20-29 | 753 | 18.6 | 657 | 27.2 |
| 30-39 | 1,573 | 38.9 | 849 | 35.1 |
| 40-49 | 1,063 | 26.3 | 441 | 18.2 |
| 50+ | 598 | 14.8 | 312 | 12.9 |
| ProvinceData Table 9 footnote b | ||||
| AB | 374 | 9.2 | 344 | 14.8 |
| BC | 331 | 8.2 | 267 | 11.5 |
| MB | 52 | 1.3 | 142 | 6.1 |
| ON | 2,167 | 53.5 | 823 | 35.4 |
| QC | 1,047 | 25.9 | 549 | 23.6 |
| SK | 50 | 1.2 | 72 | 3.1 |
| Atlantic provincesData Table 9 footnote c | 26 | 0.6 | 122 | 5.2 |
| TerritoriesData Table 9 footnote c | 1 | 0.0 | 8 | 0.3 |
| HIV-endemic country | ||||
| Yes | 2,580 | 63.7 | 1,582 | 65.4 |
| No | 1,468 | 36.3 | 837 | 34.6 |
| Country | Cumulative number to 2020Data Table 10 footnote a | Number reported in 2020 | All ages rate per 100,000 population for 2020 |
|---|---|---|---|
| North America and Australia | |||
| Canada | 89,803 | 1,639 | 4.3 |
| United StatesData Table 10 footnote b | NR | 30,035 | NR |
| AustraliaData Table 10 footnote c | 40,578 | 633 | 2.5 |
| Western EuropeData Table 10 footnote d | |||
| Austria | 10,401 | 155 | 1.7 |
| Andorra | 96 | NR | NR |
| Belgium | 33,237 | 727 | 6.3 |
| Denmark | 8,161 | 161 | 2.8 |
| Finland | 4,349 | 136 | 2.5 |
| France | 97,370 | 3,443 | 5.1 |
| Germany | 73,722 | 2,454 | 3.0 |
| Greece | 16,762 | 601 | 5.6 |
| Iceland | 485 | 34 | 9.3 |
| Ireland | 10,436 | 429 | 8.6 |
| Israel | 10,862 | 363 | 4.2 |
| Italy | 51,168 | 1,303 | 2.2 |
| Luxembourg | 1,922 | 44 | 7.0 |
| Malta | 667 | 82 | 15.9 |
| Netherlands | 28,891 | 396 | 2.3 |
| Norway | 6,791 | 137 | 2.6 |
| Portugal | 61,822 | NR | NR |
| San Marino | 93 | 0 | 0.0 |
| Spain | 56,557 | 1,884 | 5.6 |
| Sweden | 13,859 | 360 | 3.5 |
| Switzerland | 37,111 | 288 | 3.3 |
| United Kingdom | 167,847 | 2,785 | 4.1 |
Abbreviations: NR, not reported |
|||
Supplementary tables
Copies of the supplementary tables are available upon request. Please e-mail the HIV/AIDS Surveillance Section, PHAC staff at hass@phac-aspc.gc.ca.
List of supplementary tables
- Table 1: HIV diagnosis rate (per 100,000 population) by province/territory and year of diagnosis (all ages)
- Table 2: Number of HIV cases (all ages) by province/territory, sex and year of diagnosis, Canada, 1985 to 2020
- Table 3: Number of HIV cases by age group and province/territory, Canada, 2019 to 2020
- Table 4: Number of HIV cases among adults (≥ 15 years old) by year of diagnosis and sex, Canada, 1985 to 2020
- Table 5: Number of HIV cases and HIV diagnosis rate by age group, sex and year of diagnosis, Canada, 1985 to 2020
- Table 6: Number and percentage distribution of HIV cases among adults (≥ 15 years old) by exposure category and year of diagnosis, Canada, 1985 to 2020
- Table 7: Number and percentage distribution of HIV cases among adult males (≥ 15 years old) by exposure category and year of diagnosis, Canada, 1985 to 2020
- Table 8: Number and percentage distribution of HIV cases among adult females (≥ 15 years old) by exposure category and year of diagnosis, Canada, 1985 to 2020
- Table 9: Number and percentage distribution of HIV cases among adults (≥ 15 years old) by exposure category and age group, Canada, 2019 to 2020
- Table 10: Number and percentage distribution of HIV cases among children (<15 years old) by exposure category and year of diagnosis, Canada, 1985 to 2020
- Table 11: Number of HIV cases by exposure category and province/territory, Canada, 2019 to 2020
- Table 12: Number and percentage distribution of immigration applicants to Canada diagnosed with HIV as a result of an Immigration Medical Exam (IME) by year, 2011 to 2020
- Table 13: Number and percentage distribution of immigration applicants to Canada diagnosed with HIV as a result of an Immigration Medical Exam (IME) by sex, age group, and province, 2012 to 2020
- Table 14: Number of Canadian perinatally HIV-exposed infants by maternal exposure category and year of infant birth, 1984 to 2020
- Table 15: Number of Canadian perinatally HIV-exposed infants by year of birth, current status and use of antiretroviral therapy (ART) for prophylaxis, 1984 to 2020
- Table 16: Number of Canadian perinatally HIV-exposed infants by geographic region and status at last report, 1984 to 2020
- Table 17: Number of Canadian perinatally HIV-exposed infants by ethnic status and infection status, 1984 to 2020
- Table 18: Number of Canadian perinatally HIV-exposed infants by maternal country of birth and infection status, 1984 to 2020
- Table 19: International statistics on reported HIV cases, 2020
Appendix 1: Data contributors
Provincial/Territorial
Alberta Health
23rd Floor ATB Place
10025 Jasper Avenue
Edmonton, AB T5J 1S5
BC Centre for Disease Control
655 West 12th Avenue
Vancouver, BC V5Z 4R4
Manitoba Health
4th Floor - 300 Carlton Street
Winnipeg, MB R3B 3M9
New Brunswick Department of Health
520 King Street, HSBC Place
P.O. Box 5100
Fredericton, NB E3B 6G3
Newfoundland and Labrador Department of Health and Community Services
West Block, Confederation Building
P.O. Box 8700
St. John's, NL A1B 4J6
Northwest Territories Health and Social Services
P.O. Box 1320
8th Floor, Centre Square Tower
5022-49th Street
Yellowknife, NWT X1A 2L9
Nova Scotia Department of Health and Wellness
Summit Place, 5th Floor
1601 Lower Water Street
P.O. Box 487
Halifax, NS B3J 2R7
Nunavut Department of Health
P.O. Box 1000, Station 1000
Iqaluit, NU X0A 0H0
Public Health Ontario Laboratory
661 University Avenue, Suite 1701
Toronto ON M5G 1M1
Public Health Ontario
480 University Avenue, Suite 300
Toronto ON M5G 1V2
Prince Edward Island Department of Health and Wellness
16 Fitzroy Street, 2nd floor
Charlottetown PEI C1A 7N8
Laboratoire de santé publique du Québec INSPQ (In French only)
20045 chemin Sainte-Marie
Sainte Anne de Bellevue QC H9X 3R5
Saskatchewan Ministry of Health
3475 Albert Street, 1st floor
3475 Albert Street, 1st floor
Regina SK S4S 6X6
Yukon Department of Health and Social Services
4 Hospital Road
Whitehorse YK Y1A 3H8
Appendix 2: Technical notes
All provinces, with the exception of Newfoundland and Labrador, submitted line-listed data. Newfoundland and Labrador, the Northwest Territories, Nunavut and Yukon submitted data using the National HIV/AIDS case report form (PDF format). The national case definitions for both HIV and AIDS can be found on-line: Case definitions: Nationally notifiable diseases (canada.ca).
The data for HIV and AIDS are maintained in two unlinked databases. Different HIV and AIDS reporting requirements and practices exist across the country. Historically, there was also variation in reporting of first-time ever diagnoses of HIV and previous diagnoses, and all cases were referred to as 'newly reported' in previous reports. The ability to distinguish between first-ever diagnoses and previously diagnosed cases varies by province and territory and by surveillance year. Please refer to 'Figure A1: Status of reporting on first-time diagnoses and previously diagnosed cases in all Canadian provinces and territories, 2011 to 2020' for more detail about the pattern of reporting among the provinces and territories on previous positive cases over the past ten years. Figure A2 presents the breakdown of all cases (first-time diagnoses versus previously diagnosed cases) in Canadian provinces and territories over the past 10 years.
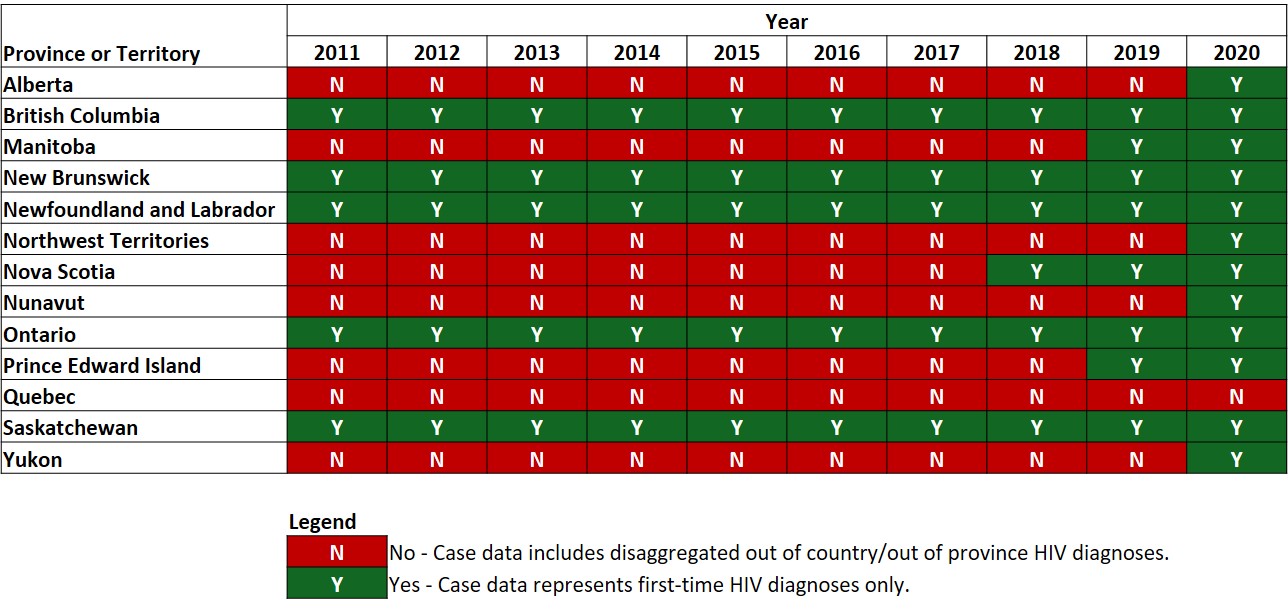
Figure A1: Text description
| Province or territory | Year | |||||||||
|---|---|---|---|---|---|---|---|---|---|---|
| 2011 | 2012 | 2013 | 2014 | 2015 | 2016 | 2017 | 2018 | 2019 | 2020 | |
| Alberta | N | N | N | N | N | N | N | N | N | Y |
| British Columbia | Y | Y | Y | Y | Y | Y | Y | Y | Y | Y |
| Manitoba | N | N | N | N | N | N | N | N | Y | Y |
| New Brunswick | Y | Y | Y | Y | Y | Y | Y | Y | Y | Y |
| Newfoundland and Labrador | Y | Y | Y | Y | Y | Y | Y | Y | Y | Y |
| Northwest Territories | N | N | N | N | N | N | N | N | N | Y |
| Nova Scotia | N | N | N | N | N | N | N | Y | Y | Y |
| Nunavut | N | N | N | N | N | N | N | N | N | Y |
| Ontario | Y | Y | Y | Y | Y | Y | Y | Y | Y | Y |
| Prince Edward Island | N | N | N | N | N | N | N | N | Y | Y |
| Quebec | N | N | N | N | N | N | N | N | N | N |
| Saskatchewan | Y | Y | Y | Y | Y | Y | Y | Y | Y | Y |
| Yukon | N | N | N | N | N | N | N | N | N | Y |
Legend: Y = Yes: Case data represents first-time HIV diagnoses only; N = No: Case data includes disaggregated out of country/out of province HIV diagnoses. |
||||||||||
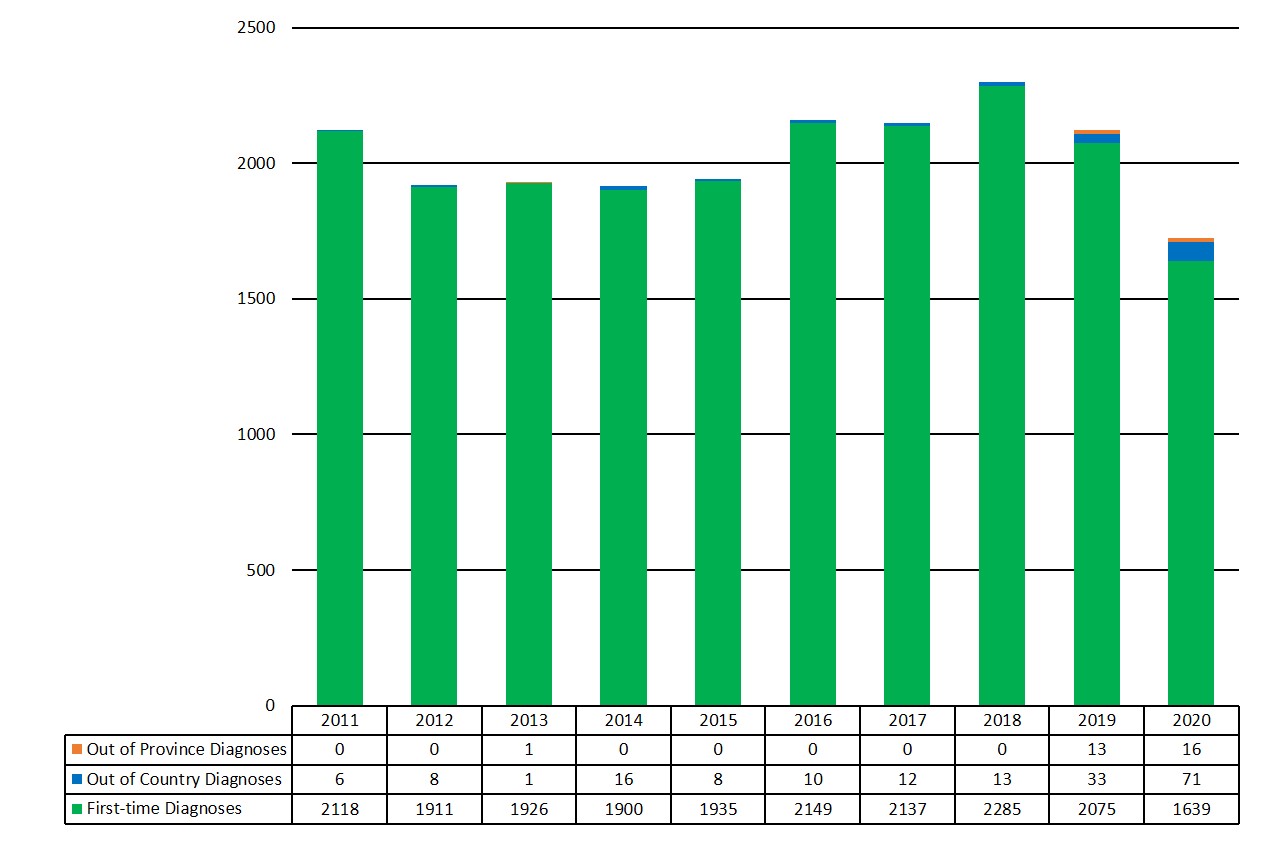
Figure A2: Text description
| Year of diagnosis | Out of province diagnoses | Out of country diagnoses | First-time diagnoses |
|---|---|---|---|
| 2011 | 0 | 6 | 2,118 |
| 2012 | 0 | 8 | 1,911 |
| 2013 | 1 | 1 | 1,926 |
| 2014 | 0 | 16 | 1,900 |
| 2015 | 0 | 8 | 1,935 |
| 2016 | 0 | 10 | 2,149 |
| 2017 | 0 | 12 | 2,137 |
| 2018 | 0 | 13 | 2,285 |
| 2019 | 13 | 33 | 2,075 |
| 2020 | 16 | 71 | 1,639 |
HIV data
- Twelve of thirteen provinces and territories provided line-listed data on first-time diagnoses for 2020. Quebec provided line-listed data on all diagnoses within the province that did not separate first-time from previously diagnosed cases in 2020.
- Provincial and territorial public health authorities provided information on previously diagnosed cases in their data submission. These were defined as HIV cases that had evidence of a known previous HIV diagnosis in another country (Out of Country, OOC) or in another Canadian province or territory (Out of Province, OOP). Some were able to provide historical information on previous positive cases; however, given resource constraints faced throughout the COVID-19 pandemic, not all PTs were able to do this for this reporting cycle.
- Data within provincial and territorial public health authorities are continuously updated to remove duplicate cases and enhance the completeness of the data.
- For Alberta, in 2020, national reporting excludes HIV cases where the location of the first-ever positive has been identified as out-of-country or outside the reporting province; consequently HIV case totals from PHAC may differ from those reported by Alberta provincial reports. This is also noted within the report.
Race/Ethnicity category
- Race/ethnicity data were submitted by all provinces and territories excluding Quebec and British Columbia. Additionally, reporting practices (such as race/ethnicity categories used) vary across jurisdictions and are limited in some PTs.
- New Brunswick submitted race/ethnicity in terms of whether a case was First Nations or not First Nations without any further details regarding any other race/ethnicity category. Likewise, Saskatchewan had submitted race/ethnicity in terms of whether a case was Indigenous or not.
- Among the PTs, the completeness of this variable ranged from 16.7% to 100% in 2020 (36.1% overall) and therefore should be interpreted with extreme caution given the large amount of missing data and may not be fully representative of the national picture of race/ethnicity data for HIV cases.
- Further detail about the categories used in this report are:
- Individuals reported in the South Asian/West Asian/Arab category include, for example, those of Pakistani, Sri Lankan, Bangladeshi, Armenian, Egyptian, Iranian, Lebanese or Moroccan descent.
- Individuals reported in the Asian category include, for example, those of Chinese, Japanese, Vietnamese, Indonesian, Laotian, Korean or Filipino descent.
- Individuals reported in the Black category include, for example, those of Somali, Haitian or Jamaican descent.
- Individuals reported in the Latin American category include, for example, those of Mexican, Central American or South American descent.
- Individuals reported in the Other ethnicity category include those of mixed race descent or any other racial/ethnic category.
Exposure category
- Exposure category data were submitted by all provinces and territories, including Quebec, which shared this information for the first time in 2020.
- While 12 of the 13 PT public health authorities submitted exposure category information as line-listed data, Quebec submitted aggregate data on exposure category for 98% of cases (n = 514), stratified by sex and age. As such, the total case counts for exposure category analyses differ slightly from the line-listed data (n = 526) reported elsewhere in this report.
- Among the PTs, the completeness of this variable ranged from 67.6% to 100% in 2020 (85.2% overall).
- Quebec reported aggregate data on exposure category by sex and year. This data was not linked to the line-listed case data the province submitted with only demographic variables. As such, total case counts in Exposure Category analyses will differ from the total case counts based on the line-listed data for geographic and sex-age group analyses.
AIDS data
The AIDS surveillance database captures non-nominal data on people diagnosed with AIDS (as per the national case definition) and includes HIV diagnosis, the disease indicative of AIDS and the vital status for the AIDS case (e.g., death). Among the provinces and territories, the following changes to AIDS reporting have occurred over time, which affect the completeness of AIDS surveillance data (Figure A3).
From January 1, 1979 to December 31, 2020, there were 24,876 cases of AIDS reported to PHAC. Additional AIDS data is available on the Notifiable Diseases website, Notifiable Diseases Online (canada.ca).
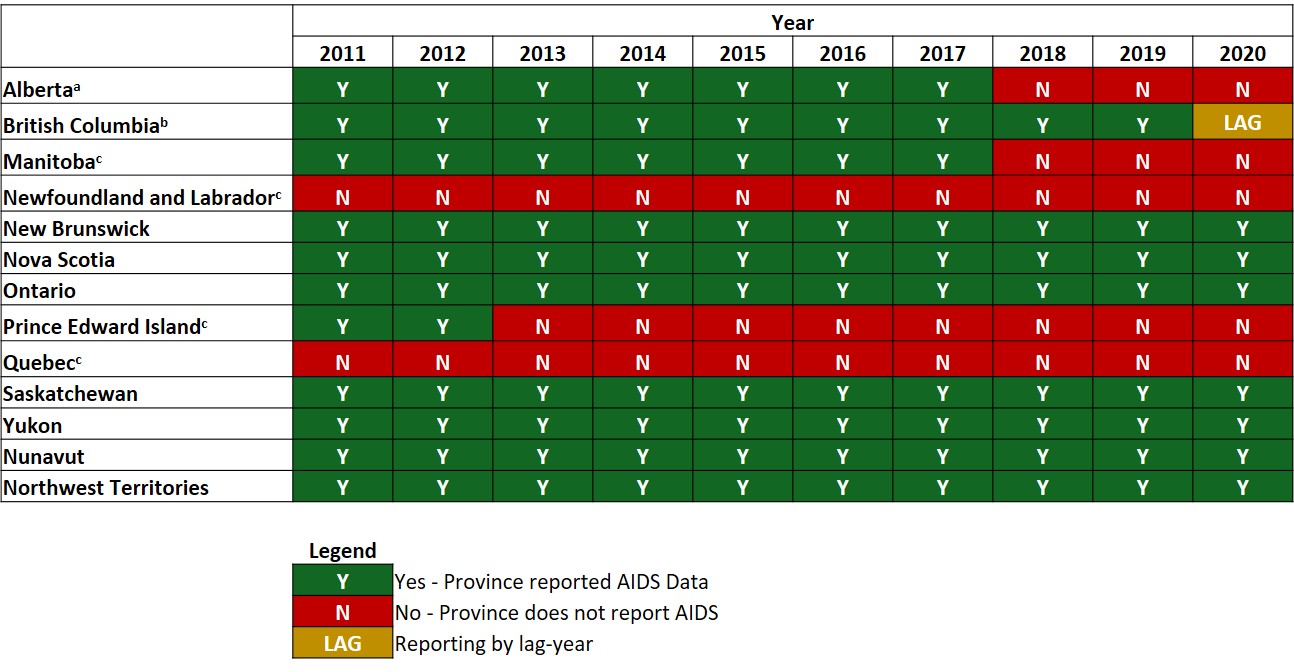
Figure A3: Text description
| Province or territory | Year | |||||||||
|---|---|---|---|---|---|---|---|---|---|---|
| 2011 | 2012 | 2013 | 2014 | 2015 | 2016 | 2017 | 2018 | 2019 | 2020 | |
| AlbertaFigure A3 footnote a | Y | Y | Y | Y | Y | Y | Y | N | N | N |
| British ColumbiaFigure A3 footnote b | Y | Y | Y | Y | Y | Y | Y | Y | Y | LAG |
| ManitobaFigure A3 footnote c | Y | Y | Y | Y | Y | Y | Y | N | N | N |
| Newfoundland and LabradorFigure A3 footnote c | N | N | N | N | N | N | N | N | N | N |
| New Brunswick | Y | Y | Y | Y | Y | Y | Y | Y | Y | Y |
| Nova Scotia | Y | Y | Y | Y | Y | Y | Y | Y | Y | Y |
| Ontario | Y | Y | Y | Y | Y | Y | Y | Y | Y | Y |
| Prince Edward IslandFigure A3 footnote c | Y | Y | N | N | N | N | N | N | N | N |
| QuebecFigure A3 footnote c | N | N | N | N | N | N | N | N | N | N |
| Saskatchewan | Y | Y | Y | Y | Y | Y | Y | Y | Y | Y |
| Yukon | Y | Y | Y | Y | Y | Y | Y | Y | Y | Y |
| Nunavut | Y | Y | Y | Y | Y | Y | Y | Y | Y | Y |
| Northwest Territories | Y | Y | Y | Y | Y | Y | Y | Y | Y | Y |
Legend: Y = Yes: Province reported AIDS Data; N = No: Province does not report AIDS; LAG = Reporting by lag-year |
||||||||||
Appendix 3: Exposure category hierarchy
Based on information provided regarding risk behaviours, HIV/AIDS cases are assigned a single exposure category from the PHAC exposure category hierarchy corresponding to the exposure route with the highest risk of HIV transmission. For example, if an individual who uses injection drugs and reports heterosexual contact risk behaviours is diagnosed with HIV, this individual would be attributed to the 'injection drug use' exposure category as this category has a higher risk of HIV transmission than 'heterosexual contact'. Several limitations of using the exposure category hierarchy exists: the exposure category does not differentiate between risk behaviours and risk populations; assessment of the exposure category can vary based on both the individual's responses and the questions posed by the care provider; and the exposure category hierarchy may need to be revised considering more recent evidence regarding probabilities of HIV transmission with the assistance of surveillance partners and subject-matter experts.
The exposure hierarchy is as follows:
Male-to-male sexual contact: This category includes males who report sexual contact with other males.
Male-to-male sexual contact and Injection Drug Use (IDU): This category includes males who report sexual contact with other males and who also report injecting drugs.
Injection Drug Use (IDU): This category includes people who report injecting drugs.
Blood/blood products:
Recipient of blood/clotting factor: Before 1998, it was not possible to separate this exposure category. However, where possible, it has been separated into subcategories a and b.
- Recipient of blood: Received transfusion of whole blood or blood components, such as packed red cells, plasma, platelets, or cryoprecipitate.
- Recipient of clotting factor: Received pooled concentrates of clotting factor VIII or IX for treatment of hemophilia/coagulation disorder.
Heterosexual contact:
- Origin from an HIV-endemic country (Het-Endemic): People who were born in a country where HIV is endemic. An HIV-endemic country is defined as having an adult (ages 15 to 49) prevalence of HIV that is 1.0% or greater and one of the following:
- 50% or more of HIV cases attributed to heterosexual transmission.
- A male to female ratio of 2:1 or less.
- HIV prevalence greater than or equal to 2% among women receiving prenatal care.
Before 1998, it was not always possible to separate origin from an HIV-endemic country and sexual contact with a person at risk. However, where possible, it has been separated into subcategories a and b. Note: the Het-endemic list has not been reviewed since 2007.Footnote 11
- Sexual contact with a person at risk (Het-Risk): People who report heterosexual contact with someone who is either HIV-infected or who is at increased risk of HIV infection (e.g., a person who injects drugs, a male who has sex with both males and females, or a person from an HIV-endemic country).
- No identified risk-heterosexual (NIR-Het): If heterosexual contact is the only risk factor reported and nothing is known about the HIV-related factors associated with the partner, the case is classified as NIR-Het.
Occupational exposure: Exposure to HIV-contaminated blood or body fluids, or concentrated virus, in an occupational setting. This applies only to reported AIDS cases and not to HIV cases where the occupational exposure category is captured under "Other".
Perinatal transmission: The transmission of HIV from a woman infected with HIV to her infant, either in utero, during childbirth, or through breastfeeding.
Other: Used to classify cases where the mode of HIV transmission is known but cannot be classified into any of the major exposure categories listed here; for example, a recipient of semen from an HIV-positive donor. The "Other" exposure category includes cases from Alberta identified through Immigration Refugees and Citizenship Canada (for years before 2020), and also blood/clotting, perinatal, occupational exposure and other exposure categories.
No identified risk (NIR): Used when the history of exposure to HIV through any of the other modes listed is unknown, or there is no reported history (e.g., because of death, or loss to follow-up).
Not reported: In certain provinces and territories, exposure categories are not reported to PHAC and are classified as "not reported".
Page details
- Date modified: