
Tuberculosis in Canada: 2012 to 2021 expanded report

Download the alternative format
(PDF format, 2.4 MB, 98 pages)
Organization: Public Health Agency of Canada
Published: 2024-04-17
Table of contents
- List of Tables
- List of Figures
- Glossary
- Executive summary
- Introduction
- Methods
- Results
- Overall epidemiology: Tuberculosis (TB) in Canada
- Geography
- Demographics
- 1. Distribution of active TB cases by sex and age
- 2. Distribution of active TB cases by population group
- TB in Indigenous Peoples
- TB among individuals born outside of Canada
- 3. Distribution of risk factors among active TB cases
- Prevalence of human immunodeficiency virus (HIV) among active TB cases
- Prevalence of diabetes mellitus (DM) among active TB cases
- Clinical characteristics: Detection methods, re-treatment, site of infection and laboratory confirmation
- Resistance
- TB outcomes
- Discussion
- Limitations of the Canadian Tuberculosis Reporting System (CTBRS)
- Conclusion
- Appendices
- Appendix A: Member countries of each World Health Organization (WHO) epidemiological region
- Appendix B: CTBRS case reporting form
- Appendix C: Treatment outcome of a new active or re-treatment TB case
- Appendix D: M. tuberculosis complex antimicrobial susceptibility reporting form
- Appendix E: Descriptive epidemiology of cases
- Appendix F: Risk factor reporting by province and territory
- Appendix G: Drug-resistance by age group, Canadian Tuberculosis Laboratory Surveillance System (CTBLSS): 2012-2021
- Appendix H: Method of detection of TB by province/territory, CTBRS: 2012-2021
- Acknowledgements
- References
List of Tables
- Table 1: Counts, proportion, and incidence of active TB (per 100,000) by province/territory, CTBRS: 2021
- Table 2: Number of incident active TB cases by province/territory, CTBRS: 2012-2021
- Table 3: Count, proportion, and incidence (per 100,000) of active TB by sex and age, CTBRS: 2021
- Table 4: Incidence (per 100,000) of active TB by Indigenous group and province/territory, CTBRS: 2021
- Table 5: Number of cases and incidence of active TB (per 100,000) for First Nations on-reserve and off-reserve, CTBRS: 2012-2021
- Table 6: Number and proportion of active TB cases by WHO region, among individuals born outside of Canada, CTBRS: 2012-2021
- Table 7: Number and proportion of active TB cases among individuals born outside of Canada by province/territory, CTBRS: 2021
- Table 8: Time to development of active TB: Canadians and permanent residents born outside of Canada, CTBRS: 2021
- Table 9: Time to development of active TB by region of origin: visitors, students and temporary workers, CTBRS: 2021
- Table 10: Missing data for TB risk factors, CTBRS: 2021
- Table 11: HIV prevalence among active TB cases by province/territory, CTBRS: 2021
- Table 12: Prevalence of HIV among active TB cases, CTBRS: 2012-2021
- Table 13: Prevalence of diabetes among active TB cases by province/territory, CTBRS: 2021
- Table 14: Methods of detection for active TB, CTBRS: 2012-2021
- Table 15: Re-treatment prevalence in active TB cases in Canada by year, CTBRS: 2012-2021
- Table 16: Time interval between current diagnosis and end of last TB treatment, CTBRS: 2021
- Table 17: Diagnostic sites of incident active TB cases, CTBRS: 2021
- Table 18: Diagnostic sites of active TB by population group, CTBRS: 2021
- Table 19: Culture results of active TB cases, CTBRS: 2012-2021
- Table 20: Drug resistance among MTB isolates by year, CTBLSS: 2012-2021
- Table 21: Drug resistance among MTB isolates by age, CTBLSS: 2021
- Table 22: Rate of drug resistance by population group, CTBRS: 2012-2021
- Table 23: Outcomes of incident active TB cases CTBRS: 2011-2020
- Table 24: Treatment outcomes for re-treatment TB cases, CTBRS: 2020
- Table 25: Treatment outcomes by province/territory, CTBRS: 2020
- Table 26: Treatment outcome by age, CTBRS: 2020
- Table 27: Cause of death, active TB cases by age, CTBRS: 2020
- Table 28: TB-related deaths by age and population group, CTBRS: 2011-2020
- Table 29: International comparisons of number of active TB cases and incidence per 100,000: 2017-2021
- Table 30: International comparisons of active TB cases and incidence per 100,000 by age: 2021
- Table 31: International comparisons of the proportion of paediatric (<15 years old) incident active TB cases: 2017-2021
- Table 32: International comparisons of the proportions of active TB cases born outside country/area of diagnosis: 2017-2021
- Table 33: International comparisons of HIV/TB co-infection data: 2017-2021
- Table 34: International comparisons of active TB mortality numbers and rates per 100,000: 2016-2020
- Table 35: Incidence (per 100,000) of active TB by sex and jurisdiction, CTBRS: 2012-2021
- Table 36: End-stage renal disease prevalence among active TB cases by province/territory, CTBRS: 2021
- Table 37: Prevalence of abnormal chest X-ray among active TB cases by province/territory, CTBRS: 2021
- Table 38: Prevalence of long-term corticosteroid use among active TB cases by province/territory, CTBRS: 2021
- Table 39: Prevalence of contact with an active TB case in the last 2 years among active TB cases by province/territory, CTBRS: 2021
- Table 40: Prevalence of substance use among active TB cases by province/territory, CTBRS: 2021
- Table 41: Prevalence of recent history of travel to a country with high TB incidence among active TB cases by province/territory, CTBRS: 2021
- Table 42: Prevalence of recent incarceration among active TB cases by province/territory, CTBRS: 2021
- Table 43: Prevalence of recent homelessness among active TB cases by province/territory, CTBRS: 2021
- Table 44: Prevalence of transplant-related immunosuppression among active TB cases by province/territory, CTBRS: 2021
- Table 45: Drug-resistant active TB isolates by mono-resistance and by age, CTBLSS: 2012-2021
- Table 46: Drug-resistant active TB isolates by poly-resistance and by age, CTBLSS: 2012-2021
- Table 47: Drug-resistant active TB isolates by multi-drug resistance and by age, CTBLSS: 2012-2021
- Table 48: Drug-resistant active TB isolates by extensive drug resistance and by age, CTBLSS: 2012-2021
List of Figures
- Figure 1: Number and incidence of active TB (per 100,000), CTBRS: 2012-2021
- Figure 2: Incidence of active TB (per 100,000) by province/territory, CTBRS: 2012-2021
- Figure 3: Incidence of active TB (per 100,000) by sex, CTBRS: 2012- 2021
- Figure 4: Incidence of active TB (per 100,000) by age (in years), CTBRS: 2012-2021
- Figure 5: Incidence of active TB (per 100,000) by age (in years) and sex, CTBRS: 2021
- Figure 6: Proportion of active TB cases by population group, CTBRS: 2021
- Figure 7: Active TB cases by population group, CTBRS: 2012-2021
- Figure 8: Incidence of active TB (per 100,000) by population group, CTBRS: 2012-2021
- Figure 9: Number (9a) and incidence (9b) of active TB in Indigenous Peoples, CTBRS: 2012-2021
- Figure 10: Incidence of active TB (per 100 000) in Indigenous Peoples by sex, CTBRS: 2012-2021
- Figure 11: Incidence (per 100,000) of active TB by WHO region of birth, CTBRS: 2012-2021
- Figure 12: Description of active TB by citizenship and immigration status, CTBRS: 2021
- Figure 13: Prevalence of risk factors among active TB cases, where risk factor status is known, CTBRS: 2021
- Figure 14: Methods of detection for active TB, CTBRS: 2021
- Figure 15: Drug susceptibility testing for Mycobacterium tuberculosis isolates from active TB cases, CTBLSS: 2021
- Figure 16: Proportion of drug resistance by population group, CTBRS: 2012-2021
- Figure 17: TB case fatality rate, CTBRS: 2011-2020
- Figure 18: TB case fatality rate by sex, CTBRS: 2011-2020
- Figure 19: TB case fatality rate by age (in years), CTBRS: 2011-2020
- Figure 20: Number of TB-related deaths by population group, CTBRS: 2011-2020
- Figure 21: Case fatality rate by population group, CTBRS: 2011-2020
- Figure 22: Incidence (per 100,000) of active TB for females by age (in years), CTBRS: 2012-2021
- Figure 23: Incidence (per 100,000) of active TB for males by age (in years), CTBRS: 2012-2021
- Figure 24: Newfoundland and Labrador case detection, CTBRS: 2012-2021
- Figure 25: Prince Edward Island case detection, CTBRS: 2012-2021
- Figure 26: New Brunswick case detection, CTBRS: 2012-2021
- Figure 27: Nova Scotia case detection, CTBRS: 2012-2021
- Figure 28: Quebec case detection, CTBRS: 2012-2020
- Figure 29: Ontario case detection, CTBRS: 2012-2021
- Figure 30: Manitoba case detection, CTBRS: 2012-2021
- Figure 31: Saskatchewan case detection, CTBRS: 2012-2021
- Figure 32: Alberta case detection, CTBRS: 2012-2021
- Figure 33: British Columbia case detection, CTBRS: 2012-2021
- Figure 34: Yukon case detection, CTBRS: 2012-2021
- Figure 35: Northwest Territories case detection, CTBRS: 2012-2021
- Figure 36: Nunavut case detection, CTBRS: 2012-2021
Glossary
- AB
- Alberta
- BC
- British Columbia
- BCG
- Bacillus Calmette-Guérin
- CFR
- Case fatality rate
- CIRNAC
- Crown-Indigenous Relations and Northern Affairs Canada
- COVID-19
- Coronavirus disease 2019
- CPHO
- Chief Public Health Officer
- CTBRS
- Canadian Tuberculosis Reporting System
- CTBLSS
- Canadian Tuberculosis Laboratory Surveillance System
- DM
- Diabetes Mellitus type 1 or 2
- EMR
- Eastern Mediterranean Region
- EU
- European Union
- FNIHB
- First Nations and Inuit Health Branch
- HIV
- Human immunodeficiency virus
- ICD
- International Classification of Diseases
- ISC
- Indigenous Services Canada
- LTBI
- Latent Tuberculosis Infection
- MB
- Manitoba
- MDR
- Multi-drug resistance
- MTB
- Mycobacterium tuberculosis
- NB
- New Brunswick
- NL
- Newfoundland & Labrador
- NML
- National Microbiology Laboratory
- NS
- Nova Scotia
- NU
- Nunavut
- NWT
- Northwest Territories
- ON
- Ontario
- PEI
- Prince Edward Island
- PHAC
- Public Health Agency of Canada
- PT
- Province or Territory
- QC
- Quebec
- SK
- Saskatchewan
- TB
- Tuberculosis
- UK
- United Kingdom
- USA
- United States of America
- WHO
- World Health Organization
- XDR
- Extensive drug resistance
- YT
- Yukon
Executive summary
Purpose of this report
This report describes trends in active tuberculosis (TB) cases in Canada, including patterns of drug resistance and outcomes, between 2012 to 2021, with a specific focus on 2021.
Context
The Public Health Agency of Canada (PHAC) and Health Canada are collaborating with provincial and territorial governments and other federal departments and agencies to reduce the incidence of TB in Canada to less than or equal to one case per 100,000 population by 2035, as set by the World Health Organization (WHO)'s Towards TB Elimination: an action Framework in low-incidence countriesFootnote 1. This report examines trends in TB incidence in Canada for the decade ending in 2021. Reporting to the Canadian Tuberculosis Reporting System (CTBRS) was less complete in 2020 and 2021 compared with previous years, possibly related to the diversion of resources during the coronavirus disease 2019 (COVID-19) pandemic, consequently the data presented for this time-period should be interpreted with caution. This information may change in subsequent reports once information is updated retrospectively.
Results
The overall incidence of active TB in Canada in 2021 was 4.8 per 100,000 (1,829 cases). This is consistent with rates reported over the 2012-2021 surveillance period, which have ranged from 4.6 to 5.1 per 100,000.
In 2021, over three quarters of cases (78.8%; n=1,442/1,829) were residents of Ontario (n=683), British Columbia (n=289), Alberta (n=241) and Quebec (n=229). The highest incidence of active TB cases (191.4 per 100,000; n=76) was reported in Nunavut, followed by Manitoba (11.0 per 100,000; n=153) and Saskatchewan (10.3 per 100,000; n=122).
The incidence of active TB in males (5.3 per 100,000; n=998) continued to be higher in comparison to females (4.3 per 100,000; n=825). Examining TB incidence by age, persons older than 75 years had the highest incidence in 2021 at 8.1 per 100,000, followed by persons aged 25 to 34 at 6.8 per 100,000.
Indigenous Peoples remained disproportionately impacted by TB in Canada in 2021 with an overall incidence of 16.6 per 100,000, compared to 0.3 per 100,000 for the non-Indigenous Canadian born population. Among Indigenous Peoples, the highest rates in 2021 were observed among Inuit (135.1 per 100,000) followed by First Nations (16.1 per 100,000) and Métis (2.1 per 100,000). On-reserve First Nations had a higher incidence (23.4 per 100,000) compared to off-reserve populations (10.4 per 100,000). Although the incidence of TB in the Métis is below the Canadian incidence of 4.8 per 100,000, the majority of cases (90.0%; n=9/10) were clustered in Saskatchewan, corresponding to an incidence of 13.4 per 100,000 for Métis in that province. In 2021, the majority of Inuit cases resided in Nunavut (75.0%; n=75/100), while the majority of First Nations cases resided in Manitoba and Saskatchewan (85.6%; n=119/139).
In 2021, 86% (n=1,376/1,600) of cases reported on population group. Among these cases, three quarters (76.7%; n=1,055/1,376) of active TB cases were among individuals born outside of Canada. The incidence in this population was 12.3 per 100,000. The majority (73.2%; n=773/1,055) of cases among individuals born outside of Canada arose from the Western Pacific Region and South-East Asia Region using the WHO regions (Appendix A). Information on immigration status was available for 56.0% (n=591/1,055) of TB cases born outside Canada. Of these, 70.7% (n=418/591) were Canadian citizens or permanent residents, 27.2% (n=161/591) were temporary visitors (tourists or visitors, students, and temporary workers), and 2.0% (n=12/591) were refugees or refugee claimants.
Regarding risk factors for TB, among cases where risk factor status was reported, the most prevalent risk factors in 2021 were: travel to a high-incidence TB country two years prior to diagnosis (37.7%; n=136/361), having diabetes type 1 or 2 (27.9%; n=159/569), and contact with a TB case (22.9%; n=128/560). The prevalence of human immunodeficiency virus (HIV) among TB cases was 5.1% (n=38/742). Reporting on risk factors was poor; missing data ranged from 53.6% to 82.5%. The data therefore should be interpreted with caution.
The majority of TB cases (71.6%; n=1,145/1,600) reported in 2021 were detected passively through symptoms or incidental findings consistent with active TB disease presentation. The remaining cases were identified actively through contact investigation (6.9%; n=111/1,600), screening (3.5%; n=56/1,600) and immigration medical surveillance (3.3%; n=53/1,600). None were identified through post-mortem screening. Re-treatment cases (cases who had previously received treatment for TB and are experiencing a recurrence of the disease) were identified in 3.6% (n=58/1,600) of active TB cases.
About two thirds (72.1%; n=1,154/1,600) of cases were respiratory TB, of which pulmonary TB was most common (91.2%; n=1,052). Among cases with non-respiratory TB (27.3%; n=436/1,600), the most frequent site involved was the peripheral lymph nodes (45.7%; n=199). Across all population groups, pulmonary TB was the most common type of active TB diagnosed.
During the reporting time period, the proportion of cases that were culture positive remained consistent ranging from 87% to 91%.
Drug susceptibility testing was submitted for 85.0% (n=1,555/1,829) of cases in 2021, with the remaining cases assumed to be clinically diagnosed. Mono-, poly-, and multi-drug resistance (MDR) were detected in 8.5% (n=131/1,536), 0.3% (n=4/1,536), and 1.0% (n=16/1,536) of the isolates, respectively. Only one case (0.1%) of extensively drug resistant (XDR) TB was reported. Population specific rates of resistance were highest among the non-Indigenous Canadian born population at 14% (n=7/50). The rate was 6.1% (n=64/1,055) among persons born outside of Canada and it was lowest among Indigenous groups (overall) at 0.9% (n=2/232).
In terms of treatment outcomes, in 2020, treatment was successful for three quarters of all incident active TB cases (76.1%; n=1,181/1,551). This is likely an underestimate of the true treatment success as it does not include cases still undergoing treatment and transfers between jurisdictions. Treatment failure was low occurring in 0.3% (n=5/1,551) of cases. At the time of data collection, 4.7% (n=73/1,551) of cases were still undergoing treatment, and 9.4% (n=146/1,551) were not evaluated.
In 2020, the overall case fatality rate (CFR) was 5.0%, with TB reported as either the underlying or contributing cause of death in 63.9% (n=78/122) of deaths. The majority (75.4%; n=57/78) of deaths occurred in individuals aged 65 years and older. The CFR was highest among First Nations at 7.4%, followed by individuals born outside of Canada at 4.8% and the non-Indigenous Canadian born population at 1.9%.
Conclusion
From 2012 to 2021, the annual incidence of active TB in Canada remained stable. In contrast to global trends, which showed a 2% annual decrease until 2021 when it increased 3.6% relative to 2020, Canada did not experience a decline in incidence over timeFootnote 2. The impacts of the global COVID-19 pandemic on TB in Canada will require additional monitoring in future years to be fully understood. However, trends among populations in Canada who are disproportionately impacted by TB remained consistent. The majority of active TB cases continued to occur among individuals born outside Canada and, by incidence, First Nations and Inuit populations continued to be the most disproportionately impacted. Achieving TB elimination in Canada will require a cross jurisdictional TB Elimination framework along with a multi-pronged approach, as noted in the 2018 Chief Public Health Officer (CPHO) report, The Time is NowFootnote 3 and the Towards TB Elimination framework of the WHOFootnote 1. This approach requires ongoing collaboration and coordination of TB surveillance and programmatic areas across jurisdictions, and sustained community engagement by all levels of government.
Introduction
Tuberculosis was the leading cause of mortality globally due to a single infectious agent until the COVID-19 pandemicFootnote 2. The WHO estimates that the diagnosis and successful treatment of TB have saved 66 million lives during the last two decades; however, persistent gaps in detection and treatment remain especially evident due to the COVID-19 pandemic placing strain on essential TB services. Of the estimated ten million people globally who developed active TB in 2020, the WHO estimates that only 5.8 million were officially reported to national authoritiesFootnote 4.
In 2015, The End TB Strategy of the WHO established a target of a 90% global reduction in TB incidence rates and a 95% reduction in TB-related deaths by 2035Footnote 5. Adapting the Strategy's targets to the specific needs of each country will require ongoing monitoring and evaluation. In Towards TB elimination: An action framework for low-incidence countries, the WHO provided guidance on how to reduce active TB rates toward elimination levels (defined as 0.1 cases per 100,000 individuals) for countries that were already reporting an incidence of less than 10 TB cases per 100,000 in 2015 and earlierFootnote 1. This major commitment to end the global burden of TB includes multiple key priorities, such as government stewardship and accountability.
As a whole, Canada meets the criteria of a low-incidence country for TB disease because its national rate of active TB (4.8 per 100,000 in 2021) has not exceeded 10 per 100,000 in the last decade. However, in some Canadian population groups (e.g., Inuit, First Nations and people born outside of Canada) and geographical locations (e.g., Nunavut) TB incidence is consistently higher than this threshold.
This report provides an update on progress towards TB elimination with a descriptive overview of active TB cases in Canada between 2012 and 2021, and TB treatment outcomes from 2011 to 2020, focusing on the most recent year of available data. These data are stratified by geography, age, sex, population group, risk factors, clinical characteristics, resistance to TB treatment and outcomes.
Methods
Data collection
PHAC, in collaboration with provincial and territorial public health authorities, monitors TB in Canada through the CTBRS, a national case-based surveillance system that collects and maintains non-nominal data on persons diagnosed with active TB. Active TB occurs when Mycobacterium tuberculosis (MTB) causes an infection, either through primary infection or reactivation of latent TB, usually affecting the lungs, although other organs or systems may be involved. For surveillance purposes, cases of active TB are either laboratory confirmed or clinically diagnosed and are defined as followsFootnote 6:
Laboratory confirmed TB case:
- A person for whom laboratory testing has detected Mycobacterium tuberculosis complex (excluding bovis Bacillus Calmette-Guérin (BCG) strain) on culture
OR
- A person for whom laboratory testing has detected Mycobacterium tuberculosis complex (excluding bovis BCG strain) by nucleic acid amplification testing and with clinical findings consistent with TB disease.
Clinically diagnosed TB case:
- A person for whom microbiological confirmation of active TB is absent and who meets one or more of the following criteria:
- Signs or symptoms clinically compatible with active TB (respiratory or non-respiratory);
- Diagnostic imaging findings compatible with active TB (respiratory or non-respiratory imaging);
- Pathologic evidence of active TB (e.g., compatible histopathology, positive Acid-Fast Bacteria staining);
- Post-mortem evidence of active TB;
- Favourable response to a therapeutic trial of tuberculosis drugs.
Cases that meet this definition are submitted to the CTBRS by the respective PT (province or territory) public health authorities on a voluntary basis (see Appendix B and C for report forms). Information is additionally collected for the following variables:
- Diagnostic classification based on the disease site (respiratory or non-respiratory)
- Demographic data (age, sex, population group, country of birth, and place of residence)
- Clinical information (medical co-morbidity: HIV, diabetes, end-stage renal disease, abnormal chest X-ray, transplant-related immunosuppression, and corticosteroid use)
- Selected social determinants of health (e.g., housing and substance use)
- Other potential risk factors (e.g., contact with active TB, travel history to a high burden TB country, history of incarceration, etc.)
Active TB is classified as either respiratory or non-respiratory. Respiratory TB includes infection of the lungs and conducting airways (pulmonary), intrathoracic or mediastinal lymph nodes, larynx, nasopharynx, nose or sinusesFootnote 7. Pulmonary TB is the most common form of respiratory TB and includes tuberculous fibrosis of the lung, tuberculous bronchiectasis, tuberculous pneumonia and tuberculous pneumothorax, isolated tracheal or bronchial TB, and tuberculous laryngitisFootnote 7. Non-respiratory TB includes all other disease sites (the peripheral lymph nodes, central nervous system and meninges, intestines, peritoneum and mesenteric glands, bones and joints, genitourinary system, miliary, eyes, etc.)Footnote 7.
Due to the disease course and time required for TB treatment, data on treatment outcomes are submitted to the CTBRS one year (one reporting cycle) following the submission of the initial case report of incident TB. When treatment is still ongoing at the time of this second data submission, the reporting jurisdiction submits an interim report followed by subsequent annual updates until the case file is resolved or closed. Updated data from previous years are always reflected in the most current surveillance report. The surveillance definition of treatment success includes cured (i.e., culture-negative at the end of treatment) or completion of the prescribed course of TB treatment. Treatment failure is defined as having a positive sputum culture after four or more months of treatment or two positive sputum cultures in different months during the last three months of treatment, or treatment discontinued due to an adverse event. Cases with treatment outcome of 'not evaluated' includes cases who specified treatment outcome as other, unknown, or transferred. WHO definitions were used to calculate this indicatorFootnote 8.
Antimicrobial resistance data were captured through the Canadian Tuberculosis Laboratory Surveillance System (CTBLSS). All MTB complex isolates are sent to PT laboratories or the National Microbiology Laboratory (NML) (Atlantic region and Manitoba) for drug susceptibility testing using culture-based, phenotypic methods. Following the initial testing for susceptibility to first-line TB drugs, isolates that demonstrate resistance undergo subsequent testing to determine their susceptibility to second-line TB medications. Resistant isolates are classified as follows:
- Mono-resistance, defined as resistance to one first-line anti-TB drug only (isoniazid, rifampin, ethambutol or pyrazinamide).
- Poly-resistance, defined as resistance to more than one first-line anti-TB drug, not including the combination of isoniazid and rifampin.
- MDR, defined as resistance to isoniazid and rifampin with or without resistance to other TB drugs.
- XDR, defined as resistance to first-line agents (isoniazid and rifampicin), and any fluoroquinolone, and one or more second-line injectable drugs (amikacin, kanamycin, or capreomycin).
Note that even though a new WHO definition for XDR was introduced in 2021, this report used the previous definition, as the collection of laboratory data required to meet the new definition began in 2023Footnote 9.
Together with basic non-nominal demographic data (sex, age, and PT of residence), the results of culture-based, phenotypic drug susceptibility testing of isolates from active TB cases are submitted voluntarily to the CTBLSS by provincial TB laboratories every year. The present report covers the 10-year period from 2012 to 2021.
Latent TB infection (LTBI) is not nationally notifiable, and not reported through either the CTBLSS or CTBRS surveillance systems and therefore, is not included in this report.
Data analysis
The incidence of active TB was calculated as the number of cases per 100,000 population. Denominator data used to calculate these rates came from multiple sources. Canadian population data were based on midyear estimates of the Canadian population from Statistics CanadaFootnote 10. For persons born outside Canada, data were obtained from population projections based on the most recent Canadian CensusFootnote 11. Denominators for First Nations, Métis and Inuit were obtained from Statistics Canada Projections of Indigenous Households in Canada, 2016 to 2041Footnote 12 ,Footnote 13.
Data received from the PTs were maintained according to PHAC's unpublished Directive for the Collection, Use and Dissemination of Information Relating to Public HealthFootnote 14. Data were cleaned and analyzed using SASTM Enterprise Guide and MicrosoftTM Excel 2016. No statistical procedures were used for comparative analyses, nor were any statistical techniques applied to account for missing data.
It should be noted that some analyses do not include all provinces and territories due to missing data. British Columbia has not submitted Indigenous identity information for TB cases since 2016. Since that time, cases from British Columbia have been reported as being born in Canada or born outside Canada. For Quebec, 2021 data were not available at the time of analysis for certain variables. In agreement with Quebec, data for these variables were not included in this report.
Data updates
Data in this report are considered provisional and may be subject to change in future TB surveillance reports. If there are discrepancies between the data summarized in this report and provincial and territorial reports, the most recent provincial and territorial report should be used because updated national data may still be pending.
Results
Overall epidemiology: Tuberculosis (TB) in Canada
In 2021, there were 1,829 people in Canada diagnosed with active TB, corresponding to an incidence rate of 4.8 per 100,000 (Figure 1). Between 2012 and 2021 the number of new cases per year ranged from 1,615 to 1,921, however the incidence remained relatively stable (from 4.6 per 100,000 to 5.1 per 100,000).
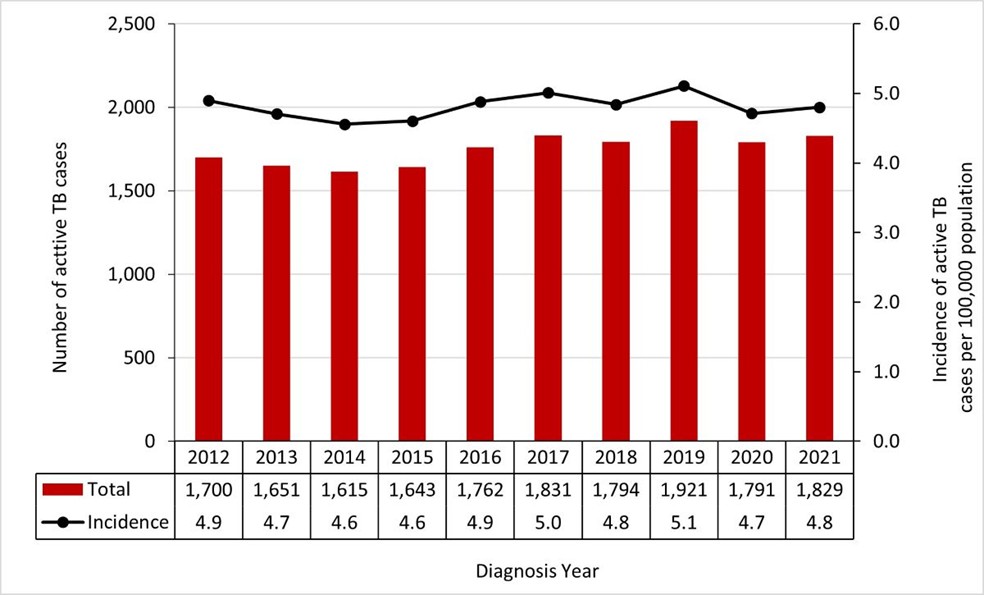
Figure 1 - Text description
| no data | 2012 | 2013 | 2014 | 2015 | 2016 | 2017 | 2018 | 2019 | 2020 | 2021 |
|---|---|---|---|---|---|---|---|---|---|---|
| Number of active TB cases | 1,700 | 1,651 | 1,615 | 1,643 | 1,762 | 1,831 | 1,794 | 1,921 | 1,791 | 1,829 |
| Incidence of active TB cases per 100,000 population | 4.9 | 4.7 | 4.6 | 4.6 | 4.9 | 5.0 | 4.8 | 5.1 | 4.7 | 4.8 |
Geography
In 2021, four provinces (Ontario, British Columbia, Alberta, and Quebec) accounted for the majority of active TB cases (78.8%; n=1,442/1,829). The incidence of active TB in Manitoba (11.0 per 100,000) and Saskatchewan (10.3 per 100,000) was approximately twice the national TB incidence, while in the Atlantic provinces, incidence rates (range: 1.0 to 1.7 per 100,000) were below the national level of 4.8 per 100,000. Similar to previous years, the incidence of active TB in 2021 continued to be highest in Nunavut (191.4 per 100,000), which was markedly higher than any other PT (Table 1).
Provincial and territorial TB trends have remained stable for the most part over the surveillance period. Overall, a slight increase was observed in Saskatchewan (Table 2; Figure 2), and the number of cases in the Atlantic region has remained low.
| Jurisdiction | Total | ||
|---|---|---|---|
| n | % | Incidence | |
| NL | 9 | 0.5% | 1.7 |
| PEI | 2 | 0.1% | 1.2 |
| NS | 12 | 0.7% | 1.2 |
| NB | 8 | 0.4% | 1.0 |
| QC | 229 | 12.5% | 2.7 |
| ON | 683 | 37.3% | 4.6 |
| MB | 153 | 8.4% | 11.0 |
| SK | 122 | 6.7% | 10.3 |
| AB | 241 | 13.2% | 5.4 |
| BC | 289 | 15.8% | 5.6 |
| YT | 1 | 0.1% | 2.3 |
| NWT | 4 | 0.2% | 8.8 |
| NU | 76 | 4.2% | 191.4 |
| Canada | 1,829 | 100% | 4.8 |
Notes: NL Newfoundland and Labrador; PEI, Prince Edward Island; NS, Nova Scotia, NB; New Brunswick; QC, Quebec; ON, Ontario; MB, Manitoba; SK, Saskatchewan; AB, Alberta; BC, British Columbia; YT, Yukon; NWT, Northwest Territories; NU Nunavut. |
|||
| Jurisdiction | 2012 | 2013 | 2014 | 2015 | 2016 | 2017 | 2018 | 2019 | 2020 | 2021 |
|---|---|---|---|---|---|---|---|---|---|---|
| NL | 4 | 13 | 7 | 33 | 24 | 13 | 30 | 14 | 11 | 9 |
| PEI | 1 | 0 | 3 | 3 | 4 | 0 | 1 | 4 | 3 | 2 |
| NS | 8 | 8 | 7 | 6 | 3 | 9 | 8 | 5 | 12 | 12 |
| NB | 5 | 3 | 5 | 6 | 12 | 8 | 6 | 11 | 9 | 8 |
| QC | 271 | 240 | 207 | 244 | 252 | 217 | 275 | 290 | 240 | 229 |
| ON | 618 | 634 | 585 | 597 | 641 | 676 | 659 | 742 | 675 | 683 |
| MB | 136 | 166 | 135 | 158 | 201 | 187 | 187 | 180 | 146 | 153 |
| SK | 89 | 86 | 88 | 70 | 91 | 94 | 79 | 66 | 102 | 122 |
| AB | 195 | 187 | 217 | 210 | 238 | 227 | 222 | 245 | 251 | 241 |
| BC | 286 | 257 | 269 | 264 | 238 | 288 | 264 | 304 | 300 | 289 |
| YT | 1 | 2 | 4 | 3 | 1 | 8 | 3 | 1 | 1 | 1 |
| NWT | 6 | 4 | 4 | 5 | 3 | 3 | 3 | 5 | 7 | 4 |
| NU | 80 | 51 | 84 | 44 | 54 | 101 | 57 | 54 | 34 | 76 |
| Canada | 1,700 | 1,651 | 1,615 | 1,643 | 1,762 | 1,831 | 1,794 | 1,921 | 1,791 | 1,829 |
| Notes: NL Newfoundland and Labrador; PEI, Prince Edward Island; NS, Nova Scotia, NB; New Brunswick; QC, Quebec; ON, Ontario; MB, Manitoba; SK, Saskatchewan; AB, Alberta; BC, British Columbia; YT, Yukon; NWT, Northwest Territories; NU Nunavut. | ||||||||||
Figure 2: Incidence of active TB (per 100,000) by province/territory, CTBRS: 2012-2021
Figure 2a: Provinces and territories with incidence lower than the Canadian average (NL, PEI, NS, NB, QC, ON, Canada)

Note: NL, Newfoundland and Labrador; PEI, Prince Edward Island; NS, Nova Scotia; NB New Brunswick; QC, Quebec; ON, Ontario.
Figure 2b: Provinces and territories with incidence higher than the Canadian average (NU, MB, SK, AB, BC, YT, NWT, Canada)

Note: NU, Nunavut; MB, Manitoba; SK, Saskatchewan; AB, Alberta; BC British Columbia; YT, Yukon; NWT, Northwest Territories.
Figure 2 - Text description
| Jurisdiction | 2012 | 2013 | 2014 | 2015 | 2016 | 2017 | 2018 | 2019 | 2020 | 2021 |
|---|---|---|---|---|---|---|---|---|---|---|
| Nunavut | 230.7 | 144.3 | 233.5 | 120.6 | 146.0 | 269.0 | 149.4 | 139.9 | 86.8 | 191.4 |
| Newfoundland | 0.8 | 2.5 | 1.3 | 6.2 | 4.5 | 2.5 | 5.7 | 2.7 | 2.1 | 1.7 |
| Prince Edward Island | 0.7 | 0.0 | 2.1 | 2.1 | 2.7 | 0.0 | 0.7 | 2.5 | 1.9 | 1.2 |
| Nova Scotia | 0.8 | 0.9 | 0.7 | 0.6 | 0.3 | 0.9 | 0.8 | 0.5 | 1.2 | 1.2 |
| New Brunswick | 0.7 | 0.4 | 0.7 | 0.8 | 1.6 | 1.0 | 0.8 | 1.4 | 1.1 | 1.0 |
| Quebec | 3.4 | 3.0 | 2.5 | 3.0 | 3.1 | 2.6 | 3.3 | 3.4 | 2.8 | 2.7 |
| Ontario | 4.6 | 4.7 | 4.3 | 4.4 | 4.6 | 4.8 | 4.6 | 5.1 | 4.6 | 4.6 |
| Manitoba | 10.9 | 13.1 | 10.6 | 12.2 | 15.3 | 14.0 | 13.8 | 13.1 | 10.6 | 11.0 |
| Saskatchewan | 8.2 | 7.8 | 7.9 | 6.2 | 8.0 | 8.2 | 6.8 | 5.6 | 8.7 | 10.3 |
| Alberta | 5.0 | 4.7 | 5.3 | 5.1 | 5.7 | 5.4 | 5.2 | 5.6 | 5.7 | 5.4 |
| British Columbia | 6.3 | 5.6 | 5.7 | 5.5 | 4.9 | 5.8 | 5.3 | 6.0 | 5.8 | 5.6 |
| Yukon | 2.8 | 5.5 | 10.8 | 8.0 | 2.6 | 20.2 | 7.4 | 2.4 | 2.4 | 2.3 |
| Northwest Territories | 13.7 | 9.1 | 9.1 | 11.3 | 6.7 | 6.7 | 6.7 | 11.1 | 15.4 | 8.8 |
Demographics
1. Distribution of active TB cases by sex and age
In 2021, the incidence of active TB among males was higher (5.3 per 100,000) compared with females (4.3 per 100,000). This difference between males and females has been consistently observed over time as illustrated in Figure 3, and persists across PT jurisdictions, by population group and other variables presented in this report.
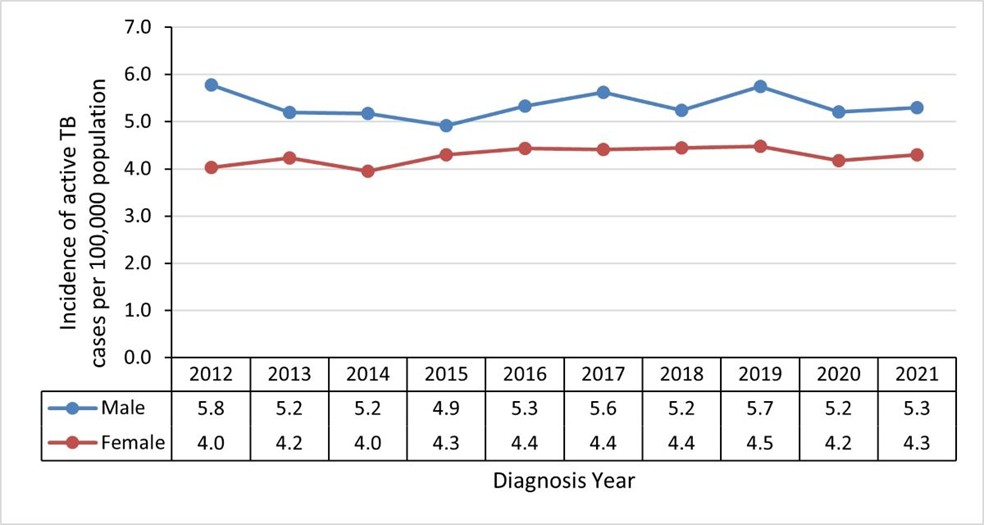
Figure 3 - Text description
| Sex | 2012 | 2013 | 2014 | 2015 | 2016 | 2017 | 2018 | 2019 | 2020 | 2021 |
|---|---|---|---|---|---|---|---|---|---|---|
| Male | 5.8 | 5.2 | 5.2 | 4.9 | 5.3 | 5.6 | 5.2 | 5.7 | 5.2 | 5.3 |
| Female | 4.0 | 4.2 | 4.0 | 4.3 | 4.4 | 4.4 | 4.4 | 4.5 | 4.2 | 4.3 |
Examining TB incidence by age in 2021, individuals 75 years and older had the highest incidence of active TB at 8.1 per 100,000 (Figure 4). The second highest incidence was observed in the 25-to-34-year age group at 6.8 per 100,000, followed by 5.8 per 100,000 for the 15-to-24-year age group. The gap in incidence between males and females was larger for age groups over 45 years relative to younger age groups (Figure 5). The incidence was lowest among pediatric cases: 1.2 per 100,000 among persons aged 5 to 14 years and 2.1 per 100,000 for those under the age of 5. Age-specific incidence rates have been relatively stable over the 10-year surveillance period except for a small increase observed for persons aged 15 to 24 years, from 4.3 per 100,000 in 2014 to 5.8 per 100,000 in 2021. There was also a decrease between 2012 and 2021 in older age groups: a decline from 6.3 per 100,000 to 4.7 per 100,000 among persons aged 65 to 74 years and a decline from 9.3 per 100,000 to 8.1 per 100,000 for those aged 75 years and older (Figure 4).
The proportion of active TB cases occurring by age group has changed minimally over the 10-year surveillance period. In 2021, the majority of cases (95.1%; n=1,741/1,829) occurred in individuals 15 years of age or older, with pediatric cases (<15 years) accounting for less than 5% of cases nationally (Table 3). While the highest incidence of TB was observed in persons aged 75 and older, a larger proportion of cases were reported in younger age groups in 2021 (20.0%, n=365/1,829 for persons aged 25 to 34 years, 14.9%, n=272/1,829 for persons aged 35 to 44 years, and 14.3%, n=262/1,829 for persons aged 15 to 24 years) (Table 3).

Figure 4 - Text description
| Age group in years | 2012 | 2013 | 2014 | 2015 | 2016 | 2017 | 2018 | 2019 | 2020 | 2021 |
|---|---|---|---|---|---|---|---|---|---|---|
| <5 | 3.1 | 2.6 | 2.3 | 2.6 | 2.5 | 2.9 | 2.6 | 2.5 | 1.8 | 2.1 |
| 5-14 | 1.4 | 1.6 | 0.9 | 1.2 | 1.0 | 1.7 | 1.2 | 1.6 | 0.8 | 1.2 |
| 15-24 | 5.2 | 4.6 | 4.3 | 4.4 | 5.1 | 5.5 | 5.3 | 6.1 | 6.5 | 5.8 |
| 25-34 | 6.2 | 5.6 | 5.9 | 5.7 | 6.9 | 6.3 | 6.3 | 6.7 | 6.3 | 6.8 |
| 35-44 | 5.8 | 5.2 | 5.1 | 5.2 | 5.2 | 5.6 | 5.2 | 5.3 | 5.1 | 5.3 |
| 45-54 | 4.3 | 4.5 | 4.2 | 4.1 | 3.9 | 4.2 | 4.4 | 4.8 | 4.5 | 4.6 |
| 55-64 | 3.4 | 4.1 | 4.2 | 3.8 | 3.9 | 3.8 | 3.9 | 4.0 | 3.8 | 3.6 |
| 65-74 | 6.3 | 5.7 | 5.2 | 5.3 | 5.5 | 5.6 | 5.2 | 5.1 | 4.3 | 4.7 |
| 75+ | 9.3 | 9.3 | 9.6 | 10.2 | 10.7 | 10.4 | 9.7 | 9.4 | 8.1 | 8.1 |
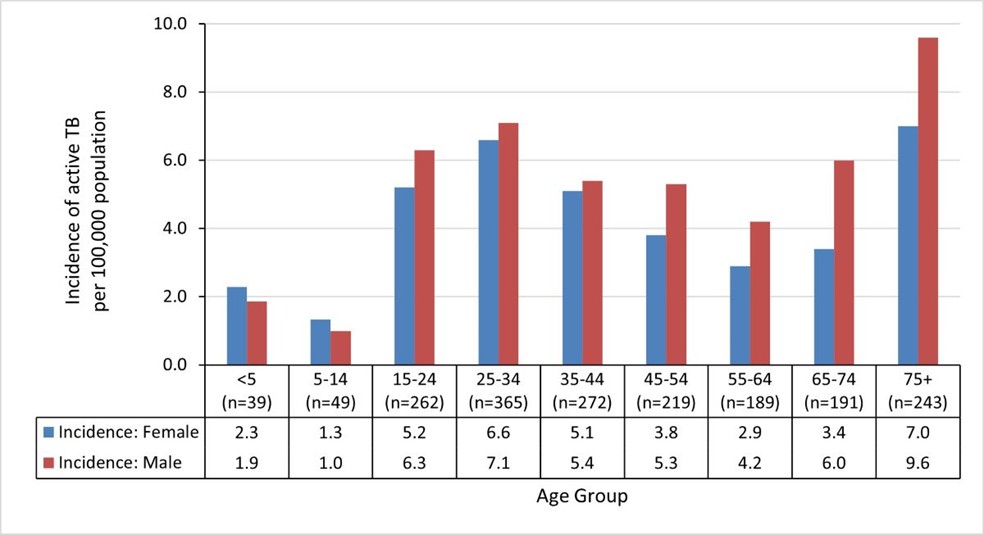
Figure 5 - Text description
| Sex | Age Group in years (number of cases in each age group) | ||||||||
|---|---|---|---|---|---|---|---|---|---|
| <5 (n=39) |
5-14 (n=49) |
15-24 (n=262) |
25-34 (n=365) |
35-44 (n=272) |
45-54 (n=219) |
55-64 (n=189) |
65-74 (n=191) |
75+ (n=243) |
|
| Incidence: Female | 2.3 | 1.3 | 5.4 | 6.6 | 5.1 | 3.8 | 2.9 | 3.4 | 7.0 |
| Incidence: Male | 1.9 | 1.0 | 6.3 | 7.1 | 5.4 | 5.3 | 4.2 | 6.0 | 9.6 |
| Age (in years) | Male | Female | Unknown sex | Total | |||
|---|---|---|---|---|---|---|---|
| n | % | n | % | n | n | % | |
| <5 | 18 | 1.8% | 21 | 2.5% | 0 | 39 | 2.1% |
| 5-14 | 21 | 2.1% | 27 | 3.3% | 1 | 49 | 2.7% |
| 15-24 | 147 | 14.7% | 113 | 13.7% | 2 | 262 | 14.3% |
| 25-34 | 193 | 19.3% | 170 | 20.6% | 2 | 365 | 20.0% |
| 35-44 | 140 | 14.0% | 131 | 15.9% | 1 | 272 | 14.9% |
| 45-54 | 126 | 12.6% | 93 | 11.3% | 0 | 219 | 12.0% |
| 55-64 | 110 | 11.0% | 79 | 9.6% | 0 | 189 | 10.3% |
| 65-74 | 119 | 11.9% | 72 | 8.7% | 0 | 191 | 10.4% |
| ≥75 | 124 | 12.4% | 119 | 14.4% | 0 | 243 | 13.3% |
| Canada | 998 | 100% | 825 | 100% | 6 | 1,829 | 100% |
| Notes: Proportions presented are based on total male, female, or overall case counts. | |||||||
2. Distribution of active TB cases by population group
In 2021, information regarding population group was reported for 1,376 (86.0%; n=1,376/1,600) incident active TB cases. Over three quarters of cases (76.7%; n=1,055/1,376) were diagnosed among people born outside Canada (Figure 6). Indigenous Peoples represented 16.9% (n=232/1,376) of cases and non-Indigenous Canadian born persons represented 3.6% (n=50/1,376). A further 2.8% (n=39/1,376) of cases were reported as born in Canada, but no further information on the population group was reported.

Figure 6 - Text description
| Population group | Number of cases | Percentage |
|---|---|---|
| Individuals born outside of Canada | 1,055 | 76.7% |
| Indigenous Peoples | 232 | 16.9% |
| Non-Indigenous Canadian born | 50 | 3.6% |
| Canadian-born unspecified Indigenous identity | 39 | 2.8% |
Note: 2021 data were not available for Quebec population groups. |
||
Note: 2021 data were not available for Quebec population groups.
2016-2021 data were not available for British Columbia Indigenous identity and the non-Indigenous Canadian born.
Proportions presented are based on cases that reported population group.
An overall decline was observed in the number of TB cases for all three population groups over the surveillance period (Figure 7). This is in part due to the exclusion of cases from Quebec in 2021 and possible outbreaks in 2012 in Indigenous populations. Individuals born outside of Canada accounted for 1,112 cases in 2012 and 1,055 cases in 2021. The highest number of active TB cases was observed in 2014 (n=1,427). Similar trends were observed for Indigenous Peoples and non-Indigenous Canadian born population as shown in Figure 7. In this latter group, there was an overall decline in the total number of TB cases (from 174 cases in 2012 compared to 50 cases in 2021) (Figure 7).
In 2021 the incidence of active TB for individuals born outside of Canada was 12.3 per 100,000. This rate was slightly lower than in previous years, which was possibly due to an update to the denominator used for this calculation and exclusion of Quebec. However, for the previous nine years the incidence remained relatively stable ranging from 14.3 per 100,000 in 2014 to 15.9 per 100,000 in 2019 (Figure 8).
Among Indigenous Peoples, there was an overall decrease in the incidence of active TB between 2012 and 2021 from 24.4 per 100,000 to 16.6 per 100,000 (Figure 8). A decline in incidence was observed for the non-Indigenous Canadian born population from 0.7 per 100,000 to 0.3 per 100,000 during the reporting period (Figure 8).
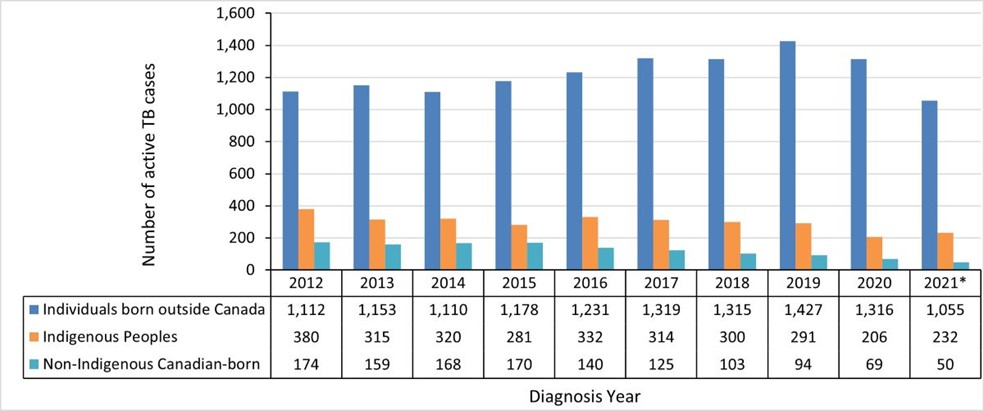
Figure 7 - Text description
| Population group | 2012 | 2013 | 2014 | 2015 | 2016 | 2017 | 2018 | 2019 | 2020 | 2021Footnote * |
|---|---|---|---|---|---|---|---|---|---|---|
| Individuals born outside Canada | 1,112 | 1,153 | 1,110 | 1,178 | 1,231 | 1,319 | 1,315 | 1,427 | 1,316 | 1,055 |
| Indigenous Peoples | 380 | 315 | 320 | 281 | 332 | 314 | 300 | 291 | 206 | 232 |
| Non-Indigenous Canadian-born | 174 | 159 | 168 | 170 | 140 | 125 | 103 | 94 | 69 | 50 |
|
||||||||||
Notes: *2021 data were not available for Quebec population groups.
2016-2021 data were not available for British Columbia Indigenous identity and the non-Indigenous Canadian born.
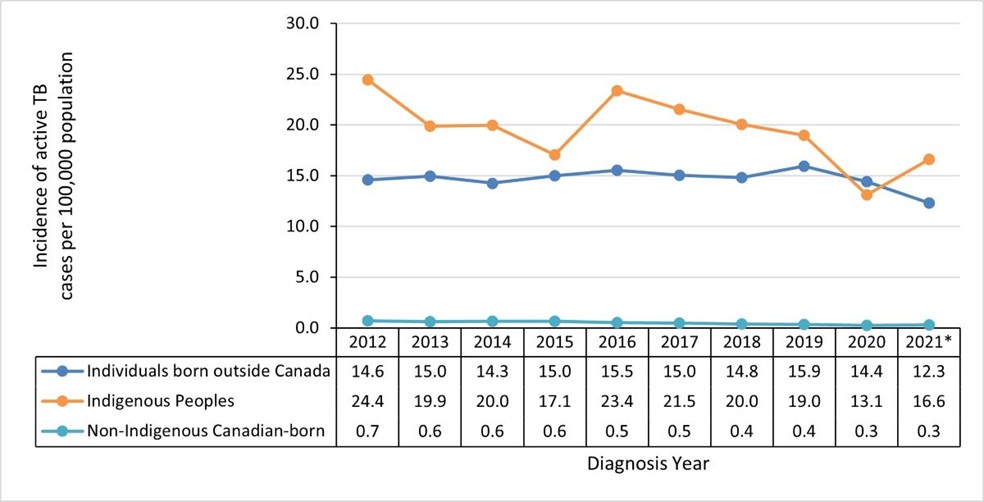
Figure 8 - Text description
| Population Group | 2012 | 2013 | 2014 | 2015 | 2016 | 2017 | 2018 | 2019 | 2020 | 2021Footnote * |
|---|---|---|---|---|---|---|---|---|---|---|
| Individuals born outside Canada | 14.6 | 15.0 | 14.3 | 15.0 | 15.5 | 15.0 | 14.8 | 15.9 | 14.4 | 12.3 |
| Indigenous Peoples | 24.4 | 19.9 | 20.0 | 17.1 | 23.4 | 21.5 | 20.0 | 19.0 | 13.1 | 16.6 |
| Non-Indigenous Canadian-born | 0.7 | 0.6 | 0.6 | 0.6 | 0.5 | 0.5 | 0.4 | 0.4 | 0.3 | 0.3 |
|
||||||||||
Notes: *2021 data were not available for Quebec population groups.
2016-2021 data were not available for British Columbia Indigenous identity and the non-Indigenous Canadian born.
TB in Indigenous Peoples
Over the surveillance period, higher case counts were consistently observed among First Nations and Inuit with fewer cases reported among the Métis (Figure 9a).
In 2021, the incidence of TB among Inuit was 135.1 per 100,000 (n=100). The substantial decrease in the incidence of TB from 188.7 per 100,000 (n=134) in 2019 to 81.9 per 100,000 (n=59) in 2020, and the subsequent increase to 135.1 per 100,000 (n=100) in 2021 are difficult to interpret given the potential impact of the COVID-19 pandemic on reporting and/or diagnosis of TB in these years. Further monitoring of these rates into the future will be required to determine the effects of COVID-19 on TB reporting and diagnosis. Between 2013 and 2018, incidence among Inuit fluctuated ranging from 139.4 to 188.7 per 100,000. Incidence was higher in 2012 at 251.6 per 100,000 potentially due to outbreaks (Figure 9b).
Among First Nations, a slight decline in incidence was observed over the surveillance period from 21.2 per 100,000 in 2012 to 16.1 per 100,000 in 2021 (Figure 9b). The incidence among the Métis has remained stable over the period of reporting, ranging from 2.1 per 100,000 in 2016 and 2021 to 3.7 per 100,000 in 2017 (Figure 9b). Among all Indigenous population groups, the incidence among males has been consistently higher than females over time (Figure 10).
Figure 9: Number (9a) and incidence (9b) of active TB in Indigenous Peoples, CTBRS: 2012-2021
Figure 9a: Number of active TB cases in Indigenous Peoples, CTBRS: 2012-2021

Figure 9a - Text description
| no data | 2012 | 2013 | 2014 | 2015 | 2016 | 2017 | 2018 | 2019 | 2020 | 2021Footnote * |
|---|---|---|---|---|---|---|---|---|---|---|
| First NationsFootnote * | 208 | 205 | 182 | 157 | 209 | 154 | 150 | 145 | 132 | 139 |
| Inuit | 161 | 92 | 119 | 112 | 113 | 142 | 136 | 134 | 59 | 100 |
| MétisFootnote * | 11 | 18 | 19 | 12 | 10 | 18 | 14 | 12 | 15 | 10 |
|
||||||||||
Notes: *2021 data were not available for Quebec population groups, except the Inuit population.
2016-2021 data were not available for British Columbia for Indigenous identity.
Figure 9b: Incidence of active TB (per 100 000) in Indigenous Peoples, CTBRS: 2012-2021
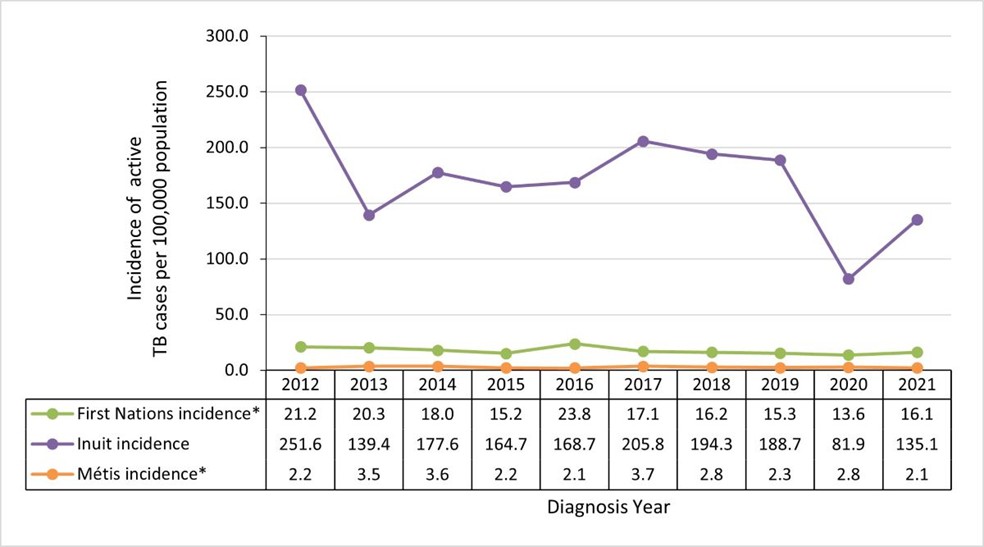
Figure 9b - Text description
| no data | 2012 | 2013 | 2014 | 2015 | 2016 | 2017 | 2018 | 2019 | 2020 | 2021 |
|---|---|---|---|---|---|---|---|---|---|---|
| First NationsFootnote * | 21.2 | 20.3 | 18.0 | 15.2 | 23.8 | 17.1 | 16.2 | 15.3 | 13.6 | 16.1 |
| Inuit | 251.6 | 139.4 | 177.6 | 164.7 | 168.7 | 205.8 | 194.3 | 188.7 | 81.9 | 135.1 |
| MétisFootnote * | 2.2 | 3.5 | 3.6 | 2.2 | 2.1 | 3.7 | 2.8 | 2.3 | 2.8 | 2.1 |
|
||||||||||
Notes: *2021 data were not available for Quebec population groups, except the Inuit population.
2016-2021 data were not available for British Columbia for Indigenous identity.
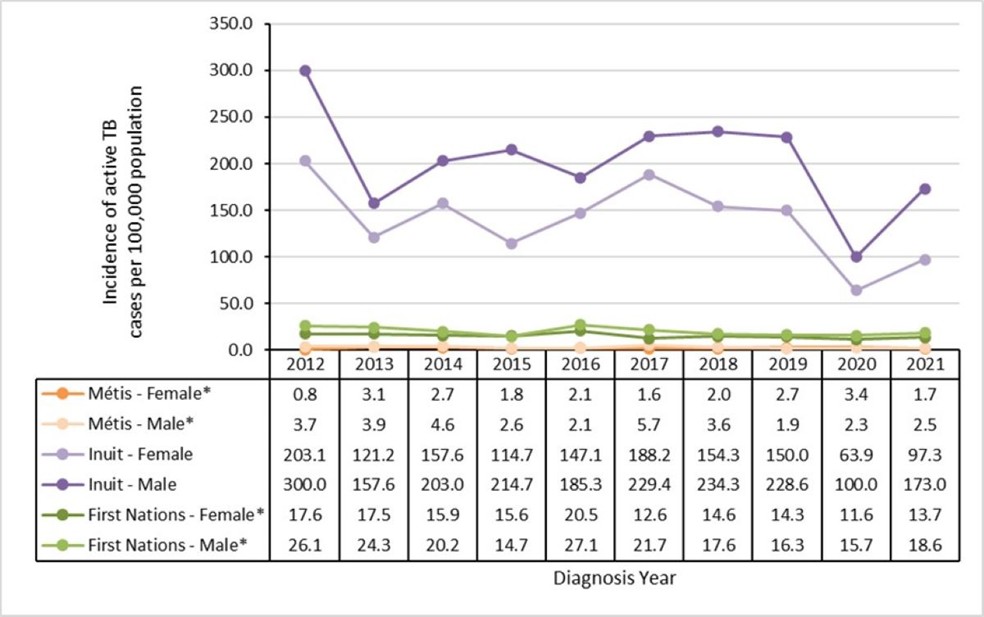
Figure 10 - Text description
| no data | 2012 | 2013 | 2014 | 2015 | 2016 | 2017 | 2018 | 2019 | 2020 | 2021 |
|---|---|---|---|---|---|---|---|---|---|---|
| Métis - FemaleFootnote * | 0.8 | 3.1 | 2.7 | 1.8 | 2.1 | 1.6 | 2.0 | 2.7 | 3.4 | 1.7 |
| Métis - MaleFootnote * | 3.7 | 3.9 | 4.6 | 2.6 | 2.1 | 5.7 | 3.6 | 1.9 | 2.3 | 2.5 |
| Inuit - Female | 203.1 | 121.2 | 157.6 | 114.7 | 147.1 | 188.2 | 154.3 | 150.0 | 63.9 | 97.3 |
| Inuit - Male | 300.0 | 157.6 | 203.0 | 214.7 | 185.3 | 229.4 | 234.3 | 228.6 | 100.0 | 173.0 |
| First Nations - FemaleFootnote * | 17.6 | 17.5 | 15.9 | 15.6 | 20.5 | 12.6 | 14.6 | 14.3 | 11.6 | 13.7 |
| First Nations - MaleFootnote * | 26.1 | 24.3 | 20.2 | 14.7 | 27.1 | 21.7 | 17.6 | 16.3 | 15.7 | 18.6 |
|
||||||||||
Notes: *2021 data were not available for Quebec population groups, except the Inuit population.
2016-2021 data were not available for British Columbia for Indigenous identity.
| Jurisdiction | Inuit | First Nations | Métis | Indigenous Peoples | ||||
|---|---|---|---|---|---|---|---|---|
| n | Incidence | n | Incidence | n | Incidence | n | Incidence | |
| NL | 4 | 57.1 | 1 | 4.5 | 0 | 0 | 5 | 13.2 |
| PEI | 0 | 0 | 0 | 0 | 0 | 0 | 0 | 0 |
| NS | 0 | 0 | 0 | 0 | 0 | 0 | 0 | 0 |
| NB | 0 | 0 | 0 | 0 | 0 | 0 | 0 | 0 |
| QC | 17 | 106.3 | -- | -- | -- | -- | -- | -- |
| ON | 4 | 100.0 | 4 | 1.3 | 0 | 0 | 8 | 1.8 |
| MB | 0 | 0 | 53 | 34.9 | 0 | 0 | 53 | 20.7 |
| SK | 0 | 0 | 66 | 46.2 | 9 | 13.4 | 75 | 35.7 |
| AB | 0 | 0 | 11 | 6.5 | 1 | 0.7 | 12 | 3.8 |
| BC | -- | -- | -- | -- | -- | -- | -- | -- |
| YT | 0 | 0 | 0 | 0 | 0 | 0 | 0 | 0 |
| NWT | 0 | 0 | 4 | 26.7 | 0 | 0 | 4 | 16.0 |
| NU | 75 | 214.3 | 0 | 0 | 0 | 0 | 75 | 214.3 |
| Total | 100 | 135.1 | 139Footnote * | 16.1Footnote * | 10Footnote * | 2.1Footnote * | 232Footnote * | 16.6Footnote * |
|
||||||||
The incidence of active TB in 2021 for Indigenous Peoples by PT is shown in Table 4. As previously mentioned, the national incidence was highest for Inuit at 135.1 per 100,000 (n=100), with high rates in Nunavut (214.3 per 100,000; n=75) and Quebec (106.3 per 100,000; n= 17).
For First Nations, the overall incidence in 2021 was 16.1 per 100,000 (n=139) with elevated rates reported in Saskatchewan (46.2 per 100,000; n=66) and Manitoba (34.9 per 100,000; n=53). The overall incidence of active TB in the Métis (2.1 per 100,000; n=10) was primarily associated with cases observed in Saskatchewan (incidence of 13.4 per 100,000; n=9).
Incidence was higher among First Nations living on reserve compared to off reserve at 23.8 per 100,000 versus 18.5 per 100,000 respectively in 2021. This difference was consistent over the preceding decade (Table 5).
| Year | First Nations | |||||
|---|---|---|---|---|---|---|
| Total | On reserve | Off reserve | ||||
| n | Incidence | n | Incidence | n | Incidence | |
| 2021Footnote * | 139 | 16.1 | 93 | 23.4 | 41 | 10.4 |
| 2020 | 132 | 13.6 | 92 | 20.2 | 19 | 4.6 |
| 2019 | 145 | 15.3 | 74 | 16.3 | 57 | 14.0 |
| 2018 | 150 | 16.2 | 93 | 20.7 | 46 | 11.6 |
| 2017 | 154 | 17.1 | 98 | 22.0 | 42 | 10.6 |
| 2016 | 209 | 23.8 | 149 | 33.9 | 56 | 14.5 |
| 2015 | 157 | 15.2 | 101 | 20.4 | 49 | 10.7 |
| 2014 | 182 | 18.0 | 106 | 21.7 | 67 | 14.9 |
| 2013 | 205 | 20.3 | 148 | 30.8 | 50 | 11.4 |
| 2012 | 208 | 21.2 | 113 | 23.8 | 79 | 18.5 |
|
||||||
TB among individuals born outside of Canada
The following sections provide a description of active TB among individuals born outside of Canada as defined by the WHO regions (Appendix A).
Overall, in 2021, persons born outside of Canada accounted for 76.7% (n=1,055/1,376) of all incident active TB cases in Canada that reported on birthplace. The distribution of active TB cases according to WHO region has remained stable over the 10-year surveillance period, with the majority of cases originating from the Western Pacific and South-East Asia regions. In 2021, these regions collectively accounted for over 70% of TB cases among persons who were born outside of Canada; 37.6% (n=397/1,055) for the Western Pacific Region and 35.6% (n=376/1,055) for the South-East Asia Region. For the remaining cases, 9.6% (n=101/1,055) were from the Eastern Mediterranean Region, 9.0% (n=95/1,055) from the African Region, and 2.6% (n=27/1,055) were from the Region of the Americas. The European Region was the least represented with 1.7% (n=18/1,055) of cases (Table 6).
| no data | African Region | Americas Region | Eastern Mediterranean Region | European Region | South-East Asian Region | Western Pacific Region | Unknown | Total | |
|---|---|---|---|---|---|---|---|---|---|
| 2021Footnote * | n | 95 | 27 | 101 | 18 | 376 | 397 | 41 | 1,055 |
| % | 9.0% | 2.6% | 9.6% | 1.7% | 35.6% | 37.6% | 3.9% | 100% | |
| 2020 | n | 186 | 55 | 126 | 32 | 412 | 455 | 50 | 1,316 |
| % | 14.1% | 4.2% | 9.6% | 2.4% | 31.3% | 34.6% | 3.8% | 100% | |
| 2019 | n | 191 | 58 | 158 | 32 | 421 | 536 | 31 | 1,427 |
| % | 13.4% | 4.1% | 11.1% | 2.2% | 29.5% | 37.6% | 2.2% | 100% | |
| 2018 | n | 173 | 71 | 136 | 36 | 376 | 493 | 30 | 1,315 |
| % | 13.2% | 5.4% | 10.3% | 2.7% | 28.6% | 37.5% | 2.3% | 100% | |
| 2017 | n | 144 | 67 | 143 | 46 | 333 | 555 | 31 | 1,319 |
| % | 10.9% | 5.1% | 10.8% | 3.5% | 25.2% | 42.1% | 2.4% | 100% | |
| 2016 | n | 156 | 64 | 141 | 53 | 317 | 487 | 13 | 1,231 |
| % | 12.7% | 5.2% | 11.5% | 4.3% | 25.8% | 39.6% | 1.1% | 100% | |
| 2015 | n | 133 | 64 | 103 | 63 | 302 | 501 | 12 | 1,178 |
| % | 11.3% | 5.4% | 8.7% | 5.3% | 25.6% | 42.5% | 1.0% | 100% | |
| 2014 | n | 128 | 42 | 104 | 44 | 293 | 495 | 4 | 1,110 |
| % | 11.5% | 3.8% | 9.4% | 4.0% | 26.4% | 44.6% | 0.4% | 100% | |
| 2013 | n | 143 | 52 | 124 | 41 | 308 | 482 | 3 | 1,153 |
| % | 12.4% | 4.5% | 10.8% | 3.6% | 26.7% | 41.8% | 0.3% | 100% | |
| 2012 | n | 140 | 53 | 120 | 52 | 271 | 468 | 8 | 1,112 |
| % | 12.6% | 4.8% | 10.8% | 4.7% | 24.4% | 42.1% | 0.7% | 100% | |
|
|||||||||
Trends in the incidence of active TB among individuals born outside of Canada, by region of birth have remained relatively stable over the last decade (Figure 11). In 2021, the incidence of active TB was highest in the South-East Asia Region at 25.7 per 100,000, followed by the African Region at 19.7 per 100,000. The apparent decrease in incidence for these two regions in 2021 is possibly due to the lack of availability of data from Quebec as well as an update in the denominator used for this population due to a census update.
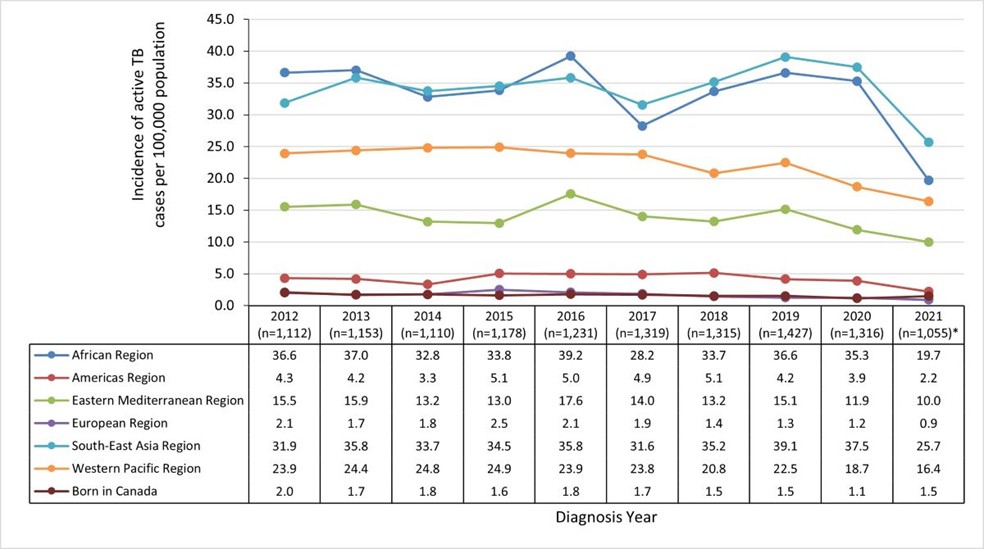
Figure 11 - Text description
| WHO region of birth | 2012 (n=1,112) |
2013 (n=1,153) |
2014 (n=1,110) |
2015 (n=1,178) |
2016 (n=1,231) |
2017 (n=1,319) |
2018 (n=1,315) |
2019 (n=1,427) |
2020 (n=1,316) |
2021 (n=1,055)Footnote * |
|---|---|---|---|---|---|---|---|---|---|---|
| African Region | 36.6 | 37.0 | 32.8 | 33.8 | 39.2 | 28.2 | 33.7 | 36.6 | 35.3 | 19.7 |
| Americas Region | 4.3 | 4.2 | 3.3 | 5.1 | 5.0 | 4.9 | 5.1 | 4.2 | 3.9 | 2.2 |
| Eastern Mediterranean Region | 15.5 | 15.9 | 13.2 | 13.0 | 17.6 | 14.0 | 13.2 | 15.1 | 11.9 | 10.0 |
| European Region | 2.1 | 1.7 | 1.8 | 2.5 | 2.1 | 1.9 | 1.4 | 1.3 | 1.2 | 0.9 |
| South-East Asia Region | 31.9 | 35.8 | 33.7 | 34.5 | 35.8 | 31.6 | 35.2 | 39.1 | 37.5 | 25.7 |
| Western Pacific Region | 23.9 | 24.4 | 24.8 | 24.9 | 23.9 | 23.8 | 20.8 | 22.5 | 18.7 | 16.4 |
| Born in Canada | 2.0 | 1.7 | 1.8 | 1.6 | 1.8 | 1.7 | 1.5 | 1.5 | 1.1 | 1.2 |
|
||||||||||
Note: *2021 data were not available for Quebec population groups.
Consistent with immigration patterns, the majority of cases among individuals born outside of Canada resided in Ontario (44.6%; n=471/1,055), 70% (n=328/471) of whom were from the South-East Asia Region or Western Pacific Region. British Columbia and Alberta also reported a large proportion of cases among persons born outside of Canada, representing 21.8% (n=230/1,055) and 20.5% (n=216/1,055) of this group, respectively. Among British Columbia's cases, 83.4% (n=192/230) were from the South-East Asia Region or Western Pacific Region, and 68.0% (n=147/216) of Alberta's cases in this population group were from Southeast Asia or Western Pacific regions. The territories had almost no cases born outside of Canada (n=1) (Table 7).
| Jurisdiction | African Region | Americas Region | Eastern Mediterranean Region | European Region | South-East Asian Region | Western Pacific Region | Unknown | Total | ||||||||
|---|---|---|---|---|---|---|---|---|---|---|---|---|---|---|---|---|
| n | % | n | % | n | % | n | % | n | % | n | % | n | % | n | % | |
| NL | 0 | 0% | 0 | 0% | 0 | 0% | 0 | 0% | 4 | 0.4% | 0 | 0% | 0 | 0% | 4 | 0.4% |
| PEI | 0 | 0% | 0 | 0% | 0 | 0% | 0 | 0% | 2 | 0.2% | 0 | 0% | 0 | 0% | 2 | 0.2% |
| NS | 0 | 0% | 0 | 0% | 0 | 0% | 0 | 0% | 8 | 0.8% | 2 | 0.2% | 1 | 0.1% | 11 | 1.0% |
| NB | 2 | 0.2% | 0 | 0% | 0 | 0% | 0 | 0% | 2 | 0.2% | 3 | 0.3% | 0 | 0.0% | 7 | 0.7% |
| ON | 46 | 4.4% | 16 | 1.5% | 50 | 4.7% | 9 | 0.9% | 182 | 17.3% | 146 | 13.8% | 22 | 2.1% | 471 | 44.6% |
| MB | 4 | 0.4% | 1 | 0.1% | 6 | 0.6% | 1 | 0.1% | 19 | 1.8% | 28 | 2.7% | 13 | 1.2% | 72 | 6.8% |
| SK | 1 | 0.1% | 0 | 0% | 3 | 0.3% | 0 | 0% | 11 | 1.0% | 26 | 2.5% | 0 | 0% | 41 | 3.9% |
| AB | 33 | 3.1% | 4 | 0.4% | 29 | 2.7% | 3 | 0.3% | 62 | 5.9% | 85 | 8.1% | 0 | 0% | 216 | 20.5% |
| BC | 9 | 0.9% | 6 | 0.6% | 13 | 1.2% | 5 | 0.5% | 86 | 8.2% | 106 | 10.0% | 5 | 0.5% | 230 | 21.8% |
| YT | 0 | 0% | 0 | 0% | 0 | 0% | 0 | 0% | 0 | 0% | 1 | 0.1% | 0 | 0% | 1 | 0.1% |
| NWT | 0 | 0% | 0 | 0% | 0 | 0% | 0 | 0% | 0 | 0% | 0 | 0% | 0 | 0% | 0% | 0% |
| NU | 0 | 0% | 0 | 0% | 0 | 0% | 0 | 0% | 0 | 0% | 0 | 0% | 0 | 0% | 0% | 0% |
| Canada | 95 | 9.0% | 27 | 2.6% | 101 | 9.6% | 18 | 1.7% | 376 | 35.6% | 397 | 37.6% | 41 | 3.9% | 1,055 | 100% |
Notes: 2021 data were not available for Quebec population groups. |
||||||||||||||||
Immigration status among individuals born outside of Canada
In 2021, information on immigration status was available for 56.0% (n=591/1,055) of individuals with active TB who were born outside Canada. Of these, 70.7% (n=418/591) were Canadian citizens or permanent residents, and 27.2% (n=161/591) were temporary visa holders including tourists or visitors, students, workers, or other temporary residents. Refugees and refugee claimants accounted for 2.0% (n=12/591) of cases (Figure 12).

Figure 12 - Text description
| no data | n | % |
|---|---|---|
| Individuals born outside of Canada with known origin or immigration status | 591 | 56% |
| Individuals born outside of Canada with unknown origin or immigration status | 464 | 44% |
The following table describes the distribution of active TB among the 591 individuals born outside Canada with known immigration status:
| no data | n | % |
|---|---|---|
| Canadian citizen or permanent resident | 418 | 70.7% |
| Temporary resident - student | 48 | 8.1% |
| Temporary resident - worker | 39 | 6.6% |
| Temporary resident - visitor | 28 | 4.7% |
| Temporary resident - unknown specific status | 46 | 7.8% |
| Refugee or refugee claimant | 12 | 2.0% |
| Note: 2021 data were not available for Quebec population groups. Proportions presented are based on cases that reported being born outside of Canada. |
||
Note: 2021 data were not available for Quebec population groups.
Proportions presented are based on cases that reported being born outside of Canada.
Active TB among individuals born outside of Canada, by length of time residing in Canada
This section presents a description of the time to development of active TB for persons born outside of Canada for 2021. The data were further stratified by region of origin and by immigration status.
Among Canadian citizens or permanent residents who were born outside of Canada and diagnosed with TB in 2021, 31.6% (n=132/418) were diagnosed within 6 years of arrival and 45.7% (n=191/418) had arrived in Canada more than 10 years ago (Table 8).
| Years since arrival to Canada (year of arrival) | African Region | American Region | Eastern Mediterranean Region | European Region | South-East Asian Region | Western Pacific Region | Unknown | Total | ||||||||
|---|---|---|---|---|---|---|---|---|---|---|---|---|---|---|---|---|
| n | % | n | % | n | % | n | % | n | % | n | % | n | % | n | % | |
| <2 years (2021, 2020) |
5 | 1.2% | 0 | 0.0% | 4 | 1.0% | 0 | 0.0% | 9 | 2.2% | 6 | 1.4% | 1 | 0.2% | 25 | 6.0% |
| 3-4 years (2019, 2018) |
9 | 2.2% | 0 | 0.0% | 9 | 2.2% | 0 | 0.0% | 17 | 4.1% | 20 | 4.8% | 0 | 0.0% | 55 | 13.2% |
| 5-6 years (2017, 2016) |
7 | 1.7% | 0 | 0.0% | 4 | 1.0% | 0 | 0.0% | 14 | 3.3% | 27 | 6.5% | 0 | 0.0% | 52 | 12.4% |
| 7-8 years (2015, 2014) |
4 | 1.0% | 1 | 0.2% | 3 | 0.7% | 0 | 0.0% | 6 | 1.4% | 18 | 4.3% | 0 | 0.0% | 32 | 7.7% |
| 9-10 years (2013, 2012) |
2 | 0.5% | 1 | 0.2% | 4 | 1.0% | 0 | 0.0% | 9 | 2.2% | 16 | 3.8% | 0 | 0.0% | 32 | 7.7% |
| >10 years | 12 | 2.9% | 8 | 1.9% | 17 | 4.1% | 5 | 1.2% | 56 | 13.4% | 92 | 22.0% | 1 | 0.2% | 191 | 45.7% |
| Unknown | 1 | 0.2% | 1 | 0.2% | 2 | 0.5% | 1 | 0.2% | 6 | 1.4% | 16 | 3.8% | 4 | 1.0% | 31 | 7.4% |
| Total | 40 | 9.6% | 11 | 2.6% | 43 | 10.3% | 6 | 1.4% | 117 | 28.0% | 195 | 46.7% | 6 | 1.4% | 418 | 100% |
| Notes: 2021 data were not available for Quebec population groups. Proportions presented are based on cases that reported being born outside of Canada and have Canadian citizenship or permanent residency. |
||||||||||||||||
Temporary residents: visitors, students and temporary workers
Among temporary residents (visitors, students and temporary workers), 161 were diagnosed with active TB in 2021. Of these cases, 57.8% (n=93/161) had been living in Canada for less than 5 years, and the majority were from the South-East Asia and Western Pacific Regions (Table 9). There were no cases of active TB among temporary residents from the European Region in 2021.
| Years since arrival to Canada (year of arrival) | African Region | American Region | Eastern Mediterranean Region | European Region | South-East Asian Region | Western Pacific Region | Unknown | Total | ||||||||
|---|---|---|---|---|---|---|---|---|---|---|---|---|---|---|---|---|
| n | % | n | % | n | % | n | % | n | % | n | % | n | % | n | % | |
| <2 years (2021, 2020) |
1 | 0.6% | 1 | 0.6% | 2 | 1.2% | 0 | 0.0% | 20 | 12.4% | 8 | 5.0% | 1 | 0.6% | 33 | 20.5% |
| 3-4 years (2019, 2018) |
2 | 1.2% | 2 | 1.2% | 3 | 1.9% | 0 | 0.0% | 35 | 21.7% | 18 | 11.2% | 0 | 0.0% | 60 | 37.3% |
| 5-6 years (2017, 2016) |
0 | 0.0% | 0 | 0.0% | 1 | 0.6% | 0 | 0.0% | 16 | 9.9% | 5 | 3.1% | 0 | 0.0% | 22 | 13.7% |
| 7-8 years (2015, 2014) |
4 | 2.5% | 0 | 0.0% | 0 | 0.0% | 0 | 0.0% | 5 | 3.1% | 3 | 1.9% | 0 | 0.0% | 12 | 7.5% |
| 9-10 years (2013, 2012) |
0 | 0.0% | 0 | 0.0% | 1 | 0.6% | 0 | 0.0% | 0 | 0.0% | 4 | 2.5% | 0 | 0.0% | 5 | 3.1% |
| >10 years | 0 | 0.0% | 0 | 0.0% | 1 | 0.6% | 0 | 0.0% | 3 | 1.9% | 6 | 3.7% | 0 | 0.0% | 10 | 6.2% |
| Unknown | 0 | 0.0% | 1 | 0.6% | 1 | 0.6% | 0 | 0.0% | 6 | 3.7% | 1 | 0.6% | 10 | 6.2% | 19 | 11.8% |
| Total | 7 | 4.3% | 4 | 2.5% | 9 | 5.6% | 0 | 0.0% | 85 | 52.8% | 45 | 28.0% | 11 | 6.8% | 161 | 100% |
Notes: 2021 data were not available for Quebec population groups. |
||||||||||||||||
3. Distribution of risk factors among active TB cases
Among cases where risk factor data was reported, the following risk factors were most commonly reported in 2021: travel to a high-incidence TB country for more than a week in the previous two years, having diabetes mellitus (DM), and contact with an active TB case two years before TB diagnosis (Figure 13). However, since between 53.6% and 82.5% of data was missing for TB risk factors these findings should be interpreted with caution (Table 10). There are differences in how risk factors are reported by PTs. Some jurisdictions do not report on a particular risk factor at all, and others only report when the risk factor is present, which makes it difficult to determine when the risk factor status is unknown or absent. Prevalence of each risk factor by PT is presented in Appendix F.

Figure 13 - Text description
| no data | HIV | Diabetes Type 1 or 2 | End-stage renal disease | Previous abnormal chest x-ray | Transplant-related immunosuppression | HomelessFootnote * | History of incarceration* | Long-termFootnote ** corticosteroid use | TB contact | Substance use | Travel to high incidence TB countryFootnote *** |
|---|---|---|---|---|---|---|---|---|---|---|---|
| Prevalence of risk factor | 5.1% | 27.9% | 5.6% | 15.5% | 2.2% | 4.0% | 1.4% | 1.2% | 22.9% | 8.2% | 37.7% |
Notes: 2021 data were not available for Quebec.
Proportions presented are based on cases with known risk factors. |
|||||||||||
Notes: 2021 data were not available for Quebec.
*12 months prior to diagnosis.
**Being prescribed corticosteroids for more than a month.
***Within 2 years preceding TB diagnosis for longer than a week.
Proportions presented are based on cases with known risk factors.
| Risk factors | Risk factor status unknown | |
|---|---|---|
| n | % | |
| History of incarceration (≤12 months prior to diagnosis) | 1,320 | 82.5% |
| Travel to high-incidence TB country for >1 week in last 2 years | 1,239 | 77.4% |
| Transplant-related immunosuppression | 1,111 | 69.4% |
| Long-term (>1 month) corticosteroid use | 1,109 | 69.3% |
| Homelessness at the time of TB diagnosis or 12 months prior | 1,106 | 69.1% |
| Previous abnormal chest X-ray | 1,102 | 68.9% |
| End-stage renal disease | 1,099 | 68.7% |
| Substance use | 1,089 | 68.1% |
| Contact with an active TB case in the last 2 years | 1,040 | 65.0% |
| Diabetes mellitus type 1 or 2 | 1,031 | 64.4% |
| HIV | 858 | 53.6% |
Notes: 2021 data were not available for Quebec. |
||
Prevalence of human immunodeficiency virus (HIV) among active TB cases
In 2021, the prevalence of HIV among active TB cases was 5.1% (n=38/742). However, reporting for this indicator was poor as HIV status was reported for only 46.4% (n=742/1,600) of active TB cases. This is due in part because not all PTs consistently report on this indicator (Table 11). Data from 2012 to 2021 show that when the reporting rate of HIV testing was higher (e.g., above 60% for 2017 to 2019), the prevalence of HIV infection for TB cases was lower (range: 2.2% to 3.5%) (Table 12).
| Jurisdiction | Total number of TB cases | HIV status reported (among total cases) | HIV status reported | ||||
|---|---|---|---|---|---|---|---|
| HIV not present | HIV present | ||||||
| n | n | % | n | % | n | % | |
| NL | 9 | 8 | 88.9% | 8 | 100% | 0 | 0% |
| PEI | 2 | 2 | 100% | 2 | 100% | 0 | 0% |
| NS | 12 | Not reported | -- | -- | -- | -- | |
| NB | 8 | 7 | 87.5% | 7 | 100% | 0 | 0% |
| ON | 683 | 183 | 26.8% | 157 | 85.8% | 26 | 14.2% |
| MB | 153 | 5 | 3.3% | 5 | 100% | 0 | 0.0% |
| SK | 122 | 4 | 3.3% | Not reported | 4 | 100% | |
| AB | 241 | 240 | 99.6% | 236 | 98.3% | 4 | 1.7% |
| BC | 289 | 220 | 76.1% | 216 | 98.2% | 4 | 1.8% |
| YT | 1 | 1 | 100% | 1 | 100% | 0 | 0% |
| NWT | 4 | 4 | 100% | 4 | 100% | 0 | 0% |
| NU | 76 | 68 | 89.5% | 68 | 100% | 0 | 0% |
| Total | 1,600 | 742 | 46.4% | 704 | 94.9% | 38 | 5.1% |
Notes: 2021 data was not available for Quebec. |
|||||||
| no data | 2012 | 2013 | 2014 | 2015 | 2016 | 2017 | 2018 | 2019 | 2020 | 2021Footnote * | ||
|---|---|---|---|---|---|---|---|---|---|---|---|---|
| HIV status known | Positive | n | 56 | 70 | 65 | 67 | 92 | 28 | 42 | 37 | 51 | 38 |
| % | 7.6% | 10.1% | 7.8% | 9.2% | 11.8% | 2.2% | 3.5% | 2.7% | 5.2% | 5.1% | ||
| Negative | n | 682 | 625 | 772 | 659 | 690 | 1,237 | 1,161 | 1,334 | 936 | 704 | |
| % | 92.4% | 89.9% | 92.2% | 90.8% | 88.2% | 97.8% | 96.5% | 97.3% | 94.8% | 94.9% | ||
| Subtotal with reported status | n | 738 | 695 | 837 | 726 | 782 | 1,265 | 1,203 | 1,371 | 987 | 742 | |
| % | 43.4% | 42.1% | 51.8% | 44.2% | 44.4% | 69.1% | 67.1% | 71.4% | 55.1% | 46.4% | ||
| HIV status unknown | HIV test not offered | n | 61 | 74 | 39 | 53 | 47 | 57 | 52 | 29 | 36 | 12 |
| % | 6.3% | 8.4% | 5.3% | 6.2% | 5.1% | 11.3% | 9.7% | 5.6% | 4.7% | 1.4% | ||
| HIV test refused | n | 71 | 2 | 4 | 7 | 6 | 3 | 1 | 0 | 0 | 0 | |
| % | 7.4% | 0.2% | 0.5% | 0.8% | 0.6% | 0.5% | 0.2% | 0.0% | 0.0% | 0.0% | ||
| Not reported | n | 830 | 880 | 735 | 857 | 927 | 506 | 538 | 521 | 768 | 846 | |
| % | 86.3% | 92.1% | 94.5% | 93.5% | 94.6% | 89.4% | 91.0% | 94.7% | 95.5% | 98.6% | ||
| Subtotal with status unknown | n | 962 | 956 | 778 | 917 | 980 | 566 | 591 | 550 | 804 | 858 | |
| % | 56.6% | 57.9% | 48.2% | 55.8% | 55.6% | 30.9% | 32.9% | 28.6% | 44.9% | 53.6% | ||
| Total | n | 1,700 | 1,651 | 1,615 | 1,643 | 1,762 | 1,831 | 1,794 | 1,921 | 1,791 | 1,600Footnote * | |
| % | 100% | 100% | 100% | 100% | 100% | 100% | 100% | 100% | 100% | 100% | ||
|
||||||||||||
Prevalence of diabetes mellitus (DM) among active TB cases
In 2021, the prevalence of DM (type 1 or 2) among active TB cases was 27.9% (n=159/569). However, reporting was poor, with data was available for only 35.6% (n=569/1,600) of cases. Contributing factors for this data gap include certain PTs (Ontario and Saskatchewan) reporting only cases where diabetes was present and others (Nunavut and Manitoba) not reporting data on this this risk factor (Table 13).
| Jurisdiction | Total number of TB cases | Diabetes status reported (among total cases) |
Diabetes status reported | ||||
|---|---|---|---|---|---|---|---|
| Diabetes not present | Diabetes present | ||||||
| n | n | % | n | % | n | % | |
| NL | 9 | 9 | 100% | 9 | 100% | 0 | 0% |
| PEI | 2 | 2 | 100% | 2 | 100% | 0 | 0% |
| NS | 12 | 9 | 75.0% | 9 | 100% | 0 | 0% |
| NB | 8 | 8 | 100% | 8 | 100% | 0 | 0% |
| ON | 683 | 86 | 12.6% | Not reported | 86 | 100% | |
| MB | 153 | Not reported | -- | -- | -- | -- | |
| SK | 122 | 3 | 2.5% | Not reported | 3 | 100% | |
| AB | 241 | 241 | 100% | 205 | 85.1% | 36 | 14.9% |
| BC | 289 | 207 | 71.6% | 173 | 83.6% | 34 | 16.4% |
| YT | 1 | 1 | 100% | 1 | 100% | 0 | 0% |
| NWT | 4 | 3 | 75.0% | 3 | 100% | 0 | 0% |
| NU | 76 | Not reported | -- | -- | -- | -- | |
| Total | 1,600 | 569 | 35.6% | 410 | 72.1% | 159 | 27.9% |
Notes: 2021 data was not available for Quebec. |
|||||||
Clinical characteristics: Detection methods, re-treatment, site of infection and laboratory confirmation
1. Detection methods: incident active TB
Data on detection methods was available for 88.1% (n=1,410/1,600) of cases. The majority of cases (71.6.%; n=1,145/1,600) reported in 2021 were detected passively through symptoms or incidental findings consistent with active TB. Cases were also identified actively through either contact investigation (6.9%; n=111/1,600), screening (3.5%; n=56/1,600) or immigration medical surveillance (3.3%; n=53/1,600). None were identified through post-mortem screening (Figure 14; Table 14). Trends presenting detection methods by PT can be found in Appendix H.
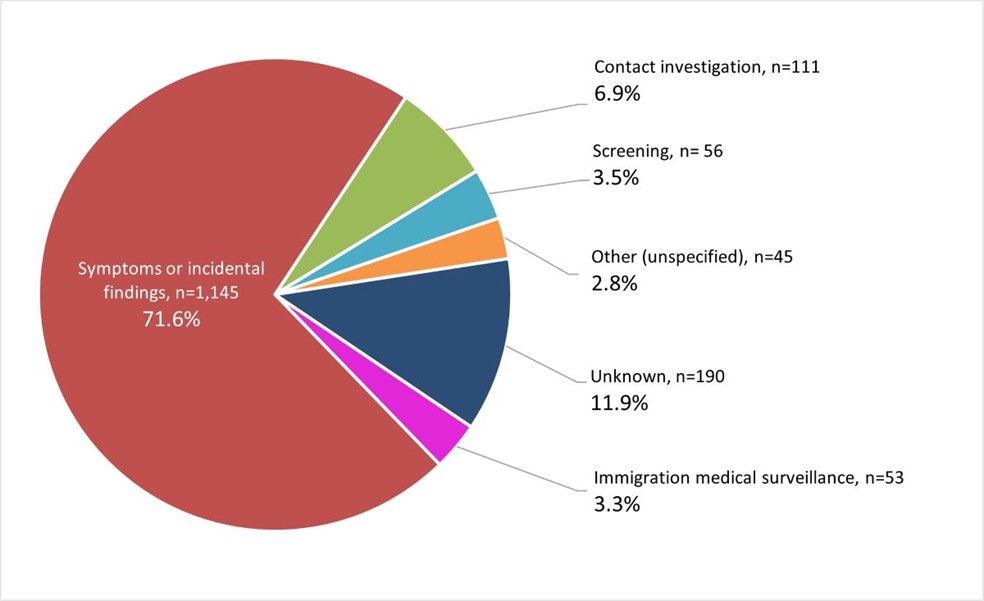
Figure 14 - Text description
| Methods of detection | n | % |
|---|---|---|
| Symptoms or incidental findings | 1,145 | 71.6% |
| Contact investigation | 111 | 6.9% |
| Screening | 56 | 3.5% |
| Other (unspecified) | 45 | 2.8% |
| Unknown | 190 | 11.9% |
| Immigration medical surveillance | 53 | 3.3% |
Note: 2021 data were not available for Quebec. |
||
Notes: 2021 data were not available for Quebec.
Proportions presented are based on total cases excluding Quebec.
| no data | Symptoms or incidental findings | Contact investigation | Immigration medical surveillance | Screening | Post-mortem | Other | Unknown | Total | |
|---|---|---|---|---|---|---|---|---|---|
| 2021Footnote * | n | 1,145 | 111 | 53 | 56 | 0 | 45 | 190 | 1,600 |
| % | 71.6% | 6.9% | 3.3% | 3.5% | 0% | 2.8% | 11.9% | 100% | |
| 2020 | n | 1,370 | 97 | 63 | 63 | 14 | 13 | 171 | 1,791 |
| % | 76.5% | 5.4% | 3.5% | 3.5% | 0.8% | 0.7% | 9.5% | 100% | |
| 2019 | n | 1,479 | 134 | 112 | 82 | 5 | 24 | 85 | 1,921 |
| % | 77.0% | 7.0% | 5.8% | 4.3% | 0.3% | 1.2% | 4.4% | 100% | |
| 2018 | n | 1,400 | 137 | 100 | 67 | 6 | 35 | 49 | 1,794 |
| % | 78.0% | 7.6% | 5.6% | 3.7% | 0.3% | 2.0% | 2.7% | 100% | |
| 2017 | n | 1,430 | 149 | 72 | 84 | 9 | 33 | 54 | 1,831 |
| % | 78.1% | 8.1% | 3.9% | 4.6% | 0.5% | 1.8% | 2.9% | 100% | |
| 2016 | n | 1,387 | 152 | 68 | 65 | 4 | 53 | 33 | 1,762 |
| % | 78.7% | 8.6% | 3.9% | 3.7% | 0.2% | 3.0% | 1.9% | 100% | |
| 2015 | n | 1,312 | 154 | 41 | 71 | 8 | 30 | 27 | 1,643 |
| % | 79.9% | 9.4% | 2.5% | 4.3% | 0.5% | 1.8% | 1.6% | 100% | |
| 2014 | n | 1,281 | 145 | 51 | 44 | 14 | 43 | 37 | 1,615 |
| % | 79.3% | 9.0% | 3.2% | 2.7% | 0.9% | 2.7% | 2.3% | 100% | |
| 2013 | n | 1,281 | 180 | 75 | 49 | 19 | 23 | 24 | 1,651 |
| % | 77.6% | 10.9% | 4.5% | 3.0% | 1.2% | 1.4% | 1.5% | 100% | |
| 2012 | n | 1,247 | 243 | 79 | 55 | 10 | 21 | 45 | 1,700 |
| % | 73.4% | 14.3% | 4.6% | 3.2% | 0.6% | 1.2% | 2.6% | 100% | |
|
|||||||||
2. Re-treatment
Of the 1,600 individuals with active TB for whom data was available in 2021, 3.6% (n=58/1,600) were identified as re-treatment cases (Table 15).
| no data | 2012 | 2013 | 2014 | 2015 | 2016 | 2017 | 2018 | 2019 | 2020 | 2021Footnote * | |
|---|---|---|---|---|---|---|---|---|---|---|---|
| Canada | n | 89 | 94 | 82 | 99 | 98 | 97 | 98 | 72 | 63 | 58 |
| % | 5.2% | 5.7% | 5.1% | 6.0% | 5.6% | 5.3% | 5.5% | 3.7% | 3.5% | 3.6% | |
|
|||||||||||
Information on the time interval between consecutive diagnoses was available for 80% (n=48/58) of re-treatment cases. Excluding the unknowns, almost one third (27%; n=13/48) had a second diagnosis within 5 years of the initial diagnosis. Another 10.3% (n=6/48) had a second diagnosis of TB between 6-9 years of the initial infection (Table 16).
| no data | Total TB cases | Time interval (in years) | |||||||
|---|---|---|---|---|---|---|---|---|---|
| ≤ 2 | 3-5 | 6-9 | 10-15 | 16-20 | ≥ 21 | Unknown | |||
| Canada | n | 58 | 5 | 8 | 6 | 10 | 7 | 12 | 10 |
| % | 100% | 8.6% | 13.8% | 10.3% | 17.2% | 12.1% | 20.7% | 17.2% | |
Notes: 2021 data were not available for Quebec. |
|||||||||
3. Diagnostic sites
In 2021, almost three quarters of active TB cases in Canada were of respiratory origin (72.1%, n=1,154/1,600) (Table 17). As in previous years, pulmonary TB was the most commonly reported diagnostic site for active TB in 2021 and accounted for 65.8% (n=1,052/1,600) of all cases for which data were available (Table 17). Among non-respiratory TB cases, the peripheral lymph nodes were the most common diagnostic site (12.4%; n=199/1,600). All other forms of respiratory and non-respiratory TB diagnosed in Canada did not exceed 3.4% (n≤54) (Table 17).
| Diagnostic sites | Total | ||
|---|---|---|---|
| n | (%) | ||
| Respiratory TB | Pulmonary | 1,052 | 65.8% |
| Primary | 40 | 2.5% | |
| Pleurisy | 30 | 1.9% | |
| Other respiratory | 22 | 1.4% | |
| Intrathoracic lymph nodes | 10 | 0.6% | |
| Subtotal | 1,154 | 72.1% | |
| Non-respiratory TB | Peripheral lymph nodes | 199 | 12.4% |
| Intestines, peritoneum, and mesenteric glands | 54 | 3.4% | |
| Bones & joints | 51 | 3.2% | |
| Eyes | 27 | 1.7% | |
| Other non-respiratory | 23 | 1.4% | |
| Genito-urinary system | 19 | 1.2% | |
| CNSFootnote * & meninges | 17 | 1.1% | |
| Other specified organsFootnote * | 16 | 1.0% | |
| Skin and subcutaneous tissue | 15 | 0.9% | |
| Miliary | 15 | 0.9% | |
| Subtotal | 436 | 27.3% | |
| Unknown | Diagnostic site unknown | 10 | 0.6% |
| Total | 1,600 | 100% | |
|
|||
In 2021, across all population groups, pulmonary TB was the most common type of active TB diagnosed and was highest among Inuit at 95.0% (n=95/100) compared with other population groups: 61.2% (n=85/139) for First Nations, 70.0% (n=7/10) for Metis, 62.0% (n=31) for Canadian born non-Indigenous and 63.1% (n=666/1,055) for persons born outside of Canada (Table 18). Non-respiratory forms of TB were more common among individuals born outside of Canada at 32.1% (n=339/1,055) (Table 18).
Overall, 9.0% (n=144/1,600) of cases had multiple diagnostic sites suggesting disseminated TB; 14 were First Nations, two Métis, 10 non-Indigenous Canadian born, 95 individuals born outside of Canada, and 23 with unknown place of birth (data not shown).
| Diagnostic sites | Canadian-born | Individuals born outside of CanadaFootnote * | Unknown place of birthFootnote * | TotalFootnote * | |||||||||||||
|---|---|---|---|---|---|---|---|---|---|---|---|---|---|---|---|---|---|
| First NationsFootnote * | Inuit | MetisFootnote * | Non-IndigenousFootnote * | Unknown Indigenous statusFootnote * | |||||||||||||
| n | % | n | % | n | % | n | % | n | % | n | % | n | % | n | % | ||
| Respiratory TB | Pulmonary | 85 | 61.2% | 95 | 95.0% | 7 | 70.0% | 31 | 62.0% | 32 | 82.1% | 666 | 63.1% | 150 | 67.0% | 1,052 | 65.1% |
| Primary | 16 | 11.5% | 0 | 0.0% | 0 | 0% | 4 | 8.0% | 1 | 2.6% | 10 | 0.9% | 9 | 4.0% | 40 | 2.5% | |
| Pleurisy | 9 | 6.5% | 0 | 0.0% | 1 | 10.0% | 2 | 4.0% | 0 | 0% | 13 | 1.2% | 5 | 2.2% | 30 | 1.9% | |
| Other respiratory | 0 | 0% | 0 | 0.0% | 0 | 0% | 0 | 0% | 2 | 5.1% | 19 | 1.8% | 1 | 0.4% | 22 | 1.4% | |
| Intrathoracic lymph nodes | 3 | 2.2% | 0 | 0.0% | 0 | 0% | 1 | 2.0% | 0 | 0% | 5 | 0.5% | 1 | 0.4% | 10 | 0.6% | |
| Subtotal | 113 | 81.3% | 95 | 95.0% | 8 | 80.0% | 38 | 76.0% | 35 | 89.7% | 713 | 67.6% | 166 | 74.1% | 1,154 | 71.4% | |
| Non-respiratory TB | Peripheral lymph nodes | 2 | 1.4% | 0 | 0.0% | 1 | 10.0% | 4 | 8.0% | 0 | 0% | 170 | 16.1% | 22 | 9.8% | 199 | 12.3% |
| Intestines, peritoneum & mesenteric glands | 8 | 5.8% | 1 | 1.0% | 0 | 0% | 0 | 0% | 0 | 0% | 37 | 3.5% | 8 | 3.6% | 54 | 3.3% | |
| Bones & joints | 0 | 0% | 0 | 0.0% | 1 | 10.0% | 1 | 2.0% | 0 | 0% | 41 | 3.9% | 8 | 3.6% | 51 | 3.2% | |
| Eyes | 5 | 3.6% | 0 | 0.0% | 0 | 0% | 2 | 4.0% | 0 | 0% | 18 | 1.7% | 2 | 0.9% | 27 | 1.7% | |
| Other non-respiratory | 0 | 0% | 0 | 0.0% | 0 | 0% | 0 | 0% | 1 | 2.6% | 22 | 2.1% | 0 | 0% | 23 | 1.4% | |
| Genito-urinary system | 1 | 0.7% | 0 | 0.0% | 0 | 0% | 3 | 6.0% | 0 | 0% | 13 | 1.2% | 2 | 0.9% | 19 | 1.2% | |
| CNS & meninges | 3 | 2.2% | 0 | 0.0% | 0 | 0% | 2 | 4.0% | 1 | 2.6% | 8 | 0.8% | 3 | 1.3% | 17 | 1.1% | |
| Other specified organs | 0 | 0% | 0 | 0.0% | 0 | 0% | 0 | 0% | 0 | 0% | 12 | 1.1% | 4 | 1.8% | 16 | 1.0% | |
| Miliary | 2 | 1.4% | 0 | 0.0% | 0 | 0% | 0 | 0% | 2 | 5.1% | 8 | 0.8% | 3 | 1.3% | 15 | 0.9% | |
| Skin | 1 | 0.7% | 0 | 0.0% | 0 | 0% | 0 | 0% | 0 | 0% | 10 | 0.9% | 4 | 1.8% | 15 | 0.9% | |
| Subtotal | 22 | 15.8% | 1 | 1.0% | 2 | 20.0% | 12 | 24.0% | 4 | 10.3% | 339 | 32.1% | 56 | 25.0% | 436 | 27.0% | |
| Unknown | Diagnostic site unknown | 4 | 2.9% | 4 | 4.0% | 0 | 0% | 0 | 0% | 0 | 0% | 3 | 0.3% | 2 | 0.9% | 10 | 1.7% |
| Total TB cases reported in 2021 | 139 | 100% | 100 | 100% | 10 | 100% | 50 | 100% | 39 | 100% | 1,055 | 100% | 224 | 100% | 1,600 | 100% | |
|
|||||||||||||||||
4. Laboratory (culture) results
The proportion of active TB cases with a positive culture remained consistently between 87.0% and 91.3% over the 10-year surveillance period (Table 19), including during the pandemic years. However, the proportion of cases with reported culture results decreased considerably from 2019 to 2021.
| no data | TB cases with culture results | UnknownFootnote *** | |||
|---|---|---|---|---|---|
| PositiveFootnote ** | NegativeFootnote ** | Total | |||
| 2021Footnote * | n | 1,020 | 153 | 1,173 | 427 |
| % | 87.0% | 13.0% | 100% | 26.7% | |
| 2020 | n | 1,182 | 133 | 1,315 | 476 |
| % | 89.9% | 10.1% | 100% | 26.6% | |
| 2019 | n | 1,320 | 203 | 1,523 | 398 |
| % | 86.7% | 13.3% | 100% | 20.7% | |
| 2018 | n | 1,452 | 191 | 1,643 | 151 |
| % | 88.4% | 11.6% | 100% | 8.4% | |
| 2017 | n | 1,485 | 185 | 1,670 | 161 |
| % | 88.9% | 11.1% | 100% | 8.8% | |
| 2016 | n | 1,461 | 142 | 1,603 | 159 |
| % | 91.1% | 8.9% | 100% | 9.0% | |
| 2015 | n | 1,339 | 163 | 1,502 | 141 |
| % | 89.1% | 10.9% | 100% | 8.6% | |
| 2014 | n | 1347 | 129 | 1,476 | 139 |
| % | 91.3% | 8.7% | 100% | 8.6% | |
| 2013 | n | 1,365 | 132 | 1,497 | 154 |
| % | 91.2% | 8.8% | 100% | 9.3% | |
| 2012 | n | 1,349 | 191 | 1,540 | 160 |
| % | 87.6% | 12.4% | 100% | 9.4% | |
|
|||||
Resistance
In 2021, among 1,829 active TB cases, 1,555 available isolates were submitted for testing (Figure 15), with the remaining cases assumed to be clinically diagnosed. Of the MTB complex isolates (n=1,536), 90.1% (n=1,384/1,536) of cases were susceptible to first-line TB drugs (isoniazid, rifampin, ethambutol, and pyrazinamide), while resistance was detected in 9.9% (n=152/1,536) of the isolates. Mono-resistance, poly-resistance and MDR forms of TB were detected in 131 (8.5%), four (0.3%), and 16 (1.0%) isolates, respectively; one isolate identified as XDR (0.1%) (Figure 15). The relative pattern of mono-resistance, poly-resistance, MDR and XDR has remained constant over the 10-year surveillance period (Table 20). Mono-resistance was identified in three pediatric cases (<15 years); one was under 5 years and two were 5 to 14 years of age (Table 21). There was no difference over time in resistance patterns between males and females, or by age group (Appendix G).
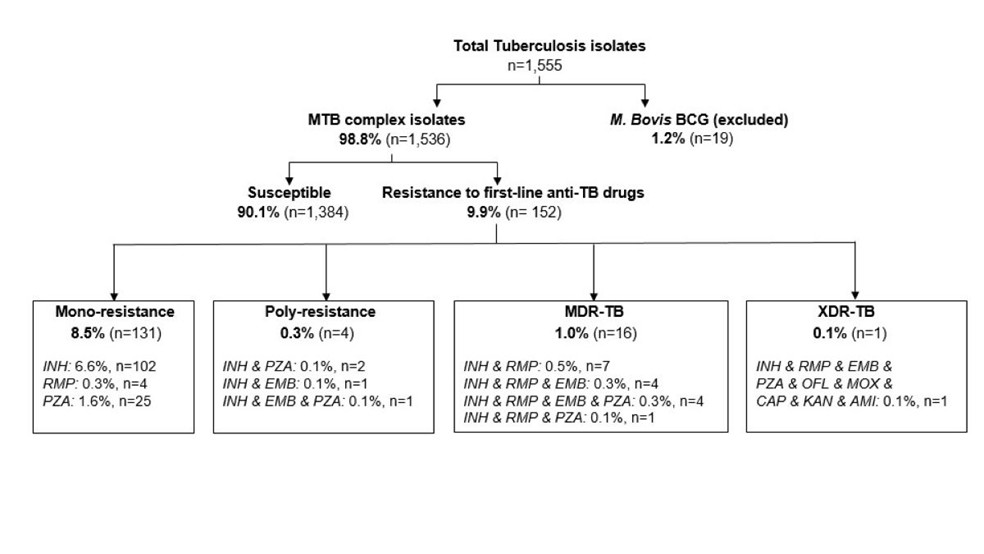
Figure 15 - Text description
Flow chart of the number of Mycobacterium tuberculosis isolates tested for drug susceptibility, as reported to the CTBLSS in 2021. A total of 1,555 TB isolates were tested, of which 1,536 were identified as MTB complex and subsequently tested for drug susceptibility, while 19 were identified as Mycobacterium bovis and excluded from further testing. Among MTB isolates, 1,384 (90.1%) were susceptible and 152 (9.9%) were resistant to first line drugs.
The following table summarizes the type of drug resistance identified in 152 isolates with resistance to first line drugs:
| Type of drug resistance | Number of MTB isolates | Percentage |
|---|---|---|
| Mono-resistance | 131 | 8.5% |
| Poly-resistance | 4 | 0.3% |
| Multidrug-resistance | 16 | 1.0% |
| Extensive drug resistance | 1 | 0.1% |
| Drug type | Number of MTB isolates | Percentage |
|---|---|---|
| Isoniazid | 102 | 6.6% |
| Rifampin | 4 | 0.3% |
| Pyrazinamide | 25 | 1.6% |
| Drug type | Number of MTB isolates | Percentage |
|---|---|---|
| Isoniazid & Pyrazinamide | 2 | 0.1% |
| Isoniazid & Ethambutol | 1 | 0.1% |
| Isoniazid & Ethambutol & Pyrazinamide | 1 | 0.1% |
| Drug type | Number of MTB isolates | Percentage |
|---|---|---|
| Isoniazid & Rifampin | 7 | 0.5% |
| Isoniazid & Rifampin & Ethambutol | 4 | 0.3% |
| Isoniazid & Rifampin & Ethambutol & Pyrazinamide | 4 | 0.3% |
| Isoniazid & Rifampin & Pyrazinamide | 1 | 0.1% |
| Drug type | Number of MTB isolates | Percentage |
|---|---|---|
| Isoniazid & Rifampin & Ethambutol & Pyrazinamide & Ofloxacin & Moxifloxacin & Capreomycin & Kanamycin & Amikacin | 1 | 0.1% |
Notes: Proportions presented are based on total TB isolates or total MTB complex isolates. |
||
Notes: INH, Isoniazid; RMP, Rifampin; PZA, pyrazinamide; EMB, Ethambutol; OFL, ofloxacin; MOX, moxifloxacin; CAP, capreomycin; KAN, kanamycin; AMI, amikacin.
Proportions presented are based on total TB isolates or total MTB complex isolates.
| no data | 2012 | 2013 | 2014 | 2015 | 2016 | 2017 | 2018 | 2019 | 2020 | 2021 | |
|---|---|---|---|---|---|---|---|---|---|---|---|
| Mono-resistance | n | 128 | 93 | 107 | 114 | 108 | 101 | 121 | 146 | 131 | 131 |
| % | 9.1% | 6.8% | 7.8% | 8.5% | 7.4% | 6.6% | 8.3% | 9.0% | 8.2% | 8.5% | |
| Poly-resistance | n | 2 | 4 | 4 | 3 | 5 | 6 | 5 | 5 | 7 | 4 |
| % | 0.1% | 0.3% | 0.3% | 0.2% | 0.3% | 0.4% | 0.3% | 0.3% | 0.4% | 0.3% | |
| MDR | n | 8 | 14 | 18 | 22 | 17 | 14 | 21 | 20 | 15 | 16 |
| % | 0.6% | 1.0% | 1.3% | 1.6% | 1.2% | 0.9% | 1.4% | 1.2% | 0.9% | 1.0% | |
| XDR | n | 1 | 1 | 1 | 0 | 0 | 0 | 1 | 0 | 0 | 1 |
| % | 0.1% | 0.1% | 0.1% | 0% | 0% | 0% | 0.1% | 0% | 0% | 0.1% | |
| Note: Proportions presented are based on total number of isolates in each diagnosis year. | |||||||||||
| Drug resistance | Age (in years) | n | % |
|---|---|---|---|
| Mono-resistance | <5 | 1 | 0.1% |
| 5-14 | 2 | 0.1% | |
| 15-24 | 14 | 0.9% | |
| 25-34 | 29 | 1.9% | |
| 35-44 | 17 | 1.1% | |
| 45-54 | 23 | 1.5% | |
| 55-64 | 16 | 1.0% | |
| 65-74 | 13 | 0.8% | |
| ≥75 | 16 | 1.0% | |
| Poly-resistance | 15-24 | 1 | 0.1% |
| 25-34 | 2 | 0.1% | |
| 45-54 | 1 | 0.1% | |
| MDR | 15-24 | 3 | 0.2% |
| 25-34 | 5 | 0.3% | |
| 35-44 | 2 | 0.1% | |
| 45-54 | 4 | 0.3% | |
| 55-64 | 1 | 0.1% | |
| 65-74 | 1 | 0.1% | |
| XDR | 15-24 | 1 | 0.1% |
| Note: Proportions presented are based on total number of isolates. | |||
Resistance by population group
Resistance data is typically presented using data from the isolate-based CTBLSS, as it is the most complete source of TB drug resistance data in Canada. However, its limitation is that it does not collect information on epidemiological data. While the case-based CTBRS collects less complete lab data, it collects data on epidemiological characteristics including population groups. In this report, the CTBRS data was used to provide an indication of patterns of resistance by population group.
Among cases with a reported population group, rates of drug resistance have been generally stable over the past decade except for the non-Indigenous Canadian born group where the rate has ranged between 4.9% in 2018 (n=5/103) to 14.0% in 2021 (n=7/50). In 2021, the rate among persons born outside of Canada was 6.1% (n=64/1,055). The rate was lowest among the Indigenous population (overall) at 0.9% (n=2/232) (Table 22).
| no data | 2012 | 2013 | 2014 | 2015 | 2016 | 2017 | 2018 | 2019 | 2020 | 2021Footnote * | ||
|---|---|---|---|---|---|---|---|---|---|---|---|---|
| Individuals born outside of Canada | Resistance | n | 98 | 91 | 111 | 113 | 106 | 98 | 113 | 124 | 98 | 64 |
| % | 8.8% | 7.9% | 10.0% | 9.6% | 8.6% | 7.4% | 8.6% | 8.7% | 7.4% | 6.1% | ||
| Total cases | n | 1,112 | 1,153 | 1,110 | 1,178 | 1,231 | 1,319 | 1,315 | 1,427 | 1,316 | 1,055 | |
| Non-Indigenous Canadian born | Resistance | n | 20 | 12 | 11 | 15 | 7 | 7 | 5 | 9 | 4 | 7 |
| % | 11.5% | 7.5% | 6.5% | 8.8% | 5.0% | 5.6% | 4.9% | 9.6% | 5.8% | 14.0% | ||
| Total cases | n | 174 | 159 | 168 | 170 | 140 | 125 | 103 | 94 | 69 | 50 | |
| Indigenous Peoples | Resistance | n | 9 | 2 | 7 | 2 | 1 | 5 | 4 | 5 | 2 | 2 |
| % | 2.4% | 0.6% | 2.2% | 0.7% | 0.3% | 1.6% | 1.3% | 1.7% | 1.0% | 0.9% | ||
| Total cases | n | 380 | 315 | 320 | 281 | 332 | 314 | 300 | 291 | 206 | 232 | |
|
||||||||||||
Proportionally, individuals born outside of Canada accounted for 87.7% (n=64/73) of resistant cases and represented 76.7% (n=1,055/1,376) of TB cases in 2021. Comparatively, Indigenous Peoples accounted for 2.7% (n=2/73) of resistant cases but represented 16.9% (n=232/1,376) of TB cases, and the non-Indigenous Canadian born population accounted for 9.6% (n=7/73) of resistant cases but represented 3.6% (n=50/1,376) of TB cases in 2021 (Figure 16; Table 22).

Figure 16 - Text description
| Population group | 2012 | 2013 | 2014 | 2015 | 2016 | 2017 | 2018 | 2019 | 2020 | 2021Footnote * |
|---|---|---|---|---|---|---|---|---|---|---|
| Individuals born outside Canada | 77.2% | 86.7% | 86.0% | 86.9% | 93.0% | 89.1% | 92.6% | 89.9% | 94.2% | 87.7% |
| Non-Indigenous Canadian-born | 15.7% | 11.4% | 8.5% | 11.5% | 6.1% | 6.4% | 4.1% | 6.5% | 3.8% | 9.6% |
| Indigenous | 7.1% | 1.9% | 5.4% | 1.5% | 0.9% | 4.5% | 3.3% | 3.6% | 1.9% | 2.7% |
|
||||||||||
Notes: 2021 data were not available for Quebec population groups.
2016-2021 data were not available for British Columbia Indigenous identity and the non-Indigenous Canadian born.
Proportions presented are among total number of resistant cases in each diagnosis year.
TB outcomes
1. Treatment outcomes
Data on TB treatment outcomes were reported to the CTBRS for 1,551 active TB cases (cases identified in the 2020 surveillance year for which outcome data was available). Treatment was successful for 76.1% of these cases (n=1,181/1,551), meaning they were either cured or successfully completed the full course of treatment in 2020 (Table 23). About 5% (n=73/1,551) of cases were still receiving ongoing treatment, and 9.4% (n=146/1,551) were not evaluated at the time of data submission to PHAC (Table 23). This latter group includes cases that were 'transferred out' meaning that they were diagnosed and reported in a particular PT but moved out of that PT prior to treatment completion.
The percentage of TB cases successfully treated between 2011 and 2020 has consistently been below the ≥90% target recommended in the Canadian TB Standards ranging from 75.8% to 84.3% (Table 23). Treatment success rates presented in this report exclude TB cases that were still undergoing treatment at the time of reporting, and cases where outcomes were not evaluated if the patient transferred to another jurisdiction (when a case moves between PTs, TB care and treatment is often completed in the new PT of residence, but outcomes are often not reported to the national surveillance system). As such these estimates likely underestimate true rate of treatment completion. Of note, the treatment failure rate remained low in 2020 at 0.3% and was low during the entire surveillance reporting period ranging from between 0.1% to 0.6% (Table 23).
| no data | Total cases | Treatment success | Treatment ongoing | Failure | Lost to follow up | Not evaluated | Death | |||
|---|---|---|---|---|---|---|---|---|---|---|
| TB-related death | Death not related to TB | Unknown if death related to TB | ||||||||
| 2020Footnote * | n | 1,551 | 1,181 | 73 | 5 | 24 | 146 | 78 | 21 | 23 |
| % | 100% | 76.1% | 4.7% | 0.3% | 1.5% | 9.4% | 5.0% | 1.4% | 1.5% | |
| 2019 | n | 1,921 | 1,519 | 82 | 7 | 40 | 153 | 69 | 35 | 16 |
| % | 100% | 79.1% | 4.3% | 0.4% | 2.1% | 8.0% | 3.6% | 1.8% | 0.8% | |
| 2018 | n | 1,794 | 1,464 | 44 | 2 | 24 | 122 | 99 | 32 | 7 |
| % | 100% | 81.6% | 2.5% | 0.1% | 1.3% | 6.8% | 5.5% | 1.8% | 0.4% | |
| 2017 | n | 1,831 | 1,484 | 71 | 1 | 21 | 126 | 90 | 20 | 18 |
| % | 100% | 81.0% | 3.9% | 0.1% | 1.1% | 6.9% | 4.9% | 1.1% | 1.0% | |
| 2016 | n | 1,762 | 1,406 | 73 | 2 | 10 | 136 | 89 | 35 | 11 |
| % | 100% | 79.8% | 4.1% | 0.1% | 0.6% | 7.7% | 5.1% | 2.0% | 0.6% | |
| 2015 | n | 1,643 | 1,382 | 31 | 4 | 18 | 66 | 107 | 25 | 10 |
| % | 100% | 84.1% | 1.9% | 0.2% | 1.1% | 4.0% | 6.5% | 1.5% | 0.6% | |
| 2014 | n | 1,615 | 1,361 | 39 | 10 | 20 | 63 | 91 | 22 | 9 |
| % | 100% | 84.3% | 2.4% | 0.6% | 1.2% | 3.9% | 5.6% | 1.4% | 0.6% | |
| 2013 | n | 1,651 | 1,378 | 62 | 10 | 17 | 58 | 82 | 33 | 11 |
| % | 100% | 83.5% | 3.8% | 0.6% | 1.0% | 3.5% | 5.0% | 2.0% | 0.7% | |
| 2012 | n | 1,700 | 1,415 | 66 | 8 | 22 | 60 | 79 | 46 | 4 |
| % | 100% | 83.2% | 3.9% | 0.5% | 1.3% | 3.5% | 4.6% | 2.7% | 0.2% | |
| 2011 | n | 1,621 | 1,228 | 48 | 4 | 6 | 195 | 103 | 32 | 5 |
| % | 100% | 75.8% | 3.0% | 0.2% | 0.4% | 12.0% | 6.4% | 2.0% | 0.3% | |
|
||||||||||
Information regarding cases who were re-treated for TB in 2020 is presented in Table 24. Outcomes were known for 81.0% (n=47/58) of these cases; the remaining 11 cases were lost to follow up or not evaluated. Treatment was successful for 67.2% (n=39/58) of re-treatment cases, 8.6% (n=5/58) of cases died, and 5.2% (n=3/58) were still undergoing treatment at the time of data collection. No treatment failures were reported (Table 24).
| no data | Total cases | Treatment success | Treatment ongoing | Failure | Lost to follow up | Not evaluated | Death | |||
|---|---|---|---|---|---|---|---|---|---|---|
| TB-related death | Death not related to TB | Unknown if death related to TB | ||||||||
| 2020 | n | 58 | 39 | 3 | 0 | 3 | 8 | 4 | 0 | 1 |
| % | 100% | 67.2% | 5.2% | 0.0% | 5.2% | 13.8% | 6.9% | 0.0% | 1.7% | |
Note: 2020 data were not available for Quebec |
||||||||||
Examining treatment outcomes by jurisdiction, treatment success rates in 2020 varied across the country from 58.3% to 88.0%. While the rates in several smaller PTs are unstable due to small numbers, treatment success rates were likely influenced by cases where treatment was ongoing (i.e., Ontario and Manitoba) or not evaluated. As previously mentioned, this latter category includes transfers out of province where treatment may have continued and been successful but were not captured by the national reporting system (Table 25).
| Jurisdiction | Total cases | Treatment success | Treatment ongoing | Failure | Lost to follow up | Not evaluated | Death | ||||||||||
|---|---|---|---|---|---|---|---|---|---|---|---|---|---|---|---|---|---|
| TB-related death | Death not related to TB | Unknown if death related to TB | |||||||||||||||
| n | n | % | n | % | n | % | n | % | n | % | n | % | n | % | n | % | |
| NL | 11 | 9 | 81.8% | 0 | 0% | 0 | 0% | 0 | 0% | 2 | 18.2% | 0 | 0% | 0 | 0% | 0 | 0% |
| PEI | 3 | 2 | 66.7% | 0 | 0% | 0 | 0% | 0 | 0% | 0 | 0% | 1 | 33.3% | 0 | 0% | 0 | 0% |
| NS | 12 | 7 | 58.3% | 0 | 0% | 0 | 0% | 0 | 0% | 4 | 33.3% | 1 | 8.3% | 0 | 0% | 0 | 0% |
| NB | 9 | 6 | 66.7% | 0 | 0% | 0 | 0% | 0 | 0% | 2 | 22.2% | 1 | 11.1% | 0 | 0% | 0 | 0% |
| ON | 675 | 500 | 74.1% | 54 | 8.0% | 3 | 0.4% | 1 | 0.1% | 52 | 7.7% | 38 | 5.6% | 11 | 1.6% | 16 | 2.4% |
| MB | 146 | 107 | 73.3% | 19 | 13.0% | 0 | 0% | 5 | 3.4% | 7 | 4.8% | 4 | 2.7% | 1 | 0.7% | 3 | 2.1% |
| SK | 102 | 80 | 78.4% | 0 | 0% | 0 | 0% | 5 | 4.9% | 11 | 10.8% | 4 | 3.9% | 0 | 0% | 2 | 2.0% |
| AB | 251 | 221 | 88.0% | 0 | 0% | 0 | 0% | 2 | 0.8% | 10 | 4.0% | 18 | 7.2% | 0 | 0% | 0 | 0% |
| BC | 300 | 217 | 72.3% | 0 | 0% | 1 | 0.3% | 7 | 2.3% | 55 | 18.3% | 10 | 3.3% | 9 | 3.0% | 1 | 0.3% |
| YT | 1 | 0 | 0% | 0 | 0% | 1 | 100% | 0 | 0% | 0 | 0% | 0 | 0% | 0 | 0% | 0 | 0% |
| NWT | 7 | 5 | 71.4% | 0 | 0% | 0 | 0% | 0 | 0% | 1 | 14.3% | 1 | 14.3% | 0 | 0% | 0 | 0% |
| NU | 34 | 27 | 79.4% | 0 | 0% | 0 | 0% | 4 | 11.8% | 2 | 5.9% | 0 | 0% | 0 | 0% | 1 | 2.9% |
| Canada | 1,551 | 1,181 | 76.1% | 73 | 4.7% | 5 | 0.3% | 24 | 1.5% | 146 | 9.4% | 78 | 5.0% | 21 | 1.4% | 23 | 1.5% |
Notes: 2020 data were not available for Quebec. |
|||||||||||||||||
A breakdown of treatment outcomes by age showed that treatment success was higher in younger individuals, especially those under the age of 55 years (range: 80.0%-88.5%). The highest treatment success rates in 2020 were observed in individuals under the age of 5 (88.5%; n=23/26) and for those aged 25 to 34 years (85.0%; n=244/287) (Table 26).
| Age (in years) | Total cases | Treatment success | Treatment ongoing | Failure | Lost to follow up | Death | Not evaluated | |
|---|---|---|---|---|---|---|---|---|
| <5 | n | 26 | 23 | 1 | 0 | 0 | 0 | 2 |
| % | 100% | 88.5% | 3.8% | 0% | 0% | 0% | 7.7% | |
| 5-14 | n | 30 | 24 | 2 | 0 | 0 | 0 | 4 |
| % | 100% | 80.0% | 6.7% | 0% | 0% | 0% | 13.3% | |
| 15-24 | n | 261 | 209 | 10 | 0 | 5 | 3 | 34 |
| % | 100% | 80.1% | 3.8% | 0% | 1.9% | 1.1% | 13.0% | |
| 25-34 | n | 287 | 244 | 12 | 0 | 7 | 4 | 20 |
| % | 100% | 85.0% | 4.2% | 0% | 2.4% | 1.4% | 7.0% | |
| 35-44 | n | 224 | 182 | 13 | 2 | 3 | 5 | 19 |
| % | 100% | 81.3% | 5.8% | 0.9% | 1.3% | 2.2% | 8.5% | |
| 45-54 | n | 191 | 161 | 9 | 1 | 3 | 8 | 9 |
| % | 100% | 84.3% | 4.7% | 0.5% | 1.6% | 4.2% | 4.7% | |
| 55-64 | n | 176 | 125 | 11 | 0 | 3 | 18 | 19 |
| % | 100% | 71.0% | 6.3% | 0% | 1.7% | 10.2% | 10.8% | |
| 65-74 | n | 161 | 114 | 7 | 2 | 2 | 18 | 18 |
| % | 100% | 70.8% | 4.3% | 1.2% | 1.2% | 11.2% | 11.2% | |
| ≥75 | n | 195 | 99 | 8 | 0 | 1 | 66 | 21 |
| % | 100% | 50.8% | 4.1% | 0% | 0.5% | 33.8% | 10.8% | |
Notes: 2020 data were not available for Quebec. |
||||||||
2. TB-related deaths
The following section describes aggregate information for TB-related deaths according to age and sex, and population group for the 2011 to 2020 period.
TB-related deaths by age and sex
Among active TB cases reported in 2020, there were n=122/1,551 (7.9%) individuals who died of any cause either before or during the prescribed TB treatment (Table 27). TB was the underlying cause or a contributing factor to death for 78 (63.9%) of the 122 deaths. In 2020, the CFR was 5.0%. This rate has remained relatively stable between 2011 and 2020, ranging between 4.6% and 6.5%, except for a slightly lower rate of 3.6% in 2019 (Figure 17). The CFR was higher in males (6.0%) compared to females (3.9%), a trend that has been consistent over time (Figure 18).
The majority of TB-related deaths in 2020 were among individuals 65 years of age or older (73.1%; n=57/78). Of the remaining 21 TB-related deaths, 20 (25.6%) were among 25 to 64-year-old adults, and one (1.3%) was in the 15 to 24-year-old age group. No TB-related deaths were reported among children under 15 years of age (Table 27).
The CFR for TB was observed to increase with age and was highest among persons above the age of 74 years (21.5%); this finding has remained consistent over the reporting period (Figure 19).
| Age (in years) | Total | TB was the underlying cause of death | TB was a contributing factor to death | TB did not contribute to death | Unknown cause of death | |||||
|---|---|---|---|---|---|---|---|---|---|---|
| n | % | n | % | n | % | n | % | n | % | |
| <5 | 0 | 0% | 0 | 0% | 0 | 0% | 0 | 0% | 0 | 0% |
| 5-14 | 0 | 0% | 0 | 0% | 0 | 0% | 0 | 0% | 0 | 0% |
| 15-24 | 3 | 2.5% | 1 | 0.8% | 0 | 0% | 1 | 0.8% | 1 | 0.8% |
| 25-34 | 4 | 3.3% | 2 | 1.6% | 1 | 0.8% | 0 | 0% | 1 | 0.8% |
| 35-44 | 5 | 4.1% | 0 | 0% | 2 | 1.6% | 3 | 2.5% | 0 | 0% |
| 45-54 | 8 | 6.6% | 2 | 1.6% | 3 | 2.5% | 2 | 1.6% | 1 | 0.8% |
| 55-64 | 18 | 14.8% | 2 | 1.6% | 8 | 6.6% | 3 | 2.5% | 5 | 4.1% |
| 65-74 | 18 | 14.8% | 5 | 4.1% | 10 | 8.2% | 1 | 0.8% | 2 | 1.6% |
| ≥75 | 66 | 54.1% | 14 | 11.5% | 28 | 23.0% | 11 | 9.0% | 13 | 10.7% |
| Total | 122 | 100% | 26 | 21.3% | 52 | 42.6% | 21 | 17.2% | 23 | 18.9% |
Note: 2020 data was not available for Quebec. |
||||||||||
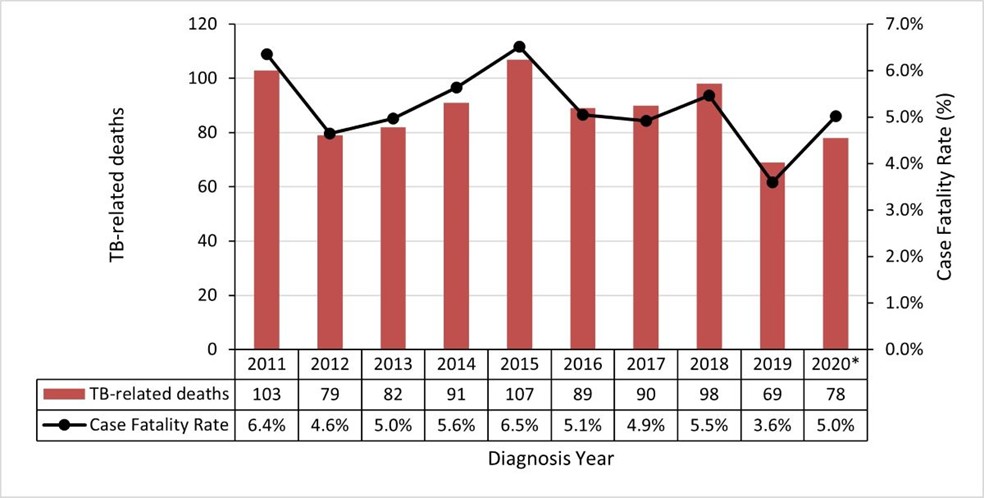
Figure 17 - Text description
| no data | 2011 | 2012 | 2013 | 2014 | 2015 | 2016 | 2017 | 2018 | 2019 | 2020Footnote * |
|---|---|---|---|---|---|---|---|---|---|---|
| TB-related deaths | 103 | 79 | 82 | 91 | 107 | 89 | 90 | 98 | 69 | 78 |
| Case Fatality Rate | 6.4% | 4.6% | 5.0% | 5.6% | 6.5% | 5.1% | 4.9% | 5.5% | 3.6% | 5.0% |
|
||||||||||
Note: *2020 data was not available for Quebec.
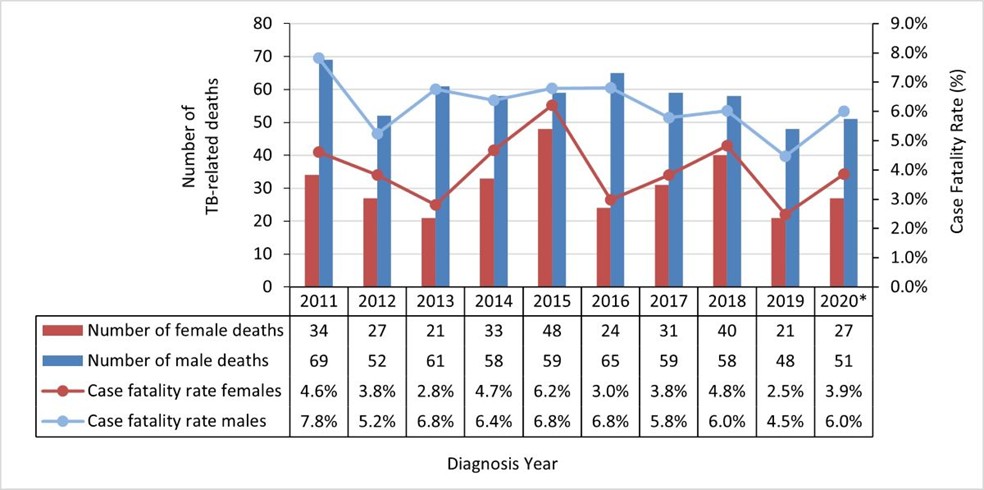
Figure 18 - Text description
| no data | 2011 | 2012 | 2013 | 2014 | 2015 | 2016 | 2017 | 2018 | 2019 | 2020Footnote * |
|---|---|---|---|---|---|---|---|---|---|---|
| Number of female deaths | 34 | 27 | 21 | 33 | 48 | 24 | 31 | 40 | 21 | 27 |
| Number of male deaths | 69 | 52 | 61 | 58 | 59 | 65 | 59 | 58 | 48 | 51 |
| Case fatality rate females | 4.6% | 3.8% | 2.8% | 4.7% | 6.2% | 3.0% | 3.8% | 4.8% | 2.5% | 3.9% |
| Case fatality rate males | 7.8% | 5.2% | 6.8% | 6.4% | 6.8% | 6.8% | 5.8% | 6.0% | 4.5% | 6.0% |
|
||||||||||
Note: *2020 data was not available for Quebec.
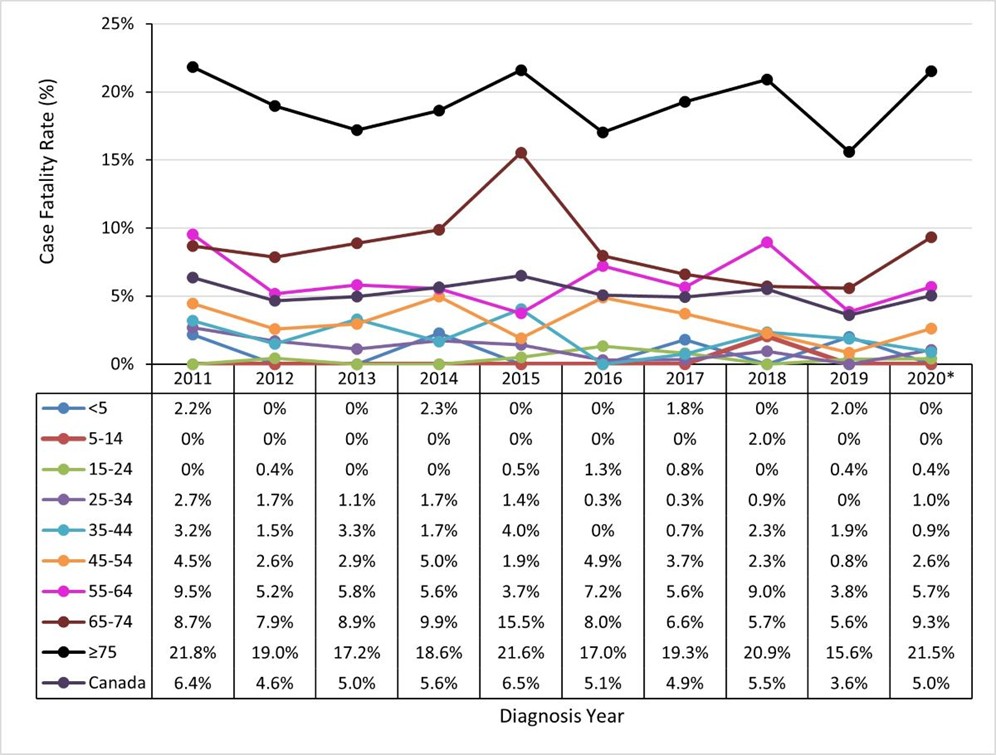
Figure 19 - Text description
| Age group in years | 2011 | 2012 | 2013 | 2014 | 2015 | 2016 | 2017 | 2018 | 2019 | 2020Footnote * |
|---|---|---|---|---|---|---|---|---|---|---|
| <5 | 2.2% | 0% | 0% | 2.3% | 0% | 0% | 1.8% | 0% | 2.0% | 0% |
| 5-14 | 0% | 0% | 0% | 0% | 0% | 0% | 0% | 2.0% | 0% | 0% |
| 15-24 | 0% | 0.4% | 0% | 0% | 0.5% | 1.3% | 0.8% | 0% | 0.4% | 0.4% |
| 25-34 | 2.7% | 1.7% | 1.1% | 1.7% | 1.4% | 0.3% | 0.3% | 0.9% | 0% | 1.0% |
| 35-44 | 3.2% | 1.5% | 3.3% | 1.7% | 4.0% | 0% | 0.7% | 2.3% | 1.9% | 0.9% |
| 45-54 | 4.5% | 2.6% | 2.9% | 5.0% | 1.9% | 4.9% | 3.7% | 2.3% | 0.8% | 2.6% |
| 55-64 | 9.5% | 5.2% | 5.8% | 5.6% | 3.7% | 7.2% | 5.6% | 9.0% | 3.8% | 5.7% |
| 65-74 | 8.7% | 7.9% | 8.9% | 9.9% | 15.5% | 8.0% | 6.6% | 5.7% | 5.6% | 9.3% |
| 75+ | 21.8% | 19.0% | 17.2% | 18.6% | 21.6% | 17.0% | 19.3% | 20.9% | 15.6% | 21.5% |
| Canada | 6.4% | 4.6% | 5.0% | 5.6% | 6.5% | 5.1% | 4.9% | 5.5% | 3.6% | 5.0% |
|
||||||||||
Note: *2020 data was not available for Quebec.
TB-related deaths by population groups
Examining TB deaths by population groups showed that in 2020, 73.1% (n=57/78) of all TB-related deaths occurred in cases born outside Canada (Figure 20), 1.3% (n=1/78) were reported among the non-Indigenous Canadian born population, and another 11.5% (n=9/78) were among Indigenous Peoples. The remaining 11.5% (n=9/78) of TB-related deaths were among individuals with missing information on population group.
Examining data aggregated over the decade 2011-2020, the proportion of deaths increased with age among the non-Indigenous Canadian born and individuals born outside of Canada population groups (Table 28).
In 2020 the CFR was 7.4% among First Nations, 4.8% among individuals born outside of Canada, 1.9% among the non-Indigenous Canadian born population and 0% among the Metis and Inuit (Figure 21). It is of note that in the non-Indigenous Canadian born population, the CFR was lower in 2020 compared to the previous nine years; between 2011 and 2019 it ranged from 5.7% to 16.5%. The reason for this decline is not clear. Additionally, between 2011 and 2020, the Inuit population consistently had a lower CFR compared to other groups ranging from 0 to 3.4%, despite a high incidence rate. The CFR among the Métis over this time-period was variable due to the small number of TB cases in this population. For example, the CFR that was observed in 2015 (25.0%), illustrated in Figure 21, was due to n=3/12 deaths (Figure 20).

Figure 20 - Text description
| no data | 2011 | 2012 | 2013 | 2014 | 2015 | 2016 | 2017 | 2018 | 2019 | 2020Footnote * |
|---|---|---|---|---|---|---|---|---|---|---|
| Deaths: Non-Indigenous Canadian born | 14 | 10 | 9 | 11 | 13 | 13 | 8 | 17 | 8 | 1 |
| Deaths: Individuals born outside Canada | 53 | 44 | 54 | 62 | 76 | 58 | 63 | 67 | 50 | 57 |
| Deaths: First Nations | 25 | 14 | 9 | 9 | 9 | 7 | 5 | 7 | 5 | 9 |
| Deaths: Inuit | 0 | 0 | 2 | 4 | 0 | 0 | 4 | 1 | 0 | 0 |
| Deaths: Metis | 2 | 1 | 0 | 2 | 3 | 1 | 1 | 0 | 0 | 0 |
|
||||||||||
Notes: *2020 data was not available for Quebec.
2016-2021 data were not available for British Columbia for Indigenous identity.
| Age (in years) | Total | Canadian-born | Individuals born outside of Canada | Unknown population group | ||||||||||||
|---|---|---|---|---|---|---|---|---|---|---|---|---|---|---|---|---|
| First Nations | Inuit | Métis | Canadian-born non-Indigenous | Unknown Indigenous identity | ||||||||||||
| n | % | n | % | n | % | n | % | n | % | n | % | n | % | n | % | |
| <5 | 4 | 0.5% | 2 | 0.2% | 0 | 0% | 0 | 0% | 1 | 0.1% | 1 | 0.1% | 0 | 0% | 0 | 0% |
| 5-14 | 1 | 0.1% | 0 | 0% | 1 | 0.1% | 0 | 0% | 0 | 0% | 0 | 0% | 0 | 0% | 0 | 0% |
| 15-24 | 9 | 1.0% | 1 | 0.1% | 2 | 0.2% | 0 | 0% | 0 | 0% | 0 | 0% | 6 | 0.7% | 0 | 0% |
| 25-34 | 33 | 3.7% | 9 | 1.0% | 3 | 0.3% | 1 | 0.1% | 3 | 0.3% | 0 | 0% | 13 | 1.5% | 4 | 0.5% |
| 35-44 | 49 | 5.5% | 13 | 1.5% | 3 | 0.3% | 2 | 0.2% | 2 | 0.2% | 0 | 0% | 25 | 2.8% | 4 | 0.5% |
| 45-54 | 68 | 7.7% | 22 | 2.5% | 0 | 0% | 1 | 0.1% | 10 | 1.1% | 2 | 0.2% | 30 | 3.4% | 3 | 0.3% |
| 55-64 | 114 | 12.9% | 22 | 2.5% | 2 | 0.2% | 3 | 0.3% | 15 | 1.7% | 2 | 0.2% | 62 | 7.0% | 8 | 0.9% |
| 65-74 | 152 | 17.1% | 15 | 1.7% | 0 | 0% | 1 | 0.1% | 17 | 1.9% | 0 | 0% | 110 | 12.4% | 9 | 1.0% |
| ≥75 | 457 | 51.5% | 15 | 1.7% | 0 | 0% | 2 | 0.2% | 56 | 6.3% | 5 | 0.6% | 338 | 38.1% | 41 | 4.6% |
| Total | 887 | 100% | 99 | 11.2% | 11 | 1.2% | 10 | 1.1% | 104 | 11.7% | 10 | 1.1% | 584 | 65.8% | 69 | 7.8% |
Note: 2020 data was not available for Quebec. |
||||||||||||||||
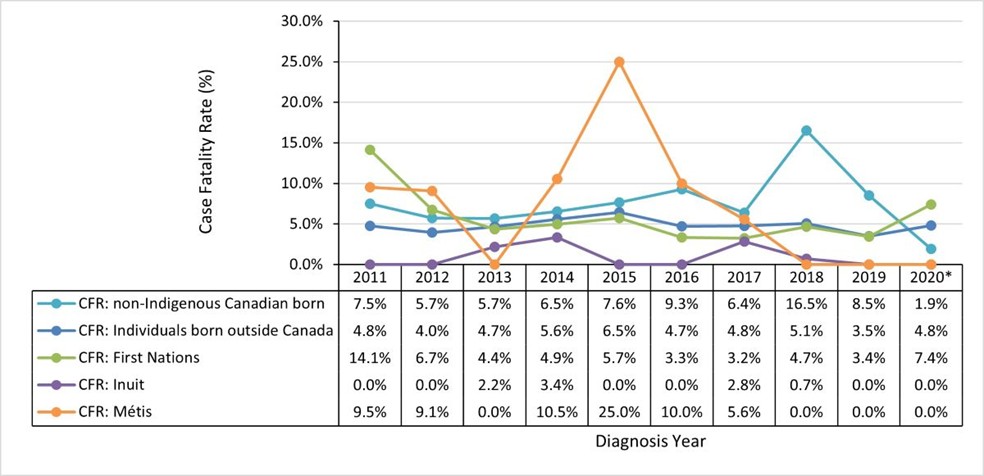
Figure 21 - Text description
| no data | 2011 | 2012 | 2013 | 2014 | 2015 | 2016 | 2017 | 2018 | 2019 | 2020Footnote * |
|---|---|---|---|---|---|---|---|---|---|---|
| CFR: non-Indigenous Canadian born | 7.5% | 5.7% | 5.7% | 6.5% | 7.6% | 9.3% | 6.4% | 16.5% | 8.5% | 1.9% |
| CFR: Individuals born outside Canada | 4.8% | 4.0% | 4.7% | 5.6% | 6.5% | 4.7% | 4.8% | 5.1% | 3.5% | 4.8% |
| CFR: First Nations | 14.1% | 6.7% | 4.4% | 4.9% | 5.7% | 3.3% | 3.2% | 4.7% | 3.4% | 7.4% |
| CFR: Inuit | 0.0% | 0.0% | 2.2% | 3.4% | 0.0% | 0.0% | 2.8% | 0.7% | 0.0% | 0.0% |
| CFR: Metis | 9.5% | 9.1% | 0.0% | 10.5% | 25.0% | 10.0% | 5.6% | 0.0% | 0.0% | 0.0% |
|
||||||||||
Notes: *2020 data was not available for Quebec.
2016-2021 data were not available for British Columbia for Indigenous identity.
Discussion
This report provides partners and stakeholders in Canada with detailed aggregated epidemiological data from 2011 to 2021 regarding incident active TB reported to the CTBRS and the CTBLSS, while outcome data is available only up to year 2020. The following section outlines the key findings for this period of surveillance with high-level comparisons to other low TB incidence countries. A more detailed discussion and expert recommendations based on the findings of the CTBRS and CTBLSS surveillance systems have been published in the 8th Edition of the Canadian Tuberculosis Standards, by subject areaFootnote 15.
TB incidence in Canada
Overall, the incidence of active TB in Canada has remained relatively stable over the surveillance period, ranging between 4.6 and 5.1 per 100,000 per year. Based on this rate, Canada remains within the WHO criteria for low TB incidence countries: a TB incidence less than 100 per million (or 10 per 100,000)Footnote 1. In comparison to other low-incidence countries, the incidence of TB in Canada (in 2021) was two times higher than that of the United States of America (USA) (2.4 per 100,000), and lower than Germany (5.0 per 100,000), the United Kingdom (UK) (6.4 per 100,000), France (7.6 per 100,000), and the European Union (EU) (8.4 per 100,000) (Table 29)Footnote 16 ,Footnote 17. While the incidence in the USA, Germany, the UK, and the EU has been declining progressively, in Canada the incidence has either been increasing or remained stable (Table 29).
| Country/area | 2017 | 2018 | 2019 | 2020 | 2021 |
|---|---|---|---|---|---|
| USA | 9,069 (2.8) | 8,998 (2.8) | 8,898 (2.7) | 7,171 (2.2) | 7,882 (2.4) |
| Canada | 1,831 (5.0) | 1,794 (4.8) | 1,921 (5.1) | 1,791 (4.7) | 1,829 (4.8) |
| Germany | 5,900 (7.1) | 5,800 (7.0) | 5100 (6.1) | 4,400 (5.3) | 4,200 (5.0) |
| UK | 5,900 (8.9) | 5,400 (8.1) | 5,400 (8.1) | 4,700 (7.0) | 4,300 (6.4) |
| France | 5,900 (9.2) | 5,800 (9.0) | 5,900 (9.2) | 5,300 (8.2) | 4,900 (7.6) |
| EU | 55.000 (12.2) | 53,000 (11.8) | 50,000 (11.0) | 37,000 (8.2) | 38,000 (8.4) |
| Non-EU European countries | 218,000 (46.1) | 206,000 (43.4) | 196,000 (41.1) | 191,000 (39.9) | 193,000 (40.2) |
Although Canada's TB rate remains below the WHO low incidence threshold, the incidence of TB was not equally distributed by geographic region and population groups, including Indigenous Peoples and people born outside of Canada. In fact, the incidence among some population groups was higher than the WHO low incidence threshold, and in some smaller populations such as the Inuit population, the incidence was comparable to some high burden TB countries.
These inequities in incidence reflect the social disparities and their persisting impacts on the social conditions experienced by Indigenous Peoples and their communities that increase the risk for TB.
TB rates during the coronavirus disease 2019 (COVID-19) pandemic
In 2020, there was a 6.8% decrease in the number of reported incident cases of active TB in Canada compared with 2019: from 1,921 to 1,791, and a decrease in the rate of TB from 5.1 to 4.7 per 100,000, respectively. This change in the number and rate of active TB has been the largest one-year change recorded in the past decade. The decrease of active TB case notifications observed in 2020 appears to be a global phenomenon as shown in Table 29. In 2021, there was a rebound in the number of reported TB cases, from 1,772 in 2020 to 1,829 in 2021, and the rate increased slightly from 4.7 to 4.8 per 100,000.
In its 2022 Global TB Report, the WHO reports a pattern of initial decrease in reported TB cases during the pandemic, followed by an increase in 2021Footnote 2. Comparatively in Canada, while the number of cases decreased followed by a rebound, the decrease both in absolute number and rate was not considerable and remained comparable to other years in the past decade. The only exception being the number and rates for specific population groups, such as the Inuit population, where the number of cases and rates dipped significantly in 2020. This decrease is difficult to interpret however, as there were significant decreases in the reporting for the Inuit population and Quebec, and there is likely underestimation of the numbers and rates.
The reasons for the global decline in reported rates of TB during the COVID-19 pandemic has been hypothesized to be due to underdiagnoses of TB, secondary to decreased access to healthcare services, decreased TB-specific health services or programs (where resources were diverted to COVID-19 efforts), misdiagnosis or delayed diagnosis, or a true reduction in incidence as a result of the public health interventions implemented to reduce the spread of COVID-19. In addition, an overall reluctance or decreased ability to seek medical care during the pandemic may further have contributed to the underdiagnoses of active TB cases. The full scope of the COVID-19 pandemic impact is yet to be fully elucidated and TB surveillance in the coming years will shed light on the reason for global trends of reduced TB incidence.
Geographic trends within Canada
Though the overall TB rate in Canada remains low, significant differences exist across geographic regions. The Atlantic region (Prince Edward Island, Nova Scotia, Newfoundland & Labrador and New Brunswick) consistently reported the lowest rates in 2021, ranging from 1.0 per 100,000 to 1.7 per 100,000. Nunavut continued to report the highest TB rates in Canada at 191.4 per 100,000 in 2021. However, by number and proportion of cases, Ontario accounted for the highest proportion at 37.4% (n=683/1,829), followed by British Columbia at 15.8% (n=289/1,829) and Alberta at 13.2% (n=241/1,829). These geographic variations are due in part to population sizes, with the larger provinces of Ontario, British Columbia, and Alberta accounting for a larger proportion of cases. However, the higher rates in certain PTs are likely reflective of population demographics. There is a disproportionately higher rate of TB among Inuit in Canada, a majority of whom live in the territory of Nunavut, and provinces such as Manitoba and Saskatchewan have higher proportions of First Nations Peoples, particularly those living on-reserve who are also disproportionately impacted by TB outbreaks. The demographics of cases vary by PT, and while Indigenous Peoples experienced some of the highest rates, people born outside of Canada accounted for a majority of incident TB cases in Canada. Provinces such as Ontario, British Columbia, and Alberta had a larger proportion of cases that were born outside of Canada. These variations support a need for tailoring unique approaches for programs aiming to prevent, detect and treat TB in the different PTs.
Age distribution
In relation to other low TB-incidence countries, Canada reported relatively similar age-specific TB incidence rates as EU countries in 2021Footnote 16,Footnote 18, however, the age specific rates were higher in Canada when compared to the USA (Table 30). This is possibly related to differences in demographics including immigration patterns.
| Age (in years) |
France | Germany | UK | USA | EU | Non-EU | Canada |
|---|---|---|---|---|---|---|---|
| < 5 | 79 (2.2) | 69 (1.7) | 40 (1.1) | 160 (0.8) | 441 (2.1) | 1,386 (4.3) | 39 (2.1) |
| 5-14 | 88 (1.1) | 84 (1.1) | 100 (1.2) | 157 (0.4) | 665 (1.4) | 4,220 (6.2) | 49 (1.2) |
| 15-24 | 710 (8.9) | 626 (7.3) | 571 (7.3) | 675 (1.6) | 3,687 (7.7) | 11,480 (19.7) | 262 (5.8) |
| 25-44 | 1,571 (9.7) | 1,438 (6.9) | 2,112 (12.0) | 2,266 (2.5) | 10,822 (9.4) | 57,449 (40.4) | 637 (6.1) |
| 45-64 | 822 (4.7) | 877 (3.6) | 1,292 (7.5) | 2,409 (2.9) | 10,244 (8.1) | 43,478 (37.5) | 408 (4.0) |
| ≥ 65 | 772 (5.5) | 695 (3.8) | 680 (5.3) | 2,215 (4.0) | 6,158 (6.6) | 14,414 (22.7) | 434 (6.1) |
Over the past decade, the pediatric age groups consistently had the lowest incidence of all age groups over the surveillance period at around two to three cases per 100,000 for children under 5 years of age and one to two cases per 100,000 for the 5- to 14-year-old age group. Additionally, there was no notable increase in the rate for children under 5 years of age in Canada in 2021, however this will be monitored closely in subsequent surveillance years. Given that diagnostic testing has a lower sensitivity and clinical presentation is more challenging to identify in this age group, they may be more prone to under-detection and require special consideration in TB programming. Relative to other low incidence countries, the proportion of cases for children aged <15 years in Canada ranged from 3.9% to 6.7%, similar or slightly higher than the proportion in the USA (from 4.0% to 4.7%), the UK (2.9% to 3.8%) and Germany (3.9% to 4.4%) (Table 31)Footnote 16, Footnote 18.
| Country/area | 2017 | 2018 | 2019 | 2020 | 2021 |
|---|---|---|---|---|---|
| France | 343 (6.9%) | 248 (4.9%) | 238 (4.6%) | 195 (4.3%) | 168 (3.9%) |
| Germany | 242 (4.4%) | 213 (3.9%) | 195 (4.1%) | 168 (4.0%) | 153 (3.9%) |
| UK | 195 (3.7%) | 159 (3.3%) | 182 (3.8%) | 153 (3.7%) | 140 (2.9%) |
| USA | 429 (4.7%) | 372 (4.1%) | 365 (4.1%) | 317 (4.4%) | 317 (4.0%) |
| EU | 2,176 (3.9%) | 1,896 (3.6%) | 1,810 (3.6%) | 1,236 (3.7%) | 1,116 (3.3%) |
| Non-EU | 7,584 (4.0%) | 7,106 (3.9%) | 7,047 (4.1%) | 5,326 (4.0%) | 5,630 (4.2%) |
| Canada | 122 (6.7%) | 100 (5.6%) | 113 (5.9%) | 70 (3.9%) | 88 (4.8%) |
Impacted populations in Canada
Within Canada, active TB continues to disproportionately impact Indigenous populations, particularly the Inuit population who have consistently reported the highest incidence of active TB in Canada for the duration of the surveillance period.
The rate of active TB disease has remained higher for First Nations overall and in First Nations on-reserve populations compared to First Nations off-reserve. While overall the Métis had active TB incidence rates that have remained below the overall Canadian rate since 2012, ranging from 2.1 to 3.7 per 100,000 (Figure 9b), cases were geographically clustered in Saskatchewan with a provincial incidence of 13.4 per 100,000 (n=9) in 2021. The fluctuating nature of incidence from year to year among Inuit and other Indigenous Peoples likely reflects the nature of the epidemiology of TB infections in these communities where TB occurs in outbreaks, as well as the small denominator size of these population groups. The disproportionate impact of TB disease on Indigenous Peoples is rooted in historical inequities and ongoing social disparities that have been widely acknowledgedFootnote 3,Footnote 4. This is a key area of focus going forward and a priority that was highlighted in the 2018 report on TB by the CPHOFootnote 3.
While the highest incidence of active TB was reported among Indigenous Peoples, individuals born outside of Canada continue to account for the largest proportion of total incident cases (roughly three quarters of the total number of active TB reported in Canada). Although the incidence is lower than that of Indigenous populations, it has remained consistently much higher than the Canadian overall rates and the rates among those born in Canada (12.3 per 100,000 for individuals born outside of Canada compared to approximately 4.8 per 100,000 for the overall Canadian rate).
Canada is a leading destination for migrants, receiving on average more than 250,000 immigrants and refugees per year and this number is increasing. Furthermore, the proportion of immigrants arriving from intermediate or high TB-incidence regions such as Asia, Africa and Latin America has increased over the past several decadesFootnote 19. In the 2016 census, an estimated 68% of migrants to Canada originated from countries with an intermediate or high TB incidence, and there were an estimated 7.5 million persons born outside Canada, accounting for 21.9% of the Canadian populationFootnote 19. In contrast, individuals born outside of Canada accounted for 76.7% of the reported TB cases in Canada in 2021 (Figure 6).
The proportion of TB cases that were born outside the reporting country was similar for Canada, USA, the UK and certain EU countries like France and Germany (roughly 55% to 75% of TB cases). It is notable these countries reported significantly higher proportions of cases among individuals born outside the reporting country in comparison to other EU and non-EU countries (Table 32)Footnote 16,Footnote 20 ,Footnote 21 ,Footnote 22 ,Footnote 23 ,Footnote 24. Given the latency period of TB, it is presumed that the source of acquisition was the country of origin of those cases born outside the reporting countries. Therefore, consistent with other similar low-incidence TB countries, the majority of incident TB in Canada is thought to have been acquired in high TB incidence countries prior to immigration to Canada, with reactivation from LTBI to active TB disease. It is important to highlight that individuals born outside Canada generally do not arrive in Canada with active TB as they are required to undergo Canadian immigration TB screening upon application for residency in Canada.
| Country/area | 2017 | 2018 | 2019 | 2020 | 2021 | |||||
|---|---|---|---|---|---|---|---|---|---|---|
| n | % | n | % | n | % | n | % | n | % | |
| France | 3,019 | 58.8% | 3,142 | 61.7% | 3,102 | 60.6% | 2,719 | 59.0% | 2,610 | 61.1% |
| Germany | 3,820 | 69.6% | 3,890 | 71.7% | 3,362 | 70.2% | 2,817 | 68.3% | 2,782 | 71.4% |
| UK | 3,797 | 68.2% | 3,501 | 69.0% | 3,612 | 70.4% | 3,123 | 70.1% | 3,600 | 75.1% |
| USA | 6,402 | 70.6% | 6,355 | 70.6% | 6,371 | 71.6% | 5,145 | 71.7% | 5,626 | 71.4% |
| EU | 18,299 | 33.1% | 18,246 | 34.5% | 17,181 | 34.5% | 10,942 | 33.0% | 11,334 | 33.8% |
| Non-EU Europe | 4,224 | 1.9% | 4,225 | 2.0% | 4,270 | 2.2% | 6,694 | 4.3% | 7,615 | 4.8% |
| Canada | 1,319 | 72.0% | 1,315 | 73.3% | 1,427 | 74.3% | 1,316 | 73.5% | 1,055 | 76.7% |
Overall, there are pronounced disparities in Canada regarding TB. In addition to those born outside Canada and Indigenous Peoples, people who have experienced incarceration or inadequate housing also show higher incidence rates of active TB diseaseFootnote 25,Footnote 26. However, data for these population groups are not well reported in the CTBRS, reflecting the need to improve reporting on these variables. The risk of exposure to TB, progression to active TB and the chance of successful treatment completion are all impacted by the determinants of health. The current TB surveillance system is limited in the data collected on the social determinants of health, which is significant given that addressing health inequities and the underlying determinants of health is universally recognized by TB experts as an integral component of TB prevention and response, both in Canada and globallyFootnote 2,Footnote 3.
HIV/TB co-infection
In the Canadian TB surveillance system, HIV status was available only for approximately 40% to 70% of incident TB cases, depending on the reporting year. The HIV/TB co-infection prevalence was variable from year to year, ranging from 2.2% to 6.5%, and the prevalence was lower in years with more complete HIV status reporting (Table 33). The prevalence of HIV reported among TB cases was much higher than the Canadian general population where HIV prevalence was reported as 170 per 100,000 or 0.17% in 2020Footnote 27. Comparatively, the USA Centers for Disease Control and Prevention consistently reported HIV status on approximately 90% of TB cases and reported an approximately 5% HIV/TB co-infection rate between 2017 and 2021 (Table 33). The EU and UK had more complete data than Canada with HIV status of roughly 75% to 85% of TB cases known, although this was highly variable by country, and the UK stopped reporting HIV data in 2019. In years with more complete data, Canada reported comparable HIV/TB co-infection rates (2.2% to 3.5%) to the UK and EU (2.8% to 4.1%) and slightly lower than the US (4.2% to 5.5%). Canada, US, UK, and EU all reported much lower rates than non-EU European countries where HIV/TB co-infection rates were much higher at 13.8% to 15.6% (Table 33)Footnote 16,Footnote 28.
| Country/area | 2017 | 2018 | 2019 | 2020 | 2021 | |||||
|---|---|---|---|---|---|---|---|---|---|---|
| HIV-test known | HIV-positive | HIV-test known | HIV-positive | HIV-test known | HIV-positive | HIV-test known | HIV-positive | HIV-test known | HIV-positive | |
| France | - | - | - | - | - | - | - | - | - | - |
| Germany | - | - | - | - | - | - | - | - | - | - |
| UK | 4,407 (84.0%) | 128 (2.9%) | 4,060 (85.0%) | 115 (2.8%) | - | - | - | - | - | - |
| USA | 8,010 (90.1%) | 437 (5.5%) | 7,886 (89.6%) | 405 (5.1%) | 7,921 (91.3%) | 372 (4.7%) | 6,305 (90.5%) | 301 (4.8%) | 6,897 (90.5%) | 293 (4.2%) |
| EU | 21,175 (72.3%) | 871 (4.1%) | 16,990 (64.1%) | 594 (3.5%) | 19,368 (76.4%) | 756 (3.9%) | 13,838 (74.6%) | 503 (3.6%) | 12,837 (70.4%) | 510 (4.0%) |
| Non-EU Europe | 176,780 (93.1%) | 24,363 (13.8%) | 167,986 (93.3%) | 23,562 (14.0%) | 156,746 (93.9%) | 24,606 (15.7%) | 119,861 (95.0%) | 19,153 (16.0%) | 123,899 (97.2%) | 19,703 (15.9%) |
| Canada | 1,265 (69.1%) | 28 (2.2%) | 1,203 (67.1%) | 42 (3.5%) | 1,193 (62.1%) | 34 (2.8%) | 756 (42.7%) | 49 (6.5%) | 742 (46.4%) | 38 (5.1%) |
| Notes: "--" data was not available. | ||||||||||
Data completeness is one key area of improvement for TB surveillance in Canada across jurisdictions. Improving HIV status reporting is critical given the important interplay between these two infectious diseases. HIV significantly increases the risk of developing active TB and increases the risk of severe TB disease and complicationsFootnote 29, undermining efforts to reduce TB rates. Furthermore, co-treatment of HIV and TB is complicated as a result of adherence challenges of polypharmacy for two conditions that require prolonged treatment courses, concurrent side effects, drug-drug interactions, and the risk of immune reconstitution inflammatory syndromeFootnote 29. This highlights the importance of monitoring the two infections and collecting complete data on co-infection rates.
TB mortality
Overall, TB mortality rates remained consistently low in Canada over the past decade. The TB case fatality rate was highest among the 65 years and older age group and higher in males compared to females (Figures 18, 19). The lowest mortality rates were observed in children (0-14 years of age). A total of 78 TB-related deaths (0.2 deaths per 100,000) were reported in Canada in 2020. The mortality rate in the last five years has been comparable with that in the USA, but slightly lower than that of France, Germany, the UK, the EU and non-EU in generalFootnote 16,Footnote 17. Overall, Canada reported similar mortality rates to comparable low TB incidence countries (Table 34). Throughout the 10-year surveillance period, around 12 TB-related deaths per year were reported in non-Indigenous Canadian born populations, compared to about 44 deaths annually for individuals born outside Canada.
| Country/area | 2016 | 2017 | 2018 | 2019 | 2020 |
|---|---|---|---|---|---|
| France | 440 (0.7) | 430 (0.7) | 430 (0.7) | 440 (0.7) | 440 (0.7) |
| Germany | 300 (0.4) | 300 (0.4) | 310 (0.4) | 270 (0.3) | 270 (0.3) |
| UK | 310 (0.5) | 260 (0.4) | 260 (.04) | 230 (0.3) | 230 (0.3) |
| EU | 4,000 (0.9) | 3,800 (0.8) | 3,800 (0.8) | 3,600 (0.8) | 3,600 (0.8) |
| Non-EU Europe | 23,000 (4.9) | 20,000 (4.2) | 19,000 (4.0) | 17,000 (3.6) | 16,000 (3.3) |
| USA | 528 (0.2) | 515 (0.2) | 542 (0.2) | 526 (0.2) | 600 (0.2) |
| Canada | 89 (0.2) | 90 (0.2) | 98 (0.3) | 69 (0.2) | 78 (0.2) |
Antimicrobial resistance
Antimicrobial resistance from 2012-2021 has remained stable at around 10%. This proportion of drug resistant isolates in Canada was similar to other low-incidence settings like the USA, where the majority of drug-resistant cases were among people born in other countries. It is thought that most drug-resistant TB is acquired in countries with higher prevalence of drug-resistant TB and that the LTBI reactivates after immigration to lower incidence settingsFootnote 19. In 2021, in Canada, 8.5% (n=131/1,536) of TB cases were mono-resistant, 0.3% (n=4/1,536) were poly-resistant, 1.0% (n=16/1,536) were MDR and 0.1% (n=1/1,536) were XDR in 2021 (Figure 15). Of all drug resistant TB cases in Canada, 87.7% (n=64/73) were born outside of Canada, 2.7% (n=2/73) were Indigenous and 9.6% (n=7/73) were non-Indigenous Canadian born (Figure 16). Within population groups, the proportion of any drug resistance was 6.1% (n=64/1,055) among TB cases born outside of Canada, 14.0% (n=7/50) among non-Indigenous Canadian born cases, and 0.9% (n=2/232) among Indigenous cases (Table 22).
In comparison, that same year, the USA reported 536 (8.9%) cases that were resistant to at least isoniazid; 5.8% of TB cases among USA-born persons and 10.0% of cases among non-USA born persons. MDR TB at initial diagnosis was reported for 77 (1.3%) cases, including 11 (0.7%) cases among USA-born persons and 66 (1.5%) cases among non-USA born personsFootnote 30. For both mono-resistance to isoniazid and MDR, the proportion was higher among non-USA born personsFootnote 30. In this respect, the resistance patterns were different to the USA in that the non-Indigenous Canadian born population had a higher proportion of resistant isolates, but this may be due to the very small number of cases in this group. These data highlight the need for improved TB screening and latent TB treatment for individuals born outside of Canada, as well as continued participation in global efforts to eliminate TB. Given that the majority of TB cases in Canada were born outside of Canada, and that the number of migrants and refugees arriving to Canada has been increasing over time, the risk of importation of antimicrobial-resistant TB requires ongoing national surveillance. Although the rates of MDR-TB and XDR-TB remained very low in Canada and stable throughout the 10-year surveillance period, the rates have been increasing globally with marginal increases in treatment success (only 59% successfully treated globally in 2018), further highlighting the importance of ongoing monitoringFootnote 2.
Limitations of the Canadian Tuberculosis Reporting System (CTBRS)
TB disease poses several challenges for surveillance due to the complex nature of the infection with a long incubation period to disease development. Additionally, diagnosis and reporting of this disease are complicated by stigma and potential lack of awareness of the disease in society. TB disease disproportionately affects individuals who are marginalized and experience social disparities, creating further barriers to diagnosis and follow-up of cases. Limitations in the CTBRS stem from the following factors:
- Data on LTBI is not captured with the CTBRS.
- Voluntary reporting to the CTBRS.
- Incomplete data collected on risk factors, including socio-demographic data.
- Reporting delays related to TB data collection and information technology infrastructure.
- Lab and clinical data related to TB are collected in separate surveillance systems where linkages are not possible.
Surveillance of latent TB infection (LTBI)
Individuals with LTBI have the potential to become active TB cases. Surveillance of LTBI requires clinical and public health resources in conjunction with lab testing and reporting conversion status (conversion from negative skin test to positive skin test within a prescribed time), which is a complex process. LTBI is not a reportable disease provincially or federally, and information on this condition is not collected within the CTBRS or CTBLSS.
Reporting to the CTBRS is voluntary
While active TB is a legally reportable disease in all PT jurisdictions, federal reporting to the CTBRS is voluntary, thus data is received with different levels of completeness and in varying formats affecting data accuracy. While the variables requested in the CTBRS case reporting form are comprehensive and include key variables related to monitoring TB and its risk factors, the level of information provided from each jurisdiction can vary due to a number of reasons. These may include resources required to complete TB reporting forms, competing public health priorities within the jurisdiction, differing TB needs within each jurisdiction, and different data collection and storage procedures related to TB. Enhancing surveillance resources and simplifying reporting through more efficient and standardized data collection and transfer systems can help improve the level of information obtained on active TB disease in Canada.
The reporting rate for a number of variables in the CTBRS was limited, with information on many variables reported for less than 50% of cases. Furthermore, reporting rates were highly variable year to year and varied significantly by jurisdiction. Therefore, interpretation of certain variables may only be valid for reporting jurisdictions and are not generalizable to Canada or comparable over time. TB surveillance in Canada could be strengthened by improving and increasing data collection on potential risk factors for active TB such as: underlying medical comorbidities including DM, HIV, mental health conditions, and immune-suppression, social risk factors such as unstable housing, incarceration, and travel exposure history to regions with high TB incidence.
Reporting delays due to TB data collection, management and information technology infrastructure
The complexity of LTBI and, subsequently, TB disease development and outcomes are compounded by an intricate web of independent health organizations collecting local TB data and forwarding the data voluntarily on an annual basis to the CTBRS. Not all jurisdictions submit their data electronically and other jurisdictions may be in the process of updating their digital infrastructure, making it difficult to provide information in a timely manner. At the federal level, combining differing data streams, checking for inconsistencies, and cleaning the data is a time-intensive process which creates further reporting delays. These challenging and demanding data collection and transfer processes can affect other disease reporting systems and a streamlined and enhanced electronic data platform would greatly improve the timeliness and comprehensiveness of surveillance for TB.
Separate TB surveillance systems
The fact that the lab and case-based surveillance systems are not linked causes limitations in the ability to assess risk factors. Linking laboratory and clinical TB surveillance systems could help in identifying transmission sources in Canada, particularly with increasing use of genome sequencing. Additionally, TB in Canadian correctional facilities is currently monitored by a separate surveillance system that is yet to be integrated with the CTBRS, and TB information collected through Immigration, Refugees, and Citizenship Canada is not integrated in Canada.
Focusing on these areas within the CTBRS over time will result in a more accurate representation of TB status in Canada which will inform policies and programs for TB prevention and control.
Conclusion
TB remains a serious global illness, and while Canada is considered a low incidence country, TB continues to affect certain populations disproportionally.
From 2012 to 2021, the overall annual incidence of active TB in Canada remained stable. The majority of active TB cases occurred in individuals born outside Canada; however, Indigenous Peoples continued to be disproportionately affected compared to non-Indigenous Canadian born populations. Males also have had a higher incidence of active TB in comparison to females. Given the unknown impact of the ongoing global COVID-19 pandemic on detection and reporting of TB and other diseases, changes noted in the reported 2020 TB surveillance data should be interpreted with caution.
Achieving TB elimination as per The End TB Strategy of the WHOFootnote 5 will require a multi-pronged, collaborative approach, as outlined in the 2018 CPHO report on eliminating TB in CanadaFootnote 3. This report also called for sustained engagement with communities and at-risk populations by all levels of government to tailor interventions that address social and health inequities and improve the prevention, diagnosis, treatment and monitoring of TB.
In particular, ongoing collaboration and coordination of TB surveillance and programmatic responses across jurisdictions can help to:
- identify key risk factors associated with TB outbreaks in Canada,
- determine predictors of active TB for persons migrating to Canada,
- address TB comorbidities and drug-resistance,
- tailor programmatic interventions/strategies to address TB and social inequities for vulnerable populations, including Indigenous Peoples and populations born outside Canada, and
- monitor the progress of these efforts and evaluate their effectiveness.
As noted in the 2018 CPHO report on eliminating TB in Canada, solutions to this complex disease will be driven by jurisdictions and the communities themselves, with ongoing engagement from many players, including governments, academics, experts, and other stakeholdersFootnote 3. The contribution of surveillance is invaluable; it must be customized and comprehensive to inform tailored policies and interventions across affected populations. Enhancing timely and complete collection of data and developing more efficient data integration systems at the national, provincial, and territorial levels will help improve the quality of surveillance information and provide meaningful and more timely data to help assess progress in addressing disproportionate impacts of TB and ultimately eliminating TB in Canada.
Appendices
Appendix A: Member countries of each World Health Organization (WHO) epidemiological region
African Region (AFR)
- Algeria
- Angola
- Benin
- Botswana
- Burkina Faso
- Burundi
- Cabo Verde
- Cameroon
- Central African Republic
- Chad
- Comoros
- Cote d'Ivoire
- Democratic Republic of the Congo
- Equatorial Guinea
- Eritrea
- Eswatini
- Ethiopia
- Gabon
- Gambia
- Ghana
- Guinea
- Guinea-Bissau
- Kenya
- Lesotho
- Liberia
- Madagascar
- Malawi
- Mali
- Mauritania
- Mauritius
- Mozambique
- Namibia
- Niger
- Nigeria
- Rwanda
- São Tomé and Príncipe
- Senegal
- Seychelles
- Sierra Leone
- South Africa
- South Sudan
- Togo
- Uganda
- United Republic of Tanzania
- Zambia
- Zimbabwe
Region of the Americas (AMR)
- Antigua and Barbuda
- Argentina
- Bahamas
- Barbados
- Belize
- Bolivia
- Brazil
- Canada
- Chile
- Colombia
- Costa Rica
- Cuba
- Dominica
- Dominican Republic
- Ecuador
- El Salvador
- Grenada
- Guatemala
- Guyana
- Haiti
- Honduras
- Jamaica
- Mexico
- Nicaragua
- Panama
- Paraguay
- Peru
- Saint Kitts and Nevis
- Saint Lucia
- Saint Vincent and the Grenadines
- Suriname
- Trinidad and Tobago
- United States of America
- Uruguay
- Venezuela
Eastern Mediterranean Region (EMR)
- Afghanistan
- Bahrain
- Djibouti
- Egypt
- Iran
- Iraq
- Jordan
- Kuwait
- Lebanon
- Libya
- Morocco
- Oman
- Pakistan
- Qatar
- Saudi Arabia
- Somalia
- Sudan
- Syria
- Tunisia
- United Arab Emirates
- Yemen
European Region (EUR)
- Albania
- Andorra
- Armenia
- Austria
- Azerbaijan
- Belarus
- Belgium
- Bosnia and Herzegovina
- Bulgaria
- Croatia
- Cyprus
- Czechia
- Denmark
- Estonia
- Finland
- France
- Georgia
- Germany
- Greece
- Hungary
- Iceland
- Ireland
- Israel
- Italy
- Kazakhstan
- Kyrgyzstan
- Latvia
- Lithuania
- Luxembourg
- Malta
- Monaco
- Montenegro
- Netherlands
- North Macedonia
- Norway
- Poland
- Portugal
- Republic of Moldova
- Romania
- Russian Federation
- San Marino
- Serbia
- Slovakia
- Slovenia
- Spain
- Sweden
- Switzerland
- Tajikistan
- Turkey
- Turkmenistan
- Ukraine
- United Kingdom
- Uzbekistan
South-East Asian Region (SEAR)
- Bangladesh
- Bhutan
- Democratic People's Republic of Korea (North)
- India
- Indonesia
- Maldives
- Myanmar
- Nepal
- Sri Lanka
- Thailand
- Timor-Leste
Western Pacific Region (WPR)
- Australia
- Brunei
- Cambodia
- China
- Cook Islands
- Fiji
- Japan
- Kiribati
- Laos
- Malaysia
- Marshall Islands
- Micronesia
- Mongolia
- Nauru
- New Zealand
- Niue
- Palau
- Papua New Guinea
- Philippines
- Republic of Korea (South)
- Samoa
- Singapore
- Solomon Islands
- Tonga
- Tuvalu
- Vanuatu
- Viet Nam
Appendix B: CTBRS case reporting form

Appendix C: Treatment outcome of a new active or re-treatment TB case

Appendix D: M. tuberculosis complex antimicrobial susceptibility reporting form
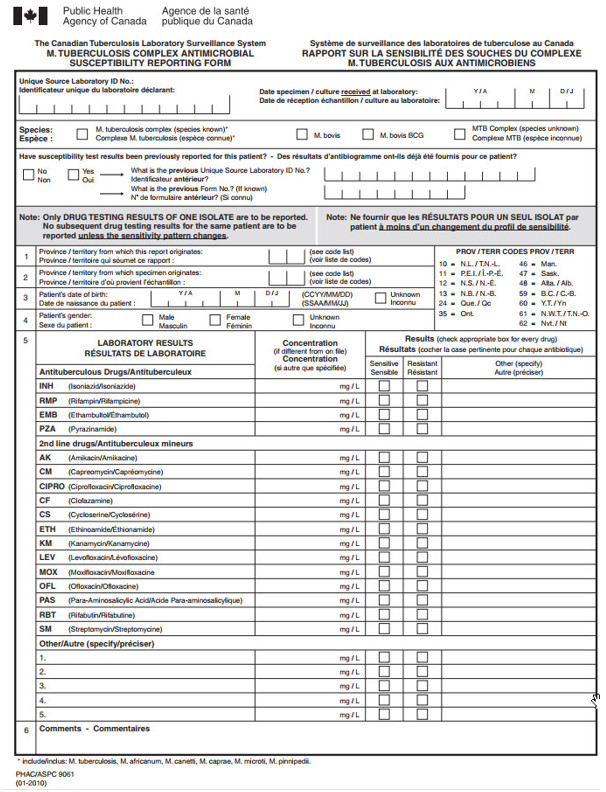
Appendix E: Descriptive epidemiology of cases

Figure 22 - Text description
| Age group in years | 2012 | 2013 | 2014 | 2015 | 2016 | 2017 | 2018 | 2019 | 2020 | 2021 |
|---|---|---|---|---|---|---|---|---|---|---|
| <5 | 3.1 | 2.4 | 2.3 | 2.4 | 2.3 | 2.7 | 2.4 | 2.8 | 1.3 | 2.3 |
| 5-14 | 1.3 | 1.5 | 0.9 | 1.3 | 1.0 | 1.6 | 1.3 | 1.3 | 0.9 | 1.3 |
| 15-24 | 5.1 | 4.0 | 4.1 | 4.5 | 4.7 | 5.0 | 4.9 | 6.3 | 7.0 | 5.2 |
| 25-34 | 6.1 | 6.7 | 6.4 | 5.9 | 7.8 | 6.4 | 6.2 | 6.2 | 5.6 | 6.6 |
| 35-44 | 5.3 | 5.3 | 5.4 | 5.5 | 5.0 | 5.1 | 4.9 | 5.0 | 5.3 | 5.1 |
| 45-54 | 3.2 | 3.5 | 3.4 | 3.7 | 3.2 | 3.6 | 4.2 | 3.8 | 3.8 | 3.8 |
| 55-64 | 2.2 | 2.7 | 2.4 | 3.3 | 2.8 | 2.9 | 3.3 | 3.2 | 3.2 | 2.9 |
| 65-74 | 4.1 | 4.7 | 3.8 | 4.8 | 4.7 | 4.7 | 4.6 | 4.1 | 3.3 | 3.4 |
| 75+ | 5.5 | 6.7 | 6.2 | 6.6 | 8.0 | 7.4 | 7.5 | 7.1 | 6.0 | 7.0 |

Figure 23 - Text description
| Age group in years | 2012 | 2013 | 2014 | 2015 | 2016 | 2017 | 2018 | 2019 | 2020 | 2021 |
|---|---|---|---|---|---|---|---|---|---|---|
| <5 | 3.1 | 2.8 | 2.2 | 2.7 | 2.7 | 3.0 | 2.8 | 2.3 | 2.3 | 1.9 |
| 5-14 | 1.6 | 1.7 | 0.8 | 1.1 | 1.1 | 1.7 | 1.2 | 1.9 | 0.8 | 1.0 |
| 15-24 | 5.3 | 5.1 | 4.6 | 4.2 | 5.5 | 5.9 | 5.6 | 6.0 | 6.0 | 6.3 |
| 25-34 | 6.4 | 4.5 | 5.5 | 5.6 | 6.0 | 6.2 | 6.3 | 7.3 | 7.0 | 7.1 |
| 35-44 | 6.2 | 5.1 | 4.9 | 4.9 | 5.4 | 6.0 | 5.6 | 5.7 | 5.0 | 5.4 |
| 45-54 | 5.4 | 5.4 | 5.0 | 4.4 | 4.7 | 4.9 | 4.6 | 5.8 | 5.3 | 5.3 |
| 55-64 | 4.7 | 5.5 | 6.0 | 4.4 | 5.0 | 4.8 | 4.4 | 4.8 | 4.3 | 4.2 |
| 65-74 | 8.6 | 6.7 | 6.7 | 5.9 | 6.4 | 6.6 | 5.9 | 6.3 | 5.4 | 6.0 |
| 75+ | 14.9 | 13.1 | 14.3 | 15.1 | 14.3 | 14.3 | 12.7 | 12.4 | 10.9 | 9.6 |
| Jurisdiction: Female | 2012 | 2013 | 2014 | 2015 | 2016 | 2017 | 2018 | 2019 | 2020 | 2021 |
|---|---|---|---|---|---|---|---|---|---|---|
| NL | 1.1 | 2.3 | 1.1 | 4.9 | 3.0 | 1.9 | 4.1 | 1.5 | 1.1 | 0.8 |
| PEI | 0.0 | 0.0 | 1.4 | 4.0 | 2.7 | 0.0 | 0.0 | 0.0 | 2.4 | 1.2 |
| NS | 0.4 | 0.4 | 0.2 | 0.2 | 0.4 | 0.2 | 0.4 | 0.4 | 0.8 | 1.0 |
| NB | 0.5 | 0.8 | 0.8 | 0.3 | 1.6 | 1.5 | 1.0 | 1.3 | 1.5 | 1.5 |
| QC | 3.0 | 2.8 | 1.8 | 2.5 | 2.7 | 2.4 | 2.9 | 2.9 | 2.5 | 2.2 |
| ON | 4.1 | 4.2 | 3.7 | 4.0 | 4.3 | 4.3 | 4.3 | 4.5 | 3.9 | 4.1 |
| MB | 10.2 | 10.7 | 11.0 | 13.3 | 12.9 | 10.8 | 12.7 | 12.8 | 11.3 | 9.0 |
| SK | 5.2 | 7.1 | 6.7 | 6.3 | 8.2 | 6.1 | 6.1 | 5.0 | 8.2 | 9.0 |
| AB | 4.0 | 4.5 | 4.8 | 4.9 | 5.2 | 5.1 | 4.7 | 4.4 | 5.1 | 5.2 |
| BC | 4.4 | 5.1 | 5.0 | 5.9 | 4.4 | 5.3 | 4.9 | 5.4 | 5.3 | 5.4 |
| YT | 0.0 | 5.6 | 16.5 | 5.4 | 0.0 | 5.1 | 10.1 | 4.9 | 4.8 | 4.7 |
| NWT | 14.1 | 4.7 | 9.3 | 9.3 | 4.6 | 9.2 | 4.6 | 9.1 | 22.7 | 9.0 |
| NU | 155.2 | 105.5 | 229.4 | 56.3 | 144.6 | 235.8 | 140.1 | 127.7 | 62.7 | 149.6 |
| Canada | 4.0 | 4.2 | 4.0 | 4.3 | 4.4 | 4.4 | 4.4 | 4.5 | 4.2 | 4.3 |
| Notes: NL Newfoundland and Labrador; PEI, Prince Edward Island; NS, Nova Scotia, NB; New Brunswick; QC, Quebec; ON, Ontario; MB, Manitoba; SK, Saskatchewan; AB, Alberta; BC, British Columbia; YT, Yukon; NWT, Northwest Territories; NU Nunavut. | ||||||||||
| Jurisdiction: Male | 2012 | 2013 | 2014 | 2015 | 2016 | 2017 | 2018 | 2019 | 2020 | 2021 |
|---|---|---|---|---|---|---|---|---|---|---|
| NL | 0.4 | 2.7 | 1.5 | 7.6 | 6.1 | 3.1 | 7.3 | 3.9 | 3.1 | 2.7 |
| PEI | 1.4 | 0.0 | 2.8 | 0.0 | 2.8 | 0.0 | 1.3 | 5.2 | 1.3 | 1.2 |
| NS | 1.3 | 1.3 | 1.3 | 1.1 | 0.2 | 1.7 | 1.3 | 0.6 | 1.7 | 1.4 |
| NB | 0.8 | 0.0 | 0.5 | 1.3 | 1.6 | 0.5 | 0.5 | 1.6 | 0.8 | 0.5 |
| QC | 3.7 | 3.1 | 3.3 | 3.5 | 3.4 | 2.9 | 3.7 | 3.9 | 3.0 | 3.0 |
| ON | 5.1 | 5.2 | 4.9 | 4.8 | 4.9 | 5.3 | 4.9 | 5.7 | 5.3 | 5.1 |
| MB | 11.6 | 15.6 | 10.1 | 11.2 | 17.7 | 17.3 | 14.8 | 13.3 | 9.9 | 12.8 |
| SK | 11.2 | 8.5 | 9.1 | 6.2 | 7.9 | 10.2 | 7.5 | 6.3 | 9.1 | 11.6 |
| AB | 6.0 | 4.9 | 5.8 | 5.2 | 6.1 | 5.6 | 5.6 | 6.8 | 6.3 | 5.6 |
| BC | 8.2 | 6.0 | 6.5 | 5.2 | 5.4 | 6.4 | 5.6 | 6.5 | 6.3 | 5.7 |
| YT | 5.4 | 5.4 | 5.3 | 10.4 | 5.1 | 34.8 | 4.8 | 0.0 | 0.0 | 0.0 |
| NWT | 13.4 | 13.4 | 8.9 | 13.3 | 8.7 | 4.3 | 8.6 | 12.9 | 8.6 | 8.5 |
| NU | 301.4 | 180.6 | 237.4 | 181.5 | 147.4 | 300.4 | 158.3 | 151.5 | 109.9 | 231.3 |
| Canada | 5.8 | 5.2 | 5.2 | 4.9 | 5.3 | 5.6 | 5.2 | 5.7 | 5.2 | 5.3 |
| Notes: NL Newfoundland and Labrador; PEI, Prince Edward Island; NS, Nova Scotia, NB; New Brunswick; QC, Quebec; ON, Ontario; MB, Manitoba; SK, Saskatchewan; AB, Alberta; BC, British Columbia; YT, Yukon; NWT, Northwest Territories; NU Nunavut. | ||||||||||
Appendix F: Risk factor reporting by province and territory
| Jurisdiction | Total number of TB cases | End-stage renal disease reported (among total cases) | End- stage renal disease reported | ||||
|---|---|---|---|---|---|---|---|
| End-stage renal disease not present | End-stage renal disease present | ||||||
| n | n | % | n | % | n | % | |
| NL | 9 | 9 | 100% | 9 | 100% | 0 | 0% |
| PEI | 2 | 2 | 100% | 2 | 100% | 0 | 0% |
| NS | 12 | 9 | 75.0% | 9 | 100% | 0 | 0% |
| NB | 8 | 8 | 100% | 8 | 100% | 0 | 0% |
| ON | 683 | 16 | 2.3% | Not reported | 16 | 100% | |
| MB | 153 | Not reported | -- | -- | -- | -- | |
| SK | 122 | Not reported | -- | -- | -- | -- | |
| AB | 241 | 241 | 100% | 233 | 96.7% | 8 | 3.3% |
| BC | 289 | 212 | 73.4% | 208 | 98.1% | 4 | 1.9% |
| YT | 1 | 1 | 100% | 1 | 100% | 0 | 0% |
| NWT | 4 | 3 | 75.0% | 3 | 100% | 0 | 0% |
| NU | 76 | Not reported | -- | -- | -- | -- | |
| Total | 1,600 | 501 | 31.3% | 473 | 94.4% | 28 | 5.6% |
Notes: 2021 data was not available for Quebec. |
|||||||
| Jurisdiction | Total number of TB cases | Abnormal chest x-ray reported (among total cases) | Abnormal chest x-ray reported | ||||
|---|---|---|---|---|---|---|---|
| Abnormal chest x-ray not present | Abnormal chest x-ray present | ||||||
| n | n | % | n | % | n | % | |
| NL | 9 | 9 | 100% | 7 | 77.8% | 2 | 22.2% |
| PEI | 2 | 2 | 100% | 2 | 100% | 0 | 0% |
| NS | 12 | 9 | 75.0% | 9 | 100% | 0 | 0% |
| NB | 8 | 7 | 87.5% | 5 | 71.4% | 2 | 28.6% |
| ON | 683 | 9 | 1.3% | Not reported | 9 | 100% | |
| MB | 153 | Not reported | -- | -- | -- | -- | |
| SK | 122 | Not reported | -- | -- | -- | -- | |
| AB | 241 | 206 | 85.5% | 152 | 73.8% | 54 | 26.2% |
| BC | 289 | 251 | 86.9% | 241 | 96.0% | 10 | 4.0% |
| YT | 1 | 1 | 100% | 1 | 100% | 0 | 0% |
| NWT | 4 | 4 | 100% | 4 | 100% | 0 | 0% |
| NU | 76 | Not reported | -- | -- | -- | -- | |
| Total | 1,600 | 498 | 31.1% | 421 | 84.5% | 77 | 15.5% |
Notes: 2021 data was not available for Quebec. |
|||||||
| Jurisdiction | Total number of TB cases | Long-term corticosteroid use reported (among total cases) | Long-term corticosteroid use reported | ||||
|---|---|---|---|---|---|---|---|
| Long-term corticosteroid use not present | Long-term corticosteroid use present | ||||||
| n | n | % | n | % | n | % | |
| NL | 9 | 9 | 100% | 9 | 100% | 0 | 0% |
| PEI | 2 | 2 | 100% | 2 | 100% | 0 | 0% |
| NS | 12 | 10 | 83.3% | 10 | 100% | 0 | 0% |
| NB | 8 | 8 | 100% | 8 | 100% | 0 | 0% |
| ON | 683 | Not reported | -- | -- | -- | -- | |
| MB | 153 | Not reported | -- | -- | -- | -- | |
| SK | 122 | 2 | 1.6% | Not reported | 2 | 100% | |
| AB | 241 | 241 | 100% | 238 | 98.8% | 3 | 1.2% |
| BC | 289 | 214 | 74.0% | 213 | 99.5% | 1 | 0.5% |
| YT | 1 | 1 | 100% | 1 | 100% | 0 | 0% |
| NWT | 4 | 4 | 100% | 4 | 100% | 0 | 0% |
| NU | 76 | Not reported | -- | -- | -- | -- | |
| Total | 1,600 | 491 | 30.7% | 485 | 98.8% | 6 | 1.2% |
Notes: 2021 data was not available for Quebec. |
|||||||
| Jurisdiction | Total number of TB cases | Contact with an active TB case reported (among total cases) | Contact with an active TB case reported | ||||
|---|---|---|---|---|---|---|---|
| Contact with an active TB case not present | Contact with an active TB case present | ||||||
| n | n | % | n | % | n | % | |
| NL | 9 | 7 | 77.8% | 3 | 42.9% | 4 | 57.1% |
| PEI | 2 | 2 | 100% | 2 | 100% | 0 | 0% |
| NS | 12 | 7 | 58.3% | 3 | 42.9% | 4 | 57.1% |
| NB | 8 | 6 | 75.0% | 5 | 83.3% | 1 | 16.7% |
| ON | 683 | 83 | 12.2% | 2 | 2.4% | 81 | 97.6% |
| MB | 153 | Not reported | -- | -- | -- | -- | |
| SK | 122 | Not reported | -- | -- | -- | -- | |
| AB | 241 | 241 | 100% | 230 | 95.4% | 11 | 4.6% |
| BC | 289 | 212 | 73.4% | 185 | 87.3% | 27 | 12.7% |
| YT | 1 | 1 | 100% | 1 | 100% | 0 | 0% |
| NWT | 4 | 1 | 25.0% | 1 | 100% | 0 | 0% |
| NU | 76 | Not reported | -- | -- | -- | -- | |
| Total | 1,600 | 560 | 35.0% | 432 | 77.1% | 128 | 22.9% |
Notes: 2021 data was not available for Quebec. |
|||||||
| Jurisdiction | Total number of TB cases | Substance use reported (among total cases) | Substance use reported | ||||
|---|---|---|---|---|---|---|---|
| Substance use not present | Substance use present | ||||||
| n | n | % | n | % | n | % | |
| NL | 9 | 9 | 100% | 7 | 77.8% | 2 | 22.2% |
| PEI | 2 | 2 | 100% | 2 | 100% | 0 | 0% |
| NS | 12 | 9 | 75.0% | 8 | 88.9% | 1 | 11.1% |
| NB | 8 | 8 | 100% | 8 | 100% | 0 | 0% |
| ON | 683 | 26 | 3.8% | 1 | 3.8% | 25 | 96.2% |
| MB | 153 | Not reported | -- | -- | -- | -- | |
| SK | 122 | Not reported | -- | -- | -- | -- | |
| AB | 241 | 241 | 100% | 228 | 94.6% | 13 | 5.4% |
| BC | 289 | 211 | 73.0% | 211 | 100% | 0 | 0% |
| YT | 1 | 1 | 100% | 1 | 100% | 0 | 0% |
| NWT | 4 | 4 | 100% | 3 | 75.0% | 1 | 25.0% |
| NU | 76 | Not reported | -- | -- | -- | -- | |
| Total | 1,600 | 511 | 31.9% | 469 | 91.8% | 42 | 8.2% |
Notes: 2021 data was not available for Quebec. |
|||||||
| Jurisdiction | Total number of TB cases | Recent travel to country with high TB incidence reported (among total cases) | Recent travel to country with high TB incidence reported | ||||
|---|---|---|---|---|---|---|---|
| Recent travel to country with high TB incidence not present | Recent travel to country with high TB incidence present | ||||||
| n | n | % | n | % | n | % | |
| NL | 9 | 8 | 88.9% | 5 | 62.5% | 3 | 37.5% |
| PEI | 2 | 2 | 100% | 1 | 50.0% | 1 | 50.0% |
| NS | 12 | 11 | 91.7% | 2 | 18.2% | 9 | 81.8% |
| NB | 8 | 7 | 87.5% | 6 | 85.7% | 1 | 14.3% |
| ON | 683 | 87 | 12.7% | 1 | 1.1% | 86 | 98.9% |
| MB | 153 | Not reported | -- | -- | -- | -- | |
| SK | 122 | Not reported | -- | -- | -- | -- | |
| AB | 241 | 241 | 100% | 205 | 85.1% | 36 | 14.9% |
| BC | 289 | Not reported | -- | -- | -- | -- | |
| YT | 1 | 1 | 100% | 1 | 100% | 0 | 0% |
| NWT | 4 | 4 | 100% | 4 | 100% | 0 | 0% |
| NU | 76 | Not reported | -- | -- | -- | -- | |
| Total | 1,600 | 361 | 22.6% | 225 | 62.3% | 136 | 37.7% |
Notes: 2021 data was not available for Quebec. |
|||||||
| Jurisdiction | Total number of TB cases | Incarceration reported (among total cases) | Incarceration status reported | ||||
|---|---|---|---|---|---|---|---|
| Incarceration not present | Incarceration present | ||||||
| n | n | % | n | % | n | % | |
| NL | 9 | 9 | 100% | 9 | 100% | 0 | 0% |
| PEI | 2 | 2 | 100% | 2 | 100% | 0 | 0% |
| NS | 12 | 11 | 91.7% | 11 | 100% | 0 | 0% |
| NB | 8 | 8 | 100% | 8 | 100% | 0 | 0% |
| ON | 683 | 4 | 0.6% | Not reported | 4 | 100% | |
| MB | 153 | Not reported | -- | -- | -- | -- | |
| SK | 122 | Not reported | -- | -- | -- | -- | |
| AB | 241 | 241 | 100% | 241 | 100% | 0 | 0% |
| BC | 289 | Not reported | -- | -- | -- | -- | |
| YT | 1 | 1 | 100% | 1 | 100% | 0 | 0% |
| NWT | 4 | 4 | 100% | 4 | 100% | 0 | 0% |
| NU | 76 | Not reported | -- | -- | -- | -- | |
| Total | 1,600 | 280 | 17.5% | 276 | 98.6% | 4 | 1.4% |
Notes: 2021 data was not available for Quebec. |
|||||||
| Jurisdiction | Total number of TB cases | Homelessness reported (among total cases) | Homelessness reported | ||||
|---|---|---|---|---|---|---|---|
| Homelessness not present | Homelessness present | ||||||
| n | n | % | n | % | n | % | |
| NL | 9 | 9 | 100% | 9 | 100% | 0 | 0% |
| PEI | 2 | 2 | 100% | 2 | 100% | 0 | 0% |
| NS | 12 | 10 | 83.3% | 10 | 100% | 0 | 0% |
| NB | 8 | 8 | 100% | 8 | 100% | 0 | 0% |
| ON | 683 | 11 | 1.6% | Not reported | 11 | 100% | |
| MB | 153 | Not reported | -- | -- | -- | -- | |
| SK | 122 | Not reported | -- | -- | -- | -- | |
| AB | 241 | 241 | 100% | 238 | 98.8% | 3 | 1.2% |
| BC | 289 | 208 | 72.0% | 202 | 97.1% | 6 | 2.9% |
| YT | 1 | 1 | 100% | 1 | 100% | 0 | 0% |
| NWT | 4 | 4 | 100% | 4 | 100% | 0 | 0% |
| NU | 76 | Not reported | -- | -- | -- | -- | |
| Total | 1,600 | 494 | 30.9% | 474 | 96.0% | 20 | 4.0% |
Notes: 2021 data was not available for Quebec. |
|||||||
| Jurisdiction | Total number of TB cases | Transplant-related immunosuppression reported (among total cases) | Transplant-related immunosuppression reported | ||||
|---|---|---|---|---|---|---|---|
| Transplant-related immunosuppression not present | Transplant-related immunosuppression present | ||||||
| n | n | % | n | % | n | % | |
| NL | 9 | 9 | 100% | 9 | 100% | 0 | 0% |
| PEI | 2 | 2 | 100% | 2 | 100% | 0 | 0% |
| NS | 12 | 10 | 83.3% | 10 | 100% | 0 | 0% |
| NB | 8 | 8 | 100% | 8 | 100% | 0 | 0% |
| ON | 683 | 8 | 1.2% | Not reported | 8 | 100% | |
| MB | 153 | Not reported | -- | -- | -- | -- | |
| SK | 122 | Not reported | -- | -- | -- | -- | |
| AB | 241 | 241 | 100% | 239 | 99.2% | 2 | 0.8% |
| BC | 289 | 206 | 71.3% | 205 | 99.5% | 1 | 0.5% |
| YT | 1 | 1 | 100% | 1 | 100% | 0 | 0% |
| NWT | 4 | 4 | 100% | 4 | 100% | 0 | 0% |
| NU | 76 | Not reported | -- | -- | -- | -- | |
| Total | 1,600 | 489 | 30.6% | 478 | 97.8% | 11 | 2.2% |
Notes: 2021 data was not available for Quebec. |
|||||||
Appendix G: Drug-resistance by age group, Canadian Tuberculosis Laboratory Surveillance System (CTBLSS): 2012-2021
| no data | Age (in years) | 2012 | 2013 | 2014 | 2015 | 2016 | 2017 | 2018 | 2019 | 2020 | 2021 | ||||||||||
|---|---|---|---|---|---|---|---|---|---|---|---|---|---|---|---|---|---|---|---|---|---|
| n | % | n | % | n | % | n | % | n | % | n | % | n | % | n | % | n | % | n | % | ||
| Mono - resistance | <5 | 3 | 2.2% | 1 | 0.9% | 0 | 0% | 0 | 0% | 1 | 0.8% | 0 | 0% | 1 | 0.7% | 1 | 0.6% | 0 | 0% | 1 | 0.7% |
| 5-14 | 2 | 1.4% | 1 | 0.9% | 1 | 0.8% | 0 | 0% | 3 | 2.3% | 1 | 0.8% | 1 | 0.7% | 2 | 1.2% | 0 | 0% | 2 | 1.3% | |
| 15-24 | 15 | 10.8% | 11 | 9.8% | 11 | 8.5% | 17 | 12.2% | 21 | 16.2% | 13 | 10.7% | 13 | 8.8% | 21 | 12.3% | 22 | 14.4% | 14 | 9.2% | |
| 25-34 | 27 | 19.4% | 20 | 17.9% | 23 | 17.7% | 17 | 12.2% | 19 | 14.6% | 22 | 18.2% | 21 | 14.2% | 27 | 15.8% | 25 | 16.3% | 29 | 19.1% | |
| 35-44 | 25 | 18.0% | 12 | 10.7% | 24 | 18.5% | 15 | 10.8% | 14 | 10.8% | 21 | 17.4% | 20 | 13.5% | 22 | 12.9% | 20 | 13.1% | 17 | 11.2% | |
| 45-54 | 19 | 13.7% | 19 | 17.0% | 12 | 9.2% | 14 | 10.1% | 13 | 10.0% | 18 | 14.9% | 12 | 8.1% | 20 | 11.7% | 25 | 16.3% | 23 | 15.1% | |
| 55-64 | 14 | 10.1% | 11 | 9.8% | 15 | 11.5% | 12 | 8.6% | 16 | 12.3% | 12 | 9.9% | 14 | 9.5% | 18 | 10.5% | 17 | 11.1% | 16 | 10.5% | |
| 65-74 | 14 | 10.1% | 10 | 8.9% | 14 | 10.8% | 19 | 13.7% | 2 | 1.5% | 6 | 5.0% | 18 | 12.2% | 18 | 10.5% | 11 | 7.2% | 13 | 8.6% | |
| ≥75 | 9 | 6.5% | 8 | 7.1% | 7 | 5.4% | 20 | 14.4% | 19 | 14.6% | 8 | 6.6% | 21 | 14.2% | 17 | 9.9% | 11 | 7.2% | 16 | 10.5% | |
| Total | 128 | 92.1% | 93 | 83.0% | 107 | 82.3% | 114 | 82.0% | 108 | 83.1% | 101 | 83.5% | 121 | 81.8% | 146 | 85.4% | 131 | 85.6% | 131 | 86.2% | |
| Total resistance | 139 | 100% | 112 | 100% | 130 | 100% | 139 | 100% | 130 | 100% | 121 | 100% | 148 | 100% | 171 | 100% | 153 | 100% | 152 | 100% | |
| Notes: Proportions presented are based on total resistant isolates for each diagnosis year. | |||||||||||||||||||||
| no data | Age (in years) | 2012 | 2013 | 2014 | 2015 | 2016 | 2017 | 2018 | 2019 | 2020 | 2021 | ||||||||||
|---|---|---|---|---|---|---|---|---|---|---|---|---|---|---|---|---|---|---|---|---|---|
| n | % | n | % | n | % | n | % | n | % | n | % | n | % | n | % | n | % | n | % | ||
| Poly-resistance | <5 | 0 | 0% | 0 | 0% | 0 | 0% | 0 | 0% | 0 | 0% | 1 | 0.8% | 0 | 0% | 0 | 0% | 0 | 0% | 0 | 0.0% |
| 15-24 | 0 | 0% | 0 | 0% | 0 | 0% | 1 | 0.7% | 0 | 0% | 0 | 0.0% | 0 | 0% | 0 | 0% | 1 | 0.7% | 1 | 0.7% | |
| 25-34 | 0 | 0% | 1 | 0.9% | 1 | 0.8% | 1 | 0.7% | 3 | 2.3% | 0 | 0.0% | 1 | 0.7% | 2 | 1.2% | 1 | 0.7% | 2 | 1.3% | |
| 35-44 | 1 | 0.7% | 2 | 1.8% | 0 | 0% | 0 | 0% | 0 | 0% | 2 | 1.7% | 1 | 0.7% | 0 | 0% | 0 | 0% | 0 | 0.0% | |
| 45-54 | 0 | 0% | 1 | 0.9% | 1 | 0.8% | 0 | 0% | 1 | 0.8% | 1 | 0.8% | 1 | 0.7% | 0 | 0% | 2 | 1.3% | 1 | 0.7% | |
| 55-64 | 1 | 0.7% | 0 | 0% | 0 | 0% | 1 | 0.7% | 0 | 0% | 1 | 0.8% | 2 | 1.4% | 2 | 1.2% | 1 | 0.7% | 0 | 0.0% | |
| 65-74 | 0 | 0% | 0 | 0% | 1 | 0.8% | 0 | 0% | 1 | 0.8% | 1 | 0.8% | 0 | 0% | 1 | 0.6% | 0 | 0% | 0 | 0.0% | |
| ≥75 | 0 | 0% | 0 | 0% | 1 | 0.8% | 0 | 0% | 0 | 0% | 0 | 0.0% | 0 | 0% | 0 | 0% | 2 | 1.3% | 0 | 0.0% | |
| Total | 2 | 1.4% | 4 | 3.6% | 4 | 3.1% | 3 | 2.2% | 5 | 3.8% | 6 | 5.0% | 5 | 3.4% | 5 | 2.9% | 7 | 4.6% | 4 | 2.6% | |
| Total resistance | 139 | 100% | 112 | 100% | 130 | 100% | 139 | 100% | 130 | 100% | 121 | 100% | 148 | 100% | 171 | 100% | 153 | 100% | 152 | 100% | |
| Notes: Proportions presented are based on total resistant isolates for each diagnosis year. | |||||||||||||||||||||
| no data | Age (in years) | 2012 | 2013 | 2014 | 2015 | 2016 | 2017 | 2018 | 2019 | 2020 | 2021 | ||||||||||
|---|---|---|---|---|---|---|---|---|---|---|---|---|---|---|---|---|---|---|---|---|---|
| n | % | n | % | n | % | n | % | n | % | n | % | n | % | n | % | n | % | n | % | ||
| Multi-drug resistance | <5 | 0 | 0% | 0 | 0% | 1 | 0.8% | 0 | 0% | 0 | 0% | 0 | 0% | 0 | 0% | 0 | 0% | 0 | 0% | 0 | 0% |
| 5-14 | 0 | 0% | 0 | 0% | 0 | 0% | 0 | 0% | 1 | 0.8% | 0 | 0% | 0 | 0% | 1 | 0.6% | 0 | 0% | 0 | 0% | |
| 15-24 | 2 | 1.4% | 3 | 2.7% | 2 | 1.5% | 3 | 2.2% | 4 | 3.1% | 1 | 0.8% | 4 | 2.7% | 4 | 2.3% | 4 | 2.6% | 3 | 2.0% | |
| 25-34 | 3 | 2.2% | 5 | 4.5% | 4 | 3.1% | 8 | 5.8% | 4 | 3.1% | 6 | 5.0% | 3 | 2.0% | 7 | 4.1% | 5 | 3.3% | 5 | 3.3% | |
| 35-44 | 1 | 0.7% | 2 | 1.8% | 3 | 2.3% | 2 | 1.4% | 4 | 3.1% | 1 | 0.8% | 4 | 2.7% | 2 | 1.2% | 1 | 0.7% | 2 | 1.3% | |
| 45-54 | 0 | 0% | 3 | 2.7% | 3 | 2.3% | 6 | 4.3% | 2 | 1.5% | 1 | 0.8% | 3 | 2.0% | 2 | 1.2% | 1 | 0.7% | 4 | 2.6% | |
| 55-64 | 1 | 0.7% | 1 | 0.9% | 1 | 0.8% | 1 | 0.7% | 2 | 1.5% | 2 | 1.7% | 2 | 1.4% | 2 | 1.2% | 3 | 2.0% | 1 | 0.7% | |
| 65-74 | 1 | 0.7% | 0 | 0% | 1 | 0.8% | 1 | 0.7% | 0 | 0% | 1 | 0.8% | 3 | 2.0% | 0 | 0% | 0 | 0% | 1 | 0.7% | |
| ≥75 | 0 | 0% | 0 | 0% | 2 | 1.5% | 1 | 0.7% | 0 | 0% | 2 | 1.7% | 2 | 1.4% | 2 | 1.2% | 1 | 0.7% | 0 | 0% | |
| Total | 8 | 5.8% | 14 | 12.5% | 18 | 13.8% | 22 | 15.8% | 17 | 13.1% | 14 | 11.6% | 21 | 14.2% | 20 | 11.7% | 15 | 9.8% | 16 | 10.5% | |
| Total resistance | 139 | 100% | 112 | 100% | 130 | 100% | 139 | 100% | 130 | 100% | 121 | 100% | 148 | 100% | 171 | 100% | 153 | 100% | 152 | 100% | |
| Notes: Proportions presented are based on total resistant isolates for each diagnosis year. | |||||||||||||||||||||
| no data | Age (in years) | 2012 | 2013 | 2014 | 2015 | 2018 | 2021 | ||||||
|---|---|---|---|---|---|---|---|---|---|---|---|---|---|
| n | % | n | % | n | % | n | % | n | % | n | % | ||
| Extensive drug resistance | 15-24 | 1 | 0.7% | 0 | 0% | 0 | 0% | 0 | 0% | 0 | 0% | 1 | 0.7% |
| 25-34 | 0 | 0% | 0 | 0% | 1 | 0.8% | 0 | 0% | 0 | 0% | 0 | 0% | |
| 35-44 | 0 | 0% | 1 | 0.9% | 0 | 0% | 0 | 0% | 0 | 0% | 0 | 0% | |
| 65-74 | 0 | 0% | 0 | 0% | 0 | 0% | 0 | 0% | 1 | 0.7% | 0 | 0% | |
| Total | 1 | 0.7% | 1 | 0.7% | 1 | 0.8% | 1 | 0.7% | 2 | 1.4% | 1 | 0.7% | |
| Total resistance | 139 | 100% | 112 | 100% | 130 | 100% | 139 | 100% | 148 | 100% | 152 | 100% | |
| Notes: Proportions presented are based on total resistant isolates for each diagnosis year. | |||||||||||||
Appendix H: Method of detection of TB by province/territory, CTBRS: 2012-2021
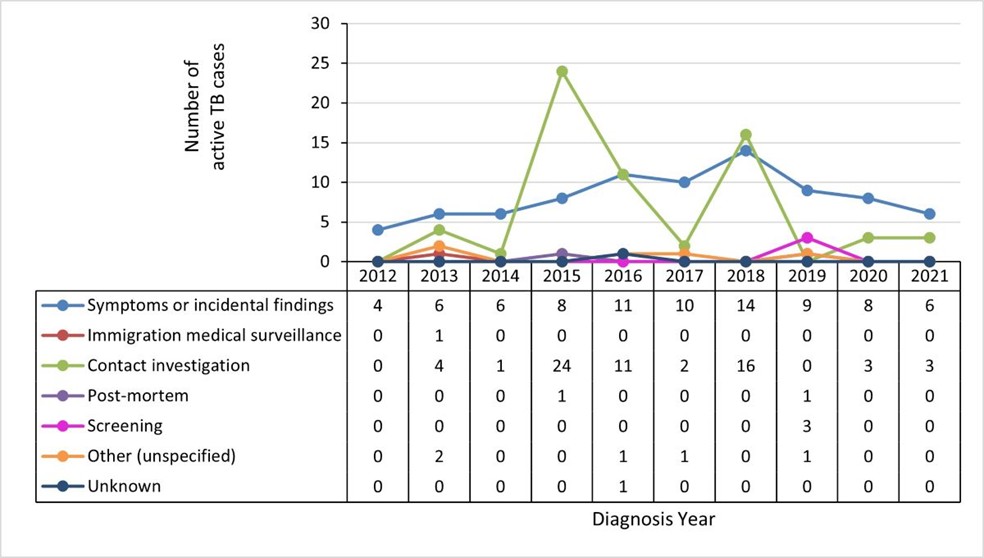
Figure 24 - Text description
| no data | 2012 | 2013 | 2014 | 2015 | 2016 | 2017 | 2018 | 2019 | 2020 | 2021 |
|---|---|---|---|---|---|---|---|---|---|---|
| Symptoms or incidental findings | 4 | 6 | 6 | 8 | 11 | 10 | 14 | 9 | 8 | 6 |
| Immigration medical surveillance | 0 | 1 | 0 | 0 | 0 | 0 | 0 | 0 | 0 | 0 |
| Contact investigation | 0 | 4 | 1 | 24 | 11 | 2 | 16 | 0 | 3 | 3 |
| Post-mortem | 0 | 0 | 0 | 1 | 0 | 0 | 0 | 1 | 0 | 0 |
| Screening | 0 | 0 | 0 | 0 | 0 | 0 | 0 | 3 | 0 | 0 |
| Other (unspecified) | 0 | 2 | 0 | 0 | 1 | 1 | 0 | 1 | 0 | 0 |
| Unknown | 0 | 0 | 0 | 0 | 1 | 0 | 0 | 0 | 0 | 0 |

Figure 25 - Text description
| no data | 2012 | 2014 | 2015 | 2016 | 2018 | 2019 | 2020 | 2021 |
|---|---|---|---|---|---|---|---|---|
| Symptoms or incidental findings | 1 | 3 | 3 | 4 | 1 | 1 | 2 | 1 |
| Immigration medical surveillance | 0 | 0 | 0 | 0 | 0 | 3 | 0 | 1 |
| Contact investigation | 0 | 0 | 0 | 0 | 0 | 0 | 0 | 0 |
| Post-mortem | 0 | 0 | 0 | 0 | 0 | 0 | 1 | 0 |
| Screening | 0 | 0 | 0 | 0 | 0 | 0 | 0 | 0 |
| Other (unspecified) | 0 | 0 | 0 | 0 | 0 | 0 | 0 | 0 |
| Unknown | 0 | 0 | 0 | 0 | 0 | 0 | 0 | 0 |

Figure 26 - Text description
| no data | 2012 | 2013 | 2014 | 2015 | 2016 | 2017 | 2018 | 2019 | 2020 | 2021 |
|---|---|---|---|---|---|---|---|---|---|---|
| Symptoms or incidental findings | 2 | 3 | 4 | 5 | 12 | 5 | 3 | 7 | 6 | 3 |
| Immigration medical surveillance | 0 | 0 | 0 | 0 | 0 | 0 | 1 | 0 | 1 | 1 |
| Contact investigation | 0 | 0 | 0 | 0 | 0 | 0 | 0 | 0 | 0 | 1 |
| Post-mortem | 1 | 0 | 0 | 0 | 0 | 0 | 0 | 0 | 1 | 0 |
| Screening | 0 | 0 | 1 | 1 | 0 | 3 | 0 | 1 | 0 | 0 |
| Other (unspecified) | 1 | 0 | 0 | 0 | 0 | 0 | 1 | 1 | 0 | 1 |
| Unknown | 1 | 0 | 0 | 0 | 0 | 0 | 1 | 2 | 1 | 2 |

Figure 27 - Text description
| no data | 2012 | 2013 | 2014 | 2015 | 2016 | 2017 | 2018 | 2019 | 2020 | 2021 |
|---|---|---|---|---|---|---|---|---|---|---|
| Symptoms or incidental findings | 7 | 6 | 6 | 5 | 1 | 5 | 3 | 0 | 0 | 0 |
| Immigration medical surveillance | 1 | 1 | 0 | 0 | 1 | 2 | 3 | 0 | 0 | 0 |
| Contact investigation | 0 | 0 | 0 | 0 | 0 | 1 | 0 | 0 | 0 | 0 |
| Post-mortem | 0 | 0 | 0 | 0 | 0 | 0 | 0 | 0 | 0 | 0 |
| Screening | 0 | 0 | 0 | 1 | 0 | 0 | 0 | 0 | 0 | 0 |
| Other (unspecified) | 0 | 1 | 0 | 0 | 0 | 0 | 0 | 0 | 0 | 0 |
| Unknown | 0 | 0 | 1 | 0 | 1 | 1 | 2 | 5 | 12 | 12 |

Figure 28 - Text description
| no data | 2012 | 2013 | 2014 | 2015 | 2016 | 2017 | 2018 | 2019 | 2020 |
|---|---|---|---|---|---|---|---|---|---|
| Symptoms or incidental findings | 155 | 176 | 147 | 167 | 179 | 162 | 197 | 181 | 127 |
| Immigration medical surveillance | 13 | 18 | 11 | 12 | 14 | 10 | 19 | 15 | 14 |
| Contact investigation | 72 | 26 | 20 | 40 | 30 | 13 | 23 | 44 | 9 |
| Post-mortem | 0 | 1 | 1 | 1 | 0 | 1 | 1 | 0 | 1 |
| Screening | 7 | 4 | 2 | 6 | 11 | 7 | 8 | 14 | 3 |
| Other (unspecified) | 8 | 6 | 6 | 2 | 3 | 4 | 4 | 3 | 1 |
| Unknown | 16 | 9 | 20 | 16 | 15 | 20 | 23 | 33 | 85 |

Figure 29 - Text description
| no data | 2012 | 2013 | 2014 | 2015 | 2016 | 2017 | 2018 | 2019 | 2020 | 2021 |
|---|---|---|---|---|---|---|---|---|---|---|
| Symptoms or incidental findings | 501 | 534 | 483 | 506 | 528 | 557 | 540 | 586 | 541 | 525 |
| Immigration medical surveillance | 36 | 25 | 21 | 10 | 23 | 28 | 41 | 41 | 20 | 19 |
| Contact investigation | 22 | 21 | 21 | 16 | 11 | 10 | 19 | 19 | 11 | 12 |
| Post-mortem | 0 | 5 | 3 | 2 | 2 | 1 | 3 | 2 | 2 | 0 |
| Screening | 32 | 26 | 31 | 44 | 38 | 54 | 30 | 42 | 48 | 30 |
| Other (unspecified) | 3 | 13 | 19 | 16 | 23 | 12 | 11 | 16 | 9 | 9 |
| Unknown | 24 | 10 | 7 | 3 | 16 | 14 | 15 | 36 | 44 | 88 |
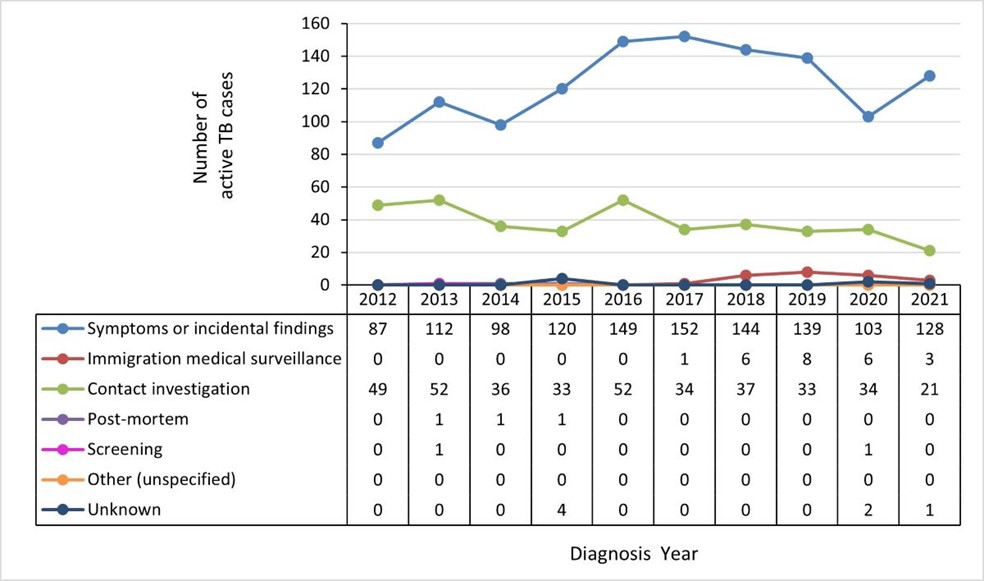
Figure 30 - Text description
| no data | 2012 | 2013 | 2014 | 2015 | 2016 | 2017 | 2018 | 2019 | 2020 | 2021 |
|---|---|---|---|---|---|---|---|---|---|---|
| Symptoms or incidental findings | 87 | 112 | 98 | 120 | 149 | 152 | 144 | 139 | 103 | 128 |
| Immigration medical surveillance | 0 | 0 | 0 | 0 | 0 | 1 | 6 | 8 | 6 | 3 |
| Contact investigation | 49 | 52 | 36 | 33 | 52 | 34 | 37 | 33 | 34 | 21 |
| Post-mortem | 0 | 1 | 1 | 1 | 0 | 0 | 0 | 0 | 0 | 0 |
| Screening | 0 | 1 | 0 | 0 | 0 | 0 | 0 | 0 | 1 | 0 |
| Other (unspecified) | 0 | 0 | 0 | 0 | 0 | 0 | 0 | 0 | 0 | 0 |
| Unknown | 0 | 0 | 0 | 4 | 0 | 0 | 0 | 0 | 2 | 1 |
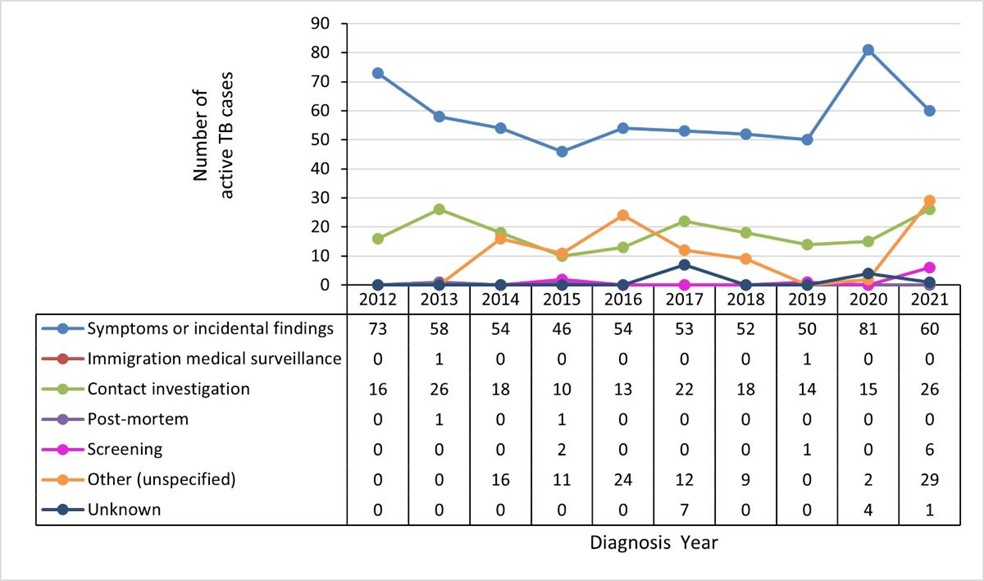
Figure 31 - Text description
| no data | 2012 | 2013 | 2014 | 2015 | 2016 | 2017 | 2018 | 2019 | 2020 | 2021 |
|---|---|---|---|---|---|---|---|---|---|---|
| Symptoms or incidental findings | 73 | 58 | 54 | 46 | 54 | 53 | 52 | 50 | 81 | 60 |
| Immigration medical surveillance | 0 | 1 | 0 | 0 | 0 | 0 | 0 | 1 | 0 | 0 |
| Contact investigation | 16 | 26 | 18 | 10 | 13 | 22 | 18 | 14 | 15 | 26 |
| Post-mortem | 0 | 1 | 0 | 1 | 0 | 0 | 0 | 0 | 0 | 0 |
| Screening | 0 | 0 | 0 | 2 | 0 | 0 | 0 | 1 | 0 | 6 |
| Other (unspecified) | 0 | 0 | 16 | 11 | 24 | 12 | 9 | 0 | 2 | 29 |
| Unknown | 0 | 0 | 0 | 0 | 0 | 7 | 0 | 0 | 4 | 1 |

Figure 32 - Text description
| no data | 2012 | 2013 | 2014 | 2015 | 2016 | 2017 | 2018 | 2019 | 2020 | 2021 |
|---|---|---|---|---|---|---|---|---|---|---|
| Symptoms or incidental findings | 155 | 154 | 195 | 187 | 193 | 182 | 188 | 217 | 226 | 215 |
| Immigration medical surveillance | 21 | 16 | 14 | 10 | 20 | 21 | 20 | 19 | 12 | 12 |
| Contact investigation | 11 | 10 | 6 | 9 | 15 | 3 | 6 | 6 | 2 | 8 |
| Post-mortem | 2 | 0 | 1 | 0 | 0 | 1 | 1 | 0 | 4 | 0 |
| Screening | 6 | 7 | 1 | 4 | 8 | 9 | 5 | 1 | 6 | 6 |
| Other (unspecified) | 0 | 0 | 0 | 0 | 2 | 1 | 2 | 0 | 1 | 0 |
| Unknown | 0 | 0 | 0 | 0 | 0 | 10 | 0 | 2 | 0 | 0 |

Figure 33 - Text description
| no data | 2012 | 2013 | 2014 | 2015 | 2016 | 2017 | 2018 | 2019 | 2020 | 2021 |
|---|---|---|---|---|---|---|---|---|---|---|
| Symptoms or incidental findings | 235 | 208 | 242 | 238 | 218 | 258 | 234 | 268 | 257 | 167 |
| Immigration medical surveillance | 8 | 13 | 5 | 9 | 10 | 10 | 10 | 24 | 9 | 17 |
| Contact investigation | 29 | 17 | 10 | 11 | 8 | 7 | 4 | 5 | 12 | 10 |
| Post-mortem | 7 | 11 | 8 | 2 | 2 | 6 | 1 | 2 | 5 | 0 |
| Screening | 1 | 7 | 2 | 4 | 0 | 4 | 5 | 3 | 1 | 10 |
| Other (unspecified) | 6 | 1 | 2 | 0 | 0 | 2 | 3 | 1 | 0 | 2 |
| Unknown | 0 | 0 | 0 | 0 | 0 | 1 | 7 | 1 | 16 | 83 |

Figure 34 - Text description
| no data | 2012 | 2013 | 2014 | 2015 | 2016 | 2017 | 2018 | 2019 | 2020 | 2021 |
|---|---|---|---|---|---|---|---|---|---|---|
| Symptoms or incidental findings | 1 | 2 | 4 | 3 | 1 | 6 | 2 | 0 | 0 | 1 |
| Immigration medical surveillance | 0 | 0 | 0 | 0 | 0 | 0 | 0 | 0 | 1 | 0 |
| Contact investigation | 0 | 0 | 0 | 0 | 0 | 0 | 1 | 1 | 0 | 0 |
| Post-mortem | 0 | 0 | 0 | 0 | 0 | 0 | 0 | 0 | 0 | 0 |
| Screening | 0 | 0 | 0 | 0 | 0 | 2 | 0 | 0 | 0 | 0 |
| Other (unspecified) | 0 | 0 | 0 | 0 | 0 | 0 | 0 | 0 | 0 | 0 |
| Unknown | 0 | 0 | 0 | 0 | 0 | 0 | 0 | 0 | 0 | 0 |

Figure 35 - Text description
| no data | 2012 | 2013 | 2014 | 2015 | 2016 | 2017 | 2018 | 2019 | 2020 | 2021 |
|---|---|---|---|---|---|---|---|---|---|---|
| Symptoms or incidental findings | 2 | 4 | 3 | 5 | 3 | 2 | 3 | 4 | 3 | 4 |
| Immigration medical surveillance | 0 | 0 | 0 | 0 | 0 | 0 | 0 | 1 | 0 | 0 |
| Contact investigation | 1 | 0 | 0 | 0 | 0 | 0 | 0 | 0 | 0 | 0 |
| Post-mortem | 0 | 0 | 0 | 0 | 0 | 0 | 0 | 0 | 0 | 0 |
| Screening | 3 | 0 | 0 | 0 | 0 | 0 | 0 | 0 | 0 | 0 |
| Other (unspecified) | 0 | 0 | 0 | 0 | 0 | 0 | 0 | 0 | 0 | 0 |
| Unknown | 0 | 0 | 1 | 0 | 0 | 1 | 0 | 0 | 4 | 0 |
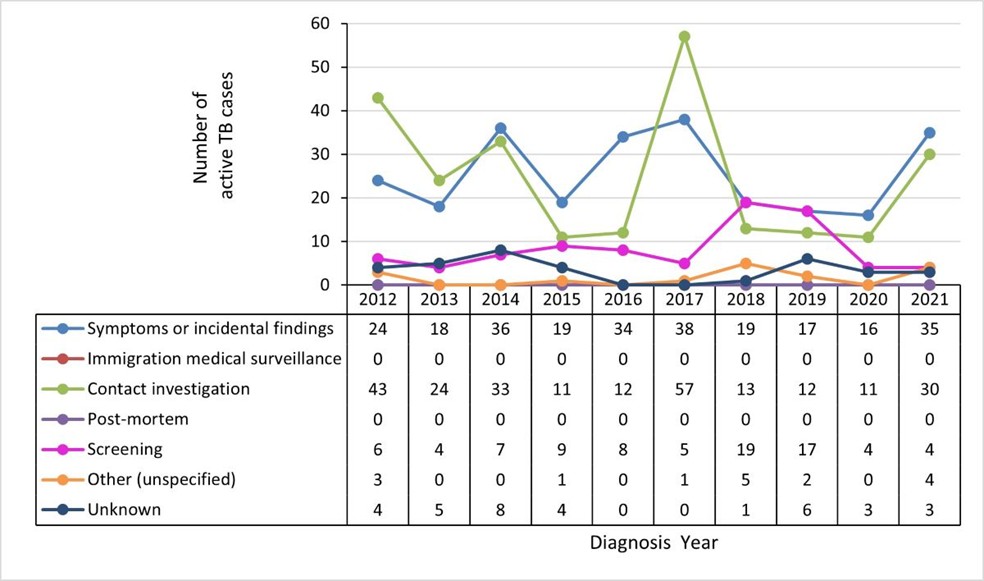
Figure 36 - Text description
| no data | 2012 | 2013 | 2014 | 2015 | 2016 | 2017 | 2018 | 2019 | 2020 | 2021 |
|---|---|---|---|---|---|---|---|---|---|---|
| Symptoms or incidental findings | 24 | 18 | 36 | 19 | 34 | 38 | 19 | 17 | 16 | 35 |
| Immigration medical surveillance | 0 | 0 | 0 | 0 | 0 | 0 | 0 | 0 | 0 | 0 |
| Contact investigation | 43 | 24 | 33 | 11 | 12 | 57 | 13 | 12 | 11 | 30 |
| Post-mortem | 0 | 0 | 0 | 0 | 0 | 0 | 0 | 0 | 0 | 0 |
| Screening | 6 | 4 | 7 | 9 | 8 | 5 | 19 | 17 | 4 | 4 |
| Other (unspecified) | 3 | 0 | 0 | 1 | 0 | 1 | 5 | 2 | 0 | 4 |
| Unknown | 4 | 5 | 8 | 4 | 0 | 0 | 1 | 6 | 3 | 3 |
Acknowledgements
The publication of this report would not have been possible without the collaboration of public health surveillance and epidemiology partners and laboratories in all provinces and territories. We appreciate and acknowledge the collaboration of all our surveillance partners.
| Province/Territory | Name | Organization |
|---|---|---|
| Newfoundland & Labrador |
|
Department of Health & Community Services |
| Prince Edward Island |
|
Public Health Office |
| Nova Scotia |
|
Department of Health & Wellness |
| New Brunswick |
|
Public Health New Brunswick |
| Québec |
|
Montréal Public Health Department Quebec National Institute of Public Health |
| Ontario |
|
Public Health Ontario |
| Manitoba |
|
Manitoba Health, Seniors & Active Living |
| Saskatchewan |
|
Saskatchewan Health Authority |
| Alberta |
|
Alberta Health/ Alberta Health Services |
| British Columbia |
|
BC Centre for Disease Control |
| Nunavut |
|
Department of Health |
| Yukon |
|
Yukon Communicable Disease Control |
| Northwest Territories |
|
Department of Health & Social Services |
| Province/Territory | Name | Organization |
|---|---|---|
| Newfoundland & Labrador |
|
Department of Health & Community Services |
| Prince Edward Island |
|
Public Health Office |
| Nova Scotia |
|
Department of Health & Wellness (Provincial Public Health Laboratory network) |
| New Brunswick |
|
Public Health New Brunswick (Saint John Regional Hospital) |
| Quebec |
|
Quebec National Institute of Public Health (Quebec Public Health Laboratory) |
| Ontario |
|
Public Health Ontario (Public Health Ontario Laboratory) |
| Manitoba |
|
Manitoba Health, Seniors & Active Living (Diagnostic Services, Shared Health) |
| Saskatchewan |
|
Saskatchewan Health Authority (Saskatchewan Disease Control Laboratory) |
| Alberta |
|
Alberta Health Services |
| British Columbia |
|
BC Centre for Disease Control (BCCDC Public Health Laboratory) |
| Nunavut |
|
Department of Health (Qikiqtani General Hospital) |
| Yukon |
|
Yukon Communicable Disease Control |
| Northwest Territories |
|
Department of Health & Social Services (Stanton Territorial Hospital) |
| Branch/Centre | Name |
|---|---|
| National Microbiology Laboratory |
|
| Infectious Disease and Vaccination Programs Branch, Centre for Communicable Diseases and Infection Control |
|
References
- Footnote 1
-
World Health Organization. (2014). Towards Tuberculosis Elimination: an action framework in low-incidence countries. Geneva: World Health Organization. https://www.who.int/publications/i/item/9789241507707
- Footnote 2
-
World Health Organization. (2022). Global tuberculosis report 2022. Geneva: World Health Organization. https://www.who.int/teams/global-tuberculosis-programme/tb-reports/global-tuberculosis-report-2022
- Footnote 3
-
Public Health Agency of Canada. (2018). The Time is Now. Public Health Agency of Canada. https://www.canada.ca/en/public-health/corporate/publications/chief-public-health-officer-reports-state-public-health-canada/eliminating-tuberculosis.html
- Footnote 4
-
World Health Organization. (2021) Global tuberculosis report 2021. Geneva: World Health Organization. https://www.who.int/publications/i/item/9789240037021
- Footnote 5
-
World Health Organization. (2023). The End TB Strategy. Geneva: World Health Organization. https://www.who.int/teams/global-tuberculosis-programme/the-end-tb-strategy
- Footnote 6
-
Public Health Agency of Canada. (2019). National case definition: Tuberculosis. Public Health Agency of Canada. https://www.canada.ca/en/public-health/services/diseases/tuberculosis/health-professionals/national-case-definition.html
- Footnote 7
-
Barss, L., Connors, W.J.A., & Fisher D. (2022). Chapter 7: Extra-pulmonary tuberculosis. Canadian Journal of respiratory, critical care, and sleep medicine, 6(S1), 87-108. https://www.tandfonline.com/doi/full/10.1080/24745332.2022.2036073
- Footnote 8
-
World Health Organization. (2013). Definitions and reporting framework for tuberculosis - 2013 revision: updated December 2013 and January 2020. World Health Organization. https://apps.who.int/iris/handle/10665/79199
- Footnote 9
-
World Health Organization. (2021). WHO announces updated definitions of extensively drug-resistant tuberculosis. Geneva: World Health Organization. https://www.who.int/news/item/27-01-2021-who-announces-updated-definitions-of-extensively-drug-resistant-tuberculosis
- Footnote 10
-
Statistics Canada. (2022). Population estimates on July 1st, by age and sex.: Table 17-10-0005-01. Statistics Canada, https://www150.statcan.gc.ca/t1/tbl1/en/tv.action?pid=1710000501
- Footnote 11
-
Statistics Canada. (2022). Immigrant status and period of immigration by place of birth and citizenship: Canada, provinces and territories and census metropolitan areas with parts.: Table 98-10-0302-01. Statistics Canada. https://doi.org/10.25318/9810030201-eng
- Footnote 12
-
Statistics Canada. (2021). Custom projection based on Projections of the Indigenous populations and households in Canada, 2016 to 2041: Overview of data sources, methods, assumptions and scenarios: Catalogue no. 17-20-0001. https://www150.statcan.gc.ca/n1/daily-quotidien/211006/dq211006a-eng.htm
- Footnote 13
-
Indian Registration System (IRS) (2021). Custom Product: Registered Indian Population by Canada by Affiliation Band Region, Residence, Sex, and Age Group. Indigenous and Northern Affairs Canada.
- Footnote 14
-
Public Health Agency of Canada. (2013). Directive for the collection, use, and dissemination of information relating to public health. Public Health Agency of Canada. Unpublished directive.
- Footnote 15
-
Canadian Tuberculosis Standards - 8th Edition. Canadian Journal of Respiratory, Critical Care, and Sleep Medicine, 6:sup1 (2022). https://www.tandfonline.com/toc/ucts20/6/sup1
- Footnote 16
-
European Centre for Disease Prevention and Control. (2023). Tuberculosis Surveillance and monitoring in Europe 2023-2021 data. European Centre for Disease Prevention and Control. https://www.ecdc.europa.eu/en/publications-data/tuberculosis-surveillance-and-monitoring-europe-2023-2021-data
- Footnote 17
-
Centers for Disease Control and Prevention. (2022). Reported Tuberculosis in the United States, 2021: Table 1. Tuberculosis cases, incidence rates per 100,000 population, deaths, death rates per 100,000 population, and percentage change: United States, 1953-2021. Centers for Disease Control and Prevention. https://www.cdc.gov/tb/statistics/reports/2021/table1.htm
- Footnote 18
-
Centres for Disease Control and Prevention. (2022). Reported Tuberculosis in the United States, 2021: Table 5. Tuberculosis cases, percentages, and incidence rates per 100,000 population by age group: United States, 1993-2021. Centers for Disease Control and Prevention. https://www.cdc.gov/tb/statistics/reports/2021/table5.htm
- Footnote 19
-
Greenway, C., Diefenbach-Elstob, T., Schwartzman, K., et al. (2022). Chapter 13: Tuberculosis surveillance and tuberculosis infection testing and treatment in migrants. Canadian Journal of respiratory, critical care, and sleep medicine, 2022: 6(S1), 194-204. https://www.tandfonline.com/doi/full/10.1080/24745332.2022.2035544
- Footnote 20
-
Centres for Disease Control and Prevention. (2022). Reported Tuberculosis in the United States, 2021: Table 10. Tuberculosis Cases, Percentages, and Incidence Rates per 100,000 Population by Origin of Birth:1 United States, 1993-2021. Centers for Disease Control and Prevention. https://www.cdc.gov/tb/statistics/reports/2021/table10.htm
- Footnote 21
-
European Centre for Disease Prevention and Control. (2022). Tuberculosis Surveillance and monitoring in Europe 2022-2020 data. European Centre for Disease Prevention and Control. https://www.ecdc.europa.eu/en/publications-data/tuberculosis-surveillance-and-monitoring-europe-2022-2020-data
- Footnote 22
-
European Centre for Disease Prevention and Control. (2021). Tuberculosis Surveillance and monitoring in Europe 2021-2019 data. European Centre for Disease Prevention and Control. https://www.ecdc.europa.eu/en/publications-data/tuberculosis-surveillance-and-monitoring-europe-2021-2019-data
- Footnote 23
-
European Centre for Disease Prevention and Control. (2020). Tuberculosis Surveillance and monitoring in Europe 2020-2018 data. European Centre for Disease Prevention and Control. https://www.ecdc.europa.eu/en/publications-data/tuberculosis-surveillance-and-monitoring-europe-2020-2018-data
- Footnote 24
-
European Centre for Disease Prevention and Control. (2020). Tuberculosis Surveillance and monitoring in Europe 2020-2018 data. European Centre for Disease Prevention and Control. https://www.ecdc.europa.eu/en/publications-data/tuberculosis-surveillance-and-monitoring-europe-2020-2018-data
- Footnote 25
-
Cords, O., Martinez, L., Warren, J.L., et al. (2021). Incidence and prevalence of tuberculosis in incarcerated populations: a systematic review and meta-analysis. Lancet Public Health. 6(5):e300-e308. https://www.sciencedirect.com/science/article/pii/S2468266721000256?via%3Dihub
- Footnote 26
-
Lee, J., Kwon, N., Goo, G., Cho, S. (2022). Inadequate housing and pulmonary tuberculosis: a systematic review. BMC Public Health. 22:622. https://bmcpublichealth.biomedcentral.com/articles/10.1186/s12889-022-12879-6
- Footnote 27
-
Public Health Agency of Canada. (2022). Estimates of HIV incidence, prevalence, and Canada's progress on meeting the 90-90-90 HIV Targets, 2020. Public Health Agency of Canada. https://www.canada.ca/en/public-health/services/publications/diseases-conditions/estimates-hiv-incidence-prevalence-canada-meeting-90-90-90-targets-2020.html
- Footnote 28
-
Centres for Disease Control and Prevention. (2022). Reported Tuberculosis in the United States, 2021: Table 19. Tuberculosis Cases and Percentages Among Persons with HIV Test Results and HIV Coinfection by Age group: United States, 2011-2021. Centers for Disease Control and Prevention. https://www.cdc.gov/tb/statistics/reports/2021/table19.htm
- Footnote 29
-
Sester, M., Giehl, C., Kampmann, B., et al. (2010). Challenges and perspectives for improved management of HIV/Mycobacterium tuberculosis co-infection. European Respiratory Journal 36: 1242-1247. https://erj.ersjournals.com/content/36/6/1242#:~:text=The%20medical%20handling%20of%20HIV,spread%20of%20multidrug%2Dresistant%20(i.e
- Footnote 30
-
Centres for Disease Control and Prevention. (2022). Reported Tuberculosis in the United States, 2021: Drug-Resistant TB. Centers for Disease Control and Prevention. https://www.cdc.gov/tb/statistics/reports/2021/drug_resistant.htm
Page details
- Date modified: