
National Laboratory Surveillance of Invasive Streptococcal Disease in Canada - Annual Summary 2017
Executive Summary
- Streptococcus pneumoniae: 3,006 isolates causing invasive pneumococcal disease (IPD) were characterized in 2017.
- In 2017, incidence of IPD declined in children under <1 year of age to 14.9 cases per 100,000 population; and in seniors ≥60 years increased to 21.1 cases per 100,000 population. The overall crude incidence rate has remained stable averaging 9.4 cases per 100,000 population since 2009.
- PCV7 serotypes remained relatively unchanged overall in 2017 accounting for 12% of IPD. Increases were seen in serotypes 4 and 19F.
- PCV13 (not including PCV7) serotypes accounted for 18% of overall IPD, continuing an overall decline from 36% in 2012. However, rates of serotype 3 remain fairly consistent in all age groups. Continued declines of PCV7 and PCV13 serotypes in seniors ≥65 years of age, as well as lower case rates in this age group, indicate indirect reduction of disease most likely through herd immunity effects.
- Overall levels of PPV23 and non-vaccine serotypes (NVT) have remained relatively unchanged in 2017 at 42% and 29%, respectively. Increases were seen in serotype 9N in ≥50 year olds.
- Predominant serotypes in 2017 were serotype 3 (10%), 22F (9%), 4 (8%), 9N (7%) and 8 (5%). 33F was the most prevalent serotype in <2 year olds accounting for 16% followed closely by 15B/C at 15%. For 2–4 year olds 22F remains predominant with 12%. An increase of serotype 4 in adults was associated with Western regions; 23B was predominant in 2–14 year olds, and 15A was associated with the < 65 year old age group in 2017 (Figure A).
- Antimicrobial susceptibility: Testing of 1,129 isolates indicated levels of resistance were again relatively stable during 2017 with the following resistance rates: clarithromycin (26%), penicillin (15%), doxycycline (11%), clindamycin (8%), trimethoprim/sulfamethoxazole (7%), meropenem (1.6%), and imipenem (0.1%). Serotypes 6A/C, 19A/F, 23A/F, 15A, 9V, 14 and 35B generally had the highest rates of antimicrobial resistance. Multi-drug resistance increased from 6% in 2016 to 10% in 2017. The highest rates of multi-drug resistance were seen in serotypes 15A (65%) and 19F (31%) (Figure B).
- S. pyogenes (Group A Streptococcus): 2,473 isolates causing invasive disease were characterized for emm type.
- Overall incidence of invasive disease has increased from 4.0 to 6.7 cases per 100,000 population from 2009 to 2017.
- Despite a decline since 2013, emm1 continues to be most predominant among all combined age groups and regions (18%) (Figure C). Regional increases of emm12 in the East (15%), emm74 in Central (14%) and emm49 (5%) in the West have been noted.
- Antimicrobial susceptibility: Antimicrobial resistance of S. pyogenes is relatively low, however small increases were seen in 2017 with chloramphenicol non-susceptibility at 5%, erythromycin resistance at 10%; and clindamycin resistance at 7%.
- S. agalactiae (Group B Streptococcus): There were 229 invasive Group B Streptococcus submitted to NML during 2017, of which 7 isolates were from early onset cases (infants ≤7 days old) and 8 were from late onset cases (infants 8 – 31 days old). Annual incidence of invasive disease per 100,000 population has fluctuated from a low in 2009 (27.6) to a high in 2014 (38.7), the incidence rate in 2017 was 30.6.
- Serotypes Ia (22%), IV (19%) and III and V (17% each) were most predominant.
- Antimicrobial susceptibility: Resistance to erythromycin increased to 58% while clindamycin resistance increased to 45%.
Figure A. Invasive S. pneumoniae serotypes in all combined age group
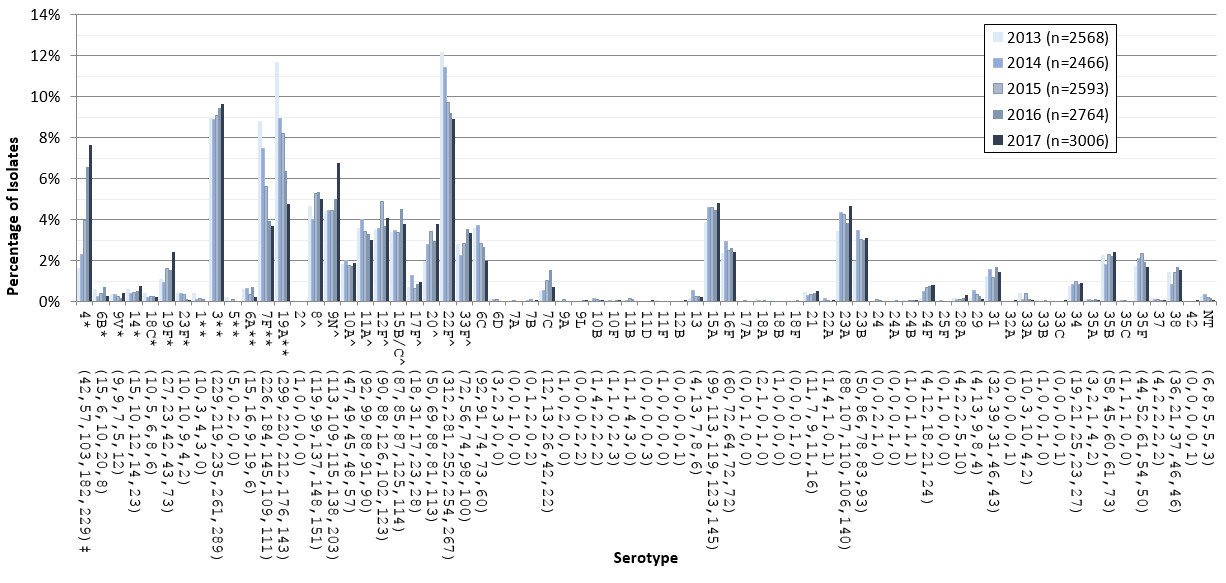
Figure A - Text Description
Bar graph displaying the percentage of Streptococcus pneumonia serotypes from 2013 to 2017 based on the total number of isolates tested annually.
| Column1 | 2013 (n=2568) | 2014 (n=2466) | 2015 (n=2593) | 2016 (n=2764) | 2017 (n=3006) |
|---|---|---|---|---|---|
| 4Footnote * (42,57,103,182,229) Footnote ‡ | 1.6% | 2.3% | 4.0% | 6.6% | 7.6% |
| 6BFootnote * (15,6,10,20,8) | 0.6% | 0.2% | 0.4% | 0.7% | 0.3% |
| 9VFootnote * (9,9,7,5,12) | 0.4% | 0.4% | 0.3% | 0.2% | 0.4% |
| 14Footnote * (15,10,12,14,23) | 0.6% | 0.4% | 0.5% | 0.5% | 0.8% |
| 18CFootnote * (10,5,6,8,6) | 0.4% | 0.2% | 0.2% | 0.3% | 0.2% |
| 19FFootnote * (27,23,42,43,73) | 1.1% | 0.9% | 1.6% | 1.6% | 2.4% |
| 23FFootnote * (10,10,9,4,2) | 0.4% | 0.4% | 0.3% | 0.1% | 0.1% |
| 1Footnote ** (10,3,4,3,0) | 0.4% | 0.1% | 0.2% | 0.1% | 0.0% |
| 3Footnote ** (229,219,235,261,289) | 8.9% | 8.9% | 9.1% | 9.4% | 9.6% |
| 5Footnote ** (5,0,2,0,0) | 0.2% | 0.0% | 0.1% | 0.0% | 0.0% |
| 6AFootnote ** (15,16,9,19,6) | 0.6% | 0.6% | 0.3% | 0.7% | 0.2% |
| 7FFootnote ** (226,184,145,109,111) | 8.8% | 7.5% | 5.6% | 3.9% | 3.7% |
| 19AFootnote ** (299,220,212,176,143) | 11.6% | 8.9% | 8.2% | 6.4% | 4.8% |
| 2Footnote ^ (1,0,0,0,0) | 0.0% | 0.0% | 0.0% | 0.0% | 0.0% |
| 8Footnote ^ (119,99,137,148,151) | 4.6% | 4.0% | 5.3% | 5.4% | 5.0% |
| 9NFootnote ^ (113,109,115,138,203) | 4.4% | 4.4% | 4.4% | 5.0% | 6.8% |
| 10AFootnote ^ (47,49,45,48,57) | 1.8% | 2.0% | 1.7% | 1.7% | 1.9% |
| 11AFootnote ^ (92,99,88,91,90) | 3.6% | 4.0% | 3.4% | 3.3% | 3.0% |
| 12FFootnote ^ (90,88,126,102,123) | 3.5% | 3.6% | 4.9% | 3.7% | 4.1% |
| 15B/CFootnote ^(87,85,87,125,114) | 3.4% | 3.4% | 3.4% | 4.5% | 3.8% |
| 17FFootnote ^ (18,31,17,23,28) | 0.7% | 1.3% | 0.7% | 0.8% | 0.9% |
| 20Footnote ^ (50,69,88,81,113) | 1.9% | 2.8% | 3.4% | 2.9% | 3.8% |
| 22FFootnote ^ (312,281,252,254,267) | 12.1% | 11.4% | 9.7% | 9.2% | 8.9% |
| 33FFootnote ^ (72,56,74,98,100) | 2.8% | 2.3% | 2.9% | 3.5% | 3.3% |
| 6C (92,91,74,73,60) | 3.6% | 3.7% | 2.9% | 2.6% | 2.0% |
| 6D (3,2,3,0,0) | 0.1% | 0.1% | 0.1% | 0.0% | 0.0% |
| 7A (0,0,1,0,0) | 0.0% | 0.0% | 0.0% | 0.0% | 0.0% |
| 7B (0,1,2,0,2) | 0.0% | 0.0% | 0.1% | 0.0% | 0.1% |
| 7C (12,13,26,42,22) | 0.5% | 0.5% | 1.0% | 1.5% | 0.7% |
| 9A (1,0,2,0,0) | 0.0% | 0.0% | 0.1% | 0.0% | 0.0% |
| 9L (0,0,0,2,2) | 0.0% | 0.0% | 0.0% | 0.1% | 0.1% |
| 10B (1,4,2,2,2) | 0.0% | 0.2% | 0.1% | 0.1% | 0.1% |
| 10F (1,1,0,2,3) | 0.0% | 0.0% | 0.0% | 0.1% | 0.1% |
| 11B (1,1,4,3,0) | 0.0% | 0.0% | 0.2% | 0.1% | 0.0% |
| 11D (0,0,0,0,3) | 0.0% | 0.0% | 0.0% | 0.0% | 0.1% |
| 11F (1,0,0,0,0) | 0.0% | 0.0% | 0.0% | 0.0% | 0.0% |
| 12B (0,0,0,0,1) | 0.0% | 0.0% | 0.0% | 0.0% | 0.0% |
| 13 (4,13,7,8,6) | 0.2% | 0.5% | 0.3% | 0.3% | 0.2% |
| 15A (99,113,119,123,145) | 3.9% | 4.6% | 4.6% | 4.5% | 4.8% |
| 16F (60,72,64,72,72) | 2.3% | 2.9% | 2.5% | 2.6% | 2.4% |
| 17A (0,0,1,0,0) | 0.0% | 0.0% | 0.0% | 0.0% | 0.0% |
| 18A (2,1,0,1,0) | 0.1% | 0.0% | 0.0% | 0.0% | 0.0% |
| 18B (1,0,0,0,0) | 0.0% | 0.0% | 0.0% | 0.0% | 0.0% |
| 18F (0,0,0,1,0) | 0.0% | 0.0% | 0.0% | 0.0% | 0.0% |
| 21 (11,7,9,11,16) | 0.4% | 0.3% | 0.3% | 0.4% | 0.5% |
| 22A (1,4,1,0,1) | 0.0% | 0.2% | 0.0% | 0.0% | 0.0% |
| 23A (88,107,110,106,140) | 3.4% | 4.3% | 4.2% | 3.8% | 4.7% |
| 23B (50,86,78,83,93) | 1.9% | 3.5% | 3.0% | 3.0% | 3.1% |
| 24 (0,0,2,1,0) | 0.0% | 0.0% | 0.1% | 0.0% | 0.0% |
| 24A (0,0,0,1,0) | 0.0% | 0.0% | 0.0% | 0.0% | 0.0% |
| 24B (1,0,1,1,1) | 0.0% | 0.0% | 0.0% | 0.0% | 0.0% |
| 24F (4,12,18,21,24) | 0.2% | 0.5% | 0.7% | 0.8% | 0.8% |
| 25F (0,1,0,0,0) | 0.0% | 0.0% | 0.0% | 0.0% | 0.0% |
| 28A (4,2,2,5,10) | 0.2% | 0.1% | 0.1% | 0.2% | 0.3% |
| 29 (4,13,9,8,4) | 0.2% | 0.5% | 0.3% | 0.3% | 0.1% |
| 31 (32,39,31,46,43) | 1.2% | 1.6% | 1.2% | 1.7% | 1.4% |
| 32A (0,0,0,0,1) | 0.0% | 0.0% | 0.0% | 0.0% | 0.0% |
| 33A (10,3,10,4,2) | 0.4% | 0.1% | 0.4% | 0.1% | 0.1% |
| 33B (1,0,0,1,0) | 0.0% | 0.0% | 0.0% | 0.0% | 0.0% |
| 33C (0,0,0,0,1) | 0.0% | 0.0% | 0.0% | 0.0% | 0.0% |
| 34 (19,21,25,23,27) | 0.7% | 0.9% | 1.0% | 0.8% | 0.9% |
| 35A (3,2,1,4,2) | 0.1% | 0.1% | 0.0% | 0.1% | 0.1% |
| 35B (58,45,60,61,73) | 2.3% | 1.8% | 2.3% | 2.2% | 2.4% |
| 35C (1,1,1,0,0) | 0.0% | 0.0% | 0.0% | 0.0% | 0.0% |
| 35F (44,52,61,54,50) | 1.7% | 2.1% | 2.4% | 2.0% | 1.7% |
| 37 (4,2,2,2,2) | 0.2% | 0.1% | 0.1% | 0.1% | 0.1% |
| 38 (36,21,37,46,46) | 1.4% | 0.9% | 1.4% | 1.7% | 1.5% |
| 42 (0,0,0,0,1) | 0.0% | 0.0% | 0.0% | 0.0% | 0.0% |
| NT (6,8,5,5,3) | 0.2% | 0.3% | 0.2% | 0.2% | 0.1% |
|
|||||
Figure B. Annual trend of multi-drug resistance of S. pneumoniae
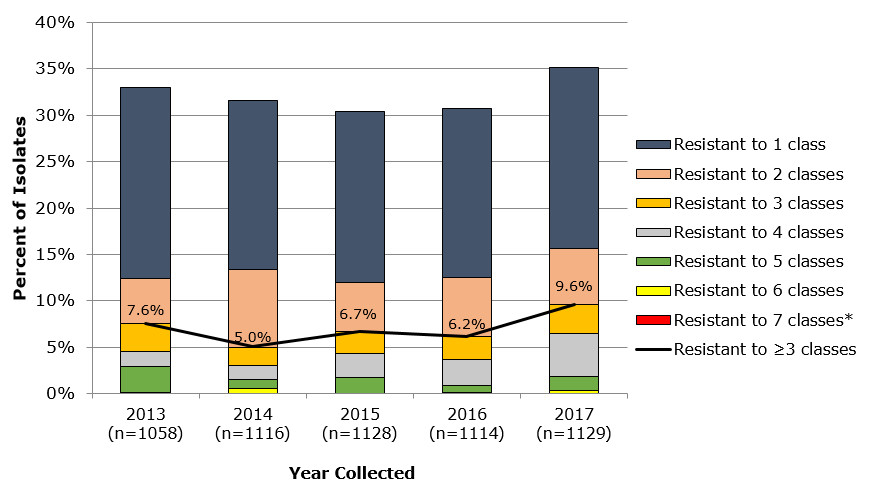
Figure B - Text Description
A combination line and stacked bar graph displaying multidrug drug resistance trends from 2013 to 2017 for S pneumoniae.
| Category 1 | Resistant to 7 classesnote de bas de page * | Resistant to 6 classes | Resistant to 5 classes | Resistant to 4 classes | Resistant to 3 classes | Resistant to 2 classes | Resistant to 1 class | Resistant to ≥3 classes |
|---|---|---|---|---|---|---|---|---|
| 2013 (n=1058) | 0.1% | 0.0% | 2.8% | 1.6% | 3.0% | 4.8% | 20.6% | 7.6% |
| 2014 (n=1116) | 0.0% | 0.5% | 1.0% | 1.5% | 2.0% | 8.3% | 18.3% | 5.0% |
| 2015 (n=1128) | 0.0% | 0.0% | 1.8% | 2.6% | 2.4% | 5.2% | 18.4% | 6.7% |
| 2016 (n=1114) | 0.0% | 0.1% | 0.8% | 2.8% | 2.5% | 6.4% | 18.2% | 6.2% |
| 2017 (n=1129) | 0.0% | 0.4% | 1.5% | 4.6% | 3.1% | 6.1% | 19.5% | 9.6% |
|
||||||||
Figure C. Invasive S. pyogenes emm types
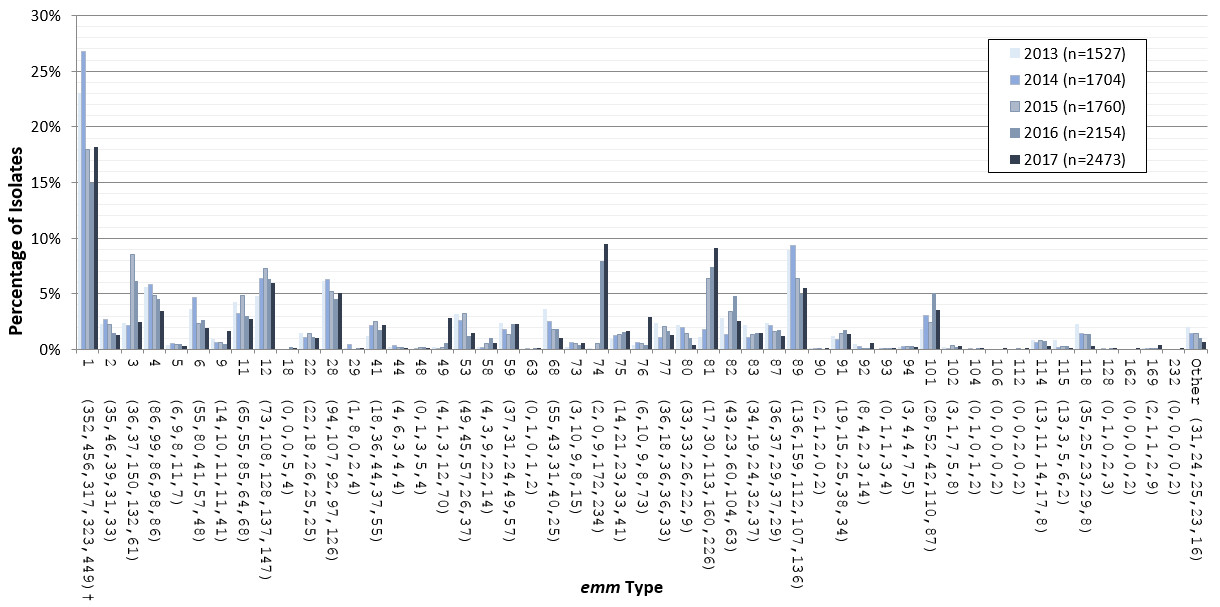
Figure C - Text Description
Bar graph displaying emm types of S. pyogenes from 2013 to 2017 by percentage based on the total number of isolates tested annually.
| Column1 | 2013 (n=1527) | 2014 (n=1704) | 2015 (n=1760) | 2016 (n=2154) | 2017 (n=2473) |
|---|---|---|---|---|---|
| 1 (352,456,317,323,449)note de bas de page † | 23.1% | 26.8% | 18.0% | 15.0% | 18.2% |
| 2 (35,46,39,31,33) | 2.3% | 2.7% | 2.2% | 1.4% | 1.3% |
| 3 (36,37,150,132,61) | 2.4% | 2.2% | 8.5% | 6.1% | 2.5% |
| 4 (86,99,86,98,86) | 5.6% | 5.8% | 4.9% | 4.5% | 3.5% |
| 5 (6,9,8,11,7) | 0.4% | 0.5% | 0.5% | 0.5% | 0.3% |
| 6 (55,80,41,57,48) | 3.6% | 4.7% | 2.3% | 2.6% | 1.9% |
| 9 (14,10,11,11,41) | 0.9% | 0.6% | 0.6% | 0.5% | 1.7% |
| 11 (65,55,85,64,68) | 4.3% | 3.2% | 4.8% | 3.0% | 2.7% |
| 12 (73,108,128,137,147) | 4.8% | 6.3% | 7.3% | 6.4% | 5.9% |
| 18 (0,0,0,5,4) | 0.0% | 0.0% | 0.0% | 0.2% | 0.2% |
| 22 (22,18,26,25,25) | 1.4% | 1.1% | 1.5% | 1.2% | 1.0% |
| 28 (94,107,92,97,126) | 6.2% | 6.3% | 5.2% | 4.5% | 5.1% |
| 29 (1,8,0,2,4) | 0.1% | 0.5% | 0.0% | 0.1% | 0.2% |
| 41 (18,36,44,37,55) | 1.2% | 2.1% | 2.5% | 1.7% | 2.2% |
| 44 (4,6,3,4,4) | 0.3% | 0.4% | 0.2% | 0.2% | 0.2% |
| 48 (0,1,3,5,4) | 0.0% | 0.1% | 0.2% | 0.2% | 0.2% |
| 49 (4,1,3,12,70) | 0.3% | 0.1% | 0.2% | 0.6% | 2.8% |
| 53 (49,45,57,26,37) | 3.2% | 2.6% | 3.2% | 1.2% | 1.5% |
| 58 (4,3,9,22,14) | 0.3% | 0.2% | 0.5% | 1.0% | 0.6% |
| 59 (37,31,24,49,57) | 2.4% | 1.8% | 1.4% | 2.3% | 2.3% |
| 63 (0,1,0,1,2) | 0.0% | 0.1% | 0.0% | 0.0% | 0.1% |
| 68 (55,43,31,40,25) | 3.6% | 2.5% | 1.8% | 1.9% | 1.0% |
| 73 (3,10,9,8,15) | 0.2% | 0.6% | 0.5% | 0.4% | 0.6% |
| 74 (2,0,9,172,234) | 0.1% | 0.0% | 0.5% | 8.0% | 9.5% |
| 75 (14,21,23,33,41) | 0.9% | 1.2% | 1.3% | 1.5% | 1.7% |
| 76 (6,10,9,8,73) | 0.4% | 0.6% | 0.5% | 0.4% | 3.0% |
| 77 (36,18,36,36,33) | 2.4% | 1.1% | 2.0% | 1.7% | 1.3% |
| 80 (33,33,26,22,9) | 2.2% | 1.9% | 1.5% | 1.0% | 0.4% |
| 81 (17,30,113,160,226) | 1.1% | 1.8% | 6.4% | 7.4% | 9.1% |
| 82 (43,23,60,104,63) | 2.8% | 1.3% | 3.4% | 4.8% | 2.5% |
| 83 (34,19,24,32,37) | 2.2% | 1.1% | 1.4% | 1.5% | 1.5% |
| 87 (36,37,29,37,29) | 2.4% | 2.2% | 1.6% | 1.7% | 1.2% |
| 89 (136,159,112,107,136) | 8.9% | 9.3% | 6.4% | 5.0% | 5.5% |
| 90 (2,1,2,0,2) | 0.1% | 0.1% | 0.1% | 0.0% | 0.1% |
| 91 (19,15,25,38,34) | 1.2% | 0.9% | 1.4% | 1.8% | 1.4% |
| 92 (8,4,2,3,14) | 0.5% | 0.2% | 0.1% | 0.1% | 0.6% |
| 93 (0,1,1,3,4) | 0.0% | 0.1% | 0.1% | 0.1% | 0.2% |
| 94 (3,4,4,7,5) | 0.2% | 0.2% | 0.2% | 0.3% | 0.2% |
| 101 (28,52,42,110,87) | 1.8% | 3.1% | 2.4% | 5.1% | 3.5% |
| 102 (3,1,7,5,8) | 0.2% | 0.1% | 0.4% | 0.2% | 0.3% |
| 104 (0,1,0,1,2) | 0.0% | 0.1% | 0.0% | 0.0% | 0.1% |
| 106 (0,0,0,0,2) | 0.0% | 0.0% | 0.0% | 0.0% | 0.1% |
| 112 (0,0,2,0,2) | 0.0% | 0.0% | 0.1% | 0.0% | 0.1% |
| 114 (13,11,14,17,8) | 0.9% | 0.6% | 0.8% | 0.8% | 0.3% |
| 115 (13,3,5,6,2) | 0.9% | 0.2% | 0.3% | 0.3% | 0.1% |
| 118 (35,25,23,29,8) | 2.3% | 1.5% | 1.3% | 1.3% | 0.3% |
| 128 (0,1,0,2,3) | 0.0% | 0.1% | 0.0% | 0.1% | 0.1% |
| 162 (0,0,0,0,2) | 0.0% | 0.0% | 0.0% | 0.0% | 0.1% |
| 169 (2,1,1,2,9) | 0.1% | 0.1% | 0.1% | 0.1% | 0.4% |
| 232 (0,0,0,0,2) | 0.0% | 0.0% | 0.0% | 0.0% | 0.1% |
| Other (31,24,25,23,16) | 2.0% | 1.4% | 1.4% | 1.1% | 0.6% |
|
|||||
Page details
- Date modified: