
Surveillance report on falls among older adults in Canada
Download the alternative format
(PDF format, 3.0 MB, 37 pages)
Table of contents
- Executive summary
- Preface: how this report is organized
- 1.0 Introduction
- 2.0 Scope of the problem
- 2.1 What older adults report about falls and related injuries
- 2.2 What hospitalization data tell us about older adults’ falls
- 2.3 What hospitalization data tell us about falls among older adults in residential care
- 2.4 What emergency department data tell us about older adults’ falls
- 2.5 What mortality data tell us about deaths due to falls among older adults
- 2.6 Summary and Conclusions
- Appendix
- References
Executive summary
Background
Falls among older adults are a public health concern worldwide. According to the World Health Organization, about a third of older adults fall each year. The percentage ranges from 32% to 42% for those 70 years or older.
In Canada, falls are the leading cause of injury-related hospitalizations and injury deaths among people aged 65 or older. Injuries from falls reduce older adults’ quality of life, increase caregiver demands, and precipitate admissions into long-term care. The cost of treating fall-related injuries is high. As the baby boom cohort ages, by 2040 older adults are projected to make up close to one-fourth of Canada’s population. The pace of growth of the group aged 85 or older is expected to be particularly steep. Therefore, it is essential to monitor trends and burden of falls among Canadian older adults.
Objective
This report provides updates to the national-level data in the Seniors’ Falls in Canada Second Report on the nature, severity, and burden of falls among people aged 65 or older, and describes changes over time.
Data sources
The data are from four sources: 1) self-reported results from Statistics Canada’s Canadian Community Health Survey (CCHS) for 2017-2018; 2) hospitalization statistics from the Canadian Institute for Health Information’s (CIHI) Discharge Abstract Database for 2008/2009 to 2019/2020; 3) emergency department (ED) visit statistics from CIHI’s National Ambulatory Care Reporting System for 2010/2011 to 2019/2020; and 4) mortality data from Statistics Canada’s Canadian Vital Statistics– Death Database for 2001 to 2019.
Key findings
In 2017-2018, 5.8% of individuals living in a household residence aged 65 or older reported that they had been injured in a fall in the past 12 months (CCHS data). The prevalence of fall-related injuries was higher among older women than men, and higher among those aged 80 or older compared with 65- to 79-year-olds. A majority (61%) of falls occurred while walking. Thirty-nine percent of injuries were fractures. Seventy percent of older adults who suffered a fall-related injury sought medical attention, among whom 72% received ED treatment.
According to hospitalization data, from 2008/2009 to 2019/2020, the number of fall-related hospitalizations (FRHs) of older adults increased 47%. However, crude and age-standardized FRH rates were relatively stable, at about 15 per 1,000 people. Rates rose with age and were higher for women than men. Approximately 52% of falls resulting in hospitalization occurred in a household residence and 17% in a residential care facility. The average length of stay for FRHs was 4 to 5 days longer than the average for all-cause hospitalizations. Patients hospitalised from a fall involving hip fracture stayed in hospital about 3 days longer than those without hip fracture. In 2019/2020, 34% of fall-related hospitalizations involved a hip fracture. The percentage involving a hip fracture was higher among older adults who lived in a residential care facility (49%) than among those who lived in a household residence (31%).
Combined ED data for Ontario and Alberta show that crude and age-standardized rates of fall-related ED visits by older adults increased between 2010/2011 and 2019/2020 (from 58 to 64 per 1,000 people). Fall-related ED visit rates rose with age, and women had higher rates than men.
From 2001 to 2019, crude and age-standardized mortality rates due to falls increased among older adults (crude rate was 85 per 100,000 people in 2019), and were higher at successively older ages, with a significant increase at age 90+. Although the number of women who died due to a fall was higher, fall-related age-standardized mortality rates were higher among men.
Conclusion
Falls among older adults continue to be a serious public health issue in Canada. ED visit and mortality rates show upward trends, and although hospitalization rates appear stable, the number of Canadians aged 65 or older requiring hospital admission for fall-related injuries is growing. Falls and fall-related injuries among older adults are preventable. Future prevention efforts may target those most at risk: women, those aged 80 or older, and older people who live alone or have low income. Multi-faceted prevention strategies will be important to reduce the prevalence of fall-related injuries and deaths in Canada’s aging population.
Acknowledgments
The report was prepared by the following people (currently and formerly) in the Centre for Surveillance and Applied Research (CSAR) at the Public Health Agency of Canada (PHAC): Felix Bang, Yosuf Kaliwal, Wendy Thompson and Xiaoquan Yao; in the Centre for Health Promotion (CHP) at PHAC: Simone Powell, Joanne Bowater and Emma Tittonel, as well as Stephanie Cowle, Pamela Fuselli, Hélène Gagné, and Alison Stirling from Parachute.
We would also like to acknowledge the contributions of the following who provided valuable review and input to the development of this report: Kerry Anderson, André Champagne, Amélie Gauthier-Beaupré, Meghan Grainger, Clare Jackson, Korry MacLeod, Steven McFaull, Danielle Provost, Jordana Sternthal and Sarah Zutrauen.
Sincere thanks to Mary Sue Deveraux for editing and advice, and we would also like to include Sophie Maisonneuve from Creative Services.
Preface: how this report is organized
Chapter 1
Introduction presents objectives and describes data sources.
Chapter 2
Scope of the problem offers an overview of data on fall-related injuries, hospitalizations, emergency department visits, and deaths among Canadians aged 65 or older.
1.0 Introduction
Falls among older adults (aged 65 or older) are a public health concern worldwide,(1,2) leading to emergency department visits, hospitalizations, loss of quality of life and independence, and death. The World Health Organization (WHO) defines a fall as “inadvertently coming to rest on the ground, floor or other lower level, excluding intentional change in position to rest in furniture, wall or other objects.” (2,3) According to the WHO, about a third of older adults fall each year; at age 70 or older, the percentage ranges from 32% to 42%.(2,3)
In Canada, between 2005 and 2013, 4.9% to 5.9% of older adults living in a household residence fell and sustained an injury that limited their normal activities.(4) In 2018, falls accounted for 61% of injury deaths and 66% of deaths due to unintentional injury among people aged 65 or older.(5) The 2014 Seniors’ Falls in Canada Second Report showed an increase in the annual number of deaths of older adults due to falls from 1,631 in 2003 to 2,691 in 2008.(6) The age-standardized mortality rate due to falls rose from 3.5 to 4.7 per 10,000 during the period.(6)
Falls were the leading cause of injury-related hospitalizations among people aged 65 or older in 2018/2019.(7) According to the Seniors’ Falls in Canada Second Report, the annual number of fall-related hospitalizations of people aged 65 or older increased from 67,900 in 2006/2007 to 78,300 in 2010/2011, although the age- standardized hospitalization rate remained stable at around 13.6 per 1,000 people.(6) Hospitalization rates rose at successively older ages, particularly among women.
Falls and their resulting injuries cause loss of quality of life, increase caregiver responsibilities, and precipitate admissions to long-term care. In addition, falls entail substantial healthcare costs.(8,9) For example, in 2018, the annual direct cost of injurious falls among older Canadian adults was estimated at Can$5.6 billion, which was more than twice the cost associated with falls among 25- to 64-year-olds.(5)
Prevention efforts targeting more than one risk factor can reduce the personal and societal costs of falls.(2,6) Research supports comprehensive individual assessments followed by multifactorial, evidence-based practices tailored to the individual’s health status, situation, and environment. Such interventions include assistive devices and protective equipment (for example, anti-slip footwear), environment modification, fall prevention education, and exercise programs.(2,6) Continued research to address knowledge gaps and assess promising practices will strengthen the evidence base, lessen the consequences of falls for older adults, and promote healthy aging.(6)
Older adults made up almost one-fifth of the Canadian population in 2019. By 2040, the percentage is projected to be close to one-fourth.(10) As the baby-boom cohort (people born between 1946 and 1965) ages, the percentage aged 85 or older is expected to increase even faster.(11) Therefore, it is essential to monitor trends in falls among the older population and associated burdens on the health care system.
This document updates national data in the Seniors’ Falls in Canada Second Report (6) about the nature, severity and burden of falls among Canadians aged 65 or older, and describes changes over time.
The information is from the following sources (- indicates combined years; / indicates fiscal year):
- Self-reported data from Statistics Canada’s Canadian Community Health Survey (CCHS) for 2017-2018 (12)
- Hospitalization data from the Canadian Institute for Health Information (CIHI)’s Discharge Abstract Database (DAD) for 2008/2009 to 2019/2020 (13)
- Emergency department (ED) visit data from CIHI’s National Ambulatory Care Information System (NACRS) for 2010/2011 to 2019/2020 (14)
- Mortality data from Statistics Canada’s Canadian Vital Statistics–Death Database (CVSD) for 2001 to 2019 (15)
Readers should be cautious when comparing data from the four sources. Each source has its own definition of what constitutes a fall. These definitions are influenced by data collection methods, for example, self-report versus hospital records. It is equally important to recognize the limitations of each source, including the inherent potential for data errors and the impact of coding systems. Readers should also note the difference in the scope of hospitalization data between this report and the Seniors’ Falls in Canada Second Report. The source of hospitalization data for this report, the DAD, does not include Quebec hospitals, whereas the data source for the previous report, the Hospital Morbidity Database, includes Quebec hospitals. In addition, this report contains ED visit data, which the previous report did not contain.
Population structure is key in interpreting these findings. Higher counts do not necessarily mean that higher percentages were affected. Rates including crude, age- standardized, age-specific, and sex-specific rates are presented wherever possible.
2.0 Scope of the problem
2.1 What older adults report about falls and related injuries
This section provides Canadian Community Health Survey (CCHS) data on the prevalence of injurious falls, types of injury, activities associated with falls, and places where treatment was sought. If sample size permits, results are presented by sex and age group.
2.1.1 Data and definitions
The CCHS is a cross-sectional survey that collects information about health status, health care use, and health determinants. It is representative of more than 97% of the population aged 12 or older.(16,17) Data are collected from household residents in the provinces and territories. Excluded from the survey’s coverage are: persons living on reserves and other Indigenous settlements in the provinces; full-time members of the Canadian Forces; the institutionalized population (health institutions, prisons, religious institutions, convents, etc.); children aged 12 to 17 that are living in foster care; and persons living in the Quebec health regions of Région du Nunavik and Région des Terres-Cries-de- la-Baie-James.(16,17) For respondents unable to complete the survey themselves, a proxy interview was conducted. The exclusion of institutional residents from the CCHS is particularly relevant for this analysis—no data were collected on older adults living in residential care facilities.
Data are collected annually from a complex, multi-stage stratified sample across Canada. The data for this report are based on the combined 2017-2018 cycles of the CCHS. No comparison was made with previous cycles, because 2017 and 2018 were the first cycles to include fall-related content after redesign of the CCHS in 2015.
In the CCHS, a “fall” is identified when respondents report that in the past year: 1) they suffered an injury (except a repetitive strain injury) serious enough to limit their normal activities, and 2) the injury was the result of a fall. The CCHS collects details about only the most serious injury the individual sustained from a fall. Information is not captured about falls that caused an injury that did not limit normal activities the following day, or about other falls the individual experienced that did not cause the most serious injury even though normal activities were affected.
Findings with a coefficient of variation (CV) of 15.0%–35.0% should be interpreted with caution because of small sample size. Statistics with a CV above 35.0% are not reported.
2.1.2 Findings
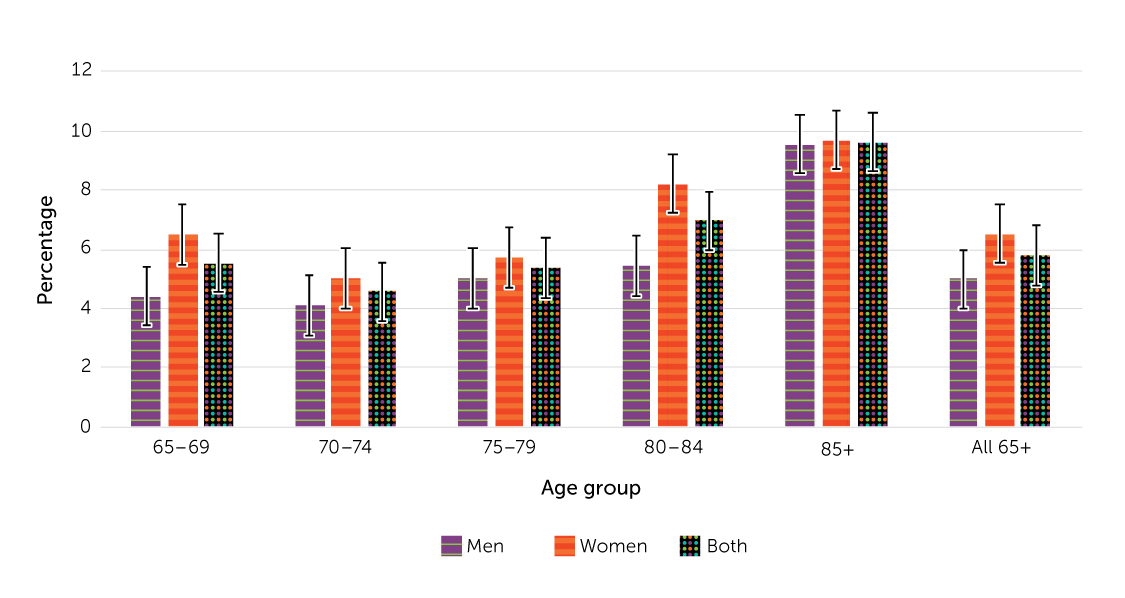
In 2017-2018, 5.8% of older adults living in a household residence (an estimated 350,000 individuals) reported that they had experienced a serious injury resulting from a fall in the past year. The prevalence of fall-related injuries was higher among women than men: 6.5% versus 5.0% (Figure 1). For both sexes, those aged 80 or older were more likely to experience a serious fall-related injury than 65-79-year-olds. The highest prevalence was among the oldest adults: 9.6% of those aged 85 and older reported a fall-related injury, compared with 5.5% of 65- to 69-year-olds.
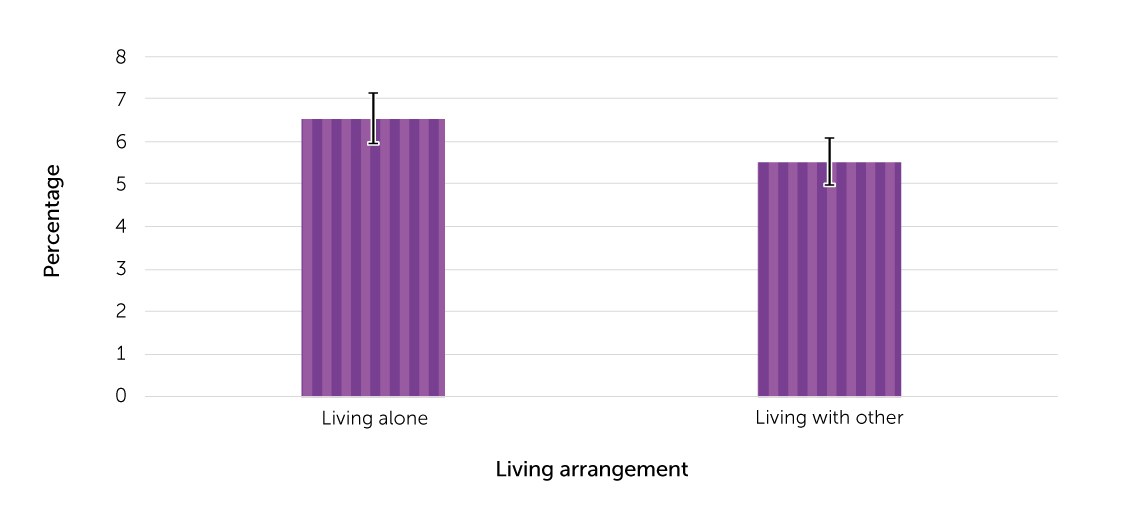
Older adults living alone had a significantly higher prevalence of fall-related injuries than those living with others: 6.5% versus 5.5% (Figure 2).
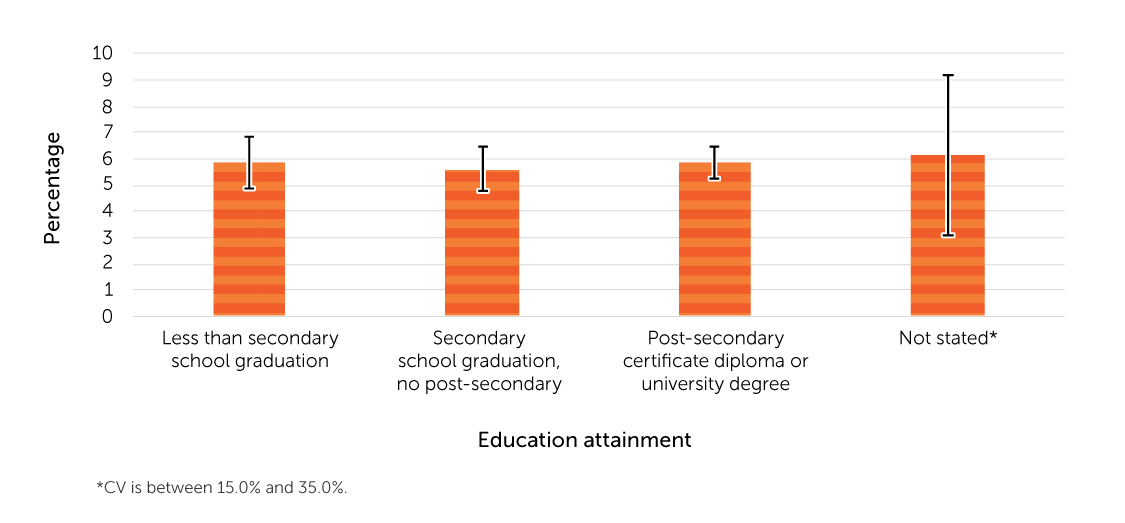
No significant differences in the prevalence of fall-related injuries were apparent by educational attainment (Figure 3).
Older adults in households with annual household income less than CAD $20,000 had the highest prevalence of fall-related injuries (8.0%) (Figure 4). About 5% of those in households with annual household income of at least CAD $20,000 reported an injury from a fall.
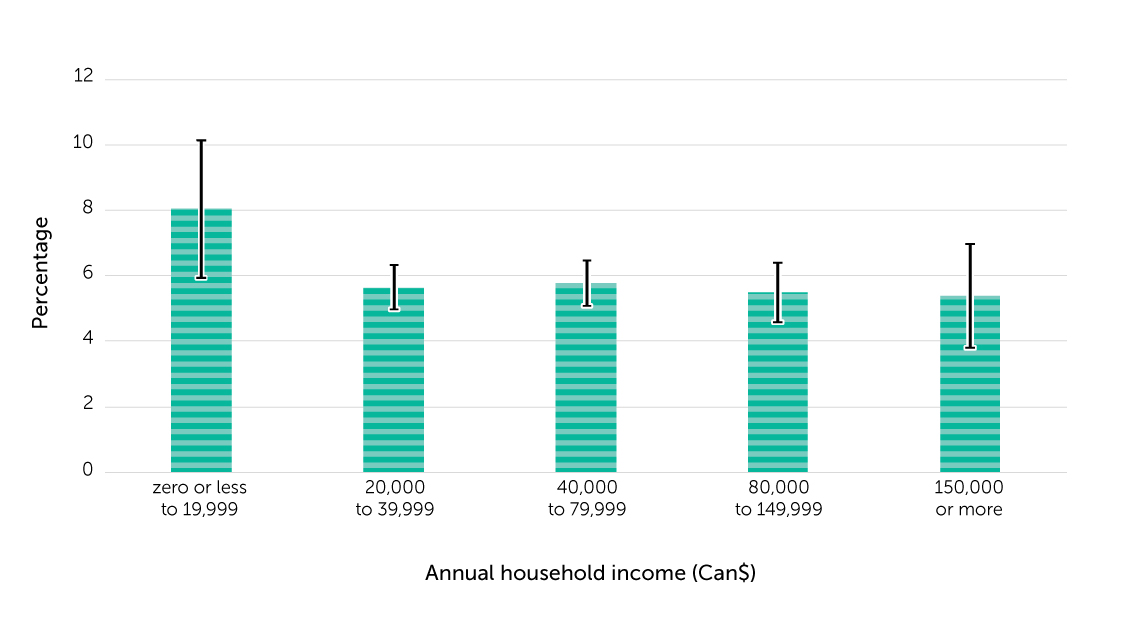
Table 1 in the Appendix contains sample sizes, population estimates and proportions with 95% confidence intervals, by demographic characteristics, for older adults who reported a fall-related injury and those who did not.
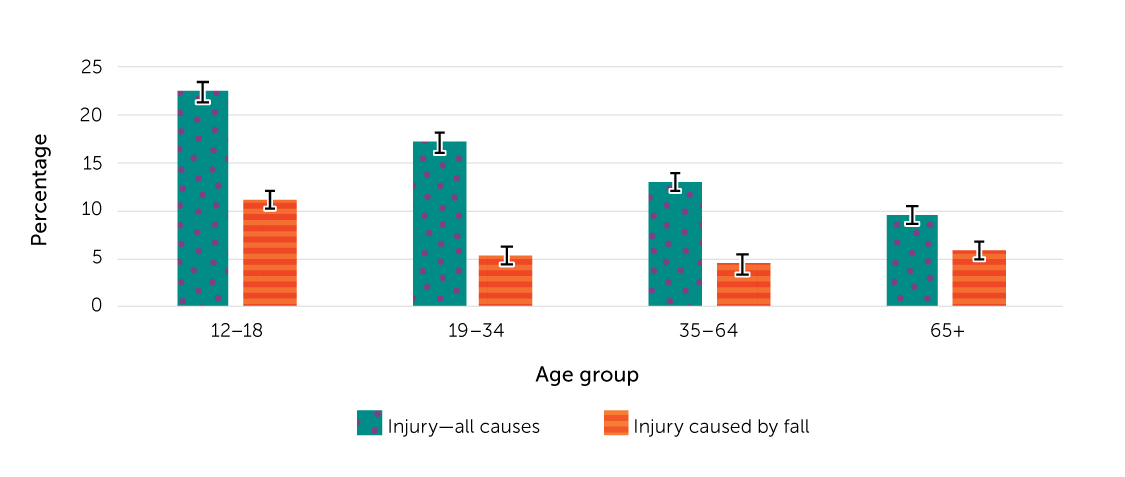
Figure 5 compares the prevalence of injuries due to any cause with injuries due to a fall, by age group. Among adults aged 19 or older, the prevalence of injuries declined at successively older ages, but the share of injuries due to falls increased. At age 65 or older, 9.5% reported an injury, 61% of which were resulted from a fall. At ages 19 to 64, the percentages reporting injuries were in the 13%-to-17% range, and about a third of those injuries were due to a fall.
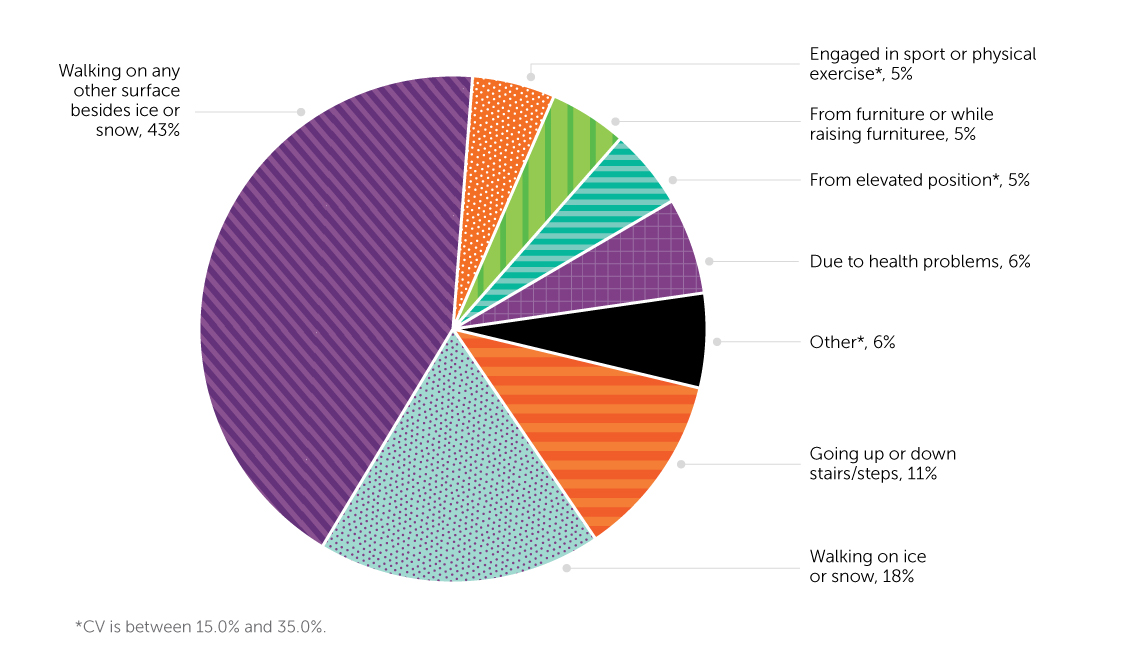
Slipping while walking caused 61% of fall-related injuries; 18% occurred on ice or snow, and 43% were from walking on other surfaces (Figure 6). The next most frequently reported activity associated with falls was going up or down stairs or steps (12%).
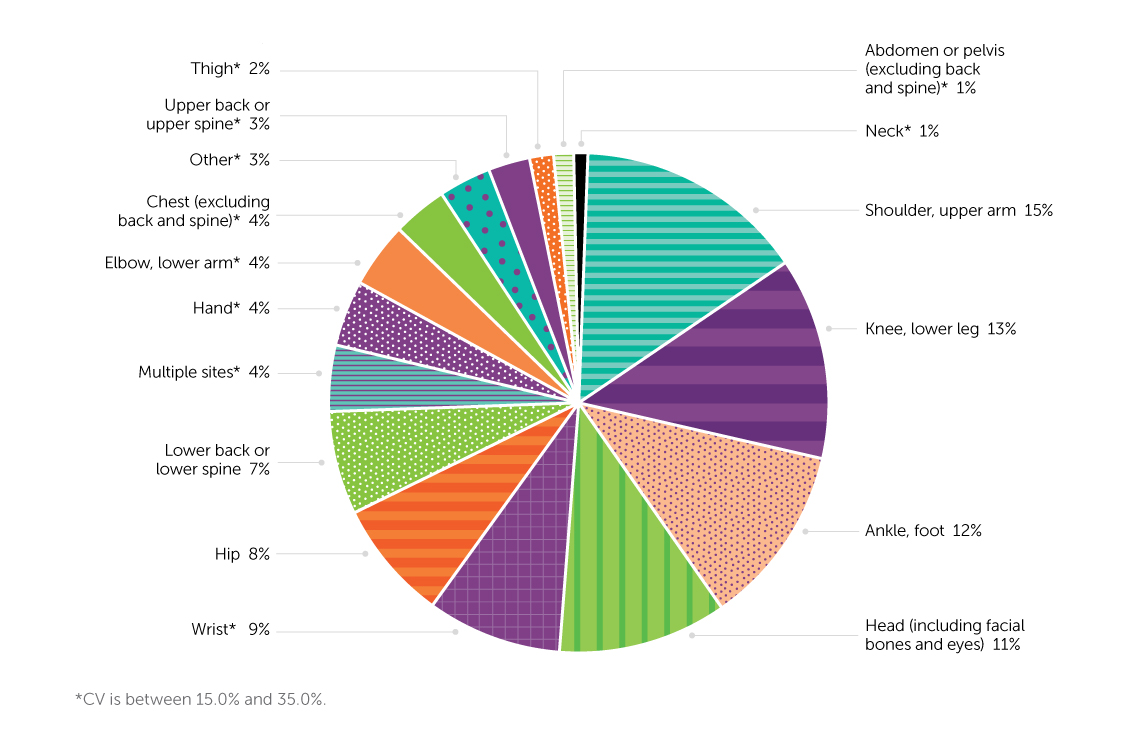
The parts of the body most frequently injured in falls were shoulders or upper arms (15%), knee or lower legs (13%), ankles or feet (12%), and the head (11%). Relatively few (4%) older adults reported injuries to multiple body parts (Figure 7).
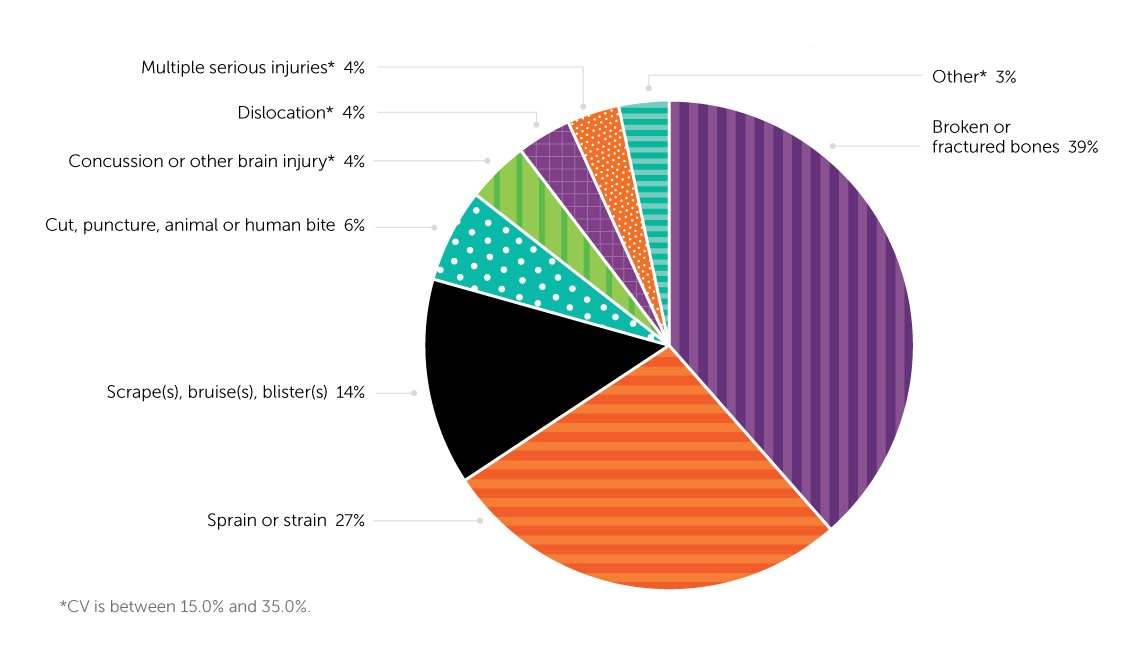
Fractures were the most common fall-related injuries (39%), followed by sprains or strains (27%), and scrapes, bruises or blisters (14%) (Figure 8).
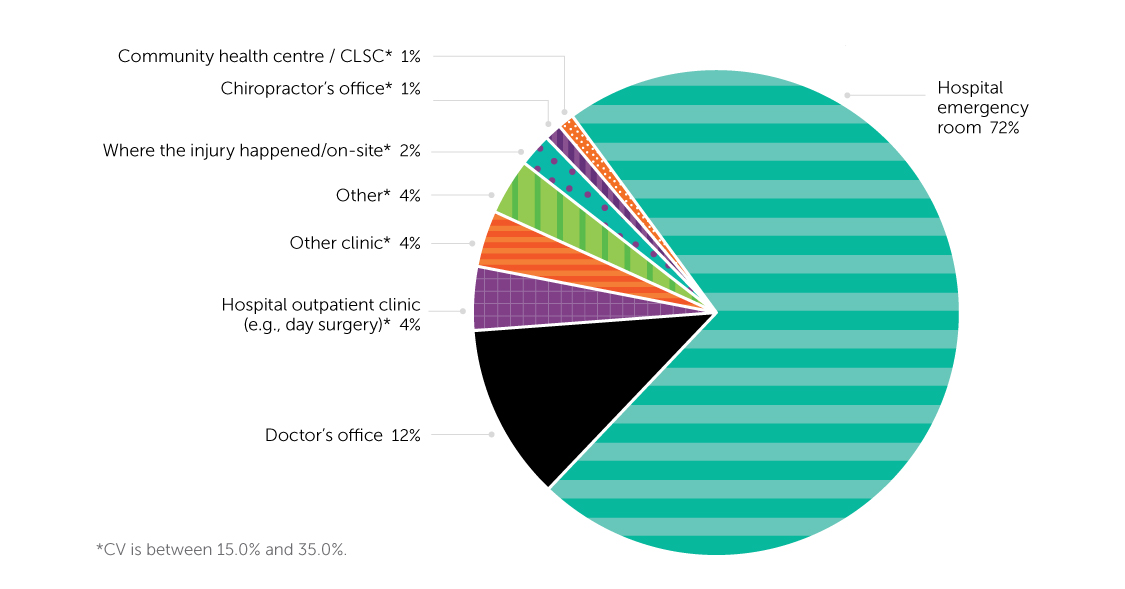
About a third (30.2%) of older adults who reported a fall-related injury did not receive medical attention from a health professional in the 48 hours post-injury. For those who sought medical treatment, a hospital emergency department (ED) was the most frequent setting (72%), followed by a doctor’s office (12%) (Figure 9).
2.1.3 Summary
In 2017-2018, 5.8% of Canadians aged 65 or older living in a household residence (around 350,000 individuals) reported that they had experienced a fall-related injury in the previous 12 months. The prevalence of fall-related injuries was higher among women than men, and higher among those aged 80 or older than among 65- to 79-year-olds. Sixty-one percent of older adults who sustained a fall-related injury reported that they had been walking when they fell. Fractures accounted for 39% of fall-related injuries. The body parts most commonly injured were the shoulder/upper arm (15%) and knee/lower leg (13%). Seventy percent of older adults injured in a fall sought medical attention; 72% of this group were treated in a hospital ED.
2.2 What hospitalization data tell us about older adults’ falls
This section presents hospitalization data for the 2008/2009-to-2019/2020 period from the Discharge Abstract Database (DAD). The analysis examines
fall-related hospitalization (FRH) counts and rates, length of hospital stay (LOS), injury type, place where the fall occurred, and differences by age group and sex for people aged 65 or older.
2.2.1 Data and definitions
The DAD captures administrative, clinical, and demographic information on hospital discharges (deaths, sign-outs, and transfers) in all provinces and
territories except Quebec.(13) Patients’ diagnosis information is coded according to ICD-10-CA, an enhanced version of ICD-10, developed for morbidity classification in Canada.(18) ICD-10 is the International Statistical Classification of Diseases and Related Health Problems, 10th Revision, developed by the WHO for morbidity and mortality statistics.(19)
In the following analysis, a FRH is defined as a hospitalization in an acute care hospital that involved an unintentional fall as indicated by the presence of selected ICD-10-CA codes among the diagnosis codes (maximum of 25) on the discharge record. The codes used to identify unintentional falls were ICD-10-CA codes W00–W19.(20) Appendix Table 2 lists the criteria for identifying a FRH and an injury hospitalization.
The analysis was based on episodes of care in which all discharges, including transfers related to a given injury, were counted as a single case.(6,21) Appendix Table 3 lists the criteria for identifying a transfer. Episode of care provides a more comprehensive view of the extent of acute care involved in treating FRHs.(22) This report applied the same linkage method as the Seniors’ Falls in Canada Second Report, merging DAD discharge records with an exact match on: 1) encrypted health card number; 2) health card issuing province; and 3) year of birth.(6,21)
Age-standardized rates were calculated using the 2011 Canadian population as the standard. The Seniors’ Falls in Canada Second Report was standardized to the 2009 Canadian population.
LOS in acute care and in alternate level of care are presented, rather than total LOS (acute care and alternate level of care combined) as in the Seniors’ Falls in Canada Second Report. Alternate level of care refers to patients who occupy a hospital bed but do not require the intensity of services provided in that setting.23) LOS in acute care reflects the resource intensity required in hospitals. LOS in alternate level is for assisting patients to return to a household or to move to another level of care (for example, long-term care facility or specialized rehabilitation).(24)
FRHs are a good estimate of falls that result in serious injury, but they do not provide information about less severe fall-related injuries treated in EDs or physicians’ offices, or about falls for which medical treatment was not sought.
2.2.2 Findings
From 2008/2009 to 2019/2020, the annual number of FRHs of people aged 65 or older rose from 49,152 to 72,392, a 47% increase (Figure 10). Despite this absolute numerical increase, the crude and age-standardized FHR rates remained relatively constant over the period, at roughly 15 per 1,000 people. Therefore, the increased number of FRHs appears to be due to aging of the Canadian population.
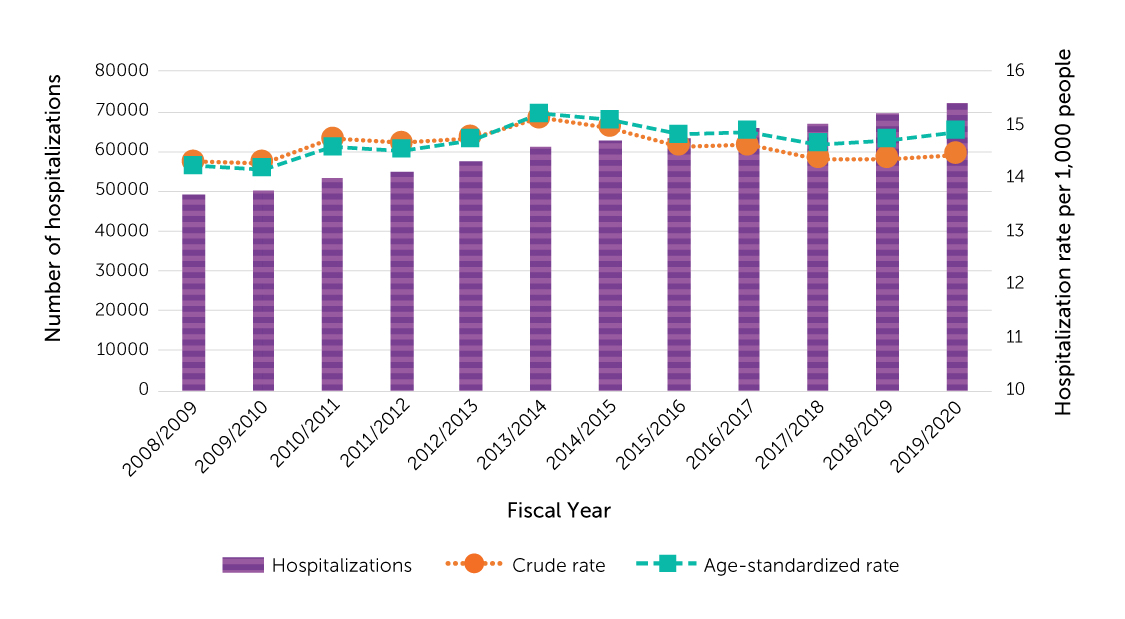
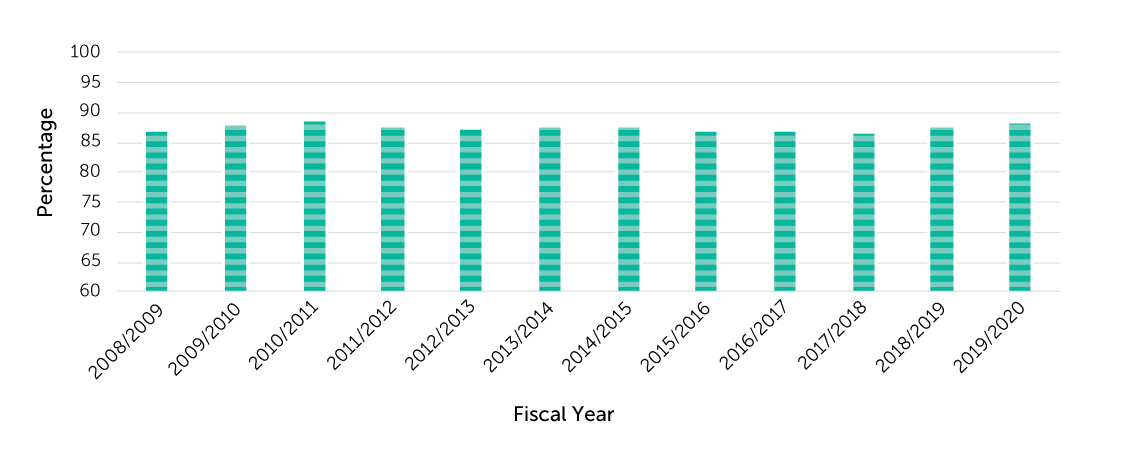
Figure 11 shows FRHs as a percentage of all injury-related hospitalizations of people aged 65 or older. From 2008/2009 to 2019/2020, percentages were relatively stable at 87%.
In 2019/2020, FRH rates were higher at successively older ages, but women’s rates consistently exceeded those of men (Figure 12).

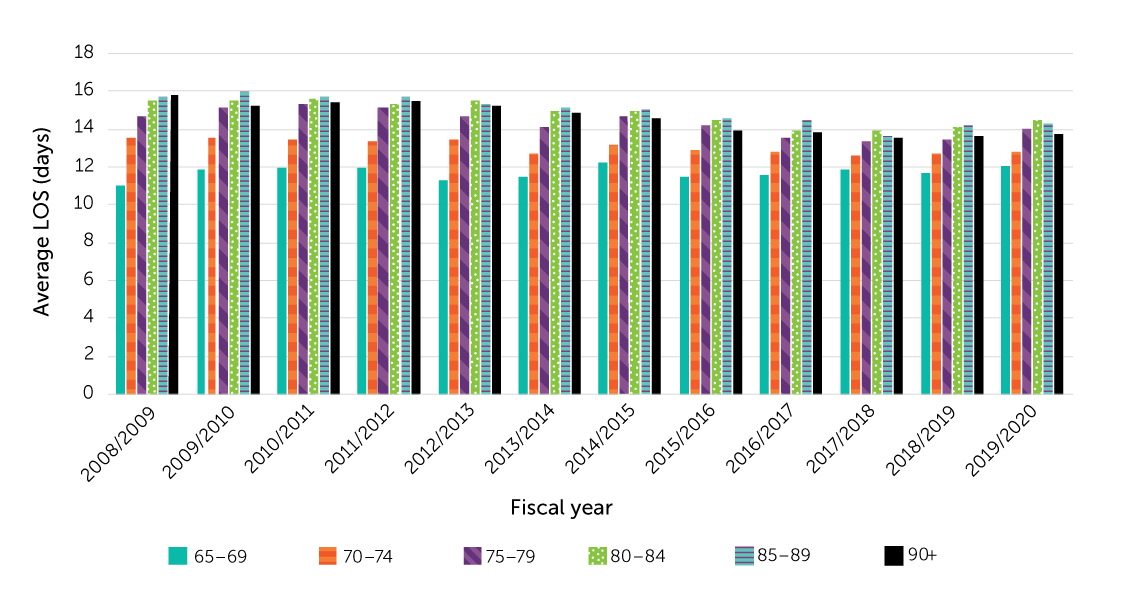
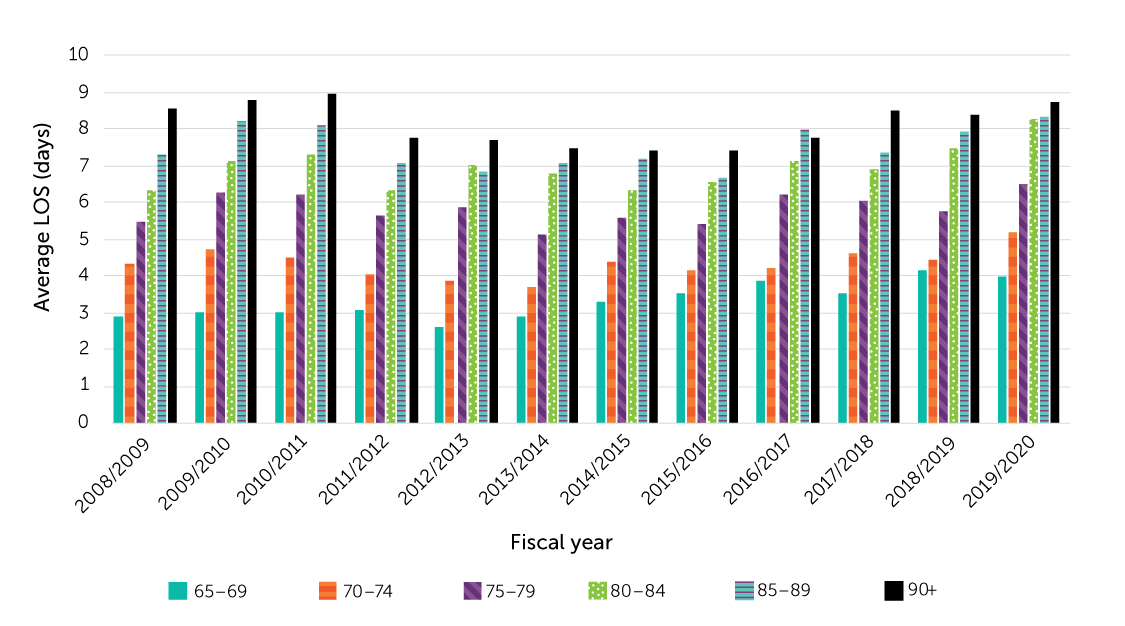
Figures 13-1 and 13-2 show the average LOS in acute care and in alternate level of care for FRHs, by age group, from 2008/2009 to 2019/2020. People aged 85 to 89 had the longest average acute care stays (13.7 to 16.0 days) for most years; averages were longest for 80- to 84-year-olds in 2012/2013, 2017/2018 and 2019/2020. Throughout the period (except 2008/2009), average LOS in acute care for FRHs was shorter among people aged 90 or older than among people in their eighties. It is unlikely that those aged 90 or older recovered faster than 80- to 89-year-olds. Future work will investigate the anomaly.
The average LOS in alternate level of care for FRHs was longest among people aged 90 or older (7.4 to 9.0 days) in all years except 2016/2017.
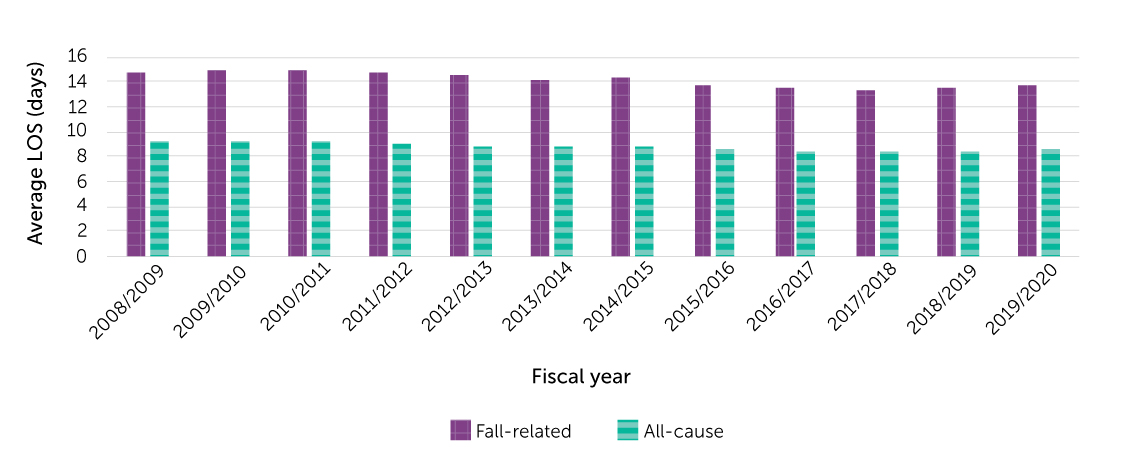
Figures 14-1 and 14-2 compare average LOS in acute care and in alternate level of care for FRHs with averages for all-cause hospitalizations from 2008/2009 to 2019/2020. The average stay in acute care for FRHs was about 5 days longer than the average for all-cause hospitalizations; the average stay in alternate level of care for FRHs was about 4 days longer. During the twelve-year period, for both fall-related and all cause hospitalizations, average LOS in acute care declined slightly.
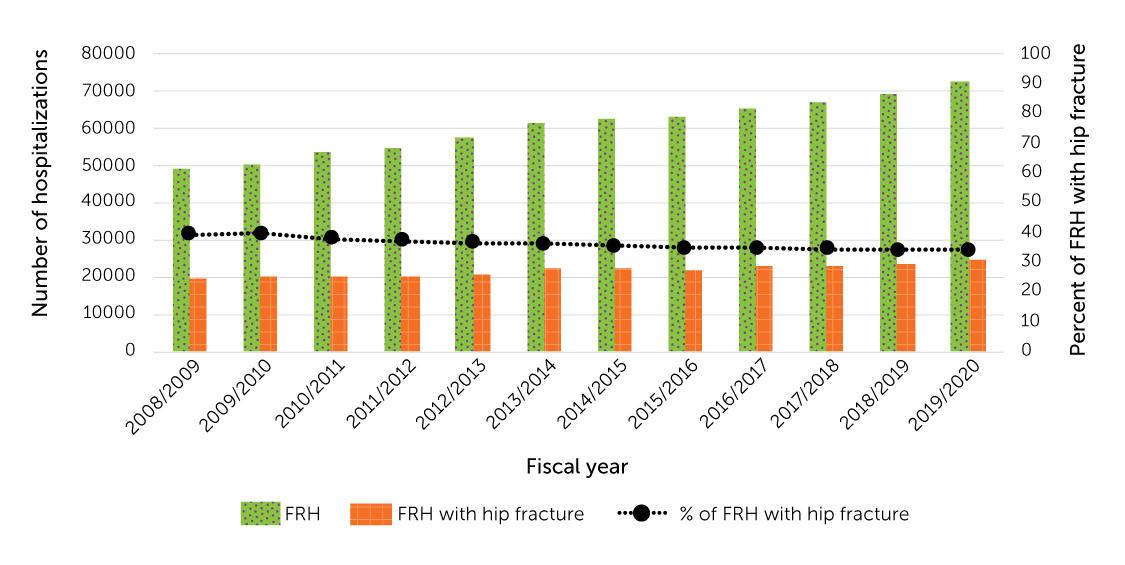
In 2008/2009, 40% of FRHs among older adults involved a hip fracture; by 2019/20, the percentage had decreased to 34% (Figure 15). Even so, the numbers rose during the period; in 2019/2020, more than 24,000 older adults were hospitalized with fall-related hip fractures.
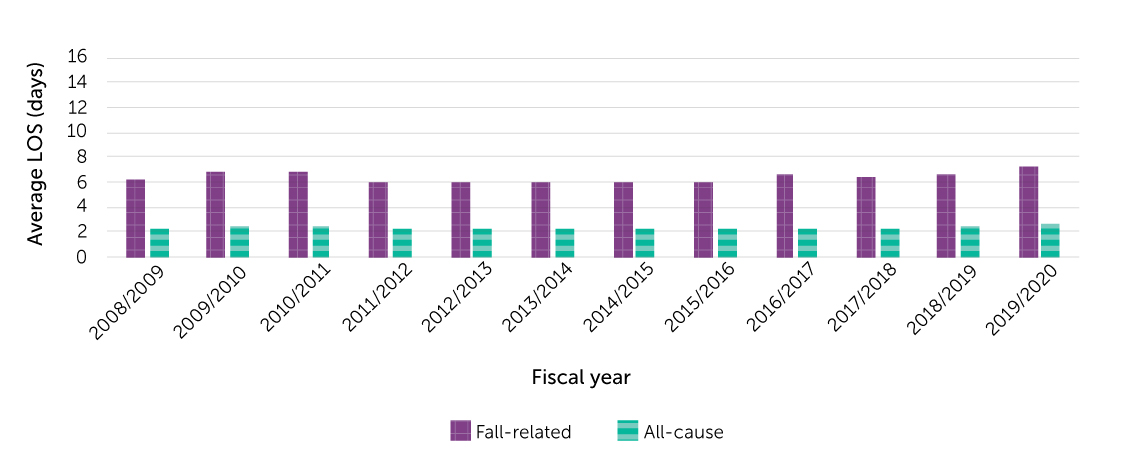
Figures 16-1 and 16-2 compare average LOS in acute care and in alternate level of care between FRHs with hip fracture and those without hip fracture from 2008/2009 to 2019/2020. The average stay in acute care for FRHs with hip fracture was about 2 to 3 days longer than the average for those without hip fracture; the average stay in alternate level of care for FRHs with hip fracture was 0.2 to 0.9 days longer. During the twelve-year period, for both FRHs with and without hip fracture, average LOS in acute care decreased slightly.
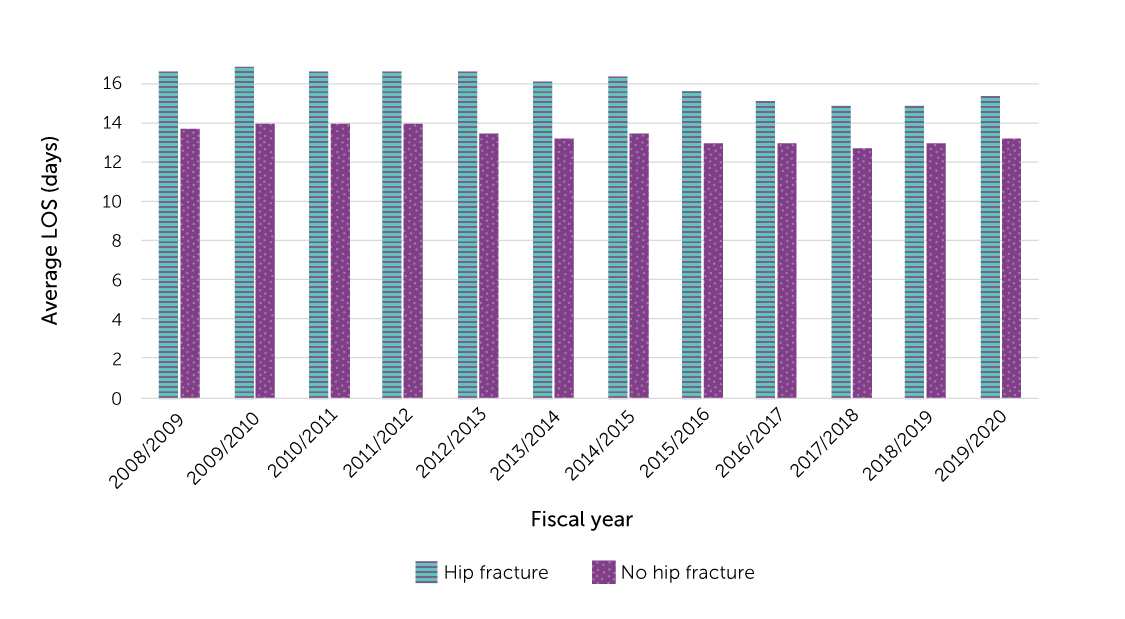
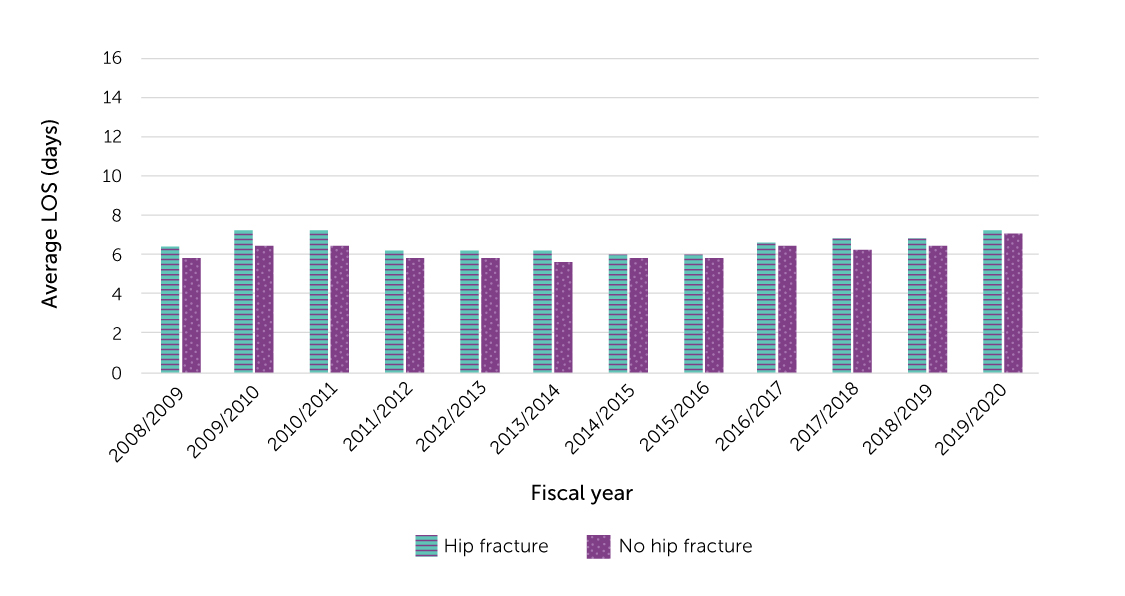
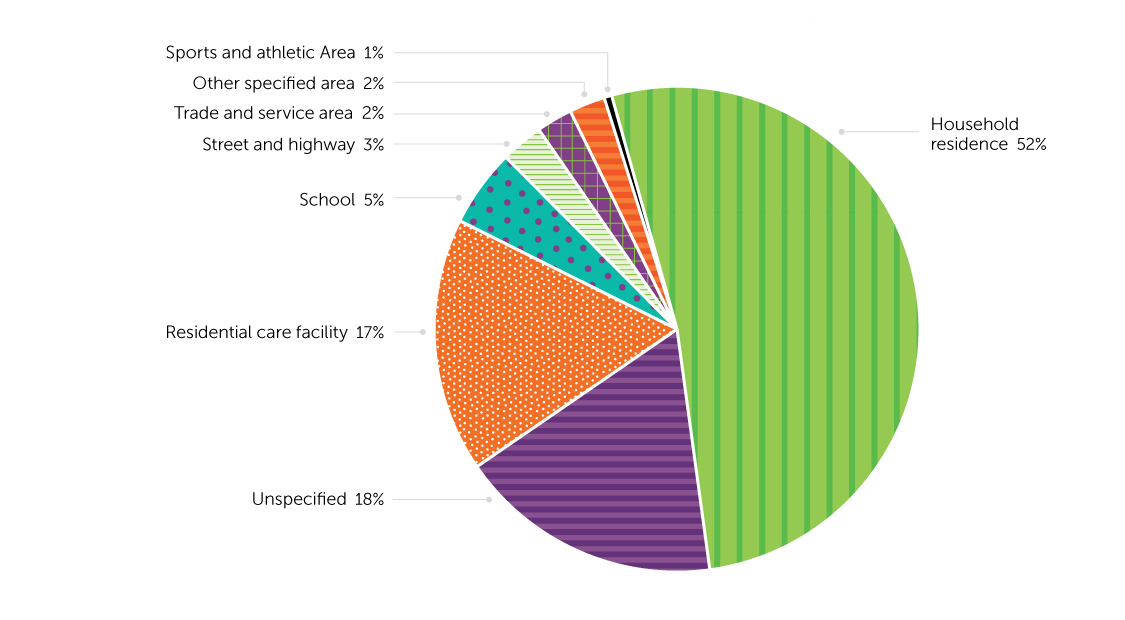
Figure 17 shows where the falls that resulted in FRHs during the 2015/2016-to- 2019/2020 period occurred. About half (52%) occurred were in a household residence, and 17% were in a residential care facility. These are likely underestimates, as place was not specified for 18% of FRHs.
2.2.3 Summary
Crude and age-standardized rates of FRHs among older adults were stable during the 2008/2009-to-2019/2020 period (roughly 15 per 1,000 people), but the annual number rose by 47%. Rates increased with advancing age, and women’s rates exceeded men’s. Average LOS in acute care and in alternate level of care for FRHs was longer than average stays for all-cause hospitalizations (an additional 5.2 and 4.1 days, respectively). Average LOS for FRHs tended to rise with age. From 2008/2009 to 2019/2020, the number of FRHs involving hip fracture increased, but the percentage of FRHs with a hip decreased from 40% to 34%. The average LOS for FRHs involving hip fracture was about 3 days longer than the average for FRHs without hip fracture.
During the 2015/2016-to-2019/2020 period, just over half of hospitalized falls occurred in a household residence.
2.3 What hospitalization data tell us about falls among older adults in residential care
Based on DAD information, it is possible to determine if patients hospitalized because of a fall-related injury lived in residential care facilities. This section compares the number of fall-related hospitalizations (FRHs), length of stay (LOS), and injury type among older adults in residential care facilities with those for older adults in household residence over the 2008/2009-to-2019/2020 period.
2.3.1 Data and definitions
The description of the data source in section 2.2.1 applies to this analysis, further narrowed by selection for residential care. Residential care, also known as long-term care or nursing home, covers a range of living options for people with support needs, primarily older adults.
Patients were identified as being in residential care if the “place of occurrence” of the fall was “Residential Institution.” The assumption for this analysis is that such patients lived in the institution, as opposed to being visitors or employees who fell while on-site. It was also assumed that if “Residential Institution” was not designated as the place where the fall occurred, the patients lived in a household residence. And if the fall occurred in a location such as a street, store or theatre, the patients were assumed to live in a household residence.
The limitations outlined in section 2.2.1 apply to the following results. As well, the definition of residential care is based on assumptions that may not valid for all cases. Because the population number in residential care facilities versus household residence could not be clearly identified, crude and standardized rates could not be calculated.
2.3.2 Findings
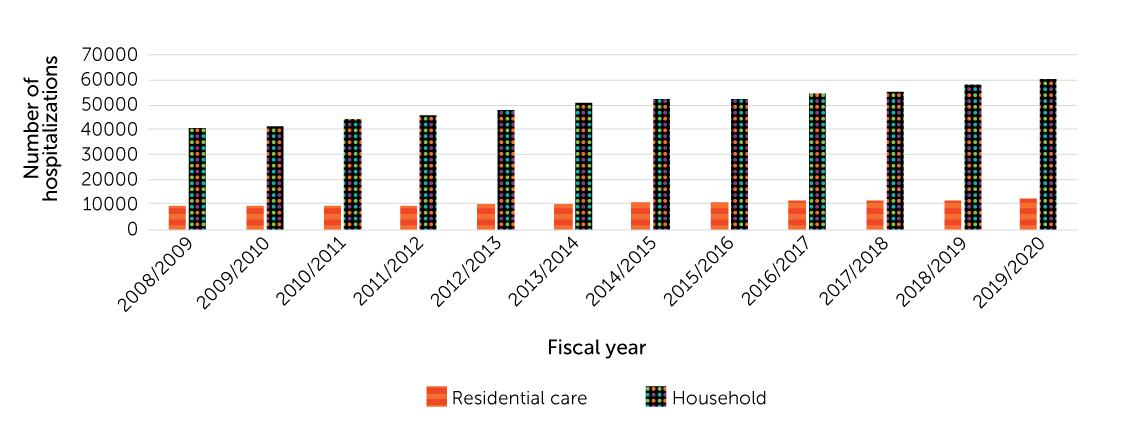
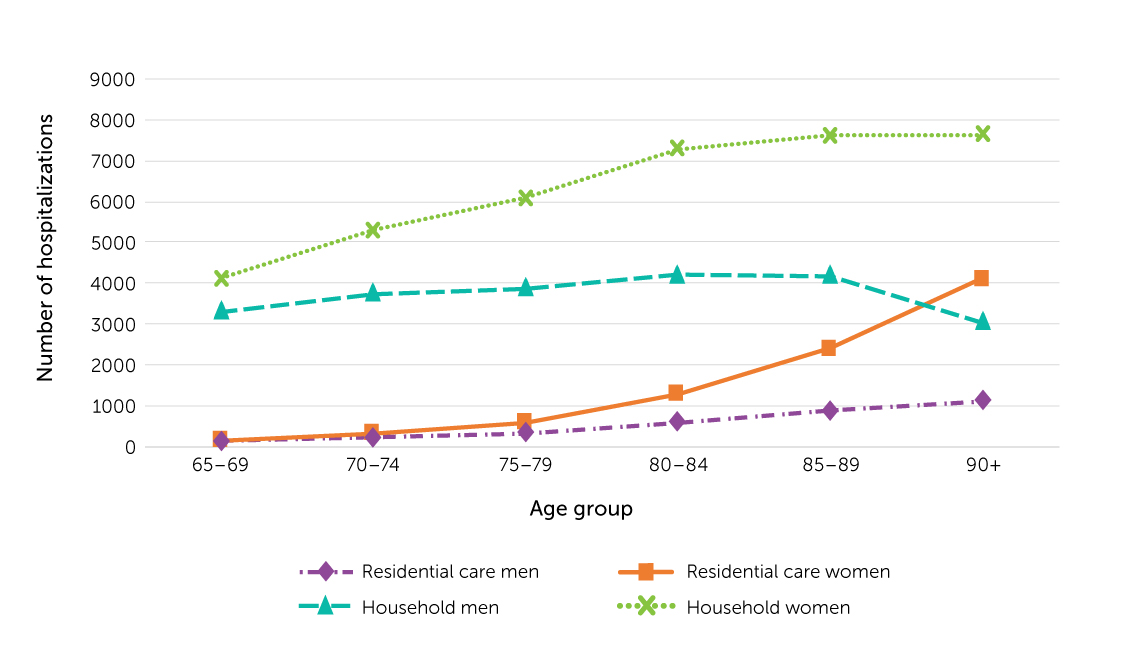
In 2008/2009, there had been 8,900 FRHs among older adults in residential care facilities and 40,252 among those in household residence; in 2019/2020, the figures were 12,081 (36% increase) and 60,311 (50% increase), respectively (Figure 18).
For older adults, regardless of whether they lived in residential care facilities or household residence, the number of FRHs generally rose with age (Figure 19). However, among men in household residence in 2019/2020, the number of FRHs at age 90 or older was lower than the number at ages 85 to 89. The age and sex structure of the population in household residence may influence these findings.
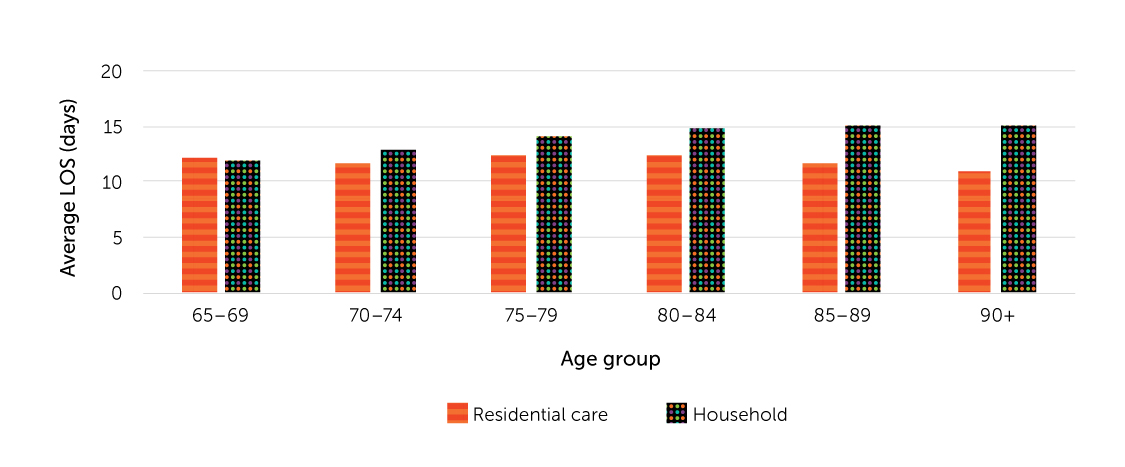
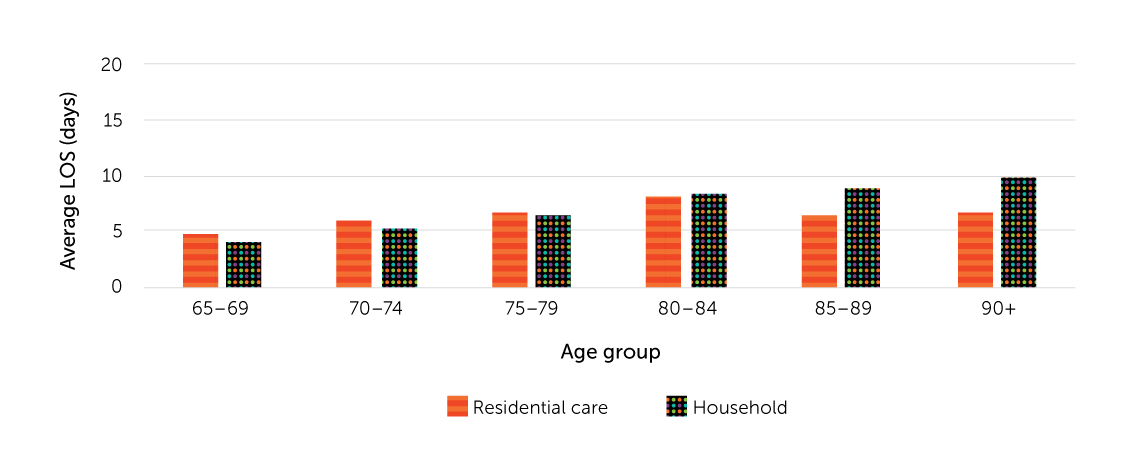
Figures 20-1 and 20-2 show that, in 2019/2020, the average LOS in acute care for FRHs was shorter among older adults in residential care facilities than among those living in household residence, regardless of age. The average LOS in alternate level for FRHs was longer among 65- to 79-year-olds in residential care facilities than among those in household residence.
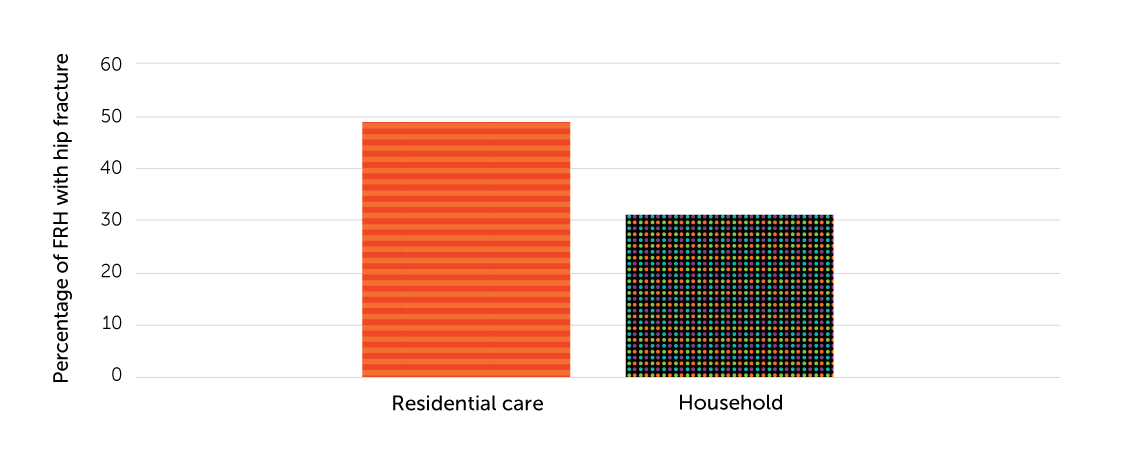
In 2019/2020, 49% of FRHs among older adults in residential care facilities involved hip fractures, compared with 31% of FRHs among those living in household residence (Figure 21).
2.3.3 Summary
Between 2008/2009 and 2019/2020, the annual number of FRHs among older adults living in residential care facilities increased by 36% to 12,081. The number of FRHs rose at successively older ages, and there were more FRHs among women than men. The average LOS in acute care for FRH for older adults in residential care facilities was shorter than for those living in household residence. FRHs among older adults in residential care facilities were more likely to involve hip fractures (49%) than were such hospitalizations among older adults living in household residence (31%).
2.4 What emergency department data tell us about older adults’ falls
The information about emergency department (ED) visits by people aged 65 or older is from the National Ambulatory Care Reporting System (NACRS). This section presents fall-related ED visit counts and rates, and differences by age group and sex, for the 2010/2011-to-2019/2020 period.
2.4.1 Data and definitions
The NACRS contains data on all hospital-based and community-based ambulatory care: day surgery, outpatient and community clinics, and EDs.
The results are based on pooled data from Ontario and Alberta, the only two provinces with complete case capture starting in 2010/2011. Consequently, the findings cannot be generalized to Canada overall.(25) The NACRS uses ICD-10-CA (described in section 2.2.1) to code diagnosis information.
Fall-related ED visits were identified by any one of 10 diagnoses containing an unintentional fall code (W00–W19).(20) Appendix Table 2 lists the criteria. The results are based on episodes of care in which ED visits involving transfers are counted as a single case. The linkage method is the same as for hospitalizations, but the definition of transfers differs slightly (Appendix Table 3).
ED visit data do not include falls for which medical treatment was not sought, falls treated in physicians’ offices, or falls that received emergency medical service assistance, but did not result in ED visits.
2.4.2 Findings
From 2010/2011 to 2019/2020, the annual number of fall-related ED visits by people aged 65 or older in Ontario and Alberta (combined) increased 47% from 129,825 to 189,679 (Figure 22). The crude rate of fall-related ED visits rose from 57.8 to 60.7 per 1,000 population; the trend of age-standardized rate was similar. A slight decline in counts, crude rates, and age-standardized rates between 2018/2019 and 2019/2020 may reflect public health measures (such as lockdowns) adopted in spring 2020 to contain COVID-19.
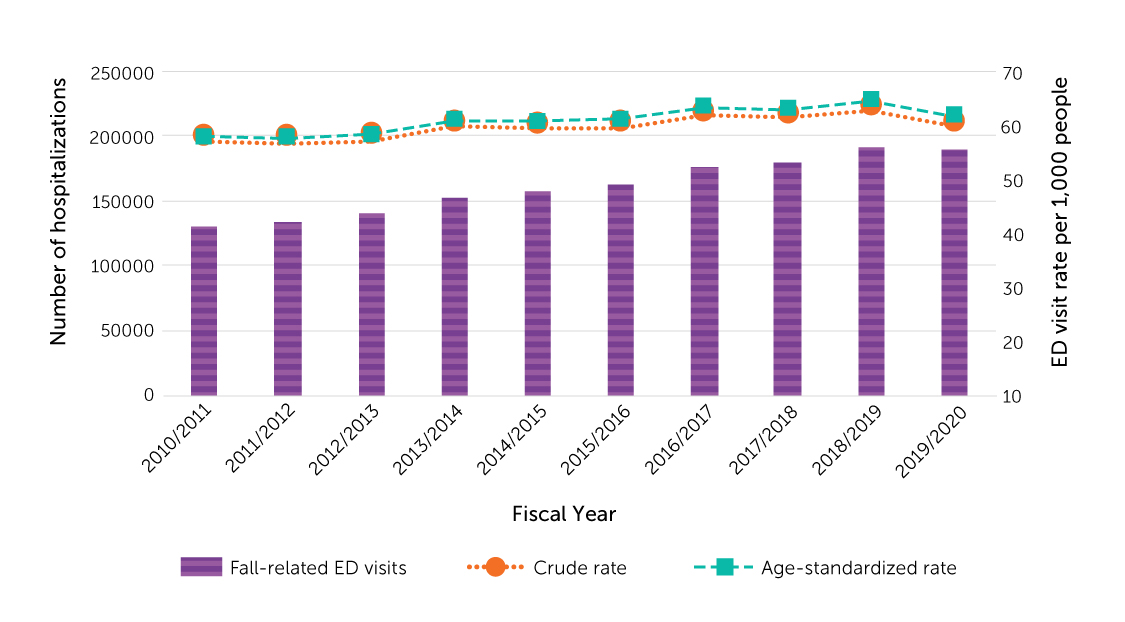
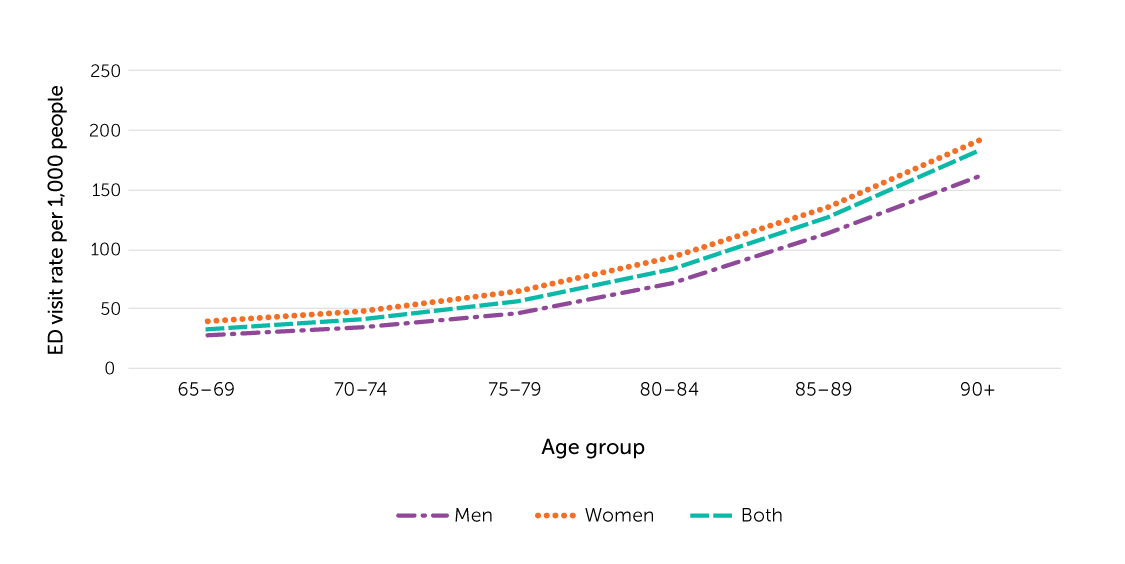
In 2019/2020, rates of fall-related ED visits rose with age among both sexes, but women’s rates consistently exceeded men’s (Figure 23). The rates at age 90 or older were 162.9 per 1,000 for men and 192.7 for women (183.3 per 1,000 for both sexes combined).
2.4.3 Summary
Between 2010/2011 and 2019/2020, the number of fall-related ED visits among older adults in Ontario and Alberta (combined) rose by 47%. The crude and age-standardized rates of fall-related ED visits increased from 58 to 64 per 1,000 population. The fall-related ED visit rate rose at successively older ages, reaching 183.3 per 1,000 among people aged 90 or older in 2019/2020. Women had higher fall-related ED visit rates than men.
2.5 What mortality data tell us about deaths due to falls among older adults
This section contains data from the Canadian Vital Statistics Database–Death Database (CVSD) on deaths due to falls among people aged 65 or older. Mortality counts and rates, differences by age group and sex, and trends from 2001 to 2019 are presented.
2.5.1 Data and definitions
“Cause of death” in the CVSD is the underlying cause—the disease or external cause of injury that initiated the sequence of events leading directly to death, or the circumstances of the incident or violence that produced the fatal injury.
Starting in 2000, the CVSD coded cause of death by ICD-10. In the following analysis, deaths due to falls were identified by ICD-10 codes W00–W19. (26) Only falls that initiated the chain of events leading to death were considered to be the cause. If a fall contributed to death but was not the initiating factor, it was not identified as the cause. For this reason, these findings underestimate the impact of falls on the deaths of older adults.
2.5.2 Findings
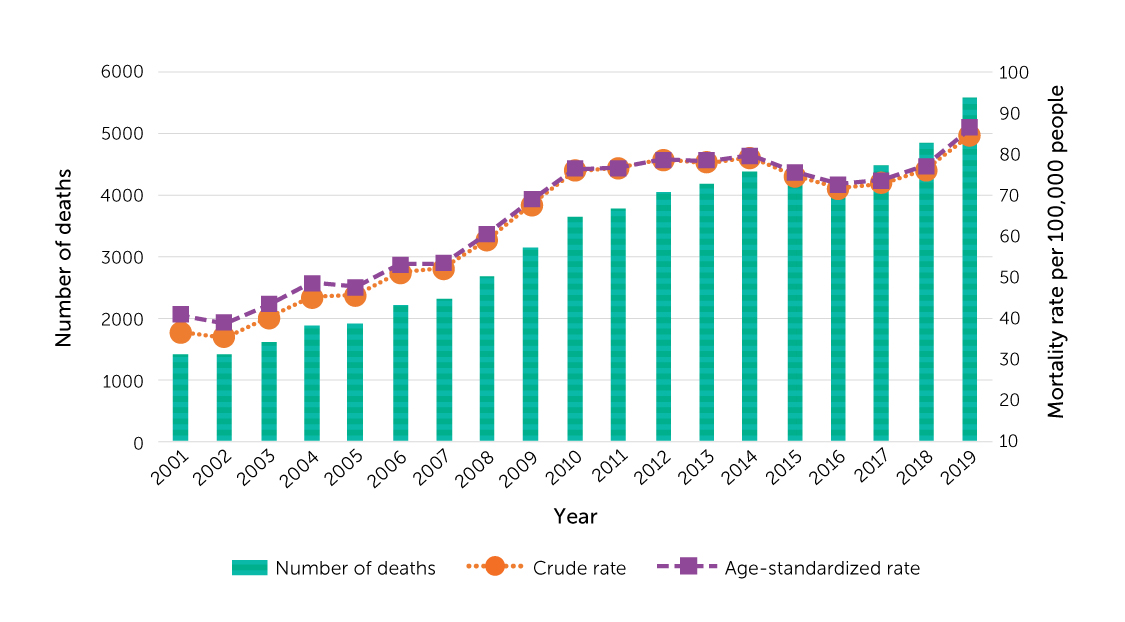
From 2001 to 2019, the annual number of deaths and crude and age-standardized mortality rates due to falls increased among people aged 65 or older (Figure 24). In 2019, 5,581 older adults died because of a fall. During the 2001-to-2019 period, the age-standardized fall mortality rate rose from 41.0 to 86.4 per 100,000, a 111% increase.
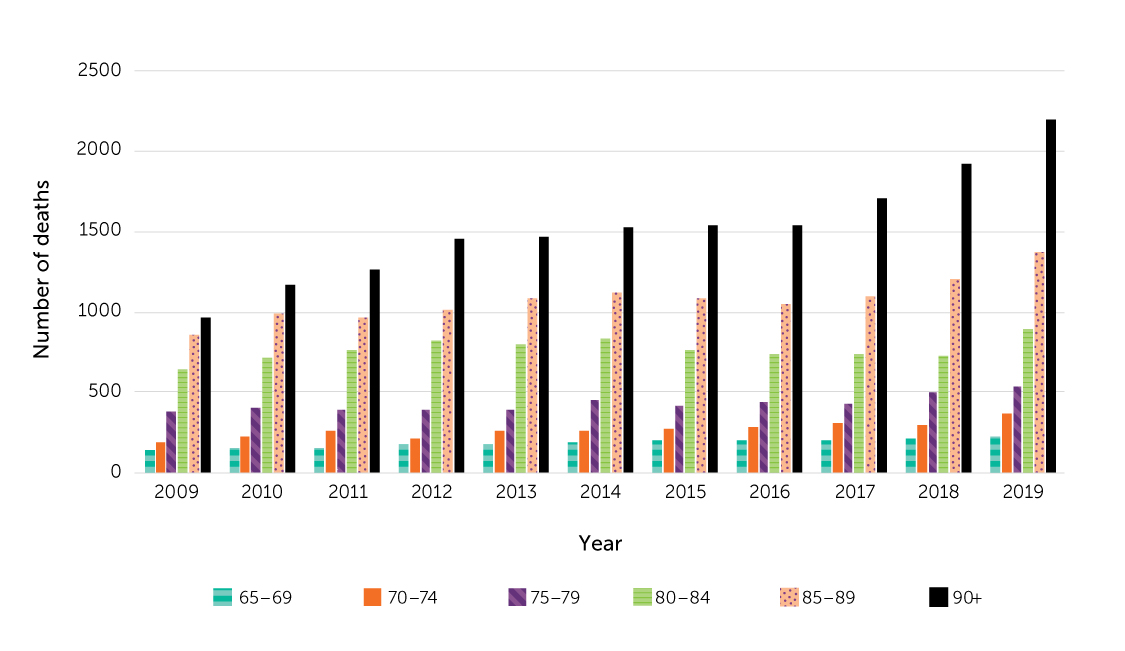
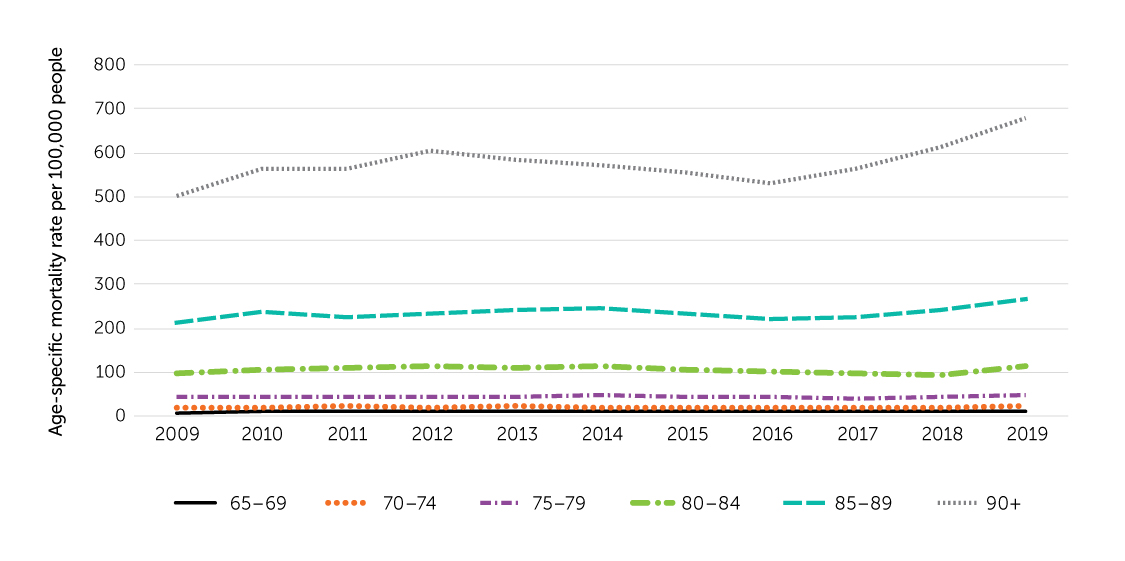
The number of deaths and age-specific mortality rates due to falls rose with advancing age (Figure 25 and Figure 26). In 2019, almost two-thirds of fall- related deaths among older adults occurred at age 85 and older. The mortality rate among those aged 90 or older (678.4 per 100,000) was 2.5 times higher than among 85- to 89-year-olds (267.4 per 100,000) and 65 times higher than among 65- to 69-year-olds (10.4 per 100,000).
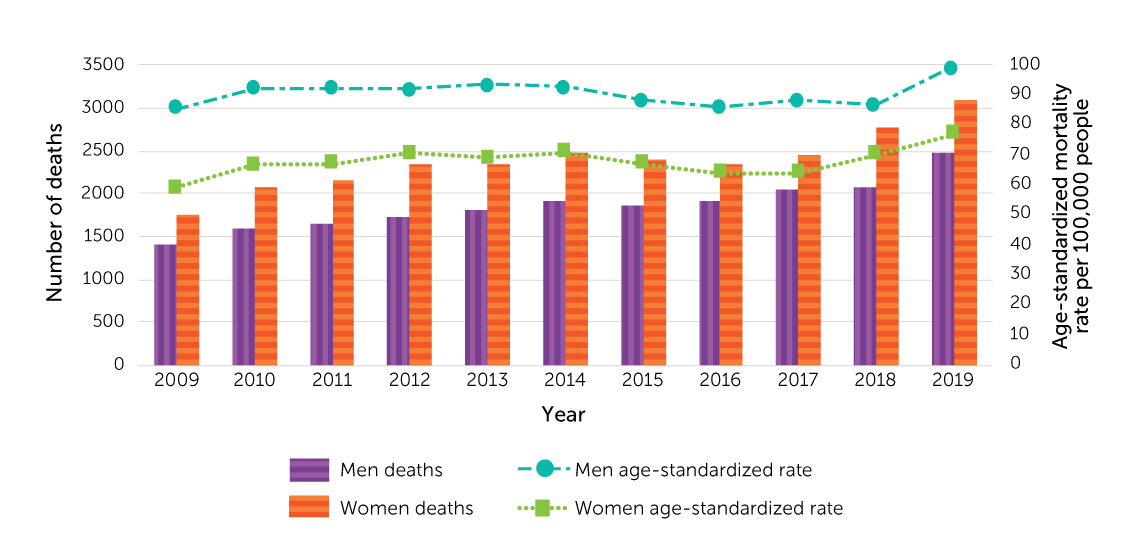
The annual number of deaths due to falls increased among both men and women between 2009 and 2019 (Figure 27). In each year, more women than men died from falls, but men had higher age-standardized fall mortality rates (99.4 versus 77.2 deaths per 100,000 in 2019). The higher rate among men reflects the age and sex structure of the older population, with women making up a growing share of the population at successively older ages.
2.5.3 Summary
From 2001 to 2019, the annual number of deaths due to falls and fall mortality rates (crude and age-standardized) among people aged 65 or older increased. The number of fall-related deaths and age-specific mortality rates were higher at successively older ages, with a pronounced increase after age 90. Each year, more women than men died because of falls, but age-standardized fall mortality rates were higher among men.
2.6 Summary and Conclusions
In 2017-2018, 5.8% of Canadians aged 65 or older living in a household residence reported that they had been injured in a fall during the past 12 months. The prevalence of fall-related injuries was higher among women than men, and higher among those aged 80 or older than 65- to 79-year-olds. The majority (61%) of those who sustained a fall-related injury fell while walking. Thirty-nine percent of injuries from falls were fractures. Seventy percent of older adults who suffered a fall-related injury sought medical attention, most frequently, in a hospital emergency department (ED).
From 2008/2009 to 2019/2020, crude and age-standardized rates of fall-related hospitalizations (FRH) among older adults were relatively stable, at about 15 per 1,000 people, but the annual number rose 47%. FRH rates increased with age, and women’s rates exceeded men’s rates. The average length of stay for FRHs was 4 or 5 days longer than for all-cause hospitalizations. In 2019/2020, 34% of FRHs involved a hip fracture. FRHs involving hip fracture were about 3 days longer than the average LOS for FHRs without hip fracture.
The annual number of FRHs among older adults living in residential care facilities increased 36% between 2008/2009 and 2019/2020. FRHs among older adults in residential care facilities were more likely to involve a hip fracture than were FRHs among those living in household residence (49% versus 31%).
For Ontario and Alberta combined, crude and age-standardized rates of fall-related ED visits among older adults increased between 2010/2011 and 2019/2020 from 58 to 64 per 1,000 population. The fall-related ED visit rate rose with age, and women had higher rates than men.
From 2001 to 2019, crude and age-standardized fall mortality rates increased by 111% among people aged 65 or older. The mortality rate rose at successively older ages, particularly after age 90. Although more women than men died because of falls each year, age-standardized fall mortality rates were higher among men.
Falls among older adults continue to be a serious public health issue in Canada. The data in this report indicate which older adults are disproportionately affected by falls. This information provides guideposts for prioritizing prevention efforts, such as targeting women, those aged 80 or older, and older people who live alone or have low income. The data also provide information about when and where falls occur. Most commonly, falls happen in household residence and while walking. Multi-faceted prevention strategies that address risks will be important in reducing the prevalence of fall-related injuries and deaths in Canada’s aging population.
Evidence-based interventions to prevent falls and fall-related injuries among older adults have been extensively studied and reported.(2,6) Preventing a fall can avoid substantial costs for the health care system, and pain and suffering for individuals and families. A comprehensive approach that changes environments through policy and standards and raises awareness among decision-makers and older adults themselves have shown to be most effective in achieving long-lasting change.
Appendix
| No injury or the most serious injury is not from fallFootnote a | The most serious injury is from fall | |||||||||
|---|---|---|---|---|---|---|---|---|---|---|
| Sample size | Population estimate | Column percent (%)Footnote eFootnote f | 95% C.I. | Sample size | Population estimate | Column percent (%)Footnote eFootnote f | 95% C.I. | |||
| lower | upper | lower | upper | |||||||
| Sex | ||||||||||
| Men | 12638 | 2649836 | 46.7 | 46.5 | 46.9 | 640 | 139143 | 39.8 | 36.1 | 43.5 |
| Women | 15624 | 3022144 | 53.3 | 53.1 | 53.5 | 1112 | 210478 | 60.2 | 56.5 | 63.9 |
| Age | ||||||||||
| 65-69 | 9548 | 1972200 | 34.8 | 33.8 | 35.8 | 514 | 115546 | 33 | 29.5 | 36.6 |
| 70-74 | 7341 | 1528318 | 26.9 | 26.1 | 27.8 | 405 | 73241 | 20.9 | 18.2 | 23.7 |
| 75-79 | 5047 | 1015573 | 17.9 | 17.2 | 18.6 | 305 | 57786 | 16.5 | 13.9 | 19.2 |
| 80-84 | 3392 | 630053 | 11.1 | 10.5 | 11.7 | 251 | 47087 | 13.5 | 10.6 | 16.3 |
| 85+ | 2934 | 525835 | 9.3 | 8.7 | 9.8 | 277 | 55961 | 16 | 13 | 19 |
| Living arrangement | ||||||||||
| Live alone | 12136 | 1569167 | 27.7 | 26.6 | 28.7 | 842 | 109727 | 31.4 | 28.3 | 34.5 |
| Live with others | 16126 | 4102813 | 72.3 | 71.3 | 73.4 | 910 | 239893 | 68.6 | 65.5 | 71.7 |
| Education attainmentFootnote g | ||||||||||
| Less than secondary school graduation | 7582 | 1350254 | 23.8 | 23 | 24.6 | 448 | 83717 | 23.9 | 20.3 | 27.6 |
| Secondary school graduation, no post-secondary education | 6238 | 1269585 | 22.4 | 21.6 | 23.2 | 367 | 75303 | 21.5 | 18.5 | 24.6 |
| Post-secondary certificate diploma or university degree | 13906 | 2898848 | 51.1 | 50.2 | 52 | 896 | 180546 | 51.6 | 47.8 | 55.5 |
| Not stated | 536 | 153292 | 2.7 | 2.4 | 3.1 | 41 | 10054 | 2.9 Footnote e | 1.5 | 4.3 |
| Annual household income Footnote h | ||||||||||
| Zero or less to 19,999 | 2794 | 402359 | 7.1 | 6.6 | 7.6 | 219 | 35177 | 10.1 | 7.5 | 12.7 |
| 20,000 to 39,999 | 8415 | 1458213 | 25.7 | 24.9 | 26.5 | 561 | 87144 | 24.9 | 22.1 | 27.8 |
| 40,000 to 79,999 | 10260 | 2070441 | 36.5 | 35.6 | 37.4 | 609 | 126770 | 36.3 | 32.6 | 40 |
| 80,000 to 149,999 | 5124 | 1236887 | 21.8 | 21 | 22.6 | 277 | 71806 | 20.5 | 17.4 | 23.6 |
| 150,000 or more | 1669 | 504080 | 8.9 | 8.2 | 9.6 | 86 | 28724 | 8.2 | 5.9 | 10.6 |
Footnotes
|
||||||||||
| Category | Case definition |
|---|---|
| Fall-related hospitalization | The following two
diagnosis codes co-exist:
|
| Injury hospitalization | Unquestionable (diagnosis prefix not in "Q") and significant (diagnosis type in "M" "1" "2" "6" "W" "X" "Y") ICD-10-CA code: S00–S99, T00–T79, T90–T98 |
| Fall-related emergency department visit | ICD-10-CA code: W00-W19 |
| Category | Definition |
|---|---|
| Hospitalization | Either one of the conditions meets:
|
| Emergency department visit | A transfer to/from an acute facility was indicated |
References
(1) James SL, Lucchesi LR, Bisignano C, et al. The global burden of falls: global, regional and national estimates of morbidity and mortality from the Global Burden of Disease Study 2017. Inj Prev 2020 Oct;26(Supp 1):i3–i11.
(2) World Health Organization. Step safely: strategies for preventing and managing falls across the life-course. Geneva: World Health Organization; 2021.
(3) World Health Organization. WHO Global Report on Falls Prevention in Older Age. Geneva: World Health Organization; 2007.
(4) Do MT, Chang VC, Kuran N, Thompson W. Fall-related injuries among Canadian seniors, 2005–2013: an analysis of the Canadian Community Health Survey. Health Promot Chronic Dis Prev Can 2015;35(7):99–108.
(5) Parachute. The Cost of Injury in Canada. Toronto (ON): Parachute; 2021 [cited 8 November 2021]. Available from: https://parachute.ca/en/professional-resource/cost-of-injury-in-canada/.
(6) Public Health Agency of Canada. Seniors' Falls in Canada: Second Report. Ottawa (ON):
Public Health Agency of Canada; 2014 [cited 8 November 2021]. Available at: www.canada.ca/ en/public-health/services/health-promotion/aging-seniors/publications/publications- general-public/seniors-falls-canada-second-report.html.
(7) Yao X, Skinner R, McFaull S, Thompson W. At-a-glance – Injury hospitalizations in Canada 2018/19. Health Promot Chronic Dis Prev Can 2020;40(9):281–7.
(8) Craig J, Murray A, Mitchell S, Clark S, Saunders L, Burleigh L. The high cost to health and social care of managing falls in older adults living in the community in Scotland. Scott Med J 2013;58(4):198–203.
(9) Hartholt KA, Polinder S, Van der Cammen, Tischa JM, Panneman MJ, Van der Velde N, Van Lieshout EM, et al. Costs of falls in an ageing population: a nationwide study from the Netherlands (2007–2009). Injury 2012;43(7):1199–1203.
(10) Public Health Agency of Canada. Aging and chronic diseases: A profile of Canadian seniors. Ottawa (ON): Public Health Agency of Canada; 2020.
(11) Statistics Canada. A portrait of the population aged 85 and older in 2016 in Canada. Ottawa (ON): Statistics Canada; 2017 [cited 8 November 2021]. Available from: www12.statcan.gc.ca/census- recensement/2016/as-sa/98-200-x/2016004/98-200-x2016004-eng.cfm.
(12) Statistics Canada. Canadian Community Health Survey: Combined data, 2017 and 2018. Ottawa (ON): Statistics Canada; 2019 [cited 8 November 2021]. Available from:www150.statcan.gc.ca/ n1/daily-quotidien/191022/dq191022d-eng.htm.
(13) Canadian Institute for Health Information. Discharge Abstract Database metadata (DAD). Ottawa (ON): Canadian Institute for Health Information [cited 8 November 2021]. Available from: www.cihi.ca/en/discharge-abstract-database-metadata.
(14) Canadian Institute for Health Information. National Ambulatory Care Reporting System metadata (NACRS). Ottawa (ON): Canadian Institute for Health Information [cited 8 November 2021]. Available from: www.cihi.ca/en/national-ambulatory-care-reporting-system-metadata.
(15) Statistics Canada. Statistics Canada, Canadian Vital Statistics - Death database (CVSD). Ottawa (ON): Statistics Canada [cited 8 November 2021]. Available from:www23.statcan.gc.ca/imdb/p2SV. pl?Function=getSurvey&SDDS=3233.
(16) Statistics Canada. Canadian Community Health Survey - Annual Component (CCHS): Detailed information for 2017. Ottawa (ON): Statistics Canada [cited 8 November 2021]. Available from: www23.statcan.gc.ca/imdb/p2SV.pl?Function=getSurvey&Id=329241
(17) Statistics Canada. Canadian Community Health Survey - Annual Component (CCHS): Detailed information for 2018. Ottawa (ON): Statistics Canada [cited 8 November 2021]. Available from: www23.statcan.gc.ca/imdb/p2SV.pl?Function=getSurvey&Id=795204
(18) Canadian Institute for Health Information. Codes and Classifications. Ottawa (ON): Canadian Institute for Health Information [cited 8 November 2021]. Available from: www.cihi.ca/en/ submit-data-and-view-standards/codes-and-classifications.
(19) World Health Organization. International Statistical Classification of Diseases and Related Health Problems (ICD). Geneva: World Health Organization [cited 8 November 2021]. Available from: www.who.int/standards/classifications/classification-of-diseases.
(20) Association of Public Health Epidemiologists in Ontario. Recommended ICD-10-CA Codes for Injury Indicators. Association of Public Health Epidemiologists in Ontario [cited 8 November 2021]. Available from: https://core.apheo.ca/index.php?pid=306.
(21) Canadian Institute for Health Information. Analysis in Brief: Falls Among Seniors—Atlantic Canada. Ottawa (ON): Canadian Institute for Health Information; 2010 [cited 8 November 2021]. Available from: https://secure.cihi.ca/free_products/falls_among_seniors_atlantic_canada_aib_en.pdf.
(22) Vicky Scott, Lori Wagar, Sarah Elliot. A Public Health Approach to Fall Prevention Among Older Persons in Canada. Clin Geriatr Med 2010; 26: 705–718.
(23) Canadian Institute for Health Information. Guidelines to Support ALC Designation. Ottawa (ON): Canadian Institute for Health Information [cited 8 November 2021]. Available from: www.cihi.ca/ en/guidelines-to-support-alc-designation.
(24) Canadian Institute for Health Information. Definitions and Guidelines to Support ALC Designation in Acute Inpatient Care. Ottawa (ON): Canadian Institute for Health Information [cited 8 November 2021]. Available from: www.cihi.ca/sites/default/files/document/ acuteinpatientalc-definitionsandguidelines_en.pdf.
(25) Canadian Institute for Health Information. CIHI: NACRS Coverage 2002-2003 to 2020-2021. (An internal document at the Public Health Agency of Canada from Canadian Institute for Health Information) [cited 8 November 2021].
(26) World Health Organization. ICD-10 Version:2019. Geneva: World Health Organization [cited 8 November 2021]. Available from: https://icd.who.int/browse10/2019/en.
Page details
- Date modified: