
Summary Report on Antimicrobial Resistant Organism (ARO) Surveillance Data from January 1, 2012 to December 31, 2016
Download the alternative format
(PDF format, 2.4 MB, 30 pages)
Organization: Public Health Agency of Canada
Published: 2018-07-27
Table of Contents
Introduction
This report entitled Canadian Nosocomial Infection Surveillance Program (CNISP): Summary Report on ARO Surveillance Data from January 1, 2012 to December 31, 2016, was produced by the Centre for Communicable Diseases and Infection Control of the Public Health Agency of Canada (PHAC). The report provides a review of available ARO data in the healthcare setting in Canada.
The Centre for Communicable Diseases and Infection Control (CCDIC) coordinates the data collection and is responsible for the data management, analysis and report production related to this summary report. CCDIC supports the use of these data to inform public health and policy action. In addition, PHAC is committed to improving data quality, as well as defining and setting surveillance standards.
PHAC collects national data on various healthcare-associated infections, including AROs through the Canadian Nosocomial Infection Surveillance Program (CNISP), a collaborative effort of CCDIC, the National Microbiology Laboratory (NML) and sentinel hospitals across Canada who participate as members of the Canadian Hospital Epidemiology Committee (CHEC), a subcommittee of the Association of Medical Microbiology and Infectious Disease (AMMI) Canada. Their ongoing contributions to national ARO surveillance are gratefully acknowledged.
As of December 2016, CNISP conducted surveillance in 65 acute-care hospitals in Canada (Appendix A). Of these, 12 are large acute, tertiary care hospitals with more than 500 beds available within the facility; 34 hospitals are of intermediate size (201 to 500 beds), while the remaining 19 hospitals are smaller facilities with less than 200 beds. Acute tertiary care hospitals are major hospitals that offer a range of specialist services such as burn units, transplant units, trauma centres, specialized cardiac surgery etc. to which patients are referred from smaller hospitals. General urban acute-care hospitals provide overall medical and surgical services but do not always have specialised sub-specialities. There are 34 adult-only hospitals, 23 hospitals which treat both adult and children, and the remaining 8 hospitals are stand-alone pediatric facilities (Appendix A). Surveillance of AROs at participating hospitals is considered to be within the mandate of hospital infection prevention and control programs and does not constitute human research. The ability for a hospital to participate in CNISP ARO surveillance is based on the site capacity for data collection, access to hospital laboratory services and their operational capacity to participate in a given year. Therefore, the variation in the number of reporting hospitals each year reflects the changes in the number of participating hospitals, which has generally increased over time.
CNISP surveillance provides key information that informs the development of federal, provincial, territorial and local infection prevention and control programs and policies. When carried out in a uniform manner, surveillance provides a measure of the burden of illness, establishes benchmark rates for internal and external comparison, identifies potential risk factors, and allows assessment of specific interventions. Surveillance for AROs is considered an important component of the quality of patient care.
This report provides case counts and rates based on data from January 1, 2012 to December 31, 2016. All rates presented in this report represent infections and/or colonizations identified in patients admitted (inpatients) to CNISP hospitals. The report includes rates for Clostridium difficile infection (CDI) including healthcare- and community associated CDI, methicillin-resistant Staphylococcus aureus (MRSA) including healthcare- and community-associated MRSA and MRSA bacteremias, vancomycin-resistant Enterococci (VRE), carbapenemase-producing Enterobacteriaceae(CPE) and carbapenemase-producing Acinetobacter (CPA).
Where possible, rates are provided by region and include Western (British Columbia, Alberta, Saskatchewan and Manitoba), Central (Ontario and Quebec), and Eastern Regions (Nova Scotia, New Brunswick, Prince Edward Island and Newfoundland and Labrador). The territories do not currently submit data to PHAC.
National and regional infection rates are based on the total number of cases reported divided by the total number of patient admissions (multiplied by 1,000) or patient days (multiplied by 10,000). This report also provides strain type and antimicrobial resistance data for CDI, MRSA, VRE, CPE and CPA.
The 2016 case definitions and eligibility criteria for these surveillance programs are provided in Appendix B. Case definitions and eligibility criteria are reviewed each year prior to the start of the surveillance year by the CNISP working group responsible for overseeing each ARO surveillance activity. CNISP working groups are comprised of members of CHEC and PHAC technical experts from CCDIC and NML. Case definitions and eligibility criteria may vary from one surveillance year to another as the surveillance protocols are reviewed and updated by the applicable CNISP working group.
This report supersedes the data in previous ARO reports. The most current report should be considered the most accurate. Data from 2016 are considered preliminary. Surveillance data are dynamic and results are subject to change as more updated data are made available by the participating hospitals. Data from previous ARO and Canadian Antimicrobial Resistance Surveillance System (CARSS) reports may vary slightly based on criteria used to analyze and report the data, but the overall reported trends remain similar. Note that for all years, only hospitals that submitted both numerator and denominator data are included in the rate calculations.
For questions or more information on these rates or for a copy of the most recent PHAC surveillance report, please contact the Centre for Communicable Diseases and Infection Control, Public Health Agency of Canada by sending an email to phac.ccdic-clmti.aspc@canada.ca.
Results
1. Clostridium difficile Infection (CDI)
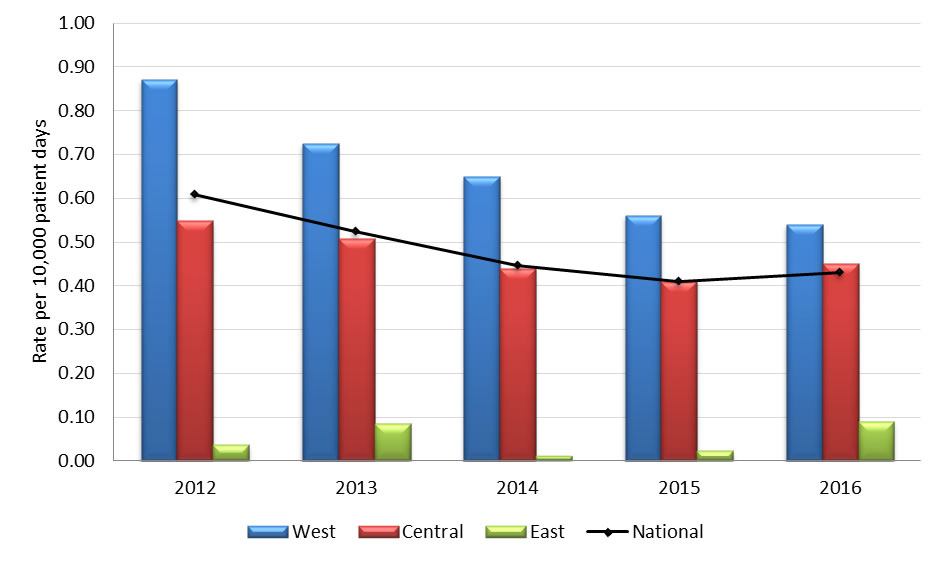
1a. Healthcare-associated Clostridium difficile Infection (HA-CDI)
| Years | 2012 | 2013 | 2014 | 2015 | 2016 |
|---|---|---|---|---|---|
| National | |||||
| No. of HA-CDI cases | 3,482 | 3,160 | 2,870 | 2,930 | 2,814 |
| Rate per 1,000 pt admissions | 4.80 | 3.99 | 3.43 | 3.34 | 3.13 |
| Rate per 10,000 pt days | 6.03 | 5.19 | 4.39 | 4.33 | 4.05 |
| No. of reporting hospitals | 54 | 54 | 60 | 62 | 63 |
| West | |||||
| No. of HA-CDI cases | 1,282 | 1,198 | 1,121 | 1,318 | 1,254 |
| Rate per 1,000 pt admissions | 4.76 | 3.61 | 3.10 | 3.35 | 3.10 |
| Rate per 10,000 pt days | 5.70 | 4.82 | 4.10 | 4.41 | 4.05 |
| Central | |||||
| No. of HA-CDI cases | 1,997 | 1,732 | 1,510 | 1,356 | 1,290 |
| Rate per 1,000 pt admissions | 5.31 | 4.56 | 3.90 | 3.43 | 3.22 |
| Rate per 10,000 pt days | 7.14 | 6.08 | 5.13 | 4.62 | 4.35 |
| East | |||||
| No. of HA-CDI cases | 203 | 230 | 243 | 256 | 270 |
| Rate per 1,000 pt admissions | 2.55 | 2.86 | 2.75 | 2.91 | 2.90 |
| Rate per 10,000 pt days | 2.80 | 3.07 | 2.81 | 3.06 | 3.07 |
|
|||||
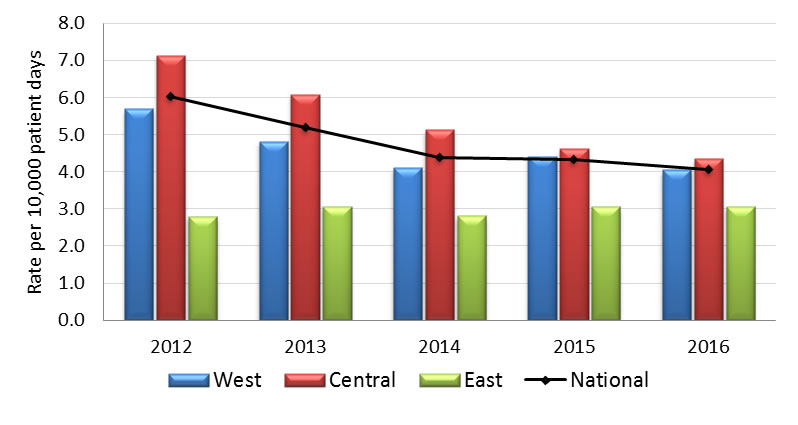
Graph 1.1 - Text Equivalent
| Year | Region | Rate |
|---|---|---|
| 2012 | West | 5.70 |
| Central | 7.14 | |
| East | 2.80 | |
| National | 6.03 | |
| 2013 | West | 4.82 |
| Central | 6.08 | |
| East | 3.07 | |
| National | 5.19 | |
| 2014 | West | 4.10 |
| Central | 5.13 | |
| East | 2.81 | |
| National | 4.39 | |
| 2015 | West | 4.41 |
| Central | 4.62 | |
| East | 3.06 | |
| National | 4.33 | |
| 2016 | West | 4.05 |
| Central | 4.35 | |
| East | 3.07 | |
| National | 4.05 |
1 b. Community-associated Clostridium difficile Infection (CA-CDI)
| Years | 2012 | 2013 | 2014 | 2015 | 2016 |
|---|---|---|---|---|---|
| National | |||||
| No. of HA-CDI cases | * | * | * | 1,036 | 937 |
| Rate per 1,000 pt admissions | * | * | * | 1.56 | 1.35 |
| Rate per 10,000 pt days | * | * | * | 2.03 | 1.76 |
| No. of reporting hospitals | * | * | * | 49 | 50 |
| West | |||||
| No. of HA-CDI cases | * | * | * | 254 | 238 |
| Rate per 1,000 pt admissions | * | * | * | 1.15 | 1.05 |
| Rate per 10,000 pt days | * | * | * | 1.55 | 1.41 |
| Central | |||||
| No. of HA-CDI cases | * | * | * | 676 | 598 |
| Rate per 1,000 pt admissions | * | * | * | 1.91 | 1.60 |
| Rate per 10,000 pt days | * | * | * | 2.57 | 2.17 |
| East | |||||
| No. of HA-CDI cases | * | * | * | 106 | 101 |
| Rate per 1,000 pt admissions | * | * | * | 1.20 | 1.10 |
| Rate per 10,000 pt days | * | * | * | 1.27 | 1.15 |
|
|||||
| Year | Number of deathsTable 1.3 Footnote * | Mortality rate (%) |
|---|---|---|
| 2012 | 24 | 4.6 |
| 2013 | 21 | 3.9 |
| 2014 | 22 | 4.3 |
| 2015 | 16 | 3.8 |
| 2016 | 12 | 3.0 |
|
||
| Strain Type | 2012 No. (%) |
2013 No. (%) |
2014 No. (%) |
2015 No. (%) |
2016 No. (%) |
|---|---|---|---|---|---|
| NAP1 | 164 (33.3) | 152 (29.6) | 114 (23.6) | 115 (22.9) | 53 (11.8) |
| NAP4 | 77 (15.7) | 90 (17.5) | 92 (19.1) | 106 (21.1) | 91 (20.1) |
| NAP11 | 40 (8.1) | 33 (6.4) | 62 (12.9) | 50 (9.9) | 73 (16.2) |
| Other NAP typesFootnote * | 91 (18.5) | 91 (17.8) | 84 (17.4) | 94 (18.7) | 72 (16.0) |
| Other-not assigned | 120 (24.4) | 147 (28.7) | 130 (27.0) | 138 (27.4) | 162 (35.9) |
|
|||||
| Antibiotics | 2012 No. (%) |
2013 No. (%) |
2014 No. (%) |
2015 No. (%) |
2016 No. (%) |
|---|---|---|---|---|---|
| Clindamycin | 80 (16.3) | 156 (30.5) | 209 (43.4) | 125 (24.9) | 99 (22.0) |
| Moxifloxacin | 192 (39.0) | 166 (32.4) | 137 (28.4) | 138 (27.4) | 72 (16.0) |
| Rifampin | 4 (0.8) | 13 (2.5) | 5 (1.0) | 10 (2.0) | 7 (1.6) |
| Total isolates tested | 492 | 512 | 482 | 503 | 451 |
Note: All C. difficile strains from 2012 to 2016 submitted to NML were susceptible to metronidazole and tigecycline. Only one isolate had a reduced susceptibility to vancomycin (24 µg/ml) in 2012. |
|||||
2. Methicillin-Resistant Staphylococcus aureus (MRSA)
| Years | 2012 | 2013 | 2014 | 2015 | 2016 |
|---|---|---|---|---|---|
| National | |||||
| No. of MRSA cases | 1,787 | 1,847 | 1,969 | 2,049 | 2,241 |
| Rate per 1,000 pt admissions | 2.17 | 2.11 | 2.12 | 2.16 | 2.3 |
| Rate per 10,000 pt days | 2.80 | 2.83 | 2.89 | 2.93 | 3.11 |
| No. of reporting hospitalsFootnote a | 51 | 53 | 58 | 59 | 61 |
| West | |||||
| No. of MRSA cases | 844 | 898 | 949 | 1,117 | 1,272 |
| Rate per 1,000 pt admissions | 2.42 | 2.48 | 2.33 | 2.59 | 2.9 |
| Rate per 10,000 pt days | 3.30 | 3.40 | 3.29 | 3.55 | 3.91 |
| Central | |||||
| No. of MRSA cases | 703 | 737 | 801 | 732 | 784 |
| Rate per 1,000 pt admissions | 1.83 | 1.78 | 1.91 | 1.75 | 1.82 |
| Rate per 10,000 pt days | 2.35 | 2.47 | 2.68 | 2.47 | 2.60 |
| East | |||||
| No. of MRSA cases | 240 | 212 | 219 | 200 | 185 |
| Rate per 1,000 pt admissions | 2.63 | 2.15 | 2.19 | 2.03 | 1.77 |
| Rate per 10,000 pt days | 2.87 | 2.34 | 2.33 | 2.24 | 1.98 |
|
|||||
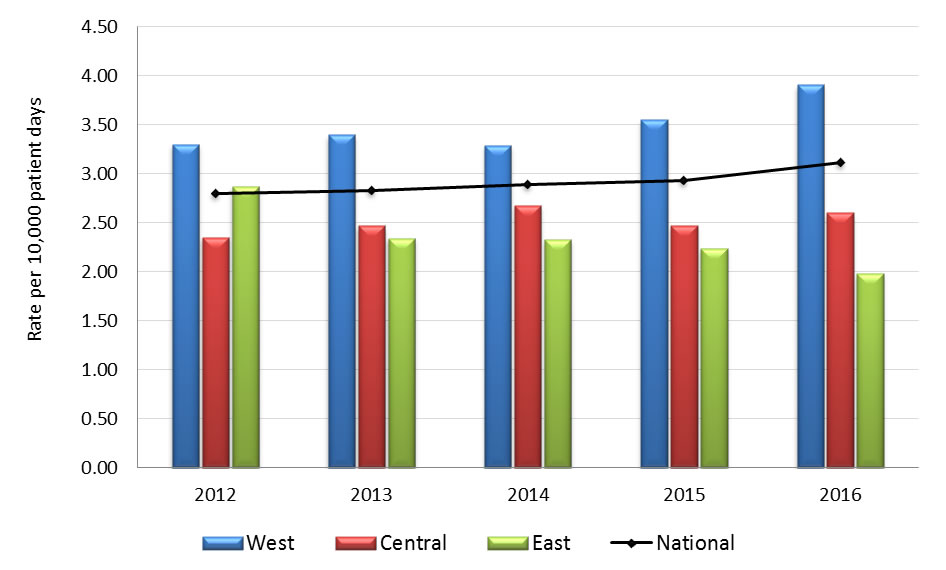
Graph 2.1 - Text description
| Year | Region | Rate |
|---|---|---|
| 2012 | West | 3.30 |
| Central | 2.35 | |
| East | 2.87 | |
| National | 2.80 | |
| 2013 | West | 3.40 |
| Central | 2.47 | |
| East | 2.34 | |
| National | 2.83 | |
| 2014 | West | 3.29 |
| Central | 2.68 | |
| East | 2.32 | |
| National | 2.89 | |
| 2015 | West | 3.55 |
| Central | 2.47 | |
| East | 2.24 | |
| National | 2.93 | |
| 2016 | West | 3.91 |
| Central | 2.60 | |
| East | 1.98 | |
| National | 3.11 |
- Graph 2.1 footnote *
-
Includes infections identified from blood AND clinical isolates as well as healthcare and community associated cases identified in admitted patients.
| Years | 2012 | 2013 | 2014 | 2015 | 2016 |
|---|---|---|---|---|---|
| National | |||||
| No. of HA-MRSA cases | 1,112 | 1,137 | 1,172 | 1,192 | 1,206 |
| Rate per 1,000 pt admissions | 1.35 | 1.30 | 1.26 | 1.26 | 1.24 |
| Rate per 10,000 pt days | 1.74 | 1.74 | 1.72 | 1.70 | 1.67 |
| No. of reporting hospitals | 51 | 53 | 58 | 59 | 61 |
| West | |||||
| No. of HA-MRSA cases | 517 | 554 | 535 | 630 | 676 |
| Rate per 1,000 pt admissions | 1.49 | 1.53 | 1.31 | 1.46 | 1.54 |
| Rate per 10,000 pt days | 2.02 | 2.10 | 1.86 | 2.00 | 2.08 |
| Central | |||||
| No. of HA-MRSA cases | 382 | 400 | 460 | 405 | 381 |
| Rate per 1,000 pt admissions | 0.99 | 0.97 | 1.09 | 0.97 | 0.89 |
| Rate per 10,000 pt days | 1.28 | 1.34 | 1.54 | 1.37 | 1.26 |
| East | |||||
| No. of HA-MRSA cases | 213 | 183 | 177 | 157 | 149 |
| Rate per 1,000 pt admissions | 2.33 | 1.85 | 1.77 | 1.59 | 1.43 |
| Rate per 10,000 pt days | 2.55 | 2.02 | 1.89 | 1.76 | 1.59 |
|
|||||
| Years | 2012 | 2013 | 2014 | 2015 | 2016 |
|---|---|---|---|---|---|
| National | |||||
| No. of HA-MRSA cases | 817 | 870 | 869 | 850 | 873 |
| Rate per 1,000 pt admissions | 0.99 | 1.00 | 0.94 | 0.90 | 0.90 |
| Rate per 10,000 pt days | 1.28 | 1.33 | 1.28 | 1.21 | 1.21 |
| No. of reporting hospitals | 51 | 53 | 58 | 59 | 61 |
| West | |||||
| No. of HA-MRSA cases | 377 | 423 | 387 | 455 | 486 |
| Rate per 1,000 pt admissions | 1.08 | 1.17 | 0.95 | 1.05 | 1.11 |
| Rate per 10,000 pt days | 1.47 | 1.60 | 1.34 | 1.44 | 1.49 |
| Central | |||||
| No. of HA-MRSA cases | 261 | 289 | 331 | 276 | 269 |
| Rate per 1,000 pt admissions | 0.68 | 0.70 | 0.79 | 0.66 | 0.63 |
| Rate per 10,000 pt days | 0.87 | 0.97 | 1.11 | 0.93 | 0.89 |
| East | |||||
| No. of HA-MRSA cases | 179 | 158 | 151 | 119 | 118 |
| Rate per 1,000 pt admissions | 1.96 | 1.60 | 1.51 | 1.21 | 1.13 |
| Rate per 10,000 pt days | 2.14 | 1.75 | 1.61 | 1.33 | 1.26 |
|
|||||
| Years | 2012 | 2013 | 2014 | 2015 | 2016 |
|---|---|---|---|---|---|
| National | |||||
| No. of CA-MRSA cases | 539 | 549 | 654 | 729 | 921 |
| Rate per 1,000 pt admissions | 0.65 | 0.63 | 0.70 | 0.77 | 0.95 |
| Rate per 10,000 pt days | 0.84 | 0.84 | 0.96 | 1.04 | 1.28 |
| No. of reporting hospitals | 51 | 53 | 58 | 59 | 61 |
| West | |||||
| No. of CA-MRSA cases | 309 | 321 | 380 | 449 | 569 |
| Rate per 1,000 pt admissions | 0.89 | 0.89 | 0.93 | 1.04 | 1.30 |
| Rate per 10,000 pt days | 1.21 | 1.21 | 1.32 | 1.43 | 1.75 |
| Central | |||||
| No. of CA-MRSA cases | 216 | 207 | 243 | 245 | 322 |
| Rate per 1,000 pt admissions | 0.56 | 0.50 | 0.58 | 0.59 | 0.75 |
| Rate per 10,000 pt days | 0.72 | 0.69 | 0.81 | 0.83 | 1.07 |
| East | |||||
| No. of CA-MRSA cases | 14 | 21 | 31 | 35 | 30 |
| Rate per 1,000 pt admissions | 0.15 | 0.21 | 0.31 | 0.35 | 0.29 |
| Rate per 10,000 pt days | 0.17 | 0.23 | 0.33 | 0.39 | 0.32 |
| Years | 2012 | 2013 | 2014 | 2015 | 2016 |
|---|---|---|---|---|---|
| National | |||||
| No. of MRSA BSI cases | 324 | 349 | 439 | 491 | 606 |
| Rate per 1,000 pt admissions | 0.39 | 0.40 | 0.47 | 0.52 | 0.62 |
| Rate per 10,000 pt days | 0.51 | 0.53 | 0.64 | 0.70 | 0.84 |
| No. of reporting hospitals | 51 | 53 | 58 | 59 | 61 |
| West | |||||
| No. of MRSA BSI cases | 115 | 128 | 161 | 215 | 279 |
| Rate per 1,000 pt admissions | 0.33 | 0.35 | 0.39 | 0.50 | 0.64 |
| Rate per 10,000 pt days | 0.45 | 0.48 | 0.56 | 0.68 | 0.86 |
| Central | |||||
| No. of MRSA BSI cases | 164 | 179 | 236 | 225 | 281 |
| Rate per 1,000 pt admissions | 0.43 | 0.43 | 0.56 | 0.54 | 0.65 |
| Rate per 10,000 pt days | 0.55 | 0.60 | 0.79 | 0.76 | 0.93 |
| East | |||||
| No. of MRSA BSI cases | 45 | 42 | 42 | 51 | 46 |
| Rate per 1,000 pt admissions | 0.49 | 0.43 | 0.42 | 0.52 | 0.44 |
| Rate per 10,000 pt days | 0.54 | 0.46 | 0.45 | 0.57 | 0.49 |
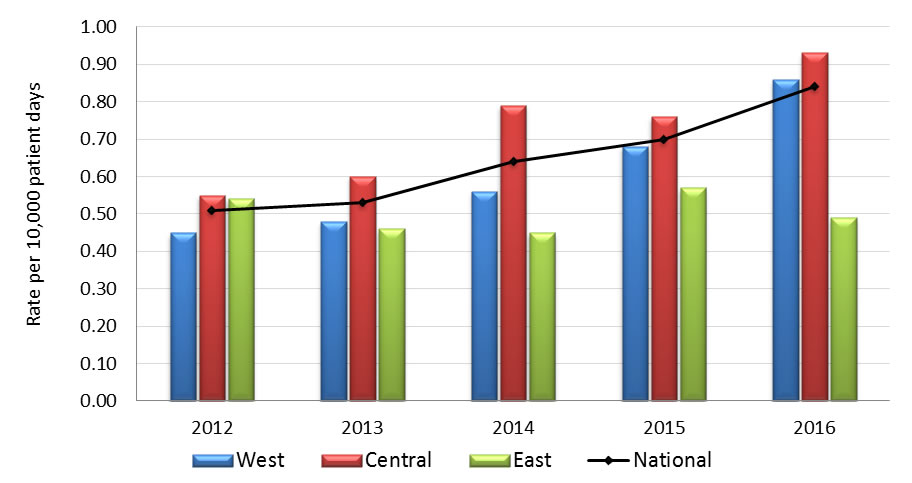
Graph 2.2 - Text description
| Year | Region | Rate |
|---|---|---|
| 2012 | West | 0.45 |
| Central | 0.55 | |
| East | 0.54 | |
| National | 0.51 | |
| 2013 | West | 0.48 |
| Central | 0.60 | |
| East | 0.46 | |
| National | 0.53 | |
| 2014 | West | 0.56 |
| Central | 0.79 | |
| East | 0.45 | |
| National | 0.64 | |
| 2015 | West | 0.68 |
| Central | 0.76 | |
| East | 0.57 | |
| National | 0.70 | |
| 2016 | West | 0.86 |
| Central | 0.93 | |
| East | 0.49 | |
| National | 0.84 |
| Year | Number of deathsFootnote * | Mortality rate (%) |
|---|---|---|
| 2012 | 71 | 22.0 |
| 2013 | 92 | 25.3 |
| 2014 | 103 | 24.4 |
| 2015 | 96 | 20.5 |
| 2016 | 111 | 19.0 |
|
||
| Strain Type | 2012 No. (%) |
2013 No. (%) |
2014 No. (%) |
2015 No. (%) |
2016 No. (%) |
|---|---|---|---|---|---|
| CMRSA 2 | 271 (50.7) | 278 (47.4) | 302 (43.9) | 266 (37.2) | 279 (31.6) |
| CMRSA 7 | 28 (5.2) | 24 (4.1) | 41 (6.0) | 48 (6.7) | 72 (8.1) |
| CMRSA 10 | 179 (33.5) | 214 (36.5) | 266 (38.7) | 303 (42.3) | 408 (46.2) |
| Other strain typesFootnote * | 52 (9.9) | 63 (11.1) | 70 (10.2) | 76 (10.6) | 92 (10.4) |
| Unassigned | 4 (0.7) | 6 (1.0) | 9 (1.3) | 23 (3.2) | 33 (3.7) |
| Total | 534 | 587 | 688 | 716 | 884 |
|
|||||
| Antibiotics | 2012 No. (%) |
2013 No. (%) |
2014 No. (%) |
2015 No. (%) |
2016 No. (%) |
|---|---|---|---|---|---|
| Clindamycin | 295 (78.9) | 349 (83.5) | 374 (65.4) | 385 (54.1) | 296 (42.7) |
| Ciprofloxacin | 429 (83.0) | 479 (85.8) | 228 (84.1) | 85 (81.7) | 520 (74.9) |
| Daptomycin | 0 (0.0) | 2 (0.4) | 2 (0.3) | 5 (0.7) | 0 (0.0) |
| Erythromycin | 432 (83.6) | 495 (88.7) | 535 (84.4) | 576 (80.9) | 538 (77.5) |
| Fusidic acid | 32 (6.2) | 57 (10.2) | 91 (14.4) | 126 (17.7) | 121 (17.4) |
| Mupirocin HLR | 25 (4.8) | 15 (2.7) | 30 (4.7) | 40 (6.6) | Not tested |
| Rifampin | 0 (0.0) | 3 (0.5) | 3 (0.5) | 3 (0.4) | 9 (1.3) |
| Tetracycline | 19 (3.7) | 25 (4.5) | 34 (5.4) | 37 (5.2) | 48 (6.9) |
| Tigecycline | 2 (0.4) | 25 (4.5) | 17 (2.7) | 6 (0.8) | 0 (0.0) |
| TMP/SMX | 12 (2.3) | 25 (4.5) | 14 (2.2) | 14 (2.0) | 18 (2.6) |
| Total isolates tested | 517 | 558 | 634 | 712 | 694 |
|
Total # isolates tested for clindamycin =374 (2012), 418 (2013), 572 (2014) |
|||||
All MRSA isolates from 2012 to 2016 submitted to NML were susceptible to linezolid and vancomycin.
3. Vancomycin-Resistant Enterococci (VRE)
| Years | 2012 | 2013 | 2014 | 2015 | 2016 |
|---|---|---|---|---|---|
| National | |||||
| No. of VRE cases | 394 | 322 | 293 | 271 | 299 |
| Rate per 1,000 pt admissions | 0.47 | 0.39 | 0.33 | 0.30 | 0.32 |
| Rate per 10,000 pt days | 0.61 | 0.52 | 0.45 | 0.41 | 0.43 |
| No. of reporting hospitals | 53 | 48 | 54 | 53 | 56 |
| West | |||||
| No. of VRE cases | 223 | 154 | 149 | 142 | 146 |
| Rate per 1,000 pt admissions | 0.64 | 0.52 | 0.45 | 0.40 | 0.40 |
| Rate per 10,000 pt days | 0.87 | 0.72 | 0.65 | 0.56 | 0.54 |
| Central | |||||
| No. of VRE cases | 168 | 161 | 143 | 127 | 145 |
| Rate per 1,000 pt admissions | 0.43 | 0.37 | 0.32 | 0.29 | 0.32 |
| Rate per 10,000 pt days | 0.55 | 0.51 | 0.44 | 0.41 | 0.45 |
| East | |||||
| No. of VRE cases | 3 | 7 | 1 | 2 | 8 |
| Rate per 1,000 pt admissions | 0.03 | 0.08 | 0.01 | 0.02 | 0.08 |
| Rate per 10,000 pt days | 0.04 | 0.08 | 0.01 | 0.02 | 0.09 |
|
|||||
Graph 3.1 - Text description
| Year | Region | Rate |
|---|---|---|
| 2012 | West | 0.87 |
| Central | 0.55 | |
| East | 0.04 | |
| National | 0.61 | |
| 2013 | West | 0.72 |
| Central | 0.51 | |
| East | 0.08 | |
| National | 0.52 | |
| 2014 | West | 0.65 |
| Central | 0.44 | |
| East | 0.01 | |
| National | 0.45 | |
| 2015 | West | 0.56 |
| Central | 0.41 | |
| East | 0.02 | |
| National | 0.41 | |
| 2016 | West | 0.54 |
| Central | 0.45 | |
| East | 0.09 | |
| National | 0.43 |
- Graph 3.1 footnote *
-
Includes infections identified from blood AND clinical isolates.
| Years | 2012 | 2013 | 2014 | 2015 | 2016 |
|---|---|---|---|---|---|
| National | |||||
| No. of VRE cases | Footnote * | * | 251 | 231 | 257 |
| Rate per 1,000 pt admissions | * | * | 0.28 | 0.26 | 0.28 |
| Rate per 10,000 pt days | * | * | 0.39 | 0.35 | 0.37 |
| No. of reporting hospitals | * | * | 54 | 53 | 56 |
| West | |||||
| No. of VRE cases | * | * | 126 | 118 | 121 |
| Rate per 1,000 pt admissions | * | * | 0.38 | 0.33 | 0.33 |
| Rate per 10,000 pt days | * | * | 0.55 | 0.46 | 0.45 |
| Central | |||||
| No. of VRE cases | * | * | 124 | 111 | 129 |
| Rate per 1,000 pt admissions | * | * | 0.27 | 0.25 | 0.28 |
| Rate per 10,000 pt days | * | * | 0.38 | 0.36 | 0.40 |
| East | |||||
| No. of VRE cases | * | * | 1 | 2 | 7 |
| Rate per 1,000 pt admissions | * | * | 0.01 | 0.02 | 0.07 |
| Rate per 10,000 pt days | * | * | 0.01 | 0.02 | 0.07 |
|
|||||
| Years | 2012 | 2013 | 2014 | 2015 | 2016 |
|---|---|---|---|---|---|
| National | |||||
| No. of VRE-BSI cases | 92 | 98 | 93 | 89 | 121 |
| Rate per 1,000 pt admissions | 0.11 | 0.12 | 0.11 | 0.10 | 0.13 |
| Rate per 10,000 pt days | 0.14 | 0.16 | 0.14 | 0.14 | 0.18 |
| No. of reporting hospitals | 53 | 48 | 54 | 53 | 56 |
| West | |||||
| No. of VRE-BSI cases | 38 | 31 | 35 | 35 | 45 |
| Rate per 1,000 pt admissions | 0.11 | 0.11 | 0.11 | 0.10 | 0.12 |
| Rate per 10,000 pt days | 0.15 | 0.15 | 0.15 | 0.14 | 0.17 |
| Central | |||||
| No. of VRE-BSI cases | 53 | 67 | 58 | 53 | 75 |
| Rate per 1,000 pt admissions | 0.13 | 0.15 | 0.13 | 0.12 | 0.16 |
| Rate per 10,000 pt days | 0.17 | 0.21 | 0.18 | 0.17 | 0.23 |
| East | |||||
| No. of VRE-BSI cases | 1 | 0 | 0 | 1 | 1 |
| Rate per 1,000 pt admissions | 0.01 | 0.00 | 0.00 | 0.01 | 0.01 |
| Rate per 10,000 pt days | 0.01 | 0.00 | 0.00 | 0.01 | 0.01 |
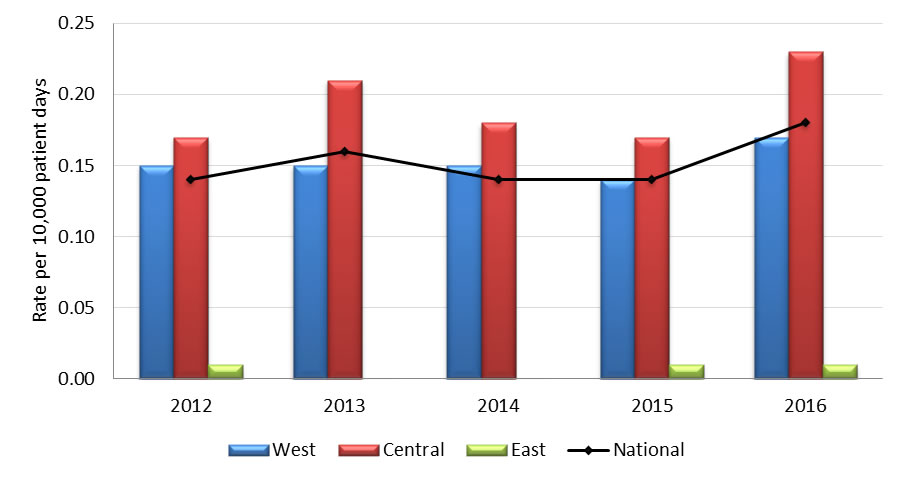
Graph 3.2 - Text description
| Year | Region | Rate |
|---|---|---|
| 2012 | West | 0.15 |
| Central | 0.17 | |
| East | 0.01 | |
| National | 0.14 | |
| 2013 | West | 0.15 |
| Central | 0.21 | |
| East | 0.00 | |
| National | 0.16 | |
| 2014 | West | 0.15 |
| Central | 0.18 | |
| East | 0.00 | |
| National | 0.14 | |
| 2015 | West | 0.14 |
| Central | 0.17 | |
| East | 0.01 | |
| National | 0.14 | |
| 2016 | West | 0.17 |
| Central | 0.23 | |
| East | 0.01 | |
| National | 0.18 |
| 2012 No. (%) |
2013 No. (%) |
2014 No. (%) |
2015 No. (%) |
2016 No. (%) |
|
|---|---|---|---|---|---|
| vanA, Enterococcus faecium | 65 (90.3) | 72 (96.0) | 70 (100.0) | 75 (100.0) | 88 (96.7) |
| vanB, Enterococcus faecium | 7 (9.7) | 3 (4.0) | 0 (0.0) | 0 (0.0) | 3 (3.3) |
| Total | 72 | 75 | 70 | 75 | 91 |
| 2012 No. (%) |
2013 No. (%) |
2014 No. (%) |
2015 No. (%) |
2016 No. (%) |
|
|---|---|---|---|---|---|
| ST117 | 24 (33.3) | 26 (34.7) | 16 (22.9) | 13 (17.3) | 21 (23.1) |
| ST18 | 14 (19.4) | 14 (18.7) | 20 (28.6) | 11 (14.7) | 14 (15.4) |
| ST412 | 10 (13.9) | 14 (18.7) | 7 (10.0) | 12 (16.0) | 13 (14.3) |
| OthersFootnote * | 24 (33.3) | 19 (25.3) | 27 (38.6) | 35 (46.7) | 33 (36.3) |
| Total | 72 | 75Footnote a | 70 | 75Footnote b | 91Footnote c |
|
|||||
| Antibiotics | 2012 | 2013 | 2014 | 2015 | 2016 |
|---|---|---|---|---|---|
| No. (%) | No. (%) | No. (%) | No. (%) | No. (%) | |
| Ampicillin | 71 (98.6) | 75 (100) | 70 (100) | 75 (100) | 91 (100) |
| Chloramphenicol | 0 (0.0) | 0 (0.0) | 0 (0.0) | 0 (0.0) | 2 (2.2) |
| DaptomycinFootnote a | 2 (2.8) | 5 (6.7) | 0 (0.0) | 0 (0.0) | 7 (7.7) |
| HL-Gentamicin | 16 (22.2) | 13 (17.3) | 7 (10.0) | 6 (8.0) | 13 (14.3) |
| HL- Streptomycin | 29 (40.3) | 28 (37.3) | 29 (41.4) | 27 (36.0) | 32 (35.2) |
| Levofloxacin | 72 (100) | 75 (100) | 70 (100) | 75 (100) | 91 (100) |
| Linezolid | 0 (0.0) | 1 (1.3) | 0 (0.0) | 0 (0.0) | 1 (1.1) |
| Nitrofurantoin | 11 (15.3) | 14 (18.7) | 15 (21.4) | 25 (33.3) | 35 (38.5) |
| Penicillin | 71 (98.6) | 75 (100) | 70 (100) | 75 (100) | 91 (100) |
| Tigecycline | 1 (1.4) | 0 (0.0) | 2 (2.9) | 0 (0.0) | 0 (0.0) |
| VancomycinFootnote b | 71 (98.6) | 75 (100) | 70 (100) | 74 (98.7) | 88 (96.7) |
| Total isolates tested | 72 | 75 | 70 | 75 | 91 |
|
|||||
4. Carbapenemase-Producing Enterobacteriaceae (CPE) and Carbapenemase-Producing Acinetobacter (CPA)
This report presents data on Carbapenemase-Producing Enterobacteriaceae (CPE) and Acinetobacter (CPA). CPE and CPA rates are based on inpatients only and include both colonized and infected cases, with the exception of mortality data which includes only infected cases. Rates are based on individual patient data. This means that a patient identified with multiple organisms during the same admission is only included once in the rates. If they are re-admitted and identified as CPE or CPA, they are included in the rates again as their subsequent admission contributes to the denominator. This explains the higher incidence rates presented in this report compared to previous reports. Consequently, data from previous years included in this report have been adjusted to reflect this change in reporting.
| Years | 2012 | 2013 | 2014 | 2015 | 2016 |
|---|---|---|---|---|---|
| National | |||||
| No. of CPE cases | 39 | 45 | 44 | 54 | 93 |
| Rate per 1,000 pt admissions | 0.07 | 0.06 | 0.05 | 0.06 | 0.10 |
| Rate per 10,000 pt days | 0.08 | 0.08 | 0.07 | 0.08 | 0.14 |
| No. of reporting hospitals | 38 | 45 | 58 | 58 | 58 |
| West | |||||
| No. of CPE cases | 6 | 22 | 12 | 21 | 22 |
| Rate per 1,000 pt admissions | 0.04 | 0.08 | 0.03 | 0.05 | 0.06 |
| Rate per 10,000 pt days | 0.05 | 0.11 | 0.04 | 0.07 | 0.07 |
| CentralFootnote ǂ | |||||
| No. of CPE cases | 32 | 22 | 32 | 31 | 71 |
| Rate per 1,000 pt admissions | 0.09 | 0.05 | 0.07 | 0.07 | 0.16 |
| Rate per 10,000 pt days | 0.12 | 0.07 | 0.11 | 0.10 | 0.23 |
| East | |||||
| No. of CPE cases | 1 | 1 | 0 | 2 | 0 |
| Rate per 1,000 pt admissions | 0.01 | 0.01 | 0.00 | 0.02 | 0.00 |
| Rate per 10,000 pt days | 0.01 | 0.01 | 0.00 | 0.02 | 0.00 |
|
|||||
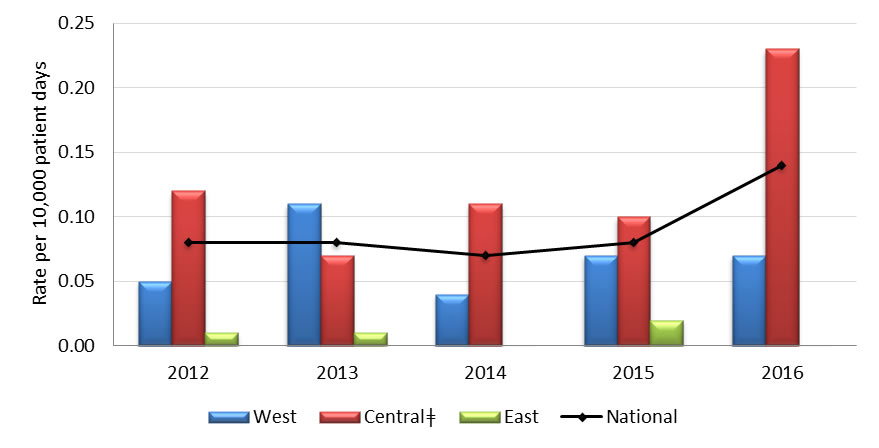
Central ǂ - The greater number of cases reported in the Central region is largely attributed to one hospital.
Graph 4.1 - Text description
| Year | Region | Rate |
|---|---|---|
| 2012 | West | 0.050 |
| Central | 0.120 | |
| East | 0.010 | |
| National | 0.080 | |
| 2013 | West | 0.110 |
| Central | 0.070 | |
| East | 0.010 | |
| National | 0.080 | |
| 2014 | West | 0.040 |
| Central | 0.110 | |
| East | 0.000 | |
| National | 0.070 | |
| 2015 | West | 0.070 |
| Central | 0.100 | |
| East | 0.020 | |
| National | 0.080 | |
| 2016 | West | 0.070 |
| Central | 0.230 | |
| East | 0.000 | |
| National | 0.140 |
| Years | 2012 | 2013 | 2014 | 2015 | 2016 |
|---|---|---|---|---|---|
| National | |||||
| No. of CPA cases | 9 | 32 | 4 | 5 | 13 |
| Rate per 1,000 pt admissions | 0.02 | 0.04 | 0.004 | 0.01 | 0.01 |
| Rate per 10,000 pt days | 0.02 | 0.06 | 0.01 | 0.01 | 0.02 |
| No. of reporting hospitals | 38 | 45 | 58 | 58 | 58 |
| West | |||||
| No. of CPA cases | 4 | 1 | 1 | 4 | 2 |
| Rate per 1,000 pt admissions | 0.03 | 0.004 | 0.003 | 0.01 | 0.01 |
| Rate per 10,000 pt days | 0.03 | 0.01 | 0.004 | 0.01 | 0.01 |
| Central | |||||
| No. of CPA cases | 5 | 31 | 3 | 1 | 11 |
| Rate per 1,000 pt admissions | 0.01 | 0.07 | 0.01 | 0.002 | 0.02 |
| Rate per 10,000 pt days | 0.02 | 0.10 | 0.01 | 0.003 | 0.04 |
| East | |||||
| No. of CPA cases | 0 | 0 | 0 | 0 | 0 |
| Rate per 1,000 pt admissions | 0.00 | 0.00 | 0.00 | 0.00 | 0.00 |
| Rate per 10,000 pt days | 0.00 | 0.00 | 0.00 | 0.00 | 0.00 |
|
|||||
| Year | Number of deaths/No. of CPE and CPA inpatients with outcome data | All-cause mortality rate per 100 infected cases |
|---|---|---|
| 2012 | 2/18 | 11.1 |
| 2013 | 4/25 | 16.0 |
| 2014 | 5/24 | 20.8 |
| 2015 | 3/17 | 17.6 |
| 2016 | 3/28 | 10.7 |
|
||
| Pathogen | 2012 No. (%) |
2013 No. (%) |
2014 No. (%) |
2015 No. (%) |
2016 No. (%) |
|---|---|---|---|---|---|
| Klebsiella pneumoniae | 19 (31.2) | 27 (28.4) | 27 (38.0) | 30 (35.7) | 49 (35.8) |
| Escherichia coli | 10 (16.4) | 5 (5.3) | 11( 15.5) | 22 (26.2) | 24 (17.5) |
| Serratia marcescens | 5 (8.2) | 11 (11.6) | 6 (8.5) | 3 (3.6) | 3 (2.2) |
| Enterobacter cloacae complexFootnote b | 11 (18.0) | 4 (4.2) | 12 (17.0) | 10 (11.9) | 23 (16.8) |
| Acinetobacter baumannii | 8 (13.1) | 37 (39.0) | 8 (11.3) | 9 (10.7) | 17 (12.4) |
| OthersFootnote c | 8 (13.1) | 11 (11.6) | 7 (9.9) | 10 (11.9) | 21 (15.3) |
| Total | 61 | 95 | 71 | 84 | 137 |
|
|||||
| Antibiotics | 2012 No. (%) |
2013 No. (%) |
2014 No. (%) |
2015 No. (%) |
2016 No. (%) |
|---|---|---|---|---|---|
| Piperacillin-Tazobactam | 49 (96.1) | 52 (91.2) | 56 (88.9) | 69 (92.0) | 91 (76.5) |
| Cefotaxime | 47 (92.2) | 46 (80.1) | 56 (88.9) | 68 (90.1) | 113 (95.0) |
| Ceftazidime | 44 (86.3) | 46 (80.1) | 56 (88.9) | 66 (88.0) | 109 (91.6) |
| Meropenem | 46 (90.2) | 53 (93.0) | 59 (93.7) | 66 (88.0) | 106 (89.1) |
| Ciprofloxacin | 28 (54.9) | 29 (50.1) | 35 (55.6) | 49 (65.3) | 75 (63.0) |
| Amikacin | 14 (27.5) | 18 (31.6) | 17 (27.0) | 23 (30.7) | 44 (37.0) |
| Gentamicin | 23 (45.1) | 26 (45.6) | 32 (50.8) | 39 (53.4) | 51 (42.9) |
| Tobramycin | 27 (53.0) | 29 (50.9) | 40 (63.5) | 41 (54.7) | 62 (52.1) |
| Trimethoprim-sulfamethoxazole | 29 (56.9) | 39 (68.4) | 42 (66.7) | 57 (76.0) | 79 (66.4) |
| Tigecycline | 11 (21.6) | 10 (17.5) | 11 (17.5) | 13 (17.3) | 28 (23.5) |
| Total no. of Isolates | 51 | 57 | 63 | 75 | 119 |
|
All isolates were resistant to Ampicillin, and all but one to Cefazolin |
|||||
| Antibiotics | 2012 No. (%) |
2013 No. (%) |
2014 No. (%) |
2015 No. (%) |
2016 No. (%) |
|---|---|---|---|---|---|
| Piperacillin-Tazobactam | 10 (100) | 37 (97.4) | 8 (100) | 9 (100) | 18 (100) |
| Cefotaxime | 7 (70.0) | 35 (92.1) | 8 (100) | 9 (100) | 16 (88.9) |
| Ceftazidime | 10 (100) | 36 (94.7) | 8 (100) | 9 (100) | 16 (88.9) |
| Meropenem | 9 (90.0) | 36 (94.7) | 8 (100) | 9 (100) | 18 (100) |
| Ciprofloxacin | 10 (100) | 36 (94.7) | 8 (100) | 9 (100) | 16 (88.9) |
| Amikacin | 5 (50.0) | 5 (13.1) | 0 (0.0) | 3 (33.3) | 12 (66.7) |
| Gentamicin | 5 (50.0) | 34 (89.5) | 8 (100) | 7 (77.8) | 14 (77.8) |
| Tobramycin | 7 (70.0) | 32 (84.2) | 5 (62.5) | 7 (77.8) | 12 (66.7) |
| Trimethoprim-sulfamethoxazole | 9 (90.0) | 35 (92.1) | 8 (100) | 7 (77.8) | 15 (83.3) |
| Tigecycline | 3 (30.0) | 0 (0.0) | 0 (0.0) | 0 (0.0) | 0 (0.0) |
| Total no. of Isolates | 10 | 38 | 8 | 9 | 18 |
|
All isolates were resistant to Ampicillin, Amoxicillin/Clavulanic Acid, Cefazolin, Cefoxitin |
|||||
| 2012 No. (%) |
2013 No. (%) |
2014 No. (%) |
2015 No. (%) |
2016 No. (%) |
|
|---|---|---|---|---|---|
| KPC | 33 (64.7) | 30 (52.6) | 31 (49.2) | 26 (34.7) | 62 (52.1) |
| NDM | 5 (9.8) | 14 (24.6) | 17 (27.0) | 29 (38.7) | 38 (31.9) |
| OXA-48 | 8 (15.7) | 6 (10.5) | 7 (11.1) | 14 (18.7) | 17 (14.3) |
| VIM | 1 (2.0) | 0 (0.0) | 1 (1.6) | 1 (1.3) | 1 (0.8) |
| SMEFootnote * | 3 (5.8) | 6 (10.5) | 5 (7.9) | 3 (4.0) | 1 (0.8) |
| GES-5 | 1 (2.0) | 1 (1.8) | 1 (1.6) | 3 (4.0) | 0 (0.0) |
| NMC/IMI | 0 (0.0) | 1 (1.8) | 2 (3.2) | 0 (0.0) | 2 (1.6) |
| IMP | 0 (0.0) | 0 (0.0) | 1 (1.6) | 0 (0.0) | 0 (0.0) |
| Total isolates tested | 51 | 57Footnote ** | 63Footnote ** | 75Footnote ** | 119Footnote ** |
|
|||||
| 2012 No. (%) |
2013 No. (%) |
2014 No. (%) |
2015 No. (%) |
2016 No. (%) |
|
|---|---|---|---|---|---|
| OXA-23 | 5 (50.0) | 5 (13.2) | 5 (62.5) | 8 (88.9) | 6 (33.3) |
| OXA-24 | 1 (10.0) | 4 (10.5) | 0 (0.0) | 0 (0.0) | 3 (16.7) |
| OXA-58 | 1 (10.0) | 0 (0.0) | 0 (0.0) | 111.1) | 0 (0.0) |
| OXA-237 | 4 (40.0) | 29 (76.3) | 3 (37.5) | 0 (0.0) | 0 (0.0) |
| OXA-235 | 0 (0.0) | 0 (0.0) | 0 (0.0) | 0 (0.0) | 9 (50.0) |
| IMP | 1 (10.0) | 0 (0.0) | 0 (0.0) | 0 (0.0) | 0 (0.0) |
| NDM | 0 (0.0) | 0 (0.0) | 0 (0.0) | 1 (11.1) | 0 (0.0) |
| Total isolates tested | 10Footnote * | 38 | 8 | 9Footnote ** | 18 |
|
|||||
Appendix A
Hospitals participating in the Canadian Nosocomial Infection Surveillance Program (CNISP), as of December 2016
Participating hospitals from the Western region
- Vancouver General Hospital, Vancouver, BC
- Richmond General Hospital, Richmond, BC
- UBC Hospital, Vancouver, BC
- Lions Gate Hospital, Vancouver, BC
- Powell River Hospital, Powell River, BC
- Sechelt Hospital, Sechelt, BC
- Squamish Hospital, Squamish, BC
- Children's and Women's Health Centre, Vancouver, BC
- Royal Jubilee, Victoria, BC
- Nanaimo Regional General Hospital, Nanaimo, BC
- Victoria General Hospital, Victoria, BC
- Kelowna Hospital, Kelowna, BC
- University of Northern BC, Prince George, BC
- Peter Lougheed Hospital, Calgary, AB
- Rockyview General Hospital, Calgary, AB
- Foothills Hospital, Calgary, AB
- South Health Campus, Calgary, AB
- Alberta Children's Hospital, Calgary, AB
- University of Alberta Hospital, Edmonton, AB
- Stollery Children's Hospital, Edmonton, AB
- Royal University Hospital, Saskatoon, SK
- St. Paul's Hospital, Saskatoon, SK
- Regina General Hospital, Regina, SK
- Pasqua Hospital, Regina, SK
- Health Sciences Centre, Winnipeg, MB
- Children's Hospital, Winnipeg, MB
Participating hospitals from the Central region
- Children's Hospital of Western Ontario, London, ON
- Victoria Hospital, London, ON
- University Hospital, London, ON
- Toronto Western Hospital, Toronto, ON
- Toronto General Hospital, Toronto, ON
- Princess Margaret Hospital, Toronto, ON
- North York General Hospital, Toronto, ON
- The Hospital for Sick Children, Toronto, ON
- Mount Sinai Hospital, Toronto, ON
- Sunnybrook Health Sciences Centre, Toronto, ON
- Kingston General Hospital, Kingston, ON
- Hamilton Health Sciences Centre, McMaster, Hamilton, ON
- Hamilton Health Sciences Centre, Juravinski Site, Hamilton, ON
- Hamilton Health Sciences Centre, General Site, Hamilton, ON
- St Joseph's Healthcare, Hamilton, ON
- The Ottawa Hospital, Civic Campus, Ottawa, ON
- The Ottawa Hospital, General Site, Ottawa, ON
- The Ottawa Hospital, Heart Institute, Ottawa, ON
- Children's Hospital of Eastern Ontario, Ottawa, ON
- Health Sciences North, Sudbury, ON
- Jewish General Hospital, Montréal, QC
- Montréal Children's Hospital, Montréal, QC
- Maisonneuve-Rosemont Hospital, Montréal, QC
- Montréal General Hospital, Montréal, QC
- Royal Victoria Hospital, Montréal, QC
- Montréal Neurological Hospital, Montréal, QC
- Hôtel-Dieu de Québec de CHUQ, Québec, QC
Participating hospitals from the Eastern region
- The Moncton Hospital, Moncton, NB
- Queen Elizabeth Hospital, Charlottetown, PEI
- Prince County Hospital, PEI
- QE II Health Sciences Centre, Halifax, NS
- IWK Health Centre, Halifax, NS
- Health Sciences Centre General Hospital, St. John's, NL
- Janeway Children's Health and Rehabilitation Centre, St. John's, NL
- St. Clare's Mercy Hospital, St. John's, NL
- Burin Peninsula Health Centre, Burin, NL
- Carbonear General Hospital, Carbonear, NL
- Dr. G.B. Cross Memorial Hospital, Clarenville, NL
- Western Memorial Regional Hospital, NL
We gratefully acknowledge the contribution of the physicians, epidemiologists, infection control practitioners and laboratory staff at each participating hospital and the Public Health Agency staff within the Centre for Communicable Diseases and Infection Control and the National Microbiology Laboratory, Winnipeg.
Appendix B: 2016 Surveillance Case Definitions and Eligibility Criteria
1. Clostridium difficile Infection (CDI)
To be included in the surveillance, a CDI patient must be:
- ONE year of age and older
Surveillance case definition for primary episodes of CDI
- A “primary” episode of CDI is defined as either the first episode of CDI ever experienced by the patient or a new episode of CDI which occurs greater than eight (8) weeks after the previous confirmed case of CDI in the same patient, i.e. after the first C. difficile toxin-positive assay or PCR test.
A patient is identified as having CDI if:
- they have diarrhea* or fever, abdominal pain and/or ileus AND a laboratory confirmation of a positive toxin assay or positive polymerase chain reaction (PCR) for C. difficile (without reasonable evidence of another cause of diarrhea).
OR - they have a diagnosis of pseudomembranes on sigmoidoscopy or colonoscopy (or after colectomy) or histological/pathological diagnosis of CDI.
OR - the patient is diagnosed with toxic megacolon (in adult patients only)
*Diarrhea is defined as one of the following:
- 6 or more watery stools in a 36-hour period
- 3 or more unformed stools in a 24-hour period and this is new or unusual for the patient (in adult patients only)
NOTE: If the information about the frequency and consistency of diarrhea is not available, a toxin-positive stool or positive PCR will be considered as a case.
Once the patient has been identified with CDI, they will be classified as HA or CA based on the following criteriaFootnote a and the best clinical judgment of the healthcare and/or infection prevention and control practitioner.
CDI is considered “healthcare-associated from your facility”Footnote b if it meets the following criteria:
- The patient's CDI symptoms occur in your healthcare facility 3 or more days after admission, with day of admission being day 1.
OR - The patient's CDI symptoms occur less than three (3) days after admission and are seen in a patient who had been hospitalized at your healthcare facility and discharged within the previous 4 weeks.
CDI is considered “healthcare-associated, another facility” if it meets the following criteria:
- The patient's CDI symptoms occur less than three (3) days after admission and are seen in a patient who is known to have been hospitalized at another healthcare facility and discharged within the previous four (4) weeks.
CDI is considered “community-associated” if it meets the following criteria:
- Patients seen in the Emergency Department, clinic, or other outpatient areas with positive test results for CDI are included (if possible at your facility)Footnote c
OR - Patient's CDI symptoms occur three (3) days or less after admission to a healthcare facility (your facility or another), with the date of admission being day 1;
AND - The symptom onset was more than twelve (12) weeks after the patient was discharged from any healthcare facility
CDI is considered “indeterminate” if it meets the following criteria:
- The patient with CDI does not meet any of the definitions listed above for HA- or CA-CDI. The symptom onset was more than four weeks but less than 12 weeks after the patient was discharged from any healthcare facility.
2. Methicillin-Resistant Staphylococcus aureus (MRSA)
MRSA surveillance inclusion criteria
MRSA case definition:
- isolation of Staphylococcus aureus from any body site
AND - resistance of isolate to oxacillin
AND - patient must be admitted to the hospital
AND - is a "newly identified MRSA case" at a CNISP hospital at the time of hospital admission or identified during hospitalization.
This includes:
- MRSA infections identified for the first time during this hospital admission
- Infections that have been previously identified at other non-CNISP hospitals (since we want newly identified MRSA cases at CNISP hospitals)
- Infections that have already been identified at your site but are new cases. This can only be identified if the previously identified case has another strain. This means the person was exposed again to MRSA and acquired another strain of it from another source (a new patient identifier is assigned only if confirmed with a different strain type)
AND - meets the criteria for MRSA infection as determined using the April 2015 CDC/NHSN surveillance definitions for specific infections, and in accordance with the best judgment of the healthcare and/or IPC practitioner.
MRSA surveillance exclusion criteria:
- MRSA infections previously identified at other CNISP sites
- Emergency, clinic, or other outpatient cases who are not admitted to the hospital.
- Infections re-admitted with MRSA (unless it is a different strain)
Healthcare-associated (HA) case definition:
Once the patient has been identified with MRSA, they will be classified as HA based on the following criteria and the best clinical judgement of the healthcare and/or infection prevention and control practitioner (IPC):
- Exposure to any healthcare setting (including long-term care facilities or clinics) in the previous 12 monthsFootnote d
OR - Patient is on calendar day 3Footnote e of their hospitalization
Newborn healthcare-associated (HA) case definition:
A MRSA case in a newborn may be considered as HA if:
- The newborn is on calendar day 3 of their hospitalization
- The mother was not known to have MRSA on admission and there is no epidemiological reason to suspect that the mother was colonized prior to admission, even if the newborn is < 48 hours of age.
In the case of a newborn transferred from another institution, MRSA may be classified as HA if the organism was not known to be present and there is no epidemiological reason to suspect that acquisition occurred prior to transfer.
Community-associated case definition:
- MRSA identified on admission to hospital (Calendar Day 1 = day of hospital admission) and/or the day after admission (day 2).
AND - Has no previous history of the organism.
AND - Has no prior hospital, long-term care admission or other exposure to a healthcare setting (rehab, clinics)Footnote 4 in the past 12 monthsFootnote 1.
AND - Has no reported use of medical devices.
MRSA clinical infection
MRSA infection is determined using the 2016 CDC/NHSN surveillance definitions for specific infections, and in accordance with the best judgment of the healthcare and/or IPC practitioner.
The MRSA infection would be considered HA if all elements of a CDC/NHSN site-specific infection criterion were present on or after the 3rd calendar day of admission to the facility (the day of hospital admission is calendar day 1). The MRSA infection would be considered CA if all elements of a CDC/NHSN site-specific infection criterion were present during the two calendar days before the day of admission, the first day of admission (day 1) and/or the day after admission (day 2) and are documented in the medical record.
MRSA Bloodstream infection (bacteremia)
To be considered a MRSA bloodstream infection the patient must have MRSA cultured (lab-confirmed) from at least one blood culture
To classify the MRSA bloodstream infection as HA or CA, the following criteria taken from Friedman et al, Ann Intern Med 2002 will be used. The MRSA infection would be considered:
HA – your facility MRSA BSI: if the first positive blood culture for MRSA was obtained ≥ 48 hours after admission to your hospital
HA – MRSA BSI: if the first positive blood culture for MRSA was obtained ≥ 48 hours after hospital admission
OR
if the first positive blood culture for MRSA was obtained within 48 hours of admission, the patient meets one of the following criteria:
- healthcare exposure in the previous 90 days (such as receipt of IV medications, IV chemotherapy, hemodialysis, etc);
- was hospitalized in the previous 90 days; or
- resides in a long-term care facility or nursing home.
CA – MRSA BSI: if the first positive blood culture for MRSA was obtained prior to hospital admission, or within 48 hours of admission, AND did not meet criteria for HA-BSI.
3. Vancomycin-Resistant Enterococci (VRE)
VRE infection case definition:
- Isolation of Enterococcus faecalis or faecium
AND - Vancomycin MIC ≥ 8 ug/ml
AND - Patient is admitted to the hospital
AND - Is a "newly” identified VRE-infection at a CNISP facility at the time of hospital admission or identified during hospitalization
VRE infection is determined using the January 2016 Centers for Disease Control and Prevention (CDC) National Healthcare Safety Network (NHSN) definitions/criteria for infections, and in accordance with the best judgment of the ICP. These criteria should be met at the time of the culture that yielded VRE, or within 72 hours of the culture.
Exclusion criteria:
- Previously identified at other CNISP sites (to avoid duplicate reporting to CNISP)
- Identified through emergency, clinic, or other outpatient areas
- Re-admitted with VRE (unless it is a different strain)
Healthcare-associated, from your facility (e.g. infection from CNISP reporting hospital) is defined as an inpatient who meets the following criteria:
- Exposure to any healthcare setting (including long-term care facilities or clinics) in the previous 12 months
OR - Has been hospitalized for greater than 48 hours
4. Carbapenemase-Producing Enterobacteriaceae (CPE) and Carbapenem-Producing Acinetobacter (CPA)
Any patient admitted to participating CNISP hospitals with a hospital laboratory confirmation (and subsequent confirmation by the NML) that tested/screened positive for a least one potential carbapenem-reduced susceptible Enterobacteriaceae and Acinetobacter spp., from any body site that meets the following CLSI criteriaFootnote f.
| At least ONE of the following: | Enterobacteriaceae: | |
|---|---|---|
| MIC (μg/ml) | Disk diffusionAppendix B table footnote * (mm) | |
| Imipenem | ≥ 4 | ≤ 19 |
| Meropenem | ≥ 4 | ≤ 19 |
| Doripenem | ≥ 4 | ≤ 19 |
| Ertapenem | ≥ 2 | ≤ 18 |
|
||
| At least ONE of the following: | Acinetobacter: | |
|---|---|---|
| MIC(μg/ml) | Disk diffusion (mm) | |
| Imipenem | ≥ 8 | ≤ 18 |
| Meropenem | ≥ 8 | ≤ 14 |
| Doripenem | ≥ 8 | ≤ 14 |
Carbapenems are a class of beta-lactam antibiotics with broad-spectrum activity recommended as first-line therapy for severe infections caused by certain gram negative organisms and as directed therapy for organisms that are resistant to narrower spectrum antibiotics.
Carbapenem resistance can be due to changes in the permeability of the organism to the antibiotic and/or the up-regulation of efflux systems that "pump" the antibiotic out of the cell, usually concomitant with the presence of an acquired extended-spectrum beta-lactamase (ESBL) or AmpC enzyme or the hyperproduction of intrinsic chromosomally –located beta-lactamase(s). More recently, resistance is increasingly due to the acquisition of enzymes that break down the carbapenems: carbapenemases (e.g. NDM-1, OXA-48, KPC, VIM, IMP etc). These latter subsets of carbapenem-resistant organisms are called carbapenemase-producing organisms (CPOs) and are of particular concern because of their ability to transfer resistance easily across different genera and species of bacteria. They are quickly becoming a public health problem not only because of the ability to cause healthcare acquired infections which have limited treatment options, but because of the potential for colonizing both inpatient and outpatient populations due to their ease of transmissibility, thus, creating a reservoir of bacterial resistance.
Footnotes
- Footnote a
-
Adapted from SHEA/IDSA practice recommendations ‘Strategies to Prevent Clostridium difficile Infections in Acute Care Hospitals: 2014 Update' – available at URL http://www.jstor.org/stable/10.1086/676023?origin=JSTOR-pdf
- Footnote b
-
Patients seen in ER or outpatients within 4 weeks of discharge from your or another healthcare facility who meet the criteria for
CDI would be considered HA-CDI even if not admitted - Footnote c
-
Cases identified in the ER (non -admitted patients) or outpatient areas will NOT be included in the calculation of infection rates
- Footnote d
-
Consideration should be given to the frequency and nature of exposure to a healthcare setting. For example, pediatric patients with clinic visits in the previous 12 months may or may not be considered as HA.
- Footnote e
-
Calendar day 1 is the day of hospital admission.
- Footnote f
-
Clinical and Laboratory Standards Institute. 2015. Performance standards for antimicrobial susceptibility testing; 25th informational supplement, M100-S25 (Jan., 2015). Clinical and Laboratory Standards, Wayne, PA.
Page details
- Date modified: