
Adverse events following immunization in Canada: 2012

 Download this article as a PDF (915 KB - 17 pages)
 Published by: The Public Health Agency of Canada
Issue: Volume 40 S-3: Vaccine Safety
Date published: December 4, 2014
ISSN: 1481-8531
Submit a manuscript
About CCDR
Browse
Volume 40 S-3, December 4, 2014: Vaccine Safety
Surveillance
Canadian Adverse Events Following Immunization Surveillance System (CAEFISS) Annual report for vaccines administered in 2012
Law BJ1*, Laflèche J1,2, Ahmadipour N1, Anyoti H1
Affiliations
1 Centre for Immunization and Respiratory Infectious Diseases, Public Health Agency of Canada, Ottawa, ON
2 Citizenship and Immigration Canada, Ottawa, ON
Correspondence
DOI
https://doi.org/10.14745/ccdr.v40is3a02
Abstract
Background: To describe the adverse event following immunization (AEFI) reporting profile for vaccines administered in Canada during 2012 and surveillance trends relative to reports for vaccines administered from 2005 through 2011.
Methods: Analysis of data based on AEFI reports received by the Public Health Agency of Canada by April 30, 2013, for vaccines marketed in Canada and administered from January 1, 2005, through December 31, 2012.
Results: The AEFI reporting rate was 10.1 per 100,000 population in Canada for vaccines administered in 2012 and was inversely proportional to age. There was a trend of declining rates from 2005 (14.8) to 2012 overall and by age group. The vast majority of reports (94%−95%) were non-serious involving reactions at or near the vaccination site, rash and febrile events.
Conclusion: Canada has a strong pharmacovigilance system for vaccines with one of the highest AEFI reporting rates in developed countries. Vaccines marketed in Canada have a very good safety profile. This report enables comparisons across jurisdictions in Canada and globally.
Introduction
The Canadian Adverse Events Following Immunization Surveillance System (CAEFISS) is a collaborative effort of federal, provincial and territorial (F/P/T) public health authorities that dates back to 1987 Footnote 1,Footnote 2. At the national level, CAEFISS is managed by the Public Health Agency of Canada's (PHAC's) Vaccine Safety Section, within the Centre for Immunization and Respiratory Infectious Diseases. National reports on vaccine safety have been published periodically Footnote 2,Footnote 3,Footnote 4,Footnote 5,Footnote 6,Footnote 7,Footnote 8,Footnote 9,Footnote 10,Footnote 11. The last published report focused on safety surveillance data for vaccines administered in 2004 along with annual reporting trends back to 1992 Footnote 11. The primary purpose of this report is to summarize the adverse event following immunization (AEFI) reports received at PHAC for vaccines administered in 2012 and provide annual comparative data for vaccines given from 2005 through 2011. It also introduces a standard format for future annual reports that will facilitate year-to-year comparison for the national report as well as comparison to reports from other jurisdictions in Canada Footnote 12 and globally Footnote 13,Footnote 14.
The objectives of CAEFISS are to: continuously monitor the safety of marketed vaccines in Canada; identify increases in the frequency or severity of previously identified vaccine-related reactions; identify previously unknown AEFIs that could possibly be related to a vaccine; identify areas that require further investigation and/or research; and provide timely information on AEFI reporting profiles for vaccines marketed in Canada that can help inform immunization-related decisions Footnote 15.
To achieve these objectives CAEFISS includes enhanced passive as well as active syndromic surveillance. The former includes all systems in place to monitor and report AEFIs in Canada's provincial/territorial and federal immunization programs and is considered enhanced because emphasis has always been placed on reporting designated adverse events of special public health importance which are listed as checkboxes on the national AEFI report form Footnote 16. All provinces and territories actively promote reporting within their regions Footnote 17.
Active syndromic surveillance has been conducted since 1991 by the Immunization Monitoring Program ACTive (IMPACT) Footnote 18. IMPACT is funded by the Agency through a contract with the Canadian Paediatric Society and currently includes 12 paediatric centres across Canada representing over 90% of all paediatric tertiary care beds in the country Footnote 19,Footnote 20. IMPACT screens hospital admissions for neurologic events (e.g., seizures, encephalitis, acute flaccid paralysis, including Guillain-Barré syndrome, aseptic meningitis), thrombocytopenia, vaccination site abscess/cellulitis, and other complications that may have followed immunization. Any found to be temporally linked to immunization without clear explanation are reported as AEFI.
All F/P/T and IMPACT AEFI reports have personal identifiers removed and are then forwarded to PHAC for national collation, signal detection and report generation. From 1987 through 2010 Market Authorization Holders also reported to PHAC. In January 2011, a change in reporting regulations required Market Authorization Holders to report directly to Health Canada; since then, several of them have stopped reporting to PHAC.
A more complete explanation of the respective roles and responsibilities for post-market pharmacovigilance of Health Canada, PHAC, and F/P/T immunization authorities can be found in the "Vaccine Safety" chapter of the Canadian Immunization Guide Footnote 21 and at the CAEFISS web page Footnote 15.
Methods
CAEFISS report processing
All AEFI reports are entered into the CAEFISS database and coded using the international Medical Dictionary for Regulatory Activities (MedDRA). A systematic Medical Case Review is also done by trained health professionals to classify each report by the single most important reason for reporting (Primary AEFI, Table 1) and severity (Table 2).
| Category | AEFI category sub-types |
|---|---|
| Reactions at or near the vaccination site |
|
| Allergic or allergic-like events |
|
| Neurologic events |
|
| Rash only | Generalized, localized, or location not specified |
| Other events specified on the CAEFISS report form |
|
| Systemic events not specified on the CAEFISS report form | Fever alone Infection Influenza-like illness Other general symptom(s) Rash with fever and/or other illness Syndrome |
| Vaccination anxiety-related events | (no subtype) |
| Miscellaneous other events |
|
| Vaccination error without an associated AEFI | (no subtype) |
| Severity | Criteria |
|---|---|
| Serious |
|
| High impact |
|
| Moderate impact |
|
| Low impact |
|
Key definitions
An adverse event following immunization (AEFI) is "any untoward medical occurrence which follows immunization and which does not necessarily have a causal relationship with the usage of the vaccine. The adverse event may be any unfavourable or unintended sign, abnormal laboratory finding, symptom or disease" Footnote 22.
In 1994 the International Conference on Harmonisation of Technical Requirements for Registration of Pharmaceuticals for Human Use defined seriousness criteria for expedited reporting of AEFIs Footnote 23. A serious AEFI (SAE) is one that results in death, is life-threatening, requires in-patient hospitalization or prolongation of existing hospitalization, results in persistent or significant disability/incapacity, or is a congenital anomaly/birth defect Footnote 23. Expedited reporting is defined as no later than 15 calendar days after initial recognition of the AEFI and preferably as soon as possible. At PHAC, all SAE reports are reviewed by a physician.
An unexpected AEFI is an adverse event, the nature or severity of which is not consistent with domestic labelling or expected from the characteristics of the vaccine Footnote 23.
For purposes of Medical Case Review classification, national case definitions were used where available, including published Brighton Collaboration case definitions Footnote 24,Footnote 25,Footnote 26,Footnote 27,Footnote 28,Footnote 29,Footnote 30,Footnote 31,Footnote 32,Footnote 33,Footnote 34,Footnote 35,Footnote 36,Footnote 37, and CAEFISS User Guide definitions for Oculo-Respiratory syndrome (ORS), Bell's palsy, arthritis, parotitis, anaesthesia and paraesthesia Footnote 38.
Additional definitions included:
- Extensive limb swelling of an entire proximal and/or distal limb segment with segment defined as extending from one joint to the next Footnote 39.
- Cerebellar ataxia: sudden onset of truncal ataxia and gait disturbances Footnote 40. Of note, this assumes absence of cerebellar signs appearing with other evidence of encephalitis or Acute Disseminated Encephalomyelitis (ADEM), in which case it would be classified according to the Brighton case definition Footnote 28.
Data extraction and analysis
All AEFI reports received by April 30, 2013, where the date of vaccine administration was between January 1, 2005, and December 31, 2012, were extracted from CAEFISS. Reports where the only administered vaccine was one of the pandemic H1N1 vaccines were excluded since these products were used exclusively in 2009−2010, confounding comparison of reporting trends for vaccines administered in 2012 versus 2005−2011.
All data analyses were conducted using the statistical software system, SAS 9.3. Reporting rates per 100,000 were calculated using annual population estimates for 2005–2012 by age, sex, province/territory Footnote 41.
Information on total vaccine doses distributed in 2011 and 2012 was provided by the Market Authorization Holders and is considered proprietary information. To enable presentation of total AEFI and SAE reports for vaccines administered in 2012 and reporting rates per 100,000 doses distributed without making it possible to calculate specific annual doses distributed, the rates were calculated using combined 2011 and 2012 data. Vaccines were grouped by antigenic content for purposes of analysis.
Results
Total reports and reporting rates
Of 38,364 extracted AEFI reports, 5,204 involving pandemic vaccine given alone were excluded since this vaccine was used only in 2009−2010. Of the 33,160 reports for analysis, the distribution of AEFI (% SAE) reports by year vaccine administered was: 2005: 4,792 (4.5%); 2006: 4,417 (4.8%); 2007: 4,258 (5.3%); 2008: 4,482 (4.7%); 2009: 4,099 (5.8%); 2010: 4,046 (5.9%); 2011: 3,558 (5.8%); 2012: 3,508 (5.4%).
Age-specific reporting rates per 100,000 population by year vaccine administered for all of Canada are shown in Table 3. For all years of vaccine administration, the highest reporting rates were observed for 1- to <2-year-old children followed closely by infants <1 year old with a sharp drop-off for 2 to <7 year-olds, 7 to <18 year-olds, and adults aged 18 years and older. There was a consistent downward trend in reporting rates throughout the period, most noticeable in children <7 years and for AEFI as opposed to SAE rates.
| Age group | AEFI (SAE) reporting rates per 100,000 population | |||||||
|---|---|---|---|---|---|---|---|---|
| 2005 | 2006 | 2007 | 2008 | 2009 | 2010 | 2011 | 2012 | |
| <1 year | 176(16) | 161(16) | 169(18) | 134(12) | 152(19) | 150(20) | 136(15) | 130(12) |
| 1 to <2 years | 305(22) | 290(24) | 276(22) | 283(22) | 238(18) | 217(18) | 202(17) | 152(16) |
| 2 to <7 years | 47.1(1.2) | 36.7(1.1) | 31.5(1.2) | 31.0(1.2) | 27.8(1.0) | 28.7(1.0) | 28.8(1.4) | 25.2(1.2) |
| 7 to <18 years | 11.9(0.5) | 11.4(0.4) | 9.5(0.4) | 15.1(0.6) | 12.3(0.5) | 12.0(0.4) | 9.7(0.6) | 11.2(0.4) |
| 18 to <65 years | 6.5(0.2) | 6.0(0.1) | 6.0(0.1) | 5.6(0.1) | 4.9(0.2) | 4.7(0.1) | 4.2(0.1) | 5.0(0.1) |
| 65+ years | 8.0(0.3) | 6.6(0.2) | 6.3(0.2) | 6.8(0.2) | 4.3(0.3) | 7.1(0.5) | 5.3(0.3) | 5.8(0.3) |
| All ages | 14.8(0.7) | 13.5(0.6) | 12.9(0.7) | 13.4(0.6) | 12.1(0.7) | 11.9(0.7) | 10.3(0.6) | 10.1(0.6) |
The explanation for the observed drop in reporting rates overall and by age group is likely multi-factorial based on changes in publicly funded immunization programs as well as guidelines for AEFI reporting. Several P/Ts introduced universal meningococcal conjugate and varicella immunization programs for infants from 2004 to 2006 and HPV (human papillomavirus) programs for school girls from 2007 to 2010. Several associated age-specific catch-up campaigns were also conducted; most of these were completed by 2011 or 2012. Additionally, several provincial jurisdictions now discourage the reporting of expected milder events such as most vaccination site reactions. Another important caveat is that there has been less time to receive reports for vaccines administered in 2012 than other years. The April 30th cut-off for including reports was based on the observation that over 80% of reports for vaccines administered in a given calendar year will have been received within four months of the end of the calendar year. The numbers for 2012 will be updated as part of the annual report for vaccines administered in 2013.
A total of 46,481,347 doses of vaccine were distributed in Canada in 2011 and 2012, giving reporting rates per 100,000 doses distributed of 15.2 for all AEFI and 0.85 for SAE.
Reporting sources
Figures 1A and 1B show AEFI and SAE reporting source distribution, stratified by age group, for vaccines administered from 2005 to 2012. Notably, for children aged <18 years IMPACT submitted, on average, 4.1% of all AEFI reports, but generated 54.3% of all SAEs. A noticeable trend is the drop off in the number of Market Authorization Holder (MAH) reports following the 2011 change in regulatory reporting. From 2005 through 2010 MAH reports made up 9.8% of all AEFI and 7.1% of all SAE reports. For 2011 and 2012 the relative contribution decreased to 6.0% of all AEFI reports and 4.3% of all SAE reports. Given the volume of reports from F/P/T immunization programs and IMPACT, this change has not been substantial for CAEFISS reporting trends; furthermore, the reports are collected and reviewed by Health Canada's Marketed Health Products Branch so information is not lost.
Figure 1A: AEFIFigure 1A - Footnote 1 reporting sources for children and adults by year vaccine administered, 2005−2012
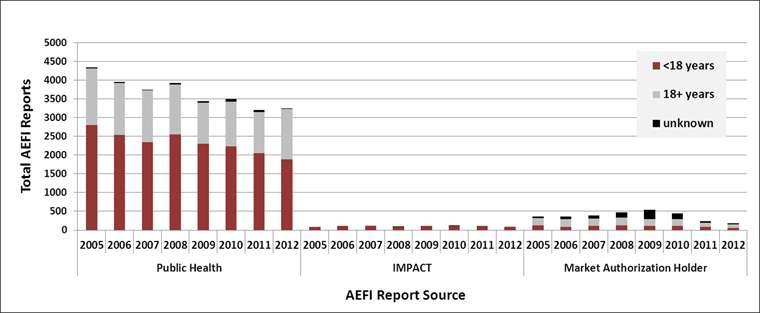
- Footnote 1
- 1Adverse event following immunization (AEFI)
Text Equivalent - Figure 1A
This figure is a histogram showing the relative contribution of three sources of Adverse Event Following Immunization (AEFI) reports for children and adults by year vaccine administered. The three sources are: Public Health, IMPACT and Market Authorization holder. Each bar is in three colors: one for under 18 years of age, one for 18 and over and another for unknown. The y axis represents the total AEFI reports and ranges from zero at unity to 5000. The x axis represents the time in years from 2005 to 2012 for each of the three sources. By far the largest source was Public Health that had 4339 reports in 2005 that decreased in an undulating way to 3240 reports in 2012; approximately two thirds of reports were in children, one third in adults and only a small number were unknown. The next largest sources was the market authorization holder that had 363 reports in 2005 this rose to a maximum of 545 reports in 2009 and then decreased to 180 reports in 2012; nearly half of the reports involved adults aged 18 and over most years, with the exception of 2009, when 46% of reports involved an unknown age group. IMPACT reports ranged from 87 to 126 per year and all involved children aged <18 years.
Figure 1B: Serious AEFIFigure 1B - Footnote 1 (SAE)Figure 1B - Footnote 2 reporting sources for children and adults by year vaccine administered, 2005−2012
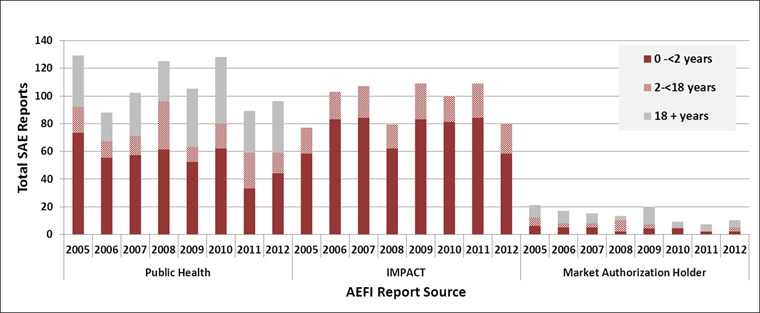
Text Equivalent - Figure 1B
This figure is a histogram showing the relative contribution of three sources of Serious Adverse Events (SAEs) following immunization reports for children and adults by year vaccine administered. The three sources are: Public Health, IMPACT and Market Authorization holder. Each bar is in three colors: one for those less than 2 years of age, one for those aged two to under 18 years of age, and one for 18 and over. The y axis represents the total AEFI reports and ranges from zero at unity to 140. The x axis represents the time in years from 2005 to 2012 for each of the three sources. The total number of reports submitted by Public Health and IMPACT were similar each year, with Public Health contributing the most in 2005, 2008, 2010 and 2012 (129, 125, 128 and 96 SAE reports respectively) and IMPACT contributing the most in 2006, 2007, 2009 and 2011 (103, 107, 109 and 109 respectively). The major difference between the two reporting sources was annual age distribution. Public Health reports involved all age groups with about half to three quarters involving children aged 0 to <2 years, 10 up to 30% involving older children aged 2 to <18 years and from 24 to 40% involving adults. All IMPACT reports involved children under 18 years with close to 80% involving children aged 0-<2 years. Market Authorization Holders contributed from 7 to 21 SAE reports yearly with wide annual variations in the age distribution, ranging from 23 to 71% adults, 0 to 62% children aged 2 to <18 years and 15 to 44% children aged 0 to <2 years.
Age and gender distribution
For vaccines administered in 2012, the age distribution among AEFI (SAE) reports was: <1 year: 14% all AEFIs (24% all SAEs); 1 to <2 years: 16% (32%); 2 to <7 years: 14% (12%); 7 to <18 years: 14% (9%); 18 to <65 years: 32% (14%); 65+ years: 9% (8%); and unknown age: 1% (1%). The distribution has remained fairly constant over time (data not shown). The higher proportion of serious reports among younger children reflects the contribution of active syndromic surveillance by IMPACT.
With respect to gender, the female to male ratio remained fairly constant for vaccines administered from 2005 through 2012 for children under 7 years (range 0.8−0.9) and for all adults (range 3.4−4.1). In contrast, the ratio for children aged 7 to <18 years rose steadily from 1.1 in 2005 to 1.6 in 2007, peaked at 2.3 in 2011, and then dropped to 1.8 in 2012. The changes were consistent with the introduction of female targeted universal HPV vaccination programs, starting with Ontario in 2007, all other provinces by 2008 and the territories by 2010, along with catch-up programs for older school-aged girls which were largely completed before 2012.
AEFI health care utilization and outcomes for vaccines administered in 2012
The distribution of associated health care utilization was: none for 24.5%; health professional advice for 5%; non-urgent medical assessment for 35.9%; urgent medical assessment for 17.9%; hospital admission for 5.2%; prolongation of an existing hospital stay for 0.1%; and unknown for 11.4% of reports. The only temporal reporting trend was that utilization was specified for an increasing proportion of reports along with slight increases in the proportion receiving urgent or non-urgent medical assessment (data not shown).
The distribution of outcome status was: 67.8% fully recovered; 16.2% not yet recovered; 0% with permanent disability; 0.1% fatal outcome; and 15.8% unknown. There were no significant temporal trends for vaccines administered from 2005 through 2012 (data not shown). Fatal outcomes and permanent disability are rarely reported (yearly range of 5−14 and 0−11 total reports, respectively).
Reported adverse events
Table 4 shows the MedDRA System Organ Class distribution of all reported AEFIs for all vaccines administered in 2012, along with comparative distributions for vaccines administered in 2011, and from 2005 through 2010. The only System Organ Class category with a sizable steady temporal increase was "immune system disorders": from 5.8% for vaccines administered from 2005 to 2010, to 8.9% for 2011, and 14.0% for 2012. The 490 reports for vaccines administered in 2012 were all related to allergic AEFI preferred terms (mostly hypersensitivity, some anaphylaxis and two type III immune complex disorder); only 11 (2.2%) were serious. When cross-referenced with the primary AEFI classification, the majority were other allergic (198), rash alone (153), anaphylaxis (50), or vaccination site reactions (43). There was a single case of arthritis, one erythema multiforme, one serum sickness, and no immune disorders of concern. The reports of anaphylaxis were distributed across multiple ages and vaccines and there were no lot-specific clusters.
| System Organ Class | % of AEFI reports with at least one SOC termTable 4 - Footnote 3 | ||
|---|---|---|---|
| 2005−2010 | 2011 | 2012 | |
| Blood and lymphatic system disorders | 2.1 | 2.7 | 1.9 |
| Cardiac disorders | 1 | 1.4 | 1.6 |
| Congenital, familial and genetic disorders | 0 | 0 | 0 |
| Ear and labyrinth disorders | 0.6 | 0.9 | 1.1 |
| Endocrine disorders | 0 | 0 | 0.1 |
| Eye disorders | 5.7 | 6.7 | 6.6 |
| Gastrointestinal disorders | 14.9 | 19.3 | 20.2 |
| General disorders and administration site conditions | 61.2 | 66.6 | 66.7 |
| Hepatobiliary disorders | 0.1 | 0.1 | 0.1 |
| Immune system disorders | 5.8 | 8.9 | 14.0 |
| Infections and infestations | 7.0 | 10.1 | 11.5 |
| Injury, poisoning and procedural complications | 1.8 | 3.3 | 3.1 |
| Investigations | 6.9 | 4.6 | 2.9 |
| Metabolism and nutrition disorders | 3.4 | 3.9 | 3.9 |
| Musculoskeletal and connective tissue disorders | 8.4 | 10.6 | 10.3 |
| Neoplasms benign, malignant and unspecified (including cysts and polyps) | 0 | 0 | 0 |
| Nervous system disorders | 19.5 | 20.4 | 21.6 |
| Pregnancy, puerperium and perinatal conditions | 0.1 | 0 | 0 |
| Psychiatric disorders | 2.6 | 2.2 | 2.1 |
| Renal and urinary disorders | 0.2 | 0.3 | 0.4 |
| Reproductive system and breast disorders | 0.2 | 0.1 | 0.3 |
| Respiratory, thoracic and mediastinal disorders | 9.3 | 11.8 | 11.4 |
| Skin and subcutaneous disorders | 35.2 | 40.0 | 37.6 |
| Social circumstances | 0.2 | 0.1 | 0.1 |
| Surgical and medical procedures | 0.1 | 0.1 | 0 |
| Vascular disorders | 3.1 | 3.4 | 4.2 |
Primary reason for reporting
Table 5 shows the results of the Medical Case Review classification of the 3,508 AEFI reports following vaccines administered in 2012 including, for each main category, the AEFI and SAE reporting rates per 100,000 doses distributed and the proportion of specific AEFI types.
| Adverse events following immunization (AEFI) category | Total AEFI/ Serious adverse events (SAE) | Reporting rate per 100,000 doses distributed | Category distribution by specific type of AEFI |
Type % SAE | |
|---|---|---|---|---|---|
| All cases | SAE | ||||
| Reactions at or near the vaccination site | 1,238/20 | 5.25 | 0.08 | 1.5% Abscess | 5 |
| 17% Cellulitis | 7 | ||||
| 14% Extensive limb swelling | 2 | ||||
| 1.5% vaccinated limb pain >7 days | 0 | ||||
| 66% Other local reaction | 0.1 | ||||
| Allergic or allergic-like events | 443/10 | 1.88 | 0.04 | 11.7% Anaphylaxis | 12 |
| 8.6% Oculo-respiratory syndrome | 3 | ||||
| 79.7% Other allergic event | 0.5 | ||||
| Neurologic events | 147/64 | 0.62 | 0.27 | 6.1% Encephalitis/Myelitis | 67 |
| 0.7% Ataxia/Cerebellitis | 100 | ||||
| 1.4% Aseptic meningitis | 100 | ||||
| 3.4% Guillain-Barré syndrome | 80 | ||||
| 9.5% Bell's palsy | 7 | ||||
| 1.4% Other paralysis of >1 day duration | 50 | ||||
| 67.3% Seizure | 43 | ||||
| 10.2% Other neurologic event | 40 | ||||
| Rash alone | 694/0 | 2.94 | 0 | ||
| Other events specified on CAEFISS report form | 153/21 | 0.65 | 0.09 | 11.8% Arthritis | 0 |
| 19.6% Hypotonic Hyporesponsive Episode | 33 | ||||
| 2.6% Intussusception | 50 | ||||
| 41.8% Paraesthesia | 0 | ||||
| 5.2% Parotitis | 0 | ||||
| 11.1% Persistent crying | 0 | ||||
| 7.8% Thrombocytopenia | 75 | ||||
| Systemic events not otherwise specified on the CAEFISS report form | 390/52 | 1.65 | 0.22 | 14.9% Fever only | 7 |
| 22.9% Infection | 20 | ||||
| 7.7% Influenza-like illness | 3 | ||||
| 28% Other general symptoms | 7 | ||||
| 21.8% Rash with fever/other symptoms add 1 which was SAE | 11 | ||||
| 4.7% Syndrome | 61 | ||||
| Immunization anxiety | 38/2 | 0.16 | <0.01 | ||
| Miscellaneous other events | 337/20 | 1.43 | 0.08 | 50.7% Gastrointestinal disorder (not intussusception) | 3.5 |
| 1.2% Immunization failure | 50 | ||||
| 48.1% Other | 7 | ||||
| Immunization error, no AEFI | 68/0 | 0.29 | 0 | ||
|
|||||
Table 6 shows the severity and age group distribution within and across the primary AEFI categories. Reactions at or near the vaccination site and rash alone made up 55.1% of all reports received for vaccines administered in 2012 but only 11.2% of SAE reports. In contrast neurologic events accounted for only 4.2% of all reports for 2012 but 43.5% of SAE reports. The IMPACT network, which actively looks for neurologic events, reported 45 (70%) of the 64 serious neurologic events.
| Primary AEFI category (total case reports in category) | ||||||||||
|---|---|---|---|---|---|---|---|---|---|---|
| V-site (1,238) | Allergic (443) | Neuro-logic (147) |
Rash alone (694) |
Other speci-fied (153) |
System-ic (390) | Anxiety (38) | Misc. other (337) |
V-error (no AEFI) (68) |
||
| Severity distribution by AEFI categoryTable 6 - Footnote 1 | Serious | 1.6 | 2.2 | 43.5 | 0 | 13.7 | 13.3 | 5.3 | 5.6 | 0 |
| High impact | 1.1 | 3.6 | 4.1 | 0.7 | 4.6 | 4.4 | 10.5 | 2.7 | 0 | |
| Moderate impact | 57.2 | 50.8 | 40.8 | 47.6 | 41.8 | 45.1 | 63.2 | 39.8 | 0 | |
| Low impact | 28.2 | 32.3 | 5.4 | 40.9 | 31.4 | 25.6 | 21.1 | 30.9 | 55.9 | |
| Unspecified | 11.9 | 11.3 | 6.1 | 10.8 | 8.5 | 11.5 | 0 | 21.1 | 44.1 | |
| AEFI category distribution by level of severityTable 6 - Footnote 2 | Serious | 10.7 | 4.8 | 34.2 | 0.5 | 11.2 | 27.3 | 1.1 | 10.2 | 0 |
| High impact | 17.9 | 20.5 | 7.7 | 6.4 | 9.0 | 21.8 | 5.1 | 11.5 | 0 | |
| Moderate impact | 41.1 | 13.1 | 3.5 | 19.2 | 3.7 | 10.2 | 1.4 | 7.8 | 0 | |
| Low impact | 32.3 | 13.2 | 0.7 | 26.2 | 4.4 | 9.2 | 0.7 | 9.6 | 3.5 | |
| Unspecified | 33.4 | 11.4 | 2.0 | 17.0 | 3.0 | 10.2 | 0 | 16.1 | 6.8 | |
| Age group distribution by AEFI categoryTable 6 - Footnote 1 | <1 year | 3.9 | 7.7 | 17.7 | 18.4 | 35.3 | 23.6 | 0 | 30.6 | 20.6 |
| 1 to <2 years | 11.4 | 6.8 | 40.1 | 28.8 | 4.6 | 28.2 | 0 | 5.3 | 19.1 | |
| 2 to <7 years | 23.6 | 7.2 | 8.2 | 11.5 | 0.7 | 11.5 | 7.9 | 4.5 | 2.9 | |
| 7 to <18 years | 12.0 | 20.8 | 9.5 | 15.3 | 7.8 | 8.5 | 55.3 | 12.8 | 11.8 | |
| 18 to <65 years | 34.2 | 48.8 | 19.7 | 22.5 | 46.4 | 22.1 | 28.9 | 35.0 | 20.6 | |
| 65+ years | 14.5 | 8.1 | 4.1 | 3.2 | 4.6 | 5.4 | 7.9 | 8.9 | 1.5 | |
| Unknown | 0.4 | 0.7 | 0.7 | 0.3 | 0.7 | 0.8 | 0 | 3.0 | 23.5 | |
| AEFI category distribution by age groupTable 6 - Footnote 2 | <1 year | 9.6 | 6.8 | 5.2 | 25.7 | 10.8 | 18.4 | 0 | 20.6 | 2.8 |
| 1 to <2 years | 24.4 | 5.2 | 10.2 | 34.6 | 1.2 | 19.0 | 0 | 3.1 | 2.2 | |
| 2 to <7 years | 60.6 | 6.6 | 2.5 | 16.6 | 0.2 | 9.3 | 0.6 | 3.1 | 0.4 | |
| 7 to <18 years | 31.2 | 19.2 | 2.9 | 22.2 | 2.5 | 6.9 | 4.4 | 9.0 | 1.7 | |
| 18 to <65 years | 37.7 | 19.2 | 2.6 | 13.9 | 6.3 | 7.6 | 1.0 | 10.5 | 1.2 | |
| 65+ years | 58.7 | 11.8 | 2.0 | 7.2 | 2.3 | 6.9 | 1.0 | 9.8 | 0.3 | |
| Unknown | 35.3 | 12.6 | 4.2 | 19.8 | 4.4 | 11.1 | 1.1 | 9.6 | 1.9 | |
Children aged 1 to <2 years contributed the largest proportion of reports in the neurologic, rash alone, and systemic primary AEFI categories. Children aged 7 to <18 years accounted for 55.3% of the vaccination-related anxiety reactions. Adults aged 18 to <65 were the most prevalent age group for vaccination site, allergic, other specified, and miscellaneous primary AEFI categories. Within each age category the most frequent primary AEFI group reported was vaccination site reactions for all ages 2 years and older versus rash alone for those aged <2 years.
Vaccines administered in 2012
Table 7 lists the vaccines for which at least one AEFI report was received for vaccine administered during the 2012 calendar year, grouped by antigenic content as well as whether or not they were included in Canada's publicly funded immunization programs for routine or limited use, or sold primarily on the private market. For each antigenic grouping, the table provides data on the proportion of reports where there was only a single vaccine given, the total count for AEFI and SAE reports following vaccines administered in 2012, as well as combined 2011−2012 reporting rates per 100,000 doses distributed. Caution is needed in interpreting variation in reporting rates. One notable example is the nearly 4-fold higher rate observed for DTaP-IPV-HB-Hib relative to DTaP-IPV-Hib vaccines, both of which are used for infants at 2, 4 and 6 months of age. The HB containing product is used predominantly in British Columbia which has a significantly higher reporting rate than other provinces (data not shown). Also the doses distributed information does not account for returned or wasted dosages and at best it is a poor proxy for reporting rates for vaccines administered, which are not presently available across Canada.
| Targeted infections | Vaccines marketed in Canada trade name (MAHTable 7 - Footnote 2) | Vaccine group abbrevia-tion | % only vaccine given | 2012 AEFI |
2012 SAE (% AEFI) |
Combined 2011−2012 AEFI reporting rate per 100,000 doses distributed | |
|---|---|---|---|---|---|---|---|
| Vaccines used in publicly funded immunization programs | |||||||
| Diphtheria, Tetanus, Pertussis | Adacel® (SP) Boostrix™ (GSK) | Tdap | 67 | 334 | 3(0.9) | 20.0 | |
| Diphtheria, Tetanus, Pertussis, Polio |
Quadracel® (SP), Infanrix™-IPV (GSK) | DTaP-IPV | 53 | 176 | 6(3.4) | 101.0 | |
| Adacel®-Polio (SP), Boostrix®-Polio (GSK) | Tdap-IPV | 57 | 60 | 1(1.7) | 15.2 | ||
| Diphtheria, Tetanus, Pertussis, Polio, H. influenzae type b |
Pediacel® (SP), Infanrix™-IPV/Hib (GSK), | DTaP-IPV-Hib | 42 | 498 | 38(7.6) | 37.6 | |
| Diphtheria, Tetanus, Pertussis, Polio, H. influenzae type b, Hepatitis B |
Infanrix hexa™ (GSK) | DTaP-HB-IPV-Hib | 16 | 214 | 12(5.6) | 148.2 | |
| Diphtheria, Tetanus, Polio | Td Polio Adsorbed (SP) | Td-IPV | 47 | 15 | 1(6.7) | 22.1 | |
| Diphtheria, Tetanus | Td Adsorbed (SP) | Td | 54 | 80 | 2(2.5) | 10.3 | |
| Invasive pneumococcal disease | Prevnar® (Pfiz), Synflorix™ (GSK), Prevnar®13 (Pfiz) | Pneu-C | 6 | 682 | 78(11.4) | 56.8 | |
| Pneumo® 23 (SP), Pneumovax® 23 (MF) | Pneu-P-23 | 50 | 228 | 18(7.9) | 38.0 | ||
| Invasive meningococcal disease | Meningitec® (Pfiz), Menjugate® (NP), Neis Vac-C® (GSK) | Men-C-C | 6 | 468 | 61(13.0) | 85.2 | |
| Menactra® (SP), Menveo™ (NVD), Nimenrix™ (GSK) | Men-C-ACYW-135 | 48 | 84 | 2(2.4) | 23.7 | ||
| Menomune® - A/C/Y/W-135 (SP) | Men-P-ACYW-135 | 0 | 2 | 0 | NCTable 7 - Footnote 3 | ||
| Hepatitis B | Engerix® -B (GSK), Recombivax HB® (MF) | HB | 38 | 213 | 11(5.2) | 22.0 | |
| Hepatitis A, Hepatitis B | Twinrix® & Twinrix® Junior (both GSK) | HAHB | 56 | 90 | 3(3.3) | 10.1 | |
| Hepatitis A | Avaxim® & Avaxim®-Pediatric (both SP), Havrix®1440 & Havrix®720Junior (both GSK), Vaqta® (MF) |
HA | 24 | 70 | 2(2.9) | 14.1 | |
| Hepatitis A, Typhoid | ViVAXIM™ (SP) | HA-Typh-I | 46 | 11 | 0 | 20.8 | |
| Measles, Mumps, Rubella | M-M-R® II (MF), Priorix® (GSK) | MMR | 20 | 393 | 29(7.4) | 68.2 | |
| Measles, Mumps, Rubella + Varicella |
Priorix-Tetra™ (GSK) | MMRV | 17 | 163 | 42(25.8) | 53.7 | |
| Varicella | Varilrix® (GSK), Varivax® III (MF) | Var | 22 | 358 | 16(4.5) | 74.0 | |
| Influenza | Fluviral® (GSK), Vaxigrip® & Intanza™ (both SP), Agriflu® (NVD), Fluad® (NP), DInfluvac® (API) Flumist® (AZC) |
Inf | 82 | 913 | 36(3.9) | 8.5 | |
| Human Papillomavirus | Gardasil® (MF), Cervarix™ (GSK) | HPV | 65 | 185 | 9(4.9) | 29.8 | |
| Rotavirus | Rotarix™ (GSK), RotaTeq® (MF) | Rota | 11 | 228 | 21(9.2) | 30.5 | |
| Special use vaccines (publicly funded in selected situations) | |||||||
| Tuberculosis | BCG (SP) | BCG | 100 | 5 | 0 | NCTable 7 - Footnote 3 | |
| Rabies | Imovax® Rabies(SP), RabAvert® (NP) | Rab | 85 | 39 | 0 | 135.1 | |
| Non-publicly funded vaccines | |||||||
| Herpes Zoster | Zostavax® (MF) | Zos | 91 | 80 | 2(2.5) | 27.7 | |
| H. influenza type b | ACT-HIB® (SP), Hiberix® (GSK), Liquid PedvaxHib®(MF) | Hib | 6 | 16 | 3(18.8) | 63.8 | |
| Polio | Imovax® Polio (SP) | IPV | 3 | 29 | 0 | 28.2 | |
| Cholera | Dukoral® (CV) | Chol-Ecol-O | 77 | 26 | 1(3.8) | 10.5 | |
| Japanese Encephalitis | IXIARO® (NP) | JE | 57 | 7 | 1(14.3) | NCTable 7 - Footnote 3 | |
| Tickborne Encephalitis | FSME-IMMUN™ (Bax) | TBE | 100 | 1 | 0 | NCTable 7 - Footnote 3 | |
| Typhoid | Typherix™ (GSK), Typhim Vi® (SP), Vivotif ® (CV) | Typh-I/O | 42 | 43 | 1(2.3) | 18.4 | |
| Yellow Fever | YF-Vax® (SP) | YF | 24 | 25 | 0 | 33.5 | |
|
|||||||
Figure 2 shows the total distribution of primary AEFI by vaccine group. Reactions at or near the vaccination site made up over 50% of reports involving DTap-IPV, Tdap-IPV, Td, Pneu-P-23, and Zos vaccines. Neurologic events made up 24% of all reports for MMRV but a much smaller fraction of other vaccines including MMR.
Figure 2: Primary adverse event following immunization (AEFI) distribution by vaccine group
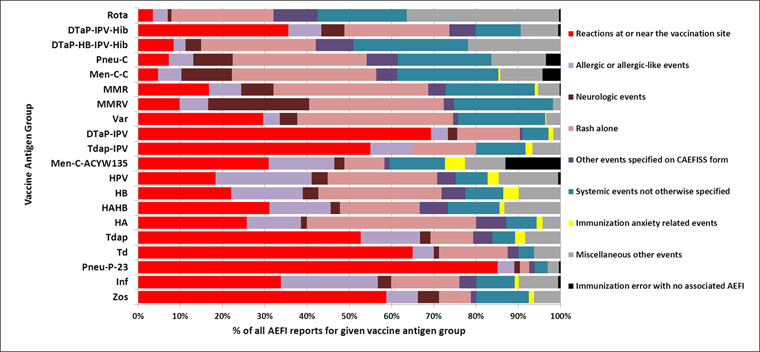
Text Equivalent - Figure 2
This figure is a bar graph on showing the distribution of primary adverse events by vaccine group. The y axis lists twenty vaccine antigenic groups commonly available in Canada. The x axis represents the percentage of all AEFI reports for the given vaccine antigen group and ranges from zero at unity to 100%. The horizontal bars are color coded with different colors for the primary AEFIs. Overall, the most common reported AEFI was for reactions at or near the vaccination site and ranged from over 85% for reports involving Pneumococcal 23-valent polysaccharide vaccines (Pneu-P-23) to less than 5% for those involving Rotavirus vaccines. Rash ranged from 40% of AEFI reports for Hepatitis A vaccine to less than 5% of reports for Pneumococcal 23-valent polysaccharide vaccines. Allergic or allergic-like events ranged from 25% of AEFI reports for Human papillomavirus virus (HPV) vaccine to less than 5% of reports for the combination Diphtheria, Tetanus, acellular Pertussis, Hepatitis B, Inactivated Polio and Haemophilus influenzae type b (DTaP-HB-IPV-Hib) vaccine. The least commonly reported AEFI was for immunization anxiety related events that ranged from nil to 1% among reports for most vaccines up to 2.4 to 4.8% for reports involving vaccines given predominantly to school-age children, namely Tdap, HPV, HB and Quadrivalent conjugate meningococcal vaccines (Men-C-ACYW-135).
Serious adverse events by primary reason for reporting
Among 188 serious AEFI reports received for vaccines administered in 2012, the reason for seriousness was hospital admission for 183 and fatal outcome for 5. None of the deaths were considered related to vaccine, as discussed further below.
Three deaths occurred in adults 3 minutes, 35 minutes, and five days following inactivated influenza vaccines (two different manufacturers and one unidentified product) for an overall reporting rate of 0.3 per 1 million influenza vaccine doses distributed). All were sudden in onset involving cardiac arrest and all had pre-existing cardiac disease as the likely cause of death.
One death followed a second dose of MMR vaccine given to a school-aged child (reporting rate of 1.45 per million doses distributed). No other vaccines were given. There was an acute onset of fever within one day of vaccination and an afebrile seizure three days later which progressed to status epilepticus and resulted in a refractory coma. Death occurred several weeks later. Neuro-imaging revealed a right temporal focal abnormality but no etiology was found despite extensive investigation. The timing of onset did not support a vaccine-associated cause of illness.
Finally, there was one death in a toddler within one day after immunization with DTaP-IPV-Hib alone (reporting rate of 0.7 per million doses distributed). A coroner's investigation revealed an acute respiratory infection as the cause of death.
There were 64 serious neurologic events of which 43 were seizures, mostly febrile. Of 42 where outcome was known, all but one had full recovery; the exception was a known case of tuberous sclerosis with infantile spasms. Six cases followed a single vaccine (MMR, HPV, Inactivated influenza, DTaP-IPV-HB-Hib, Var, HAHB) and the remainder followed administration of two or more vaccines. All but eight cases involved MMR or MMRV usually given with pneumococcal and/or meningococcal conjugate vaccines. The reporting rate per 100,000 doses distributed for measles-containing vaccines where time to onset after vaccination was in the expected risk interval of 5−12 days was 1.08 for MMR and 4.83 for MMRV. The increased risk of febrile seizure following MMRV relative to MMR is now well known and has been documented recently in Canada Footnote 42.
The remaining 21 serious neurologic events involved several different entities. There were 11 cases of possible demyelinating disease. Guillain-Barré syndrome was reported four times, three of which followed 10, 11 and an unknown number of days after Td-containing vaccines, and one that onset 24 hours after pneumococcal polysaccharide vaccine. There were two cases of acute encephalitis; one with an onset 11 days after MMRV given alone, and the other with an onset 22 days after MMRV was given with pneumococcal and meningococcal conjugate vaccines. Causality was not proven for either case, but live attenuated vaccine virus could have caused the illness. Both cases had full recovery. There were two reports of acute disseminated encephalomyelitis: one following 1 day and 29 days after the second and first doses of JE vaccine, respectively; and the other following 13 days after the first dose of HPV and HB vaccines. Neither case met the Brighton criteria for diagnostic certainty, so causality could not be assessed. There was one case of transverse myelitis that onset five days after MMR but there was a concurrent viral infection that was the likely cause. In addition, there was one case of optic neuritis that onset seven days after the second dose of HPV vaccine. No other explanation was apparent and vaccine may have contributed. Finally, there was a single case of encephalomyelitis that onset within one day of DTaP-IPV-Hib and Pneu-C. The timing did not fit a vaccine cause of illness and an enteroviral infection was the suspected cause. The other serious neurologic cases followed a variety of different vaccines none of which were considered likely causes of the reported events that included: two aseptic meningitis; one Bell's palsy; one other paralysis lasting longer than one day; one cerebellar ataxia; one stroke; two temporary cases of confusion; and one conversion disorder.
There were 20 SAE reports involving reactions at or near the vaccination site, including: 15 cellulitis; three extensive limb swelling; one abscess; and one that could not be sub-classified. In all cases, the reason for seriousness was hospital admission, primarily for intravenous antibiotic therapy. Implicated vaccines included: pneumococcal polysaccharide (14 reports, 7 with no other vaccine); inactivated influenza (nine reports, three with no other vaccine); and two DTaP-IPV-Hib (one with no other vaccine). The time to onset following immunization was within 24 hours for 16 reports and two days for four reports.
Among ten serious allergic events, six were reported as anaphylaxis (one Brighton Level 1, two Level 2, and three Level 4), one as ORS, and three as other allergic reaction. Onset was within 30 minutes for six events, 1 hour to <24 hours for two events, 17 days for one event, and unknown for one other. The implicated vaccines for anaphylaxis included two HB given alone, two inactivated influenza given alone, and two DTaP-IPV-Hib, one given alone, and one with Men-C-C and Pneu-C. The only unusual event was a case diagnosed as type IV hypersensitivity with secondary hepatitis in a middle-aged adult that onset 17 days after administration of a second dose of Chol-Ecol-O, and 39 days after HAHB and Typh-I/O. Causality could not be further assessed given lack of sufficient detail, but the individual made a full recovery.
Among other events specified on the CAEFISS form, SAE reports included ten HHE, nine thrombocytopenia, and two intussusception. None of these were unexpected, given known associations although several had alternate explanations.
The remaining SAE reports classified by the Medical Case Review as systemic (52 cases), miscellaneous other (20 cases), or immunization anxiety (two cases) events covered a broad range of specific diagnoses, vaccines and age groups. There was no significant clustering of any one type of event or vaccine group and nothing considered to be of concern.
Discussion
This report represents the first annual safety report for vaccines administered in Canada in a given calendar year using a uniform presentation format. Several caveats must be understood in interpreting CAEFISS data. Surveillance does not capture all events nor are there reliable denominators for vaccines administered, so AEFI incidence cannot be calculated or extrapolated from the data. Reports vary in terms of completeness and adherence to national case definitions. Reporting rates are affected by many factors including age, geographic jurisdiction, newness of a given vaccine program, and degree of public controversy over real or perceived safety concerns. While this report summarizes our experience over the last eight years, the information provided to CAEFISS is reviewed regularly during the year to identify any unusual or unanticipated increases in SAEs and acted upon accordingly.
The main purpose of post-market surveillance is to detect new or unusual safety concerns that may signal previously unknown associations between a given vaccine and event or changes in expected safety profiles in terms of frequency or severity of selected adverse events. Thus, while reporting of suspected associations is encouraged, it must be remembered that a report is not proof that vaccine(s) caused a given event. AEFIs by their very name are a temporal association whereby an event follows immunization. The cause of that event could be due to an inherent property of vaccine, a manufacturing quality problem, an error in one or more steps involving the immunization process, anxiety related to immunization, or a coincidental event completely unrelated to vaccine or immunization Footnote 22. It is rarely possible to determine a specific cause based on what is reported to national systems such as CAEFISS. Further investigation is always required when a signal is detected to determine causality—both at the individual and at the population level. Nevertheless, the data presented in this report do provide a profile over time that can be used to make general conclusions regarding CAEFISS as a surveillance system and the safety of vaccines administered in Canada.
First, Canada has a strong vaccine safety surveillance system as a result of decades of synergistic collaboration between regional and federal public health authorities in collaboration with key partners, described more fully elsewhere in this supplement. Canada's overall annual AEFI reporting rate of 10.1 per 100,000 population is high relative to most other countries with similar immunization schedules, including the United States (rate of 4.4 for vaccines administered 1991−2001) Footnote 13, Europe (2005 rates under 5 for France, Germany, Great Britain, Italy and Spain, 6−7 for Netherlands and Norway, 9.8 for Sweden, and 18.5 for Finland) Footnote 43, and appear comparable to Australia (10.4 in 2011) but are likely higher Footnote 14. Canada and most other countries use individual case reports as the numerator for population-based rates whereas Australia uses individual adverse events which often exceed one per case report. Given similar immunization programs the higher AEFI reporting rates in Canada reflect the high degree of vigilance by Canada's public health immunization authorities to report AEFI as well as the active surveillance component by IMPACT.
Second, the safety profile of vaccines administered in Canada is very good. The vast majority of reported AEFIs are of low severity and resolve fully. The only notable cluster of serious events for vaccines administered in 2012 were febrile seizures during the second year of life, most likely the result of measles-containing vaccines, with the highest rate associated with MMRV. These are expected, albeit frightening, events for all concerned. It is essential that realistic risk-benefit information be provided to parents and caregivers along with advice for what to do should such an event occur.
Finally, the Medical Case Review classification, initiated nationally by the Vaccine Safety Section of the Public Health Agency of Canada in 2011, provides an additional framework for presenting AEFI data that is hoped to be more useful for public health, clinical and public stakeholders than previous report summaries based on regulatory coding frameworks such as MedDRA. Both frameworks are useful and thus are included in this report. The System Organ Class data provide a means to compare this report to those published by national regulatory agencies and Market Authorization Holders. The Medical Case Review classification is closely aligned with the CAEFISS report form and is also used for PHAC's web-based quarterly summaries of AEFI reports received Footnote 44. The Medical Case Review also provides an important added tool for timely expert review of all SAE reports received at PHAC and facilitates quality assurance activities.
Acknowledgements
This report could not be done without the contributions of all CAEFISS participants including F/P/T immunization authorities, especially those participating in the Vaccine Vigilance Working Group, the IMPACT network, and the entire staff of the Vaccine Safety Section at PHAC. We would also like to thank each and every individual who takes the time to submit an AEFI report for their contribution to vaccine safety in Canada.
Conflict of interest
None
Funding
This work was funded, in entirety, by the Public Health Agency of Canada.
Page details
- Date modified: