
Lyme disease in Ontario 2017

 Download this article as a PDF
Published by: The Public Health Agency of Canada
Issue: Volume 44-10: Climate change and Lyme disease
Date published: October 4, 2018
ISSN: 1481-8531
Submit a manuscript
About CCDR
Browse
Volume 44-10, October 4, 2018: Climate change and Lyme disease
Surveillance
The continued rise of Lyme disease in Ontario, Canada: 2017
MP Nelder1, S Wijayasri1, CB Russell1, KO Johnson1, A Marchand‑Austin2, K Cronin2,8, S Johnson3, T Badiani1, SN Patel4,5, D Sider6,7
Affiliations
1 Enteric, Zoonotic and Vector-Borne Diseases Communicable Diseases, Emergency Preparedness and Response, Public Health Ontario, Toronto, ON
2 Laboratory Surveillance and Data Management, Public Health Ontario Laboratories, Public Health Ontario, Toronto, ON
3 Informatics, Knowledge Services, Public Health Ontario, Toronto, ON
4 Public Health Ontario Laboratory - Toronto, Public Health Ontario, Toronto, ON
5 Department of Laboratory Medicine and Pathobiology, University of Toronto, Toronto, ON
6 Communicable Diseases, Emergency Preparedness and Response, Public Health Ontario, Toronto, ON
7 Department of Clinical Epidemiology and Biostatistics, McMaster University, Hamilton, ON
8 National Microbiology Laboratory, Public Health Agency of Canada, Winnipeg, MB
Correspondence
Suggested citation
Nelder MP, Wijayasri S, Russell CB, Johnson KO, Marchand‑Austin A, Cronin K, Johnson S, Badiani T, Patel SN, Sider D. The continued rise of Lyme disease in Ontario, Canada: 2017. Can Commun Dis Rep 2018;44(10):231-6. https://doi.org/10.14745/ccdr.v44i10a01
Keywords: Borrelia, epidemiology, expansion, Ixodes ticks, public health, range, risk, surveillance
Abstract
Background: Lyme disease is an infection caused by the spirochete Borrelia burgdorferi and, in most of North America, is transmitted by the blacklegged tick Ixodes scapularis. Climate change has contributed to the expansion of the geographic range of blacklegged ticks in Ontario, increasing the risk of Lyme disease for Ontarians.
Objective: To identify the number of cases and incidence rates, as well as the geographic, seasonal and demographic distribution of Lyme disease cases reported in Ontario in 2017, with comparisons to historical trends.
Methods: Data for confirmed and probable Lyme disease cases with episode dates from January 1, 2012, through December 31, 2017, were extracted from the integrated Public Health Information System (iPHIS). Data included public health unit (PHU) of residence, episode date, age and sex. Population data from Statistics Canada were used to calculate provincial and PHU-specific incidence rates per 100,000 population. The number of cases reported in 2017 by PHU of residence, month of occurrence, age and sex was compared to the 5-year averages for the period 2012–2016.
Results: There were 959 probable and confirmed cases of Lyme disease reported in Ontario in 2017. This was three times higher than the 5-year (2012–2016) average of 313. The provincial incidence rate for 2017 was 6.7 cases per 100,000 population, although this varied markedly by PHU. The highest incidence rates were found in Leeds-Grenville and Lanark District (128.8 cases per 100,000), Kingston‑Frontenac, Lennox and Addington (87.2 cases per 100,000), Hastings and Prince Edward Counties (28.6 cases per 100,000), Ottawa (18.1 cases per 100,000) and Eastern Ontario (13.5 cases per 100,000). Cases occurred mostly from June through September, were most common among males, and those aged 5–14 and 50–69 years.
Conclusion: In 2017, Lyme disease incidence showed a marked increase in Ontario, especially in the eastern part of the province. If current weather and climate trends continue, blacklegged ticks carrying tick-borne pathogens, such as those causing Lyme disease, will continue to spread into suitable habitat. Monitoring the extent of this geographic spread will inform future clinical and public health actions to detect and mitigate the impact of Lyme disease in Ontario.
Introduction
Lyme disease is a spirochete infection caused by Borrelia burgdorferi and, in much of North America, is transmitted to humans through the bite of an infectious blacklegged tick Ixodes scapularis. The B. burgdorferi infection typically begins with a rash and influenza-like symptoms Footnote 1Footnote 2Footnote 3Footnote 4Footnote 5Footnote 6. In the majority of cases, treatment with antibiotics results in full recovery. However, if unrecognized and left untreated, infection can progress to disseminated disease with an increased probability of morbidity, long-term sequelae and post-treatment Lyme disease syndrome Footnote 7Footnote 8Footnote 9.
Lyme disease case counts in Canada increased by a factor of six from 2009 through 2015, with the majority of cases reported in Ontario Footnote 10. This has been associated with an expansion in the geographic range of blacklegged ticks in Canada, including northern regions of Ontario. A driving force behind this expansion is climate change, i.e. an increase in annual cumulative degree days above 0 °C Footnote 11Footnote 12Footnote 13. Public health officials in Ontario monitor Lyme disease risks by conducting blacklegged tick surveillance and reporting human cases of Lyme disease.
An understanding of Lyme disease epidemiology is essential to inform clinical and public health efforts to increase awareness, prevention, early detection and mitigation efforts. The objective of this study was to identify the number of cases and incidence rates as well as the geographic, seasonal and demographic distribution of Lyme disease cases reported in Ontario in 2017, and compare this to historical trends over the previous five years.
Methods
Study location and population
Ontario has a population of approximately 14.2 million that is largely concentrated in the south of the province Footnote 14. Southern Ontario has a moderate, humid, continental climate and mixtures of agricultural, deciduous/mixed forests and built environments Footnote 15. In 2017, 36 public health units (PHUs) administered public health services in Ontario, including human Lyme disease case follow-up and blacklegged tick surveillance.
Data collection and analysis
When notified of a new case of Lyme disease, public health professionals conduct follow-up of cases and collect information pertaining to demographics, exposures, symptoms, hospitalizations and deaths. If the case meets the provincial surveillance case definition (see text box), then all the data are reported to the provincial integrated Public Health Information System (iPHIS).
Ontario’s surveillance case definitions for confirmed and probable cases of Lyme disease (2012–2017): Ontario, Canada Footnote 16
CONFIRMED CASE
- clinician-confirmed erythema migrans greater than 5 cm in diameter in a person with a history of residence in, or visit to, a Lyme disease endemic area or risk area OR
- clinical evidence of Lyme disease with laboratory confirmation by polymerase chain reaction (PCR) or culture OR
- clinical evidence of Lyme disease with laboratory support by serological methods, and a history of residence in, or visit to, an endemic area or risk area
PROBABLE CASE
- clinical evidence of Lyme disease with laboratory support by serological methods, but with no history of residence in, or visit to an endemic area or risk area OR
- clinician-confirmed erythema migrans greater than 5 cm in diameter but with no history of residence in, or visit to an endemic area or risk area
For this study, we extracted data from the iPHIS for confirmed and probable Lyme disease cases with episode dates from January 1, 2012, through December 31, 2017, and calculated the number and proportion of cases by PHU of residence, month of occurrence, age and sex.
We used an individual’s PHU of residence and earliest episode date in calculating case counts and incidence rates. Episode dates also enabled us to determine seasonality. Episode dates were defined as the date of earliest symptom onset, specimen collection or date reported. Due to the incompleteness of data and the possibility of multiple exposure opportunities, we did not attempt to determine if a case was locally acquired (exposure within PHU of residence) or travel related (travel outside of PHU of residence). Population estimates (2012–2016) and projections (2017), obtained from Statistics Canada via IntelliHEALTH Ontario, were used to calculate provincial and PHU-specific incidence rates per 100,000 population. We aggregated Lyme disease incidence rates by PHUs for mapping using a geographic information system, ESRI ArcGIS v10.3 (Incidence rates by PHU were then manually organized into incidence rate classes: 0, 0.1–5.0, 5.1–10.0, 10.1–30.0, >30.0). The 2017 data were compared to the 5-year averages for the period 2012–2016. Descriptive analyses were conducted using Microsoft Excel 2010 (Microsoft, Redmond, Washington, US) and SAS 9.3 (Statistical Analysis System, Cary, North Carolina, US).
This manuscript reports on routine surveillance activities and not research; therefore, research ethics committee approval was not required. Data are available upon request via Public Health Ontario (PHO) at http://www.publichealthontario.ca/en/About/Pages/privacy.aspx.
Results
Case counts, incidence rates and geographic distribution
In 2017, there were 959 confirmed and probable cases of Lyme disease reported in Ontario (Figure 1).
Figure 1: Number of probable and confirmed Lyme disease cases and incidence rate per 100,000 population by year: Ontario, Canada (2012–2017)

Text description: Figure 1
| Year | Confirmed | Probable | Total | Overall Rate (per 100,000 population) |
|---|---|---|---|---|
| 2012 | 107 | 66 | 173 | 1.3 |
| 2013 | 180 | 126 | 306 | 2.3 |
| 2014 | 161 | 91 | 252 | 1.8 |
| 2015 | 379 | 69 | 448 | 3.2 |
| 2016 | 326 | 60 | 386 | 2.8 |
| 2017 | 867 | 92 | 959 | 6.7 |
The 2017 total was 3.1 times higher than the 5-year (2012–2016) average of 313 (Table 1). The majority of cases in 2017 were reported by Leeds-Grenville and Lanark District (LGL) (n=219, 22.8% of the provincial total), Kingston‑Frontenac, Lennox and Addington (KFL) (n=180, 18.8%) and Ottawa (n=180, 18.8%). These three PHUs made up 9.7% of the Ontario population, yet reported 60.4% of the province’s Lyme disease cases. In 2017, the LGL case count was 4.6 times higher than the 5-year average; KFL and Ottawa counts were 3.6 and 3.8 times higher than their 5-year averages, respectively.
| Public health unitTable 1 footnote a | Number of cases | % | 5-year average | Incidence per 100,000 population |
|---|---|---|---|---|
| Algoma District (ALG) | 2 | 0.2 | 2.5 | 1.7 |
| Brant County (BRN) | 1 | 0.1 | 2.0 | 0.7 |
| Chatham-Kent (CHK) | 3 | 0.3 | 2.2 | 2.9 |
| City of Hamilton (HAM) | 5 | 0.5 | 6.2 | 0.9 |
| Ottawa (OTT) | 180 | 18.8 | 47.4 | 18.1 |
| Durham Regional (DUR) | 46 | 4.8 | 14.2 | 6.7 |
| Eastern Ontario (EOH) | 28 | 2.9 | 17.0 | 13.5 |
| Elgin-St. Thomas (ELG) | 0 | 0.0 | 1.3 | 0.0 |
| Grey Bruce (GBO) | 3 | 0.3 | 2.0 | 1.8 |
| Haldimand-Norfolk (HDN) | 7 | 0.7 | 2.2 | 6.3 |
| Haliburton-Kawartha-Pine Ridge District (HKP) | 17 | 1.8 | 5.2 | 9.3 |
| Halton Regional (HAL) | 13 | 1.4 | 7.4 | 2.2 |
| Hastings and Prince Edward Counties (HPE) | 47 | 4.9 | 18.2 | 28.6 |
| Huron County (HUR) | 1 | 0.1 | 1.7 | 1.7 |
| Kingston‑Frontenac and Lennox & Addington (KFL) | 180 | 18.8 | 49.6 | 87.2 |
| Lambton County (LAM) | 1 | 0.1 | 3.0 | 0.8 |
| Leeds-Grenville and Lanark District (LGL) | 219 | 22.8 | 47.8 | 128.8 |
| Middlesex-London (MSL) | 15 | 1.6 | 5.2 | 3.1 |
| Niagara Regional (NIA) | 19 | 2.0 | 9.2 | 4.1 |
| North Bay Parry Sound District (NPS) | 1 | 0.1 | 1.3 | 0.8 |
| Northwestern (NWR) | 2 | 0.2 | 3.2 | 2.5 |
| Oxford County (OXF) | 2 | 0.2 | 1.8 | 1.8 |
| Peel Regional (PEE) | 12 | 1.3 | 5.8 | 0.8 |
| Perth District (PDH) | 1 | 0.1 | 1.3 | 1.3 |
| Peterborough County-City (PTC) | 12 | 1.3 | 2.8 | 8.4 |
| Porcupine (PQP) | 0 | 0.0 | 1.0 | 0.0 |
| Renfrew County and District (REN) | 7 | 0.7 | 3.2 | 6.5 |
| Simcoe Muskoka District (SMD) | 12 | 1.3 | 3.8 | 2.1 |
| Sudbury and District (SUD) | 3 | 0.3 | 1.5 | 1.5 |
| Thunder Bay District (THB) | 0 | 0.0 | 1.0 | 0.0 |
| Timiskaming (TSK) | 0 | 0.0 | 0.0 | 0.0 |
| Toronto (TOR) | 76 | 8.0 | 31.0 | 2.6 |
| Waterloo (WAT) | 7 | 0.7 | 4.2 | 1.3 |
| Wellington-Dufferin-Guelph (WDG) | 9 | 0.9 | 2.4 | 3.1 |
| Windsor-Essex County (WEC) | 7 | 0.7 | 4.0 | 1.7 |
| York Regional (YRK) | 21 | 2.2 | 9.8 | 1.8 |
| Total | 959 | 100Table 1 footnote b | 313 (average) | 6.7 (average) |
The highest incidence rates in 2017 occurred in LGL (128.8 cases per 100,000), KFL (87.2 cases per 100,000), Hastings and Prince Edward Counties (HPE) (28.6 cases per 100,000), Ottawa (18.1 cases per 100,000) and Eastern Ontario (EOH) (13.5 cases per 100,000) (Figure 2).
Figure 2: Incidence rate of Lyme disease (per 100,000 population) by public health unit: Ontario, Canada (2017)
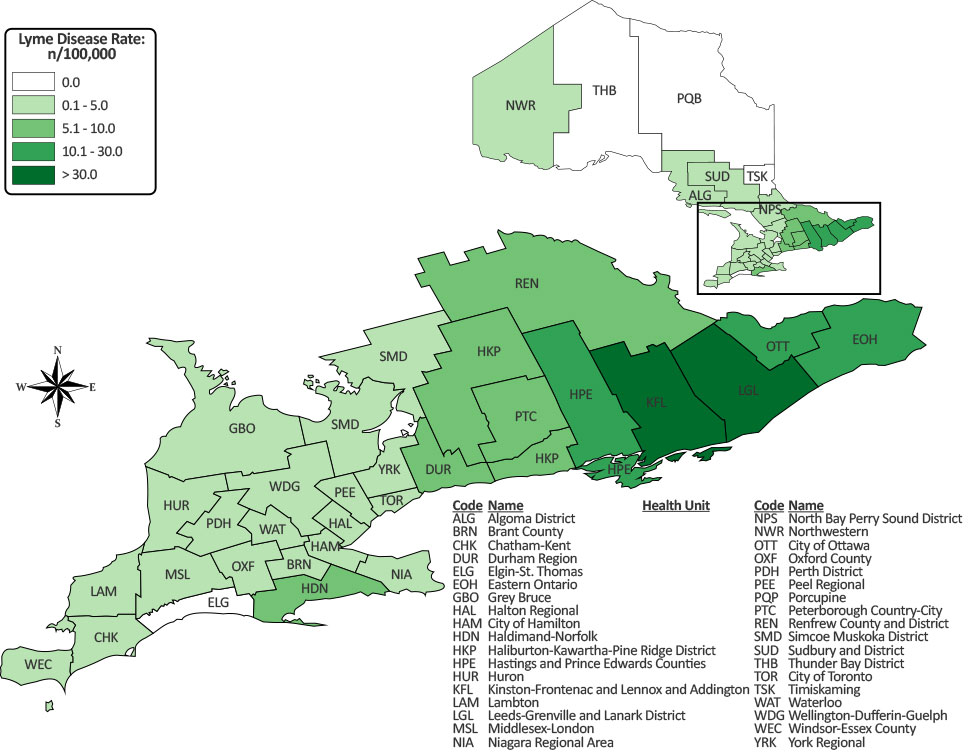
Text description: Figure 2
This figure depicts a map of Ontario with subdivisions corresponding to the different public health units in this province. A colour scale is used to illustrate the Lyme disease rate per 100,000 population for each one of them as follows:
| Public health unit | Lyme disease Rate (per 100,000 population) |
|---|---|
| Leeds-Grenville and Lanark District | >30 |
| Kingston, Frontenac, and Lennox & Addington | >30 |
| Hastings and Prince Edward Counties | 10.1–30.0 |
| City of Ottawa | 10.1–30.0 |
| Eastern Ontario | 10.1–30.0 |
| Haliburton, Kawartha, Pine Ridge | 5.1–10.0 |
| Peterborough County-City | 5.1–10.0 |
| Durham Region | 5.1–10.0 |
| Renfrew County and District | 5.1–10.0 |
| Haldimand-Norfolk | 5.1–10.0 |
| Niagara Region | 0.1–5.0 |
| Middlesex-London | 0.1–5.0 |
| Wellington-Dufferin-Guelph | 0.1–5.0 |
| Chatham-Kent | 0.1–5.0 |
| Toronto | 0.1–5.0 |
| Northwestern | 0.1–5.0 |
| Halton Regional | 0.1–5.0 |
| Simcoe Muskoka District | 0.1–5.0 |
| Grey Bruce | 0.1–5.0 |
| Oxford County | 0.1–5.0 |
| York Regional | 0.1–5.0 |
| Algoma District | 0.1–5.0 |
| Huron County | 0.1–5.0 |
| Windsor-Essex County | 0.1–5.0 |
| Sudbury and District | 0.1–5.0 |
| Perth District | 0.1–5.0 |
| Waterloo | 0.1–5.0 |
| City of Hamilton | 0.1–5.0 |
| Lambton County | 0.1–5.0 |
| North Bay Parry Sound District | 0.1–5.0 |
| Peel Region | 0.1–5.0 |
| Brant County | 0.1–5.0 |
| Elgin-St. Thomas | 0 |
| Porcupine | 0 |
| Thunder Bay District | 0 |
| Timiskaming | 0 |
Seasonality
In 2017, the majority of cases occurred from June through September, with July having the highest number (n=369) (Figure 3). Monthly case counts were above 5-year averages for June (2.7 times higher), July (3.8), August (4.7) and September (3.0).
Figure 3: Number of probable and confirmed Lyme disease cases by episode month in 2017, compared to five-year averages (2012–2016): Ontario, Canada

Text description: Figure 3
| Month | 2017 | 5-year historical average (2012–2016) |
|---|---|---|
| January | 5 | 4.2 |
| February | 3 | 2.6 |
| March | 5 | 3.6 |
| April | 6 | 7.2 |
| May | 35 | 20.4 |
| June | 194 | 71.4 |
| July | 369 | 97.8 |
| August | 202 | 43.4 |
| September | 72 | 24.4 |
| October | 32 | 16.6 |
| November | 27 | 14.2 |
| December | 9 | 7.2 |
| Total | 959 | 313 |
Age and sex
Lyme disease case counts in Ontario displayed a bimodal pattern in 2017, with relatively higher counts in those aged 5–14 and 50–69 years and relatively fewer in those aged 15–24 years (Figure 4). Over half – 59.8% – of cases were male. The ratio of male to female cases was higher than the 5-year average in most age groups. The male to female ratio was almost two times higher in the 5–14, 35–39, 40–49 and 55–59 year old age groups and was three to four times higher in the 15–19 and 20–24 year age groups.
Figure 4: Number of confirmed and probable Lyme disease cases by age group and sex in 2017, compared to 5-year averages (2012–2016): Ontario, CanadaFigure 4 footnote a

Text description: Figure 4
| Age Group (years) |
Female | Male | Female historical average (2012–2016) | Male historical average (2012–2016) |
|---|---|---|---|---|
| 0–4 | 10 | 12 | 5 | 5.2 |
| 5–9 | 14 | 27 | 8.4 | 12 |
| 10–14 | 17 | 32 | 4.6 | 7 |
| 15–19 | 6 | 24 | 3.8 | 5.4 |
| 20–24 | 6 | 22 | 6 | 7.4 |
| 25–29 | 17 | 24 | 6.8 | 9 |
| 30–34 | 18 | 25 | 8.2 | 8.2 |
| 35–39 | 19 | 30 | 8.8 | 8.4 |
| 40–44 | 21 | 39 | 6.6 | 10.2 |
| 45–49 | 21 | 35 | 9 | 15.8 |
| 50–54 | 43 | 54 | 15.4 | 16.4 |
| 55–59 | 37 | 62 | 18.2 | 19.6 |
| 60–64 | 63 | 65 | 15.4 | 15.6 |
| 65–69 | 41 | 59 | 12.2 | 12.6 |
| 70–74 | 28 | 37 | 7.2 | 9.2 |
| 75–79 | 15 | 16 | 3.4 | 4.4 |
| 80–84 | 5 | 7 | 4.25 | 3.2 |
| 85–89 | 4 | 1 | 1 | 1 |
| 90+ | 1 | 1 | 1.5 | 0 |
| Total | 386 | 573 | 147.75 | 170.6 |
Discussion
Ontario Lyme disease incidence in 2017 was at its highest recorded level since it became a reportable disease in 1988. The increase in Lyme disease incidence in Ontario is not uniform, but is concentrated in the eastern part of the province, which contains more blacklegged ticks and blacklegged ticks with relatively higher B. burgdorferi percent positivity Footnote 17Footnote 18. Consistent with the rest of the Canada and elsewhere, Lyme disease cases were more frequent between June and September, and were more common among those aged 5–14 and 50–69 years and among males.
The strength of our study is that it provides the most up-to-date data available on Lyme disease incidence in Ontario as well as an analysis of the geographic, seasonal and demographic trends in Lyme disease infection.
There are several limitations to consider. First, the true incidence of an infection such as Lyme disease is subject to varying degrees of underreporting due to a variety of factors, such as variable disease awareness, health care–seeking behaviours, clinical diagnoses, reporting behaviours and treatment of clinical early‑localized Lyme disease without reporting to the PHU Footnote 19Footnote 20. Although the degree of provincial underreporting has not been determined, we assume cases reported through passive surveillance skew towards cases confirmed by serology.
Second, the iPHIS is a disease reporting system that allows for ongoing updates to data previously entered. As a result, data extractions from iPHIS represent a snapshot of the database at the time of extraction and may differ from previous or subsequent reports. Third, it was not possible to assess whether B. burgdorferi infections were acquired locally or when travelling elsewhere, so the PHU of residence is not necessarily the location of exposure. Nonetheless, the most likely exposure location for a case is near their home or, more broadly, in the PHU of residence Footnote 21Footnote 22.
Next steps
There are both research and public health implications to these data. Reportable disease databases such as iPHIS, offer an opportunity to explore the epidemiology of Lyme disease in Ontario. For example, research using iPHIS and other health care databases could examine spatiotemporal trends in reporting and treatment of cases with and without laboratory confirmation.
These data have important public health implications in that the identified trends offer an opportunity for better targeting of Lyme disease prevention awareness, such as educational programs for children and parents and the need for protection during summer activities. Summer is associated with the nymph stage of the tick, so increased awareness of the smaller size of the tick at this time may also be useful.
Conclusion
Lyme disease incidence is increasing in Ontario. This trend is likely to continue as climate change progresses and enables blacklegged ticks to survive and propagate in new areas. Ongoing surveillance of both human cases and tick distribution can continue to inform clinical and public health actions to prevent, detect and mitigate the impact of Lyme disease in Ontario.
Authors’ statement
MPN – Conceptualization, methodology, analysis, interpretation, writing original draft, review and editing
CBR, DS, KOJ, SW – Conceptualization, methodology, analysis, interpretation, writing original draft (parts), review and editing
A-MA, KC, SJ, SNP, TB – Methodology, analysis, interpretation, review and editing
Conflict of interest
None.
Acknowledgements
We would like to thank our public health colleagues throughout Ontario for their continued commitment to Lyme disease case management, surveillance and reporting. We thank Lisa Fortuna (PHO), Shelley Deeks (PHO), Patricia Huston (Public Health Agency of Canada) and an anonymous reviewer for reviewing earlier drafts of the manuscript and for providing valuable input on its improvement.
Funding
Public Health Ontario supported this work as part of its core mandate.
Page details
- Date modified: