
Tuberculosis 2016

 Download this article as a PDF
 Published by: The Public Health Agency of Canada
Issue: Volume 44-3/4: Can we eliminate tuberculosis?
Date published: March 1, 2018
ISSN: 1481-8531
Submit a manuscript
About CCDR
Browse
Volume 44-3/4, March 1, 2018: Can we eliminate tuberculosis?
Surveillance
Tuberculosis in Canada, 2016
J Vachon1, V Gallant1, W Siu1
Affiliation
1 Centre for Communicable Diseases and Infection Control, Public Health Agency of Canada, Ottawa, ON
Correspondence
Suggested citation
Vachon J, Gallant V, Siu W. Tuberculosis surveillance in Canada, 2006. Can Commun Dis Rep. 2018;44(3/4):75-81. https://doi.org/10.14745/ccdr.v44i34a01
Abstract
Background: Tuberculosis (TB) is a major global health problem that affected an estimated 10.4 million people worldwide in 2016. The Public Health Agency of Canada (PHAC) monitors active TB disease through a national surveillance system, which is a collaborative effort withthe provinces and territories.
Objective: This article presents an epidemiological summary of the active TB disease cases reported from 2006 to 2016, with a focus on 2016. Treatment outcomes for cases diagnosed in 2015 are also presented.
Methods: The Canadian Tuberculosis Reporting System (CTBRS) is a case-based surveillance system that maintains non-nominal data on people diagnosed with active TB disease in Canada. Data are collected annually from the provinces and territories, analyzed by PHAC and validated by each province and territory.
Results: The number of active TB disease cases increased from 1,642 in 2015 to 1,737 in 2016, corresponding to an increase in incidence rate from 4.6 to 4.8 per 100,000 population. Foreign born individuals continued to make up the majority of cases reported (70%) and the incidence rate remained highest among Canadian born Indigenous people (23.5 per 100,000 population) and was particularly high within the Inuit population (170.1 per 100,000 population). Over the past decade, there was a slight decrease in the number of cases among children and the proportion of re-treatment cases declined from 8.3% of cases in 2006 to 5.4% of cases in 2016.
Conclusion: Although tuberculosis incidence rates in Canada are low in the global context and have been relatively stable over the last decade, there has been a slight increase in rates over the last three years, especially in the foreign born population which accounts for the majority of cases. The decrease in cases among children suggests less active transmission and the low proportion of re-treatment cases suggests effective treatment and adherence.
Introduction
Tuberculosis (TB) is a major global health problem and is the leading cause of death from a single infectious agent, ranking above HIV/AIDS. Worldwide, a total of 10.4 million people were diagnosed with active TB in 2016, among whom 90% were adults and 65% were malesFootnote 1. The target of the World Health Organization's (WHO) "End TB Strategy" is to reduce the global incidence from a projected 110 per 100,000 by 2015 to 10 per 100,000 or less by 2035Footnote 2. The WHO's Action Framework for Low-Incidence Countries outlines that pre-elimination of TB (defined as <1 TB case per 100,000) should be reached by 2035, while full elimination (defined as <0.1 case per 100,000) should be possible by 2050 or before, with the introduction of new tools such as a potential new vaccineFootnote 3.
Among the G7 countries (United States (US), France, Germany, Great Britain, Italy, and Japan), Canada has the second lowest TB incidence rate (after the US)Footnote 1. Although the incidence rate of active TB disease in Canada is among the lowest in the world and has been decreasing over the past 60 years, high incidence rates persist among certain subsets of the population, including foreign born individuals and Indigenous peoplesFootnote 4.
The Public Health Agency of Canada (PHAC) monitors active TB disease through the Canadian Tuberculosis Reporting System (CTBRS), a collaborative effort among the federal, provincial and territorial ministries of health. Public Health Agency of Canada uses TB surveillance data to monitor progress toward reducing the burden of TB in Canada, as outlined in Tuberculosis Prevention and Control in Canada: A Federal Framework for ActionFootnote 5. Working with partners, the Government of Canada is taking steps to reduce the incidence of TB in high-risk populations and pave the way toward TB elimination.
This report describes the epidemiology of reported cases of active TB (new and re-treatment) in Canada between 2006 and 2016 by geographic distribution, age, sex, origin and diagnostic classification. This report is a follow-up to a previous surveillance report published for 2005–2015Footnote 6. The 2016 results are discussed in the context of data from previous years to provide an evidence base for public health action toward elimination of the disease. Treatment outcomes for cases diagnosed in 2015 are also reported.
Methods
The CTBRS is a case-based surveillance system that maintains non-nominal data on people diagnosed with active TB disease in Canada. Details on the CTBRS's methods, including data collection processes, data management, data quality control, analysis and the classification and categorization of population subgroups, have already been describedFootnote 4. However, of note is that Canada tracks cases by their origin including Canadian born (Indigenous and non-Indigenous) and foreign born. Canadian born Indigenous people comprise three distinct populations: First Nations, Inuit and Métis.
Provincial and territorial public health authorities voluntarily submit data to PHAC on all new and re-treatment cases of active TB disease that meet the Canadian case definition for national surveillanceFootnote 7. Typically, treatment for fully susceptible TB lasts for six to nine monthsFootnote 8; therefore, treatment outcome data are submitted between 12 and 18 months following submission of the initial case report. If treatment is ongoing at the time of data submission to PHAC, the reporting jurisdiction submits an interim report followed by annual updates until the case file is closed. Data are submitted to PHAC either through manual completion of a standard reporting form or by electronic transmission. All raw data (paper forms and electronic datasets) are retained in compliance with the Directive for the Collection, Use and Dissemination of Information Relating to Public Health (PHAC, 2013, unpublished document).
Active TB disease is classified as either respiratory or non-respiratory. Respiratory TB includes pulmonary TB, TB of the pleura and TB of the intrathoracic or mediastinal lymph nodes, larynx, nasopharynx, nose and sinuses. Primary disease is characterized by pleuritis and pleural effusion due to recent (i.e., within preceding 24 months) infection with Mycobacterium tuberculosis. Non-respiratory TB refers to all other disease sites.
The "incidence rate" refers to individuals diagnosed with active TB disease (new and re-treatment) per 100,000 population in a given reporting year. Population denominators used to calculate rates are derived from a number of sources. For the total Canadian and provincial/territorial population counts by age and by sex, rates are based on mid-year estimations from 2011 census data produced by the Demography Division of Statistics Canada (unpublished data). The foreign born population counts are estimates based on Statistics Canada's 2011 National Household SurveyFootnote 9. For Indigenous population groups, namely, First Nations, Inuit and Métis, rates are also based on data from the 2011 National Household Survey Footnote 10. Finally, rates for First Nations individuals with status, both on and off-reserve, were calculated using population projections of the Indian Register produced by Indigenous and Northern Affairs Canada (unpublished data).
Microsoft Excel 2010 and SAS Enterprise Guide (SAS EG) v5.1 software were used for data cleaning and analysis. No statistical procedures were used for comparative analyses, nor were any statistical techniques applied to account for missing data. With the exception of risk factor data, data collected through this system were virtually complete. Data in tables with small cell sizes (n=<5) were not suppressed, since disclosure was not deemed to pose any risk of identifying individual cases. These procedures are in line with the Directive for the Collection, Use, and Dissemination of Information Relating to Public Health (PHAC, 2013, unpublished document). The data were examined by the provinces and territories to ensure accuracy; some of the more detailed data were summarized in supplementary tablesFootnote 7. Data for this report were extracted from the CTBRS in August 2017. Note that in 2016, British Columbia did not submit information on Indigenous status and, therefore, cases from British Columbia were identified only as either Canadian born or foreign born. Tuberculosis cases were counted by the date that the reporting jurisdiction confirmed the individual had TB. Because data at the national level are submitted annually, any updates are typically submitted 12 months following the initial annual submission.
Results
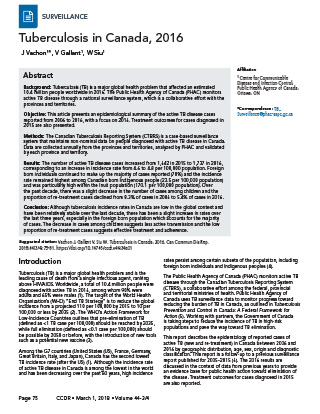
In 2016, a total of 1,737 cases of active TB disease were reported in Canada corresponding to an incidence rate of 4.8 per 100,000 population (Figure 1; Supplementary Table 1A Footnote 7). The majority (93%) of cases reported were new cases, while 5% were re-treatment cases (defined as having had at least one previous diagnosis of TB disease).Previous history of TB disease was unknown for 2% of the reported cases. The proportion of re-treatment cases among all cases reported decreased over the past decade, from 8.3% in 2006 to 5.4% in 2016.
Figure 1: Number and incidence rate per 100,000 population of reported active tuberculosis cases (new and re-treatment), Canada, 2006 to 2016
Text description: Figure 1
| Reporting year | Cases | Rates |
|---|---|---|
| 2006 | 1,653 | 5.1 |
| 2007 | 1,575 | 4.8 |
| 2008 | 1,642 | 4.9 |
| 2009 | 1,654 | 4.9 |
| 2010 | 1,587 | 4.7 |
| 2011 | 1,621 | 4.7 |
| 2012 | 1,700 | 4.9 |
| 2013 | 1,651 | 4.7 |
| 2014 | 1,614 | 4.5 |
| 2015 | 1,642 | 4.6 |
| 2016 | 1,737 | 4.8 |
From 2006 to 2016, both the number of reported TB cases and the incidence rate remained relatively stable, from 1,653 cases reported and a rate of 5.1 per 100,000 population in 2006 to 1,737 cases and a rate of 4.8 per 100,000 population in 2016 (Figure 1).
Geographical distribution
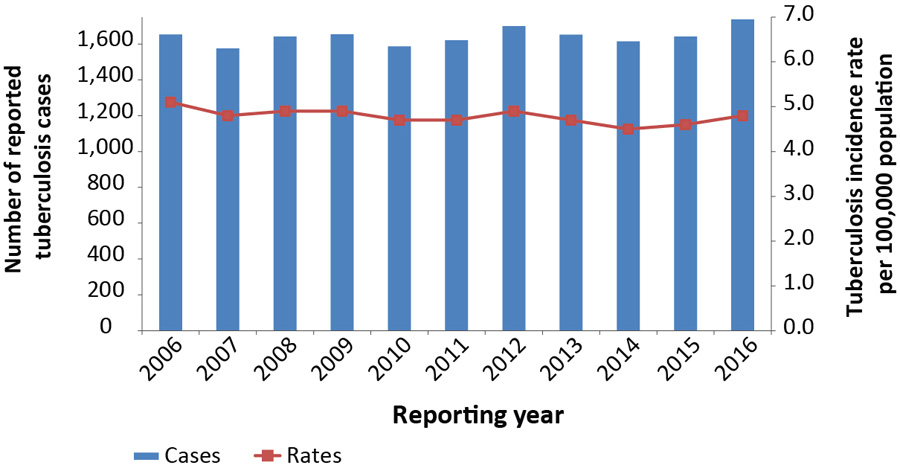
In 2016, provincial/territorial-specific TB incidence rates ranged from 0.2 per 100,000 population in Nova Scotia to 142.9 per 100,000 population in Nunavut (Figure 2). The reported incidence rates in Newfoundland and Labrador, Manitoba, Saskatchewan, Alberta, Northwest Territories and Nunavut were higher than the national rate of 4.8 cases per 100,000 population. The three largest provinces, Ontario, Quebec and British Columbia, continued to account for the majority (64%) of all reported cases in 2016.
Figure 2: Tuberculosis incidence rate per 100,000 population by province/territory, Canada, 2016
Text description: Figure 2
| Canada 2016 | Province/Territory | |||||||||||||
|---|---|---|---|---|---|---|---|---|---|---|---|---|---|---|
| N.L. | P.E.I. | N.S. | N.B. | Que. | Ont. | Man. | Sask. | Alta. | B.C. | Y.T. | N.W.T. | Nvt. | ||
| Cases | 1,737 | 28 | 4 | 2 | 13 | 250 | 633 | 201 | 91 | 238 | 220 | 1 | 3 | 53 |
| Rate | 4.8 | 5.3 | 2.7 | 0.2 | 1.7 | 3.0 | 4.5 | 15.2 | 7.9 | 5.6 | 4.6 | 2.7 | 6.7 | 142.9 |
| Abbreviations: Alta., Alberta; B.C., British Columbia; Man., Manitoba; N.B., New Brunswick; N.L., Newfoundland and Labrador; N.S., Nova Scotia; Nvt., Nunavut; N.W.T., Northwest Territories; Ont., Ontario; P.E.I., Prince Edward Island; Que., Quebec; Sask., Saskatchewan; Y.T., Yukon | ||||||||||||||
Age and sex distribution
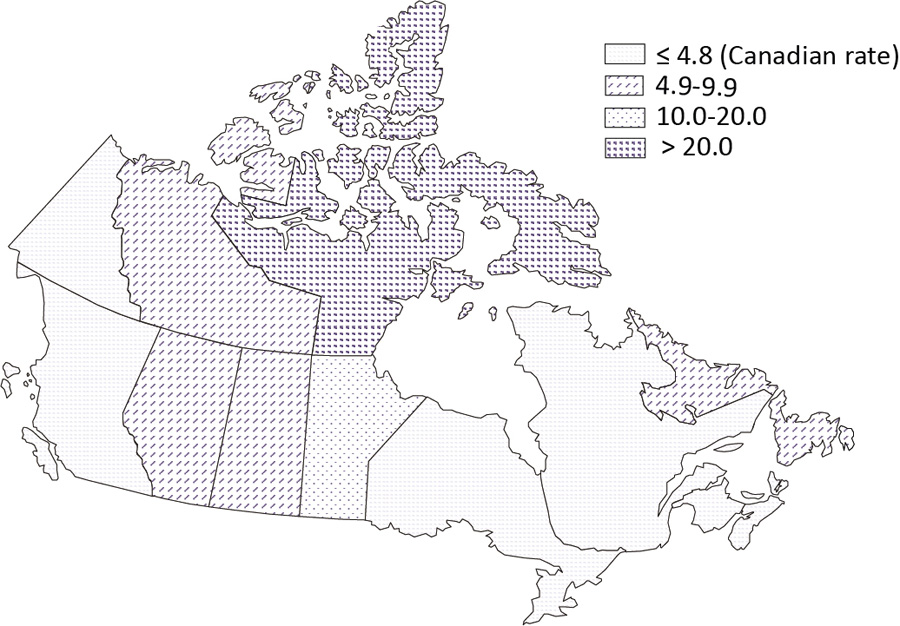
As in previous years, the largest percentage of reported cases was seen in young adults (aged 25 to 34 years). However, the highest incidence rate was observed for those aged 75 years or older, at 10.4 per 100,000 population (Figure 3; Supplementary Table 2, and Supplementary Table 3Footnote 7). The proportion of cases reported to have occurred in people less than 15 years of age among all cases declined slightly from 6.4% (n=106/1,653) in 2006 to 5.0% (n=86/1,737) in 2016 which corresponds to rates of 1.9 per 100,000 and 1.5 per 100,000 in 2006 and 2016, respectively.
Figure 3: Tuberculosis incidence rates per 100,000 population and percentage by age group and sex, Canada, 2016
Text description: Figure 3
| Age group | Males (n) | Rates | Females (n) | Rates | Overall (%) |
|---|---|---|---|---|---|
| <1 | 8 | 4.0 | 0 | 0 | 0.46 |
| 1-4 | 18 | 2.2 | 21 | 2.7 | 2.25 |
| 5-14 | 21 | 1.1 | 18 | 1.0 | 2.25 |
| 15-24 | 129 | 5.5 | 99 | 4.5 | 13.13 |
| 25-34 | 152 | 6.0 | 186 | 7.4 | 19.46 |
| 35-44 | 124 | 5.2 | 118 | 4.9 | 13.93 |
| 45-54 | 119 | 4.6 | 83 | 3.2 | 11.63 |
| 55-64 | 122 | 5.0 | 72 | 2.9 | 11.17 |
| 65-74 | 100 | 6.1 | 80 | 4.5 | 10.36 |
| 75+ | 150 | 14.0 | 117 | 7.8 | 15.37 |
In 2016, males and females between the ages of 1 and 44 years had similar TB incidence rates, while males aged 45 years and older had higher incidence rates compared with females. For those 75 years and older, the incidence rate for males (14.0 per 100,000 population) was almost twice the rate for females (7.8 per 100,000 population).
In all years from 2006 to 2016 more males were diagnosed with TB than females. In 2016, the ratio of male to female TB cases was 1.2:1. Males accounted for 54% (n=943) of reported cases, corresponding to an incidence rate of 5.2 per 100,000 population (Figure 4; Supplementary Table 1BFootnote 7). In comparison, females accounted for 46% (n=794) of all reported cases for an incidence rate of 4.3 per 100,000 population (Supplementary Table 1CFootnote 7).
Figure 4: Number of reported active tuberculosis cases (new and re-treatment) and incidence rates per 100,000 population by sex, Canada, 2006 to 2016
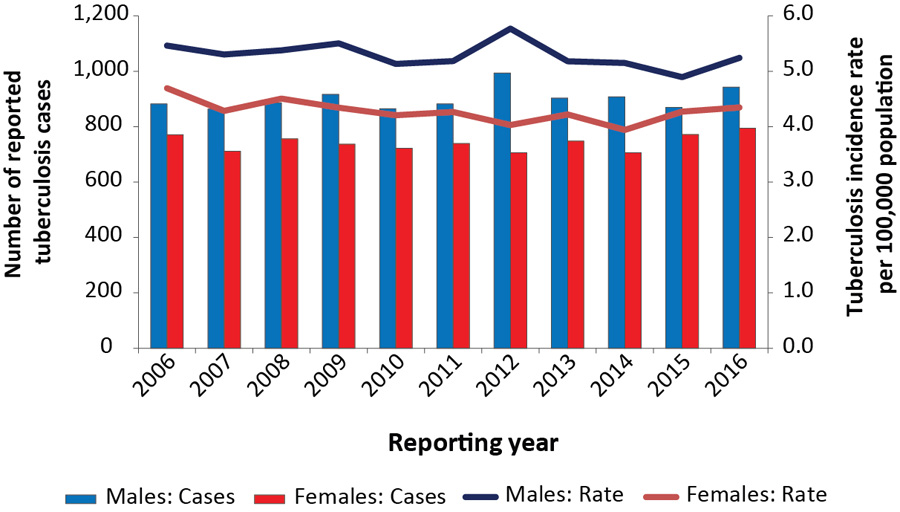
Text description: Figure 4
| Year | Males | Females | ||
|---|---|---|---|---|
| Cases | Rate | Cases | Rate | |
| 2006 | 882 | 5.5 | 771 | 4.7 |
| 2007 | 864 | 5.3 | 711 | 4.3 |
| 2008 | 886 | 5.4 | 756 | 4.5 |
| 2009 | 917 | 5.5 | 737 | 4.3 |
| 2010 | 865 | 5.1 | 722 | 4.2 |
| 2011 | 882 | 5.2 | 739 | 4.3 |
| 2012 | 994 | 5.8 | 706 | 4.0 |
| 2013 | 903 | 5.2 | 748 | 4.2 |
| 2014 | 908 | 5.2 | 706 | 3.9 |
| 2015 | 870 | 4.9 | 772 | 4.3 |
| 2016 | 943 | 5.2 | 794 | 4.3 |
Distribution by origin
Of the 1,737 cases reported in 2016, foreign born individuals accounted for 70% (n=1,213) of cases, Canadian born Indigenous people made up 19% (n=333) of cases, and Canadian born non-Indigenous people accounted for 8% (n=135) of cases; 2% (n=34) were classified as Canadian born with an unknown Indigenous status and 1% (n=22) were of an unknown origin (Figure 5).
Figure 5: Distribution of active tuberculosis cases (new and re-treatment) by origin, Canada, 2016
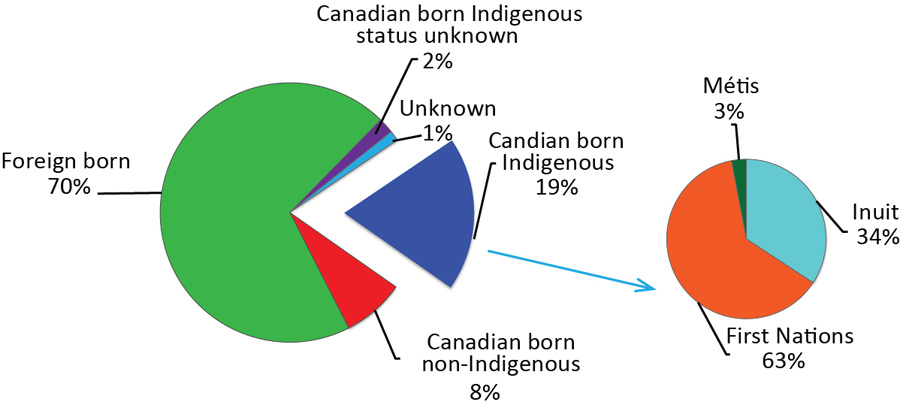
Text description: Figure 5
| Origin | N |
|---|---|
| Candian born Indigenous | 19% (333) |
| Canadian born Non-Indigenous | 8% (135) |
| Foreign born | 70% (1,213) |
| Canadian born Indigenous status unknown | 2% (34) |
| Unknown | 1% (22) |
| Inuit | 34% (114) |
| First Nations | 62% (209) |
| Métis | 3% (10) |
| Total | 1737 |
From 2006 to 2016, trends in incidence rates varied by origin group (Table 1; Supplementary Table 5Footnote 7). While the rates have remained stable among Canadian born non-Indigenous and foreign born individuals, there were variations in the Canadian born Indigenous population. For example, over the past decade the incidence rate for the Inuit population increased from 115.1 to 170.1 per 100,000 population. Among First Nations living on-reserve, an overall downward trend (31.5 per 100,000 in 2006 to 20.4 per 100,000 in 2015) was observed between 2006 to 2015 except for an increase in 2013 (30.8 per 100,000) and again in 2016 (34.1 per 100,000). In comparison, the incidence rate decreased among First Nations living off-reserve (26.3 per 100,000 in 2006 to 14.5 per 100,000 in 2016) as well as among the Métis population (7.2 per 100,000 in 2006 to 2.1 per 100,000 in 2016).
| Reporting year | First Nations on-reserve | First Nations off-reserve | Métis | Inuit | Foreign born | Canadian born Non-Indigenous | Total Canada |
|---|---|---|---|---|---|---|---|
| 2006 | 31.5 | 26.3 | 7.2 | 115.1 | 14.9 | 0.9 | 5.1 |
| 2007 | 29.7 | 24.2 | 7.5 | 85.2 | 14.8 | 0.7 | 4.8 |
| 2008 | 26.8 | 28.0 | 6.1 | 160.0 | 14.5 | 0.9 | 4.9 |
| 2009 | 27.0 | 24.3 | 5.4 | 157.1 | 14.4 | 1.0 | 4.9 |
| 2010 | 23.7 | 20.0 | 5.4 | 200.0 | 14.1 | 0.7 | 4.7 |
| 2011 | 21.2 | 16.4 | 4.4 | 166.7 | 14.7 | 0.7 | 4.7 |
| 2012 | 23.8 | 18.7 | 2.2 | 243.9 | 14.6 | 0.7 | 4.9 |
| 2013 | 30.8 | 11.4 | 3.5 | 139.4 | 17.4 | 0.6 | 4.7 |
| 2014 | 21.7 | 15.2 | 3.6 | 177.6 | 14.2 | 0.6 | 4.5 |
| 2015 | 20.4 | 11.1 | 2.2 | 164.7 | 14.9 | 0.6 | 4.6 |
| 2016 | 34.1 | 14.5 | 2.1 | 170.1 | 15.2 | 0.6 | 4.8 |
Indigenous peoples
In 2016, of the 333 reported Canadian born Indigenous cases, 63% (n=209) were First Nations, 34% (n=114) were Inuit and 3% (n=10) were Métis (Figure 5; Supplementary Table 5Footnote 7). In 2016, compared to the incidence rate of 0.6 per 100,000 population in the Canadian born non-Indigenous population, the incidence rate among the Métis (2.1 per 100,000 population) was more than three times higher and the incidence rate among all First Nations people (23.8 per 100,000) was 41 times higher (Figure 6). The highest incidence rate across all origin groups was among the Inuit at 170.1 per 100,000 population; a rate which was more than 296 times higher than the rate in the Canadian born non-Indigenous population (when non-rounded numbers are used, i.e. 170.1492/0.57405=296.4).
Figure 6: Tuberculosis incidence rate per 100,000 population by Indigenous population, Canada, 2016
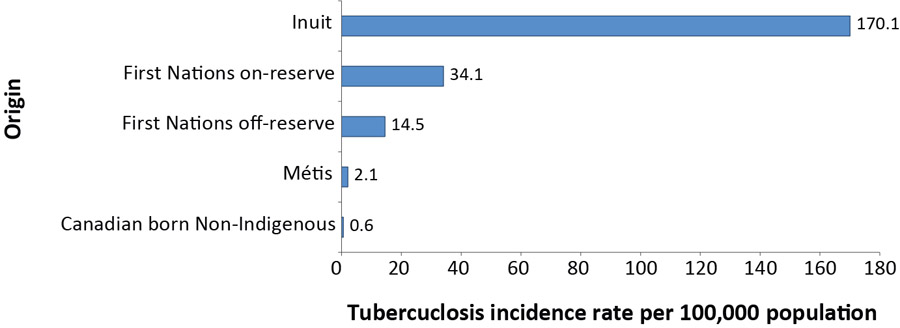
Text description: Figure 6
| Origin | Tuberculosis incidence rate per 100,000 population |
|---|---|
| Canadian born Non-Indigenous | 0.6 |
| Métis | 2.1 |
| First Nations off-reserve | 14.5 |
| First Nations on-reserve | 34.1 |
| Inuit | 170.1 |
Foreign born individuals
In 2016, the rate of TB in the foreign born population was 26 times the rate in the Canadian born non-Indigenous population. Based on birth country classified by World Health Organization TB epidemiological regionFootnote 11 the two regions with the highest TB incidence rate among foreign born persons in Canada in 2016 were Africa high HIV prevalence countries (45.1 per 100,000 population), followed by South-East Asian Region (34.9 per 100,000 population) (Figure 7). The most prevalent countries of origin among foreign born cases reported in 2016 were India (n=257, 21.2% of all foreign born cases), the Philippines (n=252, 20.8% of all foreign born cases), China (n=105, 8.7% of all foreign born cases), Vietnam (n=68, 5.6% of all foreign born cases) and Pakistan (n=45, 3.7% of all foreign born cases).
Figure 7: Tuberculosis incidence rate per 100,000 population among foreign born casesby epidemiological regionFigure 7 footnote a, Canada, 2016
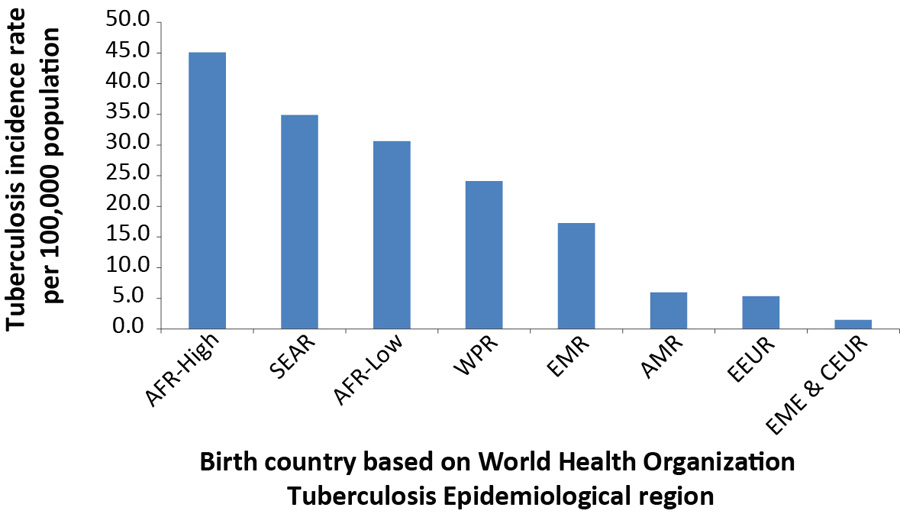
Text description: Figure 7
| Birth country - Epi region | Rate |
|---|---|
| Africa high HIV prevalence | 45.1 |
| South-East Asian Region | 34.9 |
| Africa low HIV prevalence | 30.6 |
| Western Pacific Region | 24.1 |
| Eastern Mediterranean Region | 17.3 |
| American Region | 6.0 |
| Eastern European Region | 5.3 |
| Established Market Economies & Central Europe | 1.5 |
Table 7 footnotes
|
|
Of the 1,213 foreign born TB cases reported in 2016, the year of arrival into Canada was known for 97% (n=1,180) of cases. Of these, 40% had arrived within the past five years and included 24% who were diagnosed with active TB in the first two years since arrival. In 2016, immigration status at the time of diagnosis was reported for 72% (n=874) of cases. Of these, 79% (n=694) were reported to be Canadian citizens or permanent residents, 9% (n=78) were temporary residents (visitors, students or foreign workers) and 4% (n=36) were refugees, refugee claimants or convention refugees. For the remaining 8% (n=66) of reported TB cases, immigration status was reported as "other" without additional details.
Diagnostic classification
In 2016, respiratory disease accounted for 78% (n=1,349) of all diagnosed active TB cases in Canada (Supplementary Table 6 and Supplementary Table 7 Footnote 7). Similar to previous years, pulmonary disease was the most frequently reported site of disease in 2016 (69%, n=1,196). The most frequently reported site of non-respiratory disease was peripheral lymph nodes (n=198). Of the 4,180 non-respiratory cases, 56% (n=2,339) were among females compared to 44% (n=1,841) among males. From 2006 to 2016, children younger than 15 years represented 5.7% (n=1,026/18,076) of the total cases and 66.5% of the primary cases reported (n=440/662), but only contributed to 2.8% of the non-respiratory cases reported (n=118/4,180).
Treatment outcomes for 2015
Treatment outcomes were available for 99% (n=1,626/1,642) of all reported cases of active TB disease in 2015 (Table 2; Supplementary Table 8Footnote 7). Of the cases for which treatment outcome data were available, 84.9% (n=1,380) were cured or had completed treatment.
| Reported Outcome | n | % |
|---|---|---|
| Cured or completed treatment | 1,380 | 84.9 |
| Death before or during treatment | 142 | 8.7 |
| Treatment ongoing | 31 | 1.9 |
| Transferred | 30 | 1.8 |
| Absconded or lost to follow-up | 17 | 1.0 |
| Treatment discontinued due to adverse event | 4 | 0.2 |
| Other | 22 | 1.4 |
| Total | 1,626 | 100 |
|
Abbreviation: n, number |
||
The proportion of treatment success (reported as cured or had completed treatment) was similar among Canadian born non-Indigenous (87%, n=146/167) and foreign born individuals (85%, n=989/1,162). There were major differences between the three Indigenous populations; treatment success was 58% (n=7/12) among Métis, 80% (n=126/157) among First Nations and 93% (n=104/112) among Inuit. Among First Nations for whom residency information was available (n=152), the proportion of treatment success was similar among those living on-reserve and off-reserve.
Discussion
Tuberculosis incidence rates in Canada have been relatively stable over the last decade; however, over the last three years, there has been a slight increase in the overall rates from 4.5 per 100,000 in 2014 to 4.8 per 100,000 in 2016. Incidence rates in all groups remained relatively stable with the exception of the Inuit who reported a 1.5-fold increase from 2006 to 2016 and the First Nations on-reserve who reported a 1.67-fold increase from 2015 to 2016 after a downward trend was observed between 2006 and 2015. The foreign born population still accounts for 70% of reported cases. Males continued to be more frequently diagnosed with TB than females at a ratio of 1.2:1. There was a slight decrease of cases among children (0–14 years old) over the past decade that suggests effective prevention and control measures have been implemented to decrease active transmissionFootnote 12. Pulmonary TB remained the most commonly reported site of disease (69%). The relatively low and decreasing percentage of re-treatment cases reported reflects the low incidence of TB in Canada and suggests effective treatment and high treatment complianceFootnote 13. Treatment outcome data indicated that 85% of cases had been cured or had completed treatment.
There are several reasons that could explain the slight increase seen in the overall incidence rates over the past few years: small number variation; reactivation of TB; focal outbreaks; and/or increased detection due to active case finding efforts. Continuous monitoring and further analysis are required to understand if such changes are statistically significant or not.
Despite the low rate of incidence and transmission in the general population, Canada recognizes the need for new targeted strategies both to address the high incidence of active TB disease that persists in Indigenous peoples and foreign born individuals and to achieve the TB pre-elimination goal for low-incidence countries (<1 per 100,000 by 2035)Footnote 3 Footnote 4. Outbreak control in Northern Inuit communities is underwayFootnote 14. One of the priority action areas outlined in WHO's Action Framework for low-incidence countries is to undertake screening for latent TB infection (LTBI) in TB contacts and selected high-risk groups, and to provide preventive treatment to persons with LTBI who are at greatest risk of developing active TB diseaseFootnote 3. Although Canada does not have a national surveillance program in place for LTBI, initiatives are underway that will contribute to a better understanding of the prevalence of LTBI across Canada.
Data limitations
The data included in this report are subject to a few limitations. Because the CTBRS is a passive surveillance system, it relies on data collected retrospectively from medical and laboratory records as opposed to active case solicitation. As a result, it is difficult to ascertain whether all people with active TB disease are being identified and reported. However, the World Health Organization estimates that Canada's surveillance system has a case detection rate of 92% with a range of uncertainty of 80% to 110%Footnote 1. The accuracy of the data is partially a function of timely reporting and updates to PHAC from the provinces and territories. Some degree of lag does occur, creating a reporting delay.
It needs to be noted that the province of British Columbia transitioned to a new provincial/federal public health IT system (Panorama) in 2016. British Columbia reported a slight decrease in the number of cases and incidence rate in 2016 which may be partially attributed to data inconsistencies resulting from data conversion (Personal communication with David Roth, October 27, 2017). These potential inconsistencies are being identified and addressed, and the situation may be corrected over time.
Annual updates on the number of cases of active TB in Canada and corresponding incidence rates are important in monitoring progress toward the goal of reducing the burden of TB in Canada. The data in this report are considered provisional and subject to change in future iterations of Tuberculosis in Canada surveillance reports. Differences between the data published in this report and the data published in previous national, provincial and territorial surveillance reports may be due to reporting delays or differences as to when the data were extracted from various surveillance databases. The reporting province or territory may update its published data on a more regular basis. Should differences exist between this report and provincial or territorial reports, readers are encouraged to contact the provincial/territorial jurisdiction for clarification.
Conclusion
Although tuberculosis incidence rates in Canada are low in the global context and have been relatively stable over the last decade, there has been a slight increase in rates over the last three years, especially in the Inuit population, and the foreign born population still accounts for the majority of cases. Further monitoring and analysis is needed to understand if this increase marks the start of a trend. The decrease in cases among children suggests less active transmission and the low proportion of re-treatment cases suggests effective treatment and adherence. The federal government, in partnership with provincial and territorial governments and other federal departments and agencies, continues to work towards enhancing current efforts to prevent and control active TB disease and fostering collaborative action to address the underlying risk factors for tuberculosis in Canada.
Authors' statement
JV – Conceptualization, Validation, Formal analysis, Writing-original draft, Writing-review and editing
VG – Methodology, Software, Validation, Formal analysis, Writing-review and editing
WS – Conceptualization, Writing-review and editing, Supervision
Conflict of interest
None.
Acknowledgements
The Public Health Agency of Canada would like to acknowledge the following individuals from the provincial and territorial programs for their contribution to and participation in the CTBRS:
- Brenda P. Earles, Health and Community Services, Population Health Branch, Newfoundland and Labrador
- Jennifer Phillips, Health and Community Services, Population Health Branch, Newfoundland and Labrador
- Marguerite Cameron, Prince Edward Island Department of Health and Wellness
- Stacey Burns, Prince Edward Island Department of Health and Wellness
- Beverly A. Billard, Nova Scotia Department of Health and Wellness
- Suzanne Savoie, New Brunswick Department of Health
- Hanan Smadi, New Brunswick Department of Health
- Paul Rivest, Direction régionale de santé publique de Montréal, Québec
- Michael Whelan, Public Health Ontario
- Cecilia Fung, Public Health Ontario
- Robert Wang, Manitoba Health
- Nancy Yu, Manitoba Health
- Luiz C. Mostaço-Guidolin, Manitoba Health
- Helen Bangura, Saskatchewan Ministry of Health
- Valerie Mann, Saskatchewan Ministry of Health
- Assaad Al-Azem, TB Prevention and Control Saskatchewan
- Rosa Maheden, Alberta Health
- Celine O'Brien, Alberta Health
- Fay Hutton, British Columbia Centre for Disease Control
- Sukhman Thind, British Columbia Centre for Disease Control
- David Roth, British Columbia Centre for Disease Control
- Beth Roberts, Yukon Communicable Disease Control
- Lori Strudwick, Yukon Communicable Disease Control
- Caroline NewBerry, Department of Health and Social Services, Northwest Territories
- Shannon Leblanc, Department of Health and Social Services, Northwest Territories
- Karen Hollett, Department of Health and Social Services, Northwest Territories
- Elaine Randell, Nunavut Department of Health
Funding
This work was supported by the Public Health Agency of Canada as part of its core mandate.
Page details
- Date modified: