
Vaccine safety 2013–2016

 Download this article as a PDF
Published by: The Public Health Agency of Canada
Issue: Volume 44-9: Respiratory infections
Date published: September 6, 2018
ISSN: 1481-8531
Submit a manuscript
About CCDR
Browse
Volume 44-9, September 6, 2018: Respiratory infections
Surveillance
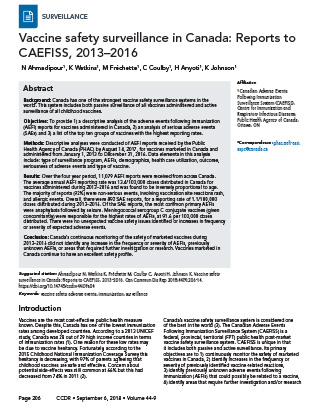
Vaccine safety surveillance in Canada: Reports to CAEFISS, 2013–2016
N Ahmadipour1, K Watkins1, M Fréchette1, C Coulby1, H Anyoti1, K Johnson1
Affiliation
1 Canadian Adverse Events Following Immunization Surveillance System (CAEFISS), Centre for Immunization and Respiratory Infectious Diseases, Public Health Agency of Canada, Ottawa, ON
Correspondence
Suggested citation
Ahmadipour N, Watkins K, Fréchette M, Coulby C, Anyoti H, Johnson K. Vaccine safety surveillance in Canada: Reports to CAEFISS, 2013–2016. Can Commun Dis Rep 2018;44(9):206-14. https://doi.org/10.14745/ccdr.v44i09a04
Keywords: vaccine safety, adverse events, immunization, surveillance
Abstract
Background: Canada has one of the strongest vaccine safety surveillance systems in the world. This system includes both passive surveillance of all vaccines administered and active surveillance of all childhood vaccines.
Objectives: To provide 1) a descriptive analysis of the adverse events following immunization (AEFI) reports for vaccines administered in Canada, 2) an analysis of serious adverse events (SAEs) and 3) a list of the top ten groups of vaccines with the highest reporting rates.
Methods: Descriptive analyses were conducted of AEFI reports received by the Public Health Agency of Canada (PHAC) by August 14, 2017, for vaccines marketed in Canada and administered from January 1, 2013 to December 31, 2016. Data elements in this analysis include: type of surveillance program, AEFIs, demographics, health care utilization, outcome, seriousness of adverse events and type of vaccine.
Results: Over the four year period, 11,079 AEFI reports were received from across Canada. The average annual AEFI reporting rate was 13.4/100,000 doses distributed in Canada for vaccines administered during 2013–2016 and was found to be inversely proportional to age. The majority of reports (92%) were non-serious events, involving vaccination site reactions rash and allergic events. Overall, there were 892 SAE reports, for a reporting rate of 1.1/100,000 doses distributed during 2013–2016. Of the SAE reports, the most common primary AEFIs were anaphylaxis followed by seizure. Meningococcal serogroup C conjugate vaccines (given concomitantly) were responsible for the highest rates of AEFIs, at 91.6 per 100,000 doses distributed. There were no unexpected vaccine safety issues identified or increases in frequency or severity of expected adverse events.
Conclusion: Canada’s continuous monitoring of the safety of marketed vaccines during 2013–2016 did not identify any increase in the frequency or severity of AEFIs, previously unknown AEFIs, or areas that required further investigation or research. Vaccines marketed in Canada continue to have an excellent safety profile.
Introduction
Vaccines are the most cost-effective public health measure known. Despite this, Canada has one of the lowest immunization rates among developed countries. According to a 2013 UNICEF study, Canada was 28 out of 29 high income countries in terms of immunization rates Footnote 1. One reason for these low rates may be due to vaccine hesitancy. Fortunately, according to the 2015 Childhood National Immunization Coverage Survey this hesitancy is decreasing, with 97% of parents agreeing that childhood vaccines are safe and effective. Concern about potential side-effects was still common at 66% but this had decreased from 74% in 2011 Footnote 2.
Canada’s vaccine safety surveillance system is considered one of the best in the world Footnote 3. The Canadian Adverse Events Following Immunization Surveillance System (CAEFISS) is a federal, provincial, territorial (FPT) public health post-market vaccine safety surveillance system. CAEFISS is unique in that it includes both passive and active surveillance. Its primary objectives are to 1) continuously monitor the safety of marketed vaccines in Canada, 2) identify increases in the frequency or severity of previously identified vaccine-related reactions, 3) identify previously unknown adverse events following immunization (AEFIs) that could possibly be related to a vaccine, 4) identify areas that require further investigation and/or research and 5) provide timely information on AEFI reporting profiles for vaccines marketed in Canada, which could help inform immunization programs and guidelines Footnote 4.
In Canada, health care providers, manufacturers and the public each have a role to play in vaccine pharmacovigilance Footnote 5. FPT public health officials maintain a close watch on vaccine safety through the Vaccine Vigilance Working Group (VVWG) of the Canadian Immunization Committee. The VVWG includes representatives from all FPT immunization programs as well as Health Canada regulators and the Immunization Monitoring Program ACTive (IMPACT) active surveillance program. The AEFI data from passive surveillance are subject to continuous analysis by the VVWG to detect potential vaccine safety concerns, which facilitates rapid identification and communication of emerging safety issues to enable an effective public health response. This report was developed with input and support from the VVWG membership.
A more comprehensive description of the roles and responsibilities for post-market pharmacovigilance can be found in the Canadian Immunization Guide and the CAEFISS webpage Footnote 4Footnote 5. Details on provincial and territorial (PT) vaccination schedules can be found on the PHAC website Footnote 6.
National reports on vaccine safety surveillance data are published periodically Footnote 7Footnote 8Footnote 9Footnote 10Footnote 11Footnote 12Footnote 13Footnote 14Footnote 15Footnote 16Footnote 17. The objective of this report is to provide a) a descriptive analysis of the adverse events following immunization reports for vaccines administered in Canada from 2013–2016, b) an analysis of serious adverse events (SAEs) and c) a list of the top ten groups of vaccines with the highest reporting rates.
Methods
Definitions
An AEFI is defined as any untoward medical occurrence that follows immunization but does not necessarily have a causal relationship with the administration of the vaccine. The adverse event may be a sign, symptom or defined illness Footnote 18.
A SAE is defined as any AEFI that results in death, is life-threatening, requires in-patient hospitalization or prolongation of existing hospitalization, results in persistent or significant disability/incapacity or results in a congenital anomaly/birth defect Footnote 19. This represents a temporal association and does not necessarily have a causal relationship with the vaccine.
Data sources
The CAEFISS is an FPT collaborative process that includes submission of AEFI reports from both passive and active surveillance.
Passive surveillance is initiated at the local public health level and relies on reporting of AEFIs by health care providers, vaccine recipients or their caregivers. Completed reports are sent to PT health authorities, where population level public health actions, as well as ongoing evaluation of immunization programs take place. AEFI reporting to the regional public health authority is mandatory in eight PT’s and voluntary in the remaining six PT’s. These reports are then submitted on a voluntary basis to PHAC for inclusion into CAEFISS Footnote 20. The PT health authorities also receive reports from federal authorities that provide immunization within their jurisdiction (including First Nations and Inuit Health Branch, Correctional Services Canada and Royal Canadian Mounted Police). Any AEFIs received by National Defence and the Canadian Armed Forces are reported directly to PHAC. On rare occasions, AEFI reports are submitted to PHAC directly from physicians, pharmacists, travel clinics and the public. These reports are entered into CAEFISS and a copy and/or reporter information is sent to the health authorities of the PT of origin.
As of January 2011, a change in reporting regulations required Market Authorization Holders (MAHs) to report AEFIs to Health Canada hence, MAHs gradually stopped reporting AEFI to PHAC. All MAH reports were therefore excluded from this report (accounting for 0.6% of all AEFI reports received by PHAC).
Active surveillance has been conducted by IMPACT since 1991. IMPACT is a pediatric, hospital-based network funded by PHAC and administered by the Canadian Paediatric Society Footnote 21. This network currently includes 12 pediatric centres across Canada where nurses, under the supervision of pediatric and/or infectious disease medical specialists, screen hospital admissions for target AEFIs, including neurologic events (e.g., seizures and Guillain-Barré syndrome), thrombocytopenia, vaccination site abscess/cellulitis, intussusception and other complications that may have followed vaccination and that led to a hospital admission Footnote 22Footnote 23.
During report processing, personal identifiers are removed from the AEFI reports prior to submission (via either hard or soft copies) to PHAC, where data are entered into CAEFISS Footnote 24. During entry, quality assurance is performed to resolve data discrepancies and identify and reconcile duplicate reports. Serious AEFIs are identified based on the case definition, and reported AEFIs and medical history information are coded using the International Medical Dictionary for Regulatory Activities (MedDRA, version 17) Footnote 25. Medical interventions, including concomitant medications are coded using the International Anatomical Therapeutic Chemical classification system. This coding is followed by a systematic medical case review by trained health professionals to assign a primary reason for reporting. For purposes of the medical case review, national case definitions for AEFI classification from the CAEFISS user guide were used Footnote 24.
Data elements in the analysis include the number and rate of AEFIs per year, primary reason for reporting, age and sex distribution, outcomes, an analysis of all SAEs, and a list of the top ten groups of vaccines with the highest reporting rates. Results in this report are presented by year of vaccine administration (2013–2016).
Data analysis
All AEFI reports submitted to CAEFISS by August 14, 2017 with a vaccination date from January 1, 2013 through December 31, 2016 were included in this report. Data from one jurisdiction was not included in this analysis due to technical issues with transmitting and receiving data to CAEFISS. Since this data was not included in the numerator, the population of this jurisdiction was not included in the denominator when calculating the national rate per 100,000 population.
Descriptive analyses were conducted using SAS enterprise guide software, version 5.1 Footnote 26. Where possible, reporting rates were calculated using vaccine doses distributed data provided by Market Authorization Holders under an agreement with PHAC. The number of doses distributed was used as a proxy measure of persons vaccinated in rate calculations for both overall rates and vaccine-specific rates. Statistics Canada annual population estimates were used as a denominator in rate calculations when a doses distributed-based rate could not be calculated Footnote 27.
Results
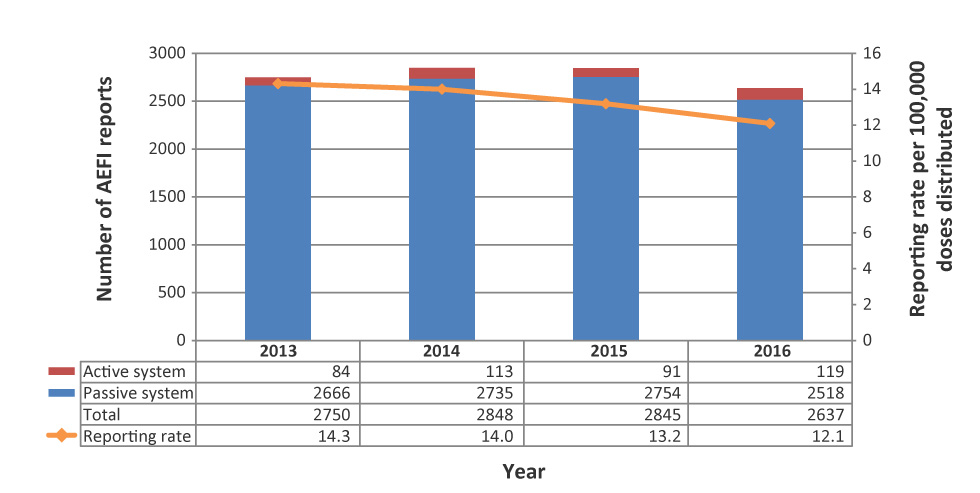
A total of 11,080 AEFI reports (2,750 AEFI reports in 2013, 2,848 in 2014, 2,845 in 2015 and 2,637 in 2016) from 12 PTs were received by CAEFISS during 2013–2016. Over 80 million vaccine doses were distributed, representing reporting rates of 12.1–14.3 per 100,000 doses distributed (Figure 1).
Figure 1: Total number of adverse events following immunization reports and reporting rate by year, 2013–2016
Text description: Figure 1
| Year | Passive system | Active system | Total number of adverse events following immunization | Reporting rate per 100,000 doses distributed |
|---|---|---|---|---|
| 2013 | 2666 | 84 | 2750 | 14.3 |
| 2014 | 2735 | 113 | 2848 | 14.0 |
| 2015 | 2754 | 91 | 2845 | 13.2 |
| 2016 | 2518 | 119 | 2637 | 12.1 |
Age and sex distribution
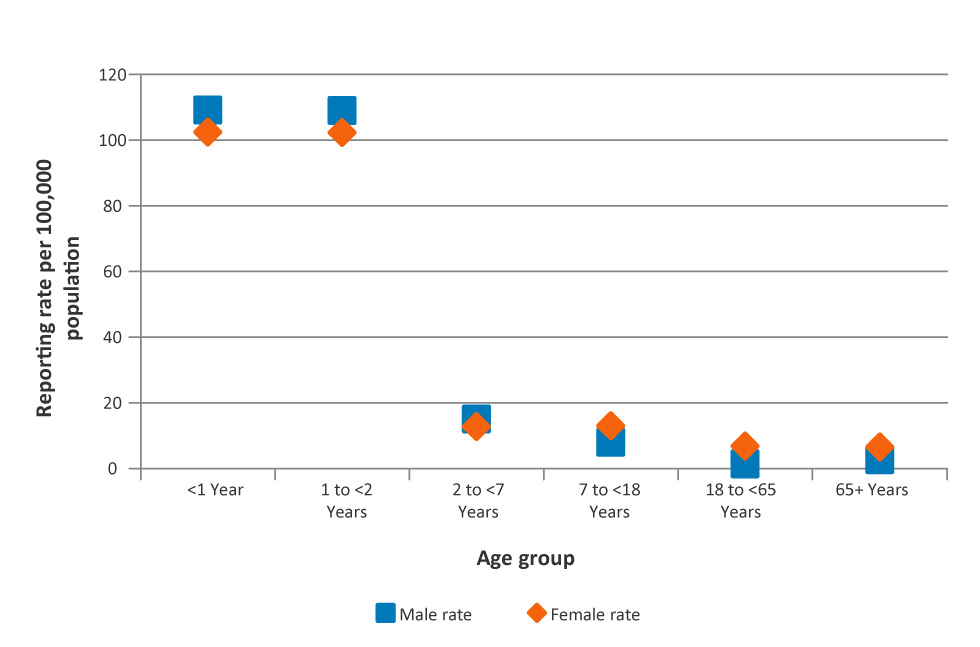
The reporting rates per 100,000 population, by age group and sex, are presented in Figure 2. The median age of all reports during the reporting period was 18 years (range: <1 month to 104 years). The majority (56%) of AEFI reports were for children and adolescents under 18 years of age. The highest reporting rates were in infants under one year of age (121.8/100,000 population), followed by children aged one to two years (with a rate of 121.3/100,000 population). Of the 11,080 reports, 63% were in females. Male predominance was observed for children under seven years of age and female predominance was observed among those seven years of age and older.
Figure 2: Proportion of adverse events following immunization reports by age group and sex, 2013–2016Figure 2 footnote a
Text description: Figure 2
| Age group | Reporting rate per 100,000 population | |
|---|---|---|
| Female rate | Male rate | |
| <1 Year | 102.4 | 109.0 |
| 1 to <2 Years | 102.2 | 108.9 |
| 2 to <7 Years | 12.8 | 15.0 |
| 7 to <18 Years | 13.0 | 7.9 |
| 18 to <65 Years | 6.7 | 1.4 |
| 65+ Years | 6.5 | 2.6 |
Table 1 provides the number of reports and reporting rates per 100,000 population by age group and year of vaccination. For all years, the highest reporting rates were observed in the less than one year and the one to less than two year age groups. Rates fluctuate slightly over the years in the two to less than seven year age group and for those seven years of age and older rates were relatively stable over the four years.
| Subpopulation by age group | Count of AEFI reports (reporting rate per 100,000 population) | ||||
|---|---|---|---|---|---|
| 2013 | 2014 | 2015 | 2016 | All years | |
| <1 year | 396 (117.8) | 442 (131.2) | 386 (114.0) | 425 (124.9) | 1,649 (121.8) |
| 1 to <2 years | 379 (112.6) | 399 (117.9) | 422 (124.7) | 444 (130.6) | 1,644 (121.3) |
| 2 to <7 years | 313 (18.3) | 331 (19.3) | 242 (14.1) | 213 (12.5) | 1,099 (16.0) |
| 7 to <18 years | 425 (11.5) | 436 (11.8) | 453 (12.2) | 458 (12.2) | 1,772 (11.9) |
| 18 to <65 years | 944 (4.8) | 1,006 (5.0) | 1,028 (5.1) | 802 (4.0) | 3,780 (4.7) |
| 65+ years | 279 (6.0) | 225 (4.7) | 306 (6.2) | 270 (5.3) | 1,080 (5.5) |
| All agesTable 1 footnote a | 2,736 (9.0) | 2,839 (9.2) | 2,837 (9.1) | 2,612 (8.3) | 11,024 (8.9) |
Primary reason for reporting
During the medical case review, a primary AEFI category was assigned as the main reason for reporting and was further classified to a sub-category. Table 2 lists the primary AEFIs and their sub-categories, by total reports.The most common primary reasons for reporting were vaccination site reactions followed by rash alone which accounted for 54% of all reports submitted (8% of all SAE reports) in 2013–2016.
| Primary AEFI | Primary AEFI sub-category | Number of Reports (N=11,080) | Serious % |
|---|---|---|---|
| Allergic or allergic-like events | Anaphylaxis | 111 | 100 |
| Other allergic eventsTable 2 footnote a | 1,526 | 1 | |
| Oculo-respiratory syndrome | 158 | 1 | |
| Infection/syndrome/systemic symptoms (ISS) | Fever only | 52 | 21 |
| Infection | 182 | 34 | |
| Influenza-like illness | 82 | 4 | |
| Rash with fever and/or other illness | 346 | 5 | |
| Syndrome as indicated in AEFI reports (e.g., Kawasaki) | 90 | 79 | |
| Systemic (when several body systems are involved) | 389 | 14 | |
| Neurologic events | Aseptic meningitis | 16 | 81 |
| Ataxia/cerebellitisTable 2 footnote b | 9 | 67 | |
| Bell's palsy | 29 | 0 | |
| Encephalitis / acute disseminated encephalomyelitis (ADEM) / myelitis | 25 | 87 | |
| Guillain-Barré syndrome | 32 | 88 | |
| Other paralysis lasting more than 1 day | 7 | 43 | |
| Seizure | 389 | 48 | |
| Other neurologic eventTable 2 footnote c | 94 | 20 | |
| Rash alone | Generalized | 1,493 | 0 |
| Localized | 225 | 0 | |
| Location not specified/extent unknown | 122 | 0 | |
| Immunization anxiety | Presyncope | 31 | 3 |
| Syncope | 57 | 2 | |
| Other anxiety-related eventTable 2 footnote d | 33 | 6 | |
| Vaccination site reactions | Abscess (infected or sterile) | 54 | 11 |
| Cellulitis | 907 | 4 | |
| Extensive limb swellingTable 2 footnote e | 363 | 1 | |
| Pain in the vaccinated limb of 7 days or more | 134 | 1 | |
| Other local reactionTable 2 footnote f | 2,691 | 1 | |
| Vaccination error | Vaccination error | 9 | 0 |
| Other eventsTable 2 footnote g | Arthralgia | 73 | 5 |
| Arthritis | 36 | 28 | |
| Gastrointestinal event | 549 | 3 | |
| Hypotonic-hyporesponsive episode | 74 | 26 | |
| Intussusception | 29 | 83 | |
| Anaesthesia/Paraesthesia | 203 | 2 | |
| Parotitis | 9 | 0 | |
| Persistent crying | 72 | 3 | |
| Sudden infant death syndrome | 6 | 100 | |
| Sudden unexpected / unexplained death syndrome | 3 | 100 | |
| Thrombocytopenia | 43 | 81 | |
| Other eventsTable 2 footnote h | 327 | 14 | |
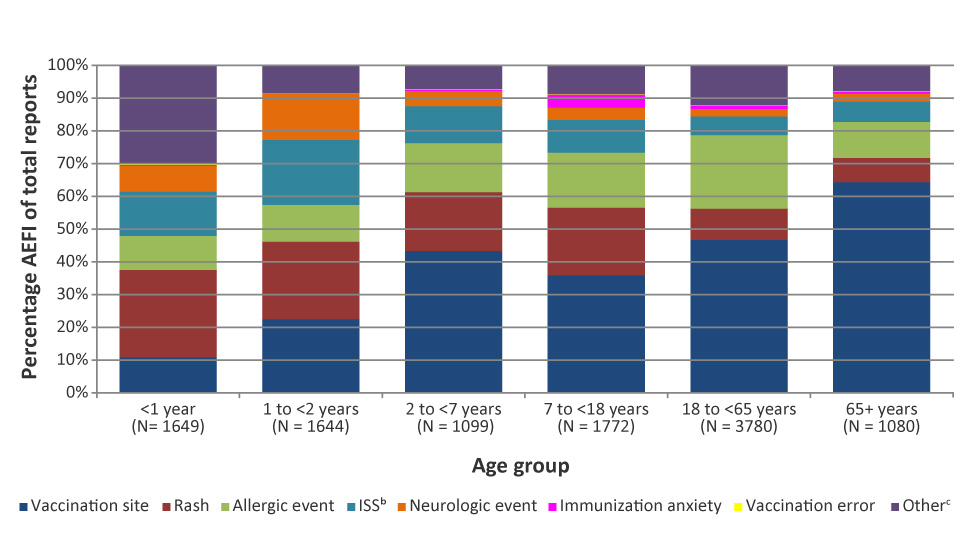
Figure 3 presents the distribution of AEFIs by primary reason and age group for reporting as determined during the medical case review. Vaccination site reactions were the most common, followed by rash and allergic events. Vaccination site reactions represented the majority for all the age groups except for children under the age of two. For children under the age of one, the most commonly reported AEFI was other (includes sub-categories such as gastrointestinal disorder, persistent crying and hypotonic-hyporesponsive episode), followed by rash. For children between the ages of one and less than two years, the most commonly reported AEFI was rash, followed by vaccination site reactions and infection/syndrome/systemic symptoms (ISS).
Figure 3: Percentage of adverse events following immunization reported by age group, 2013–2016Figure 3 footnote a
Text description: Figure 3
| Primary adverse events following immunization | Age group | ||||||
|---|---|---|---|---|---|---|---|
| <1 year (N= 1649) |
1 to <2 years (N = 1644) |
2 to <7 years (N = 1099) |
7 to <18 years (N = 1772) |
18 to <65 years (N = 3780) |
65+ years (N = 1080) |
||
| Allergic event | Percentage of adverse events following immunization | 10.4 | 11.2 | 15.0 | 16.8 | 22.4 | 11.0 |
| ISS Figure 3 footnote b | 13.5 | 19.8 | 11.3 | 10.0 | 5.8 | 6.2 | |
| Immunization anxiety | 0.1 | 0.1 | 0.5 | 4.0 | 1.0 | 0.7 | |
| Neurologic event | 8.1 | 14.2 | 4.6 | 3.7 | 2.3 | 2.4 | |
| Other Figure 3 footnote c | 30.2 | 8.5 | 7.2 | 8.9 | 12.3 | 7.9 | |
| Rash | 26.7 | 23.6 | 17.9 | 20.7 | 9.6 | 7.4 | |
| Vaccination error | 0.2 | 0.1 | 0.2 | 0.1 | 0.0 | 0.1 | |
| Vaccination site | 10.9 | 22.6 | 43.3 | 35.9 | 46.7 | 64.4 | |
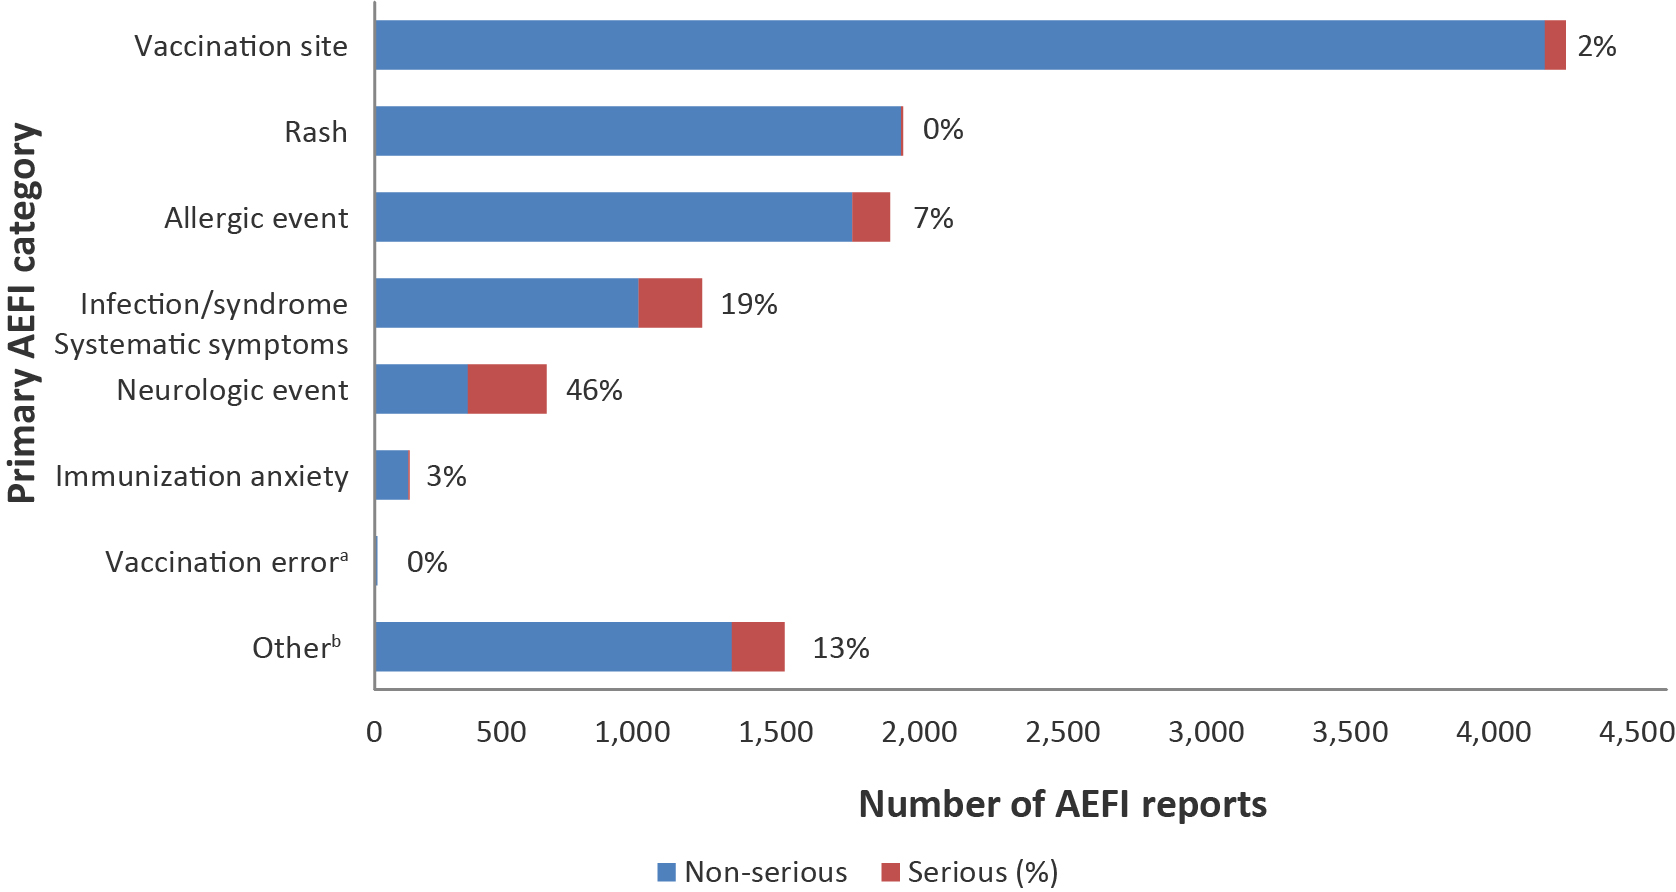
Figure 4 shows the primary AEFI categories and the proportion of each category that is considered serious. The proportion ranged from 0-46%. The proportion of serious events was highest for the neurological event category (46%), followed by ISS (19%). Of note, vaccination errors included only a small number of reports (nine AEFI reports) and no serious reports.
Figure 4: Primary adverse event following immunization category by seriousness, 2013–2016
Text description: Figure 4
| Primary adverse events following immunization | Non-serious | Serious | Number of adverse events following immunization reports | Serious AEFI (%) |
|---|---|---|---|---|
| Other Figure 4 footnote b | 1244 | 183 | 1427 | 13 |
| Vaccination error Figure 4 footnote a | 9 | 0 | 9 | 0 |
| Immunization anxiety | 117 | 4 | 121 | 3 |
| Neurologic event | 324 | 275 | 599 | 46 |
| Infection / Syndrome / Systematic symptoms | 920 | 220 | 1140 | 19 |
| Allergic event | 1664 | 131 | 1795 | 7 |
| Rash | 1833 | 7 | 1840 | 0 |
| Vaccination site | 4075 | 74 | 4149 | 2 |
| Total | 10186 | 894 | 11080 | 8 |
For children less than 18 years of age, 7% (n=407) of all submitted AEFI reports were through active surveillance. Even though the proportion is small, they represented 56% (n=401) of all serious AEFI reports submitted for this age group, reflecting the contribution of the hospital-based active surveillance system. (Note: Data not shown; numbers do not completely correspond to the percentages as the percentages have been rounded to the nearest integer.)
Health care utilization
Table 3 shows the reported highest level of care sought following an AEFI. The most frequently reported health care usage was non-urgent health care visit (37%). Most people with a reported AEFI (93%) did not require hospitalization. In almost 25% of cases, no health care was sought.
| Highest level of care sought | N | % |
|---|---|---|
| Required hospitalization (>24 hrs) | 764 | 7 |
| Resulted in prolongation of existing hospitalization | 4 | <1 |
| Emergency visit | 2,126 | 19 |
| Non-urgent visit | 4,084 | 37 |
| Telephone advice from a health professional | 487 | 4 |
| None | 2,542 | 23 |
| Unknown | 323 | 3 |
| Missing | 750 | 7 |
| Total | 11,080 | 100 |
Outcome
The outcome at time of reporting for all AEFI reports is shown in Table 4. Full recovery was reported in 76% of the reports. For those not fully recovered at the time of reporting (18%), the reports are revised when updated information is sent to CAEFISS.
| Outcome | N | % |
|---|---|---|
| Fully recovered | 8,464 | 76 |
| Not yet recovered at time of reporting | 1,948 | 18 |
| Permanent disability/incapacity | 12 | <1 |
| Death | 32 | <1 |
| Unknown | 532 | 5 |
| Missing | 92 | <1 |
| Total | 11,080 | 100 |
Serious adverse events reports
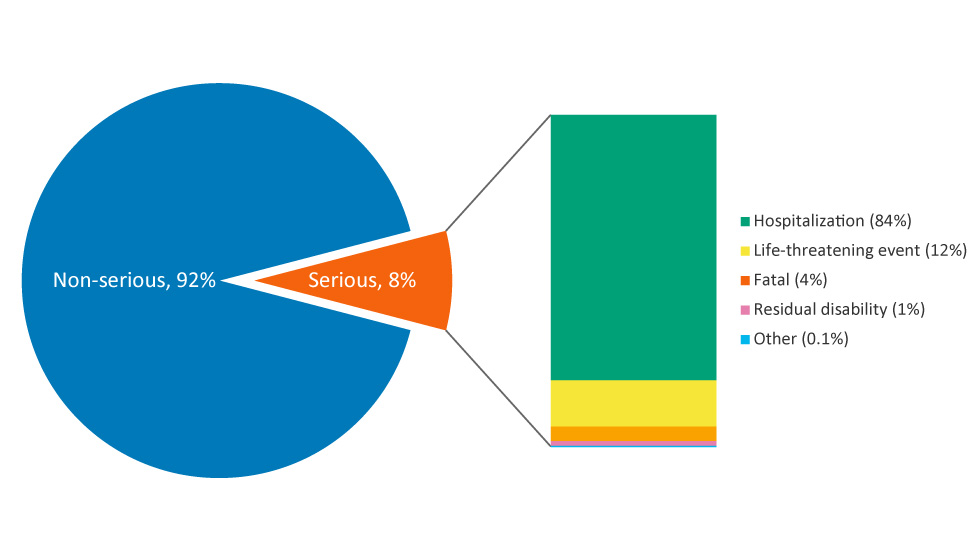
Overall there were 892 SAE reports out of over 80 million vaccine doses distributed during the reporting period. This represents a rate of 1.1/100,000 doses distributed and 8% of all AEFI reports over the four year time period (range: 1.0 to 1.2 reports per 100,000 doses distributed). Figure 5 shows the proportion of SAE reports resulting from hospitalization (n=745), life threatening events (n=103), fatal outcome (n=32), residual disability (n=11) and other reasons (n=1).
Figure 5: Classification of serious adverse events reports, 2013–2016
Text description: Figure 5
Figure 5 depicts a pie chart with a small slice removed on the right side to describe adverse events. The larger blue portion makes up 92% of the pie chart and corresponds to non-SAE reports. The small orange slice makes up 8% of the pie chart and corresponds to serious adverse event (SAE) reports. The orange section shows a further breakdown of the type of SAEs reported using a bar graph. Hospitalization makes up 84% of SAEs and is shown in green. Life-threatening events make up 12% of SAEs and are depicted in yellow. Fatal events make up 4% of SAEs and are depicted in light orange. Residual disability makes up 1% of SAEs and is depicted in pink. Finally, “Other” makes of 0.1% of SAEs and is depicted in blue.
Among the SAE reports, the most frequently reported primary AEFI was seizure (20.1%), followed by anaphylaxis (12.4%). The majority of SAEs were in children and adolescents less than 18 years of age (80%). Over half of these were reported in children under two years of age; which was to be expected, due to the number of vaccines provided to this age group to protect them when they are most vulnerable to vaccine-preventable diseases.
The majority (73%) of SAE reports had fully recovered at the time of reporting. There were roughly 15% (n=137) of SAE reports where patients had not fully recovered, at the time of reporting. These reports are revised when updated information is received by CAEFISS. The remaining outcomes for SAE reports included fatal outcome (n=32, 3.6%), permanent disability/incapacity (n=10, 1.1%), outcome unknown (n=60, 6.7%) and information on outcome was missing (n=2, 0.3%).
All 32 reports of death underwent a careful review and all were found not to be attributable to the vaccines administered. Nine of these (28%) were reported in the youngest age group (less than one year of age); of which six were reported as sudden infant death syndrome (SIDS) and three as resulting from other underlying medical conditions (cerebral infarction, cardiac arrest and complications during nasogastric feeding). Seven deaths were reported in the one to less than two years old age group, of which three were reported as sudden unexplained death syndrome (SUDS), three due to infection not related to the administered vaccine(s) (pneumococcal, streptococcus pneumonia/staphylococcus, necrotizing encephalitis) and one due to a pre-existing condition (brain injury). There were two deaths due to underlying conditions (congenital disease and severe brain injury during birth) reported in the two to less than seven years old age group, and one death due to pre-existing condition (epilepsy) in the seven to less than 18 years old age group. The remaining 13 deaths were reported in adults: six in the 18 to 65 year old age group and seven in the 65+ year old age group (age range: 49–93 years), all of whom had pre-existing medical conditions. The listed causes of death included cardiovascular diseases (myocardial infarction, ischemic heart disease and atherosclerosis), lung disease (chronic obstructive pulmonary disease, asthma), central nervous system disease (dementia, H1N1 encephalitis, cerebral palsy and intracranial empyema), malignancy (lung and breast cancer), immunosuppression and diabetes mellitus.
Top 10 vaccine groups for highest reported AEFIs
During a vaccination visit, one or more vaccines may be administered. Among the 11,080 reports, a total of 18,134 vaccines were administered, an average of two vaccines per report (range 1–6). Table 5 lists the 10 vaccine groups with the highest reporting rates, and shows 1) the number and reporting rates of AEFI reports for each of these vaccines (given alone or concomitantly with other vaccines), 2) the number and proportion of reports when the vaccine was administered alone and 3) the number and reporting rate of serious reports associated with the administration of that vaccine alone. The vaccine with the highest rate of AEFI reports submitted was Meningococcal serogroup C conjugate vaccine with a rate of 91.6 per 100,000 doses distributed (n= 1,346) with the vast majority non SAEs. Although the Meningococcal serogroup C vaccine had the highest rate, the greatest number of AEFI reports submitted was for the influenza vaccine (n=3,405; 7.1 per 100,000 doses distributed; data not shown).
| Vaccine group | Vaccine trade name | Reporting rate per 100,000 doses distributed | Reports vaccine administered alone |
Reports of SAEs from vaccine administered aloneTable 5 footnote a | |||
|---|---|---|---|---|---|---|---|
| N | % | N | % | N | RateTable 5 footnote a | ||
| Meningococcal serogroup C conjugate | Meningitec® Menjugate® Neis Vac-C® | 1,346 | 91.6 | 33 | 2 | 4 | 0.3 |
| Diphtheria, tetanus toxoid, acellular pertussis, inactivated poliomyelitis | Quadracel® Infanrix™-IPV | 167 | 76.8 | 92 | 55 | 4 | 1.8 |
| Diphtheria, tetanus toxoid, acellular pertussis, hepatitis B, inactivated poliomyelitis, haemophilus type b | Infanrix hexa™ | 462 | 65.9 | 35 | 8 | 2 | 0.3 |
| Pneumococcal conjugate | Prevnar® Synflorix™ Prevnar® 13 | 2,098 | 64.4 | 64 | 3 | 5 | 0.2 |
| Measles, mumps, rubella, varicella | Priorix-Tetra™ Proquad™ | 1,075 | 59.8 | 86 | 8 | 11 | 0.6 |
| Meningococcal B | Bexsero® | 212 | 57.1 | 160 | 75 | 17 | 4.6 |
| Haemophilus influenzae type b conjugate | ACT-HIB® Hiberix® Liquid PedvaxHib® | 39 | 45.9 | 4 | 10 | 0 | 0.0 |
| Rabies | Imovax® Rabies RabAvert® | 80 | 43.2 | 64 | 80 | 4 | 2.2 |
| Pneumococcal polysaccharide | Pneumo® 23 Pneumovax® 23 | 915 | 42.9 | 452 | 50 | 28 | 1.3 |
| Diphtheria, tetanus toxoid, acellular pertussis, inactivated poliomyelitis, Haemophilus type b | Pediacel® Infanrix™ - IPV/HIB Pentacel® | 1,512 | 40.7 | 422 | 28 | 38 | 1.0 |
Discussion
Between 2013 and 2016, the overall average annual AEFI reporting rate was 13.4/100,000 doses distributed (range: 12.1 to 14.3) or 8.9/100,000 population. This rate is lower than that reported in the 2012 CAEFISS annual report which had a rate of 10.1/100,000 population Footnote 17 and the 2015 Australian annual report, which had a rate of 12.3 per 100,000 population Footnote 28. Missing data from the one jurisdiction would have accounted for an estimated 2,000 AEFI reports over the four years, so we recalculated the rate per 100,000 and the overall rates were still lower than the 2012 rates. The differences in Canadian reporting rates may be due to under-reporting, the use of combined vaccines in children could result in fewer reports being submitted (e.g., measles, mumps, rubella vaccine (MMR) and varicella vaccines were combined into MMRV), variations in the reporting of expected milder events, and the exclusion of Market Authorization Holders reports from this analysis. Additionally for Australia there would be differences in reporting structures. No unexpected vaccine safety issues or increases in frequency or severity of expected adverse events were identified during the reporting period.
The majority of AEFI reports involved vaccines given to infants and young children. This was as expected, given that this age group receives many vaccines—both at a single visit and spaced closer together— affording more opportunities to report to a health care provider. A greater proportion (63%) of reports involved females. This is similar to other findings where females in the adult population were found to consistently report more adverse effects Footnote 7Footnote 8Footnote 9Footnote 10Footnote 11Footnote 12Footnote 13Footnote 14Footnote 15Footnote 16Footnote 17Footnote 29. The reported sex differences by age can also be explained in part by higher vaccine coverage in female adults Footnote 30. Sex-specific differences were significant (p<0.05) in those seven years of age and older, with a higher AEFI reporting rate seen in females compared with males. This is similar to results found in other studies that have studied sex-specific differences in AEFI reporting rates Footnote 29Footnote 31Footnote 32. There were more male than female AEFI reports submitted for those under seven years of age; however, this difference was not significant.
The majority of reported adverse events from approximately 80 million doses of vaccine distributed in Canada were the expected, non-serious vaccination site reactions, such as pain and redness, rash and allergic events, such as hypersensitivity. Over the four year time period, 8% of AEFIs reported were serious adverse events. This proportion is slightly higher than that reported in the United States for the same time period (5%) and compared to previous years in Canada, but lower than that reported in Australia in 2015 (15%) Footnote 17Footnote 28Footnote 33. The majority of SAEs occurred in children and adolescents, which may in part be due to IMPACT, which contributes over half of all serious AEFI reports for those under the age of 18 years and looks for specific surveillance targets in children Footnote 20Footnote 34. At the time of reporting, the majority of the SAEs had fully recovered. Of the 32 deaths reported over the four year time period, none were found to be attributable to the vaccines administered.
Limitations
Passive surveillance for AEFIs is subject to limitations such as underreporting, lack of certainty regarding the diagnostic validity of a reported event, missing information regarding other potential causes such as underlying medical conditions or concomitant medications and the different AEFI reporting practices by jurisdictions within Canada, possibly leading to over/under-reporting of mild AEFIs from some FPTs. Despite these limitations, passive surveillance is useful for detecting potential vaccine signals, which can be further investigated and verified. Seasonality was not analyzed as a potential variable in this report.
There are also limitations associated with active surveillance. IMPACT uses predetermined AEFI targets (such as seizure), which may limit its ability to identify new adverse reactions to immunizations. In addition, IMPACT focuses on admitted pediatric cases, which means only the most serious cases are detected. Lastly, IMPACT is not comprehensive, as it covers only 90% of Canada’s tertiary care pediatric beds and hospital admissions Footnote 23Footnote 34. Despite these limitations, IMPACT is able to fulfill an important role in vaccine safety surveillance by actively identifying targeted serious AEFIs in the pediatric population.
In addition, the number of doses administered in the population cannot be determined therefore either doses distributed or population statistics are used as the denominator. The use of the doses distributed can underestimate rates, as they do not take wastage into account. Furthermore, doses distributed in one year may not be administered in that same year, further limiting the accuracy of the doses distributed denominator. Despite these limitations, a doses distributed-based denominator for rate calculations was used when possible in this report as a population-based denominator assumes similar distribution of vaccine doses across population subgroups, although this may not be true in all cases.
Conclusion
Canada has a comprehensive vaccine surveillance system that revealed an average AEFI rate of 8.9/100,000 population. There were no unexpected vaccine safety issues identified or increases in frequency or severity of expected adverse events. The majority of reported AEFIs were expected and mild in nature and there were no unexpected or increases in serious adverse events. Vaccines marketed in Canada continue to have an excellent safety profile.
Authors’ statement
NA – Conceptualization, methodology, validation, writing-original draft
KW – Writing-review and editing, supervision
MF – Conceptualization, methodology, validation, software, formal analysis, writing-original draft, writing-review and editing
CC – Software, formal analysis, validation, writing-original draft, writing-review and editing
HA – Validation, writing-review and editing, supervision
KJ – Writing-review and editing
Conflict of Interest
None.
Acknowledgments
This report would not be possible without the contribution of the public, public health professionals, and local/regional and provincial/territorial public health authorities who submit reports to CAEFISS as well as the ongoing collaboration of the members of the Vaccine Vigilance Working Group. Furthermore, we would like to thank the members of this group for input and support in the development of this report. We would like to thank each individual who takes the time to submit an AEFI report for their contribution to vaccine safety in Canada.
Funding
This work was funded, in entirety, by the Public Health Agency of Canada.
Page details
- Date modified: