
Assessment of the Public Service Commission’s Innovation Capacity
Table of contents
1. Introduction
1. In 2018, the Public Service Commission (the agency) celebrated its 110th anniversary. Since 1908, many factors have influenced the nature of the public service and the agency’s role. These include increases in the role and size of government, economic changes, technological changes, and a growing and more diversified population.Footnote 1 All of these factors have led the agency to look for innovative approaches to addressing current staffing and recruitment issues and priorities.
2. Federal public service leaders recognize that complex global and national factors have created a need for new solutions and approaches in developing public sector policies and delivering programs and services. As the Clerk of the Privy Council stated, “since launching Blueprint 2020 in 2013, the public service has worked to instill a culture where innovation is supported and valued. Recognizing the need for change, public servants are doing their part to achieve it.”Footnote 2 The Clerk also noted that “based on the 2017 Public Service Employee Survey, 67% of public servants indicated that they were encouraged to be innovative or take initiative in their work, up from 63% in 2014. Hence, the combination of efforts at the system-wide, organizational, and individual levels are truly making a difference.” For reference, the agency’s percentage increased from 67% in 2014 to 71% in 2017.
3. A joint Public Policy Forum and Deloitte report on innovation in government defines innovation as “a commitment by governments to recognize and act upon new ideas, new operating methods, and new ways of delivering services. It also includes finding new ways to maximize resources, be engaging with the public, taking new risks and harnessing new technologies.”Footnote 3 As a result, public sector innovation consists of a wide range of activities from continuously improving or implementing new ways to perform tasks, to incremental process improvements, to changes to service delivery mechanisms, up to major transformational projects. Each type of change, continuous improvement initiative, and innovation is important, and everyone within the agency can play a part.
4. There have been a number of studies dedicated to the subject of public sector innovation. Based on the research, the following elements are considered necessary for innovation to occur and be effective. Innovation must be: client-driven, asked for by leaders, well supported by resources and employee skills, conducted within a collaborative environment, and consistently evaluated to measure and reward innovative initiatives. An Organisation for Economic Co-operation and Development report on innovation in the public sector highlighted that “asking public employees to innovate may not go very far if the organizational environment is not conducive to supporting innovation.”Footnote 4
5. A good overview of what innovation means from a public sector perspective is captured in the Federal, Provincial, and Territorial Declaration on Public Sector Innovation, which states, “Innovation, experimentation and openness require constant effort — even if they present risks. We need to be ambitious, nimble and collaborative to achieve meaningful and lasting results. We need to rely on the diversity, ingenuity and creativity of Canadians to solve real problems. In times of considerable change and uncertainty, the greatest risk is refusing to take a chance and try new things.”Footnote 5
6. The agency has demonstrated a commitment to innovation. For example, the President’s message in the Departmental Plan 2018-19 recognizes that “it is through experimentation and innovation that real change happens. I believe that the recipe for success is to develop solid risk mitigation strategies that allow us to try something new, evaluate it, refine it and then try it again. The true risk to progress is being so afraid of failure that we never experiment or push our limits.” The Departmental Plan highlights the important role that innovation plays in the day-to-day work of the organization in achieving its objectives.
7. In addition, the draft Departmental Results Report for 2017-18 highlighted the fact that the organization focused on innovation and experimentation by:
- exploring new methods to attract and hire high-quality candidates
- streamlining and modernizing application processes
- discovering new and effective approaches for assessing candidates
- creating partnerships with other countries and organizations to learn best practices that we can try out within the federal public service
- improving diversity and inclusion in the public service, working with key stakeholders to develop programs that increase representation and accessibility
People ─ the true drivers of innovation!
Everyone has the potential to be an innovator and contribute to improving how the agency meets its mandate.
As the President noted: “It’s been said that the biggest resister of innovation is people. And yet the most significant driver of innovation is...people. Challenging the status quo isn’t easy, but it’s necessary. It’s the best way to reach our collective goal of renewing and revitalizing the public service for coming generations.”
(2018-19 Departmental plan email to all staff from President Patrick Borbey, April 2018.)
New Direction in Staffing interface project
On April 1, 2016, the New Direction in Staffing was implemented, consisting of renewed policy and oversight frameworks.
The New Direction in Staffing interface project leveraged the new appointment framework to facilitate interaction between job seekers, hiring managers, and human resource professionals, in order to begin the process of identifying the public service staffing system of the future.
The project team held over 100 outreach and engagement sessions with key stakeholders, resulting in over 1 400 pieces of feedback from over 50 organizations.
The results of this project will be incorporated into the project to transform the Public Service Resourcing System.
8. There has been a strong focus on innovation since the launch of the Enhanced Integration Project in 2012-13, which led to the implementation of the New Direction in Staffing in 2016. Innovative work continues to be performed throughout the organization. A few examples include the New Direction in Staffing interface project, the transformation of the Public Service Resourcing System, and the implementation of the new approach to oversight that focuses on horizontal system-wide audits versus traditional individual departmental staffing audits. These are a few examples of innovation at the agency, ranging from improving existing processes, to developing new pilot programs, up to major transformational business-led information technology driven projects (see Table 1).
| Process improvements | New pilot programs development | Transformational change |
|---|---|---|
|
|
|
1.1 Risks, objective, methodology and scope
Risks
9. The following risks were identified during the planning phase of this assessment:
- accountabilities may be unclear, which affects the overall direction and resource allocation decision-making processes to support innovation initiatives
- there may be an inherent “fear of failure” that affects the agency’s ability to benefit from the appetite to innovate and be innovative
- communications on the importance of innovation and the support provided to staff to try new things in a safe space may not be as effective as assumed
Objective
10. The objective was to assess the capacity of the Public Service Commission to innovate, obtain a better understanding of how the agency fosters innovation, and identify areas for improvement to strengthen innovation practices.
Methodology
11. In order to achieve the objective, the following activities were carried out:
- reviews and analyses of various internal and external documentation regarding innovation
- a 30-question survey to all employees, conducted from July 4 to July 31, 2018
- analysis of the survey results
- individual interviews with agency staff
- consultations with officials from the Treasury Board of Canada Secretariat Internal Audit and Evaluation Bureau
12. The general approach is based on a framework that was developed by external consultants, PricewaterhouseCoopers, in collaboration with the Department of Canadian Heritage and the Treasury Board of Canada Secretariat. We modified the framework’s survey questionnaire, which incorporated a maturity model, in order to tailor it to the objective. We chose a subset of the 49 questions, to create a survey including 30 questions on innovation and 3 demographic questions.
13. The survey was administered in order to:
- understand the current environment within which agency staff are innovating
- inform discussions with the agency staff on the current state of innovation, including strengths, weaknesses, and opportunities for improvement to enhance the impact within the agency and across the public service
- identify key considerations and actions to enhance the support provided to staff to be innovative
14. The survey was sent to 810 agency staff at the national headquarters in Gatineau, Quebec, and at 5 regional offices across Canada. The regional offices are located in Vancouver, British Columbia; Toronto, Ontario; Gatineau, Quebec; Montréal, Quebec; and Halifax, Nova Scotia. We received 400 responses to our survey, which translates into a 49.4% response rate. The response breakdown by occupational level was 25 executives, 55 managers, 28 supervisors and 292 employees. The breakdown according to work location was 57 responses for the regional offices and 343 for headquarters.
Scope
15. Innovation practices were assessed against 6 attributes (see Table 2) as described in the innovation maturity model that was the basis for this assessment.
| Stakeholder expectations | Strategic alignment | Internal activities | External activities | Organization | Culture |
|---|---|---|---|---|---|
|
|
|
|
|
|
16. This work was conducted jointly by staff from the agency’s Internal Audit Division and Evaluation Division of the Internal Audit and Evaluation Directorate. The team worked collaboratively with staff members from the Data Services Analytical Division of the Oversight and Investigations Sector to administer the survey. Internal audit officials from the Treasury Board of Canada Secretariat’s Internal Audit and Evaluation Branch provided support and guidance to the team throughout the assessment.
1.2 Statement of conformance
17. In our professional judgement, sufficient and appropriate review procedures were carried out, and appropriate evidence was gathered to support the accuracy of the conclusions in this report. The conclusions were based on observations and analyses at the time of our review. The conclusions on the agency’s capacity to support innovation apply only to the period under review. The evidence was gathered in accordance with the Treasury Board Policy on Internal Audit, and the Institute of Internal Auditors International Standards for the Professional of Internal Auditing.
2. Assessment results
2.1 Overall innovation capacity results
18. The agency has succeeded in embedding change, continuous improvement, and innovation as important elements in achieving its mandate and priorities. Priority innovation activities are identified in key departmental planning and reporting documents (Departmental Plan, Departmental Results Report, and Annual Report), agency staff are aware the importance of identifying new ways of working, and they are supported in trying new approaches to fulfill their roles and responsibilities to meet the organization’s mandate and priorities. There are a number of good innovation practices currently being implemented across the agency.
19. The agency’s key innovation strengths lie in its culture and organizational attributes. Staff are involved in innovation activities and believe that innovation is important for the work performed by their sectors. Staff understand that sectors are committing resources to improve process and program delivery, and that sector and overall agency innovation priorities are aligned. The agency has identified innovation as a priority, and planned activities are aligned with the values of protecting the merit and non-partisanship of the public service staffing system.
20. The assessment results identify 3 areas that the agency could focus on to strengthen its innovation capacity and maturity level. These are:
- Area # 1 – Reinforcing the acceptance of risk taking: The agency could reinforce the importance and acceptance of appropriate risk taking and communicate the acceptable level of risk tolerance to all staff. This can be done by communicating both failures and successes so that all staff have the opportunity to learn from these examples. As innovation involves risk by nature, this could help staff overcome potential obstacles that may limit innovative practices, which could consequently strengthen organizational innovation performance.
- Area # 2 – Improving communication flows: The agency could better communicate information on the support provided for innovation and experimentation (top-down and bottom-up). This would increase awareness so that all staff know that they can contribute meaningfully to improving the agency. The agency could, for example, develop communications tools or approaches dedicated to innovation that inform all staff of available funding, successes, failures, lessons learned, as well as the status of current innovation activities.
- Area # 3 – Strengthening collaboration: The agency could enhance how it works and collaborates with external stakeholders and internally across sectors. Externally, the agency could enhance its outreach to stakeholders on how it could support staffing innovation across the public service, and obtain input on agency-led innovations. Internally, sectors could work together more closely to support the delivery of the agency’s innovation priorities.
21. The agency’s culture and organizational environment are supportive of innovation. These are the agency’s greatest strengths. They set a positive tone for implementing the considerations identified in this report to enhance the agency’s innovation capacity. The next section provides more detailed information for each of the 6 innovation attributes assessed. It presents the elements that support innovation, opportunities for improvement, and key considerations for actions to strengthen the agency’s capacity to innovate.
2.2 Management Response
We appreciate the opportunity to respond to this Assessment. The Agency was pleased with the results and we will use the information as part of a whole-of-agency focus on innovation. We are pleased to provide a few examples of how we will use this assessment to help guide us moving forward.
The Information Technology Services Directorate, as part of its planning for fiscal year 2019-2020, has set aside $85,000 to be used specifically for innovation. This will assist the Agency in its transformation agenda. In order to mitigate risks, any IT innovation will utilize a “Sandbox Environment,” which will allow us to create an environment that isolates our experimentation efforts, effectively ensuring that our existing software and programs are not affected. We will ensure our efforts are aligned with our Departmental Results Framework.
The Policy and Communications Sector has created a Director General position responsible for leading innovation in staffing. The creation and staffing of this position will allow the Agency to systematically look at ways of innovating in the hiring process, and will also facilitate documenting, reporting and communicating on this innovation in a meaningful way.
Finally, with the new Results and Delivery Unit in place, we have implemented a structured approach to planning and reporting on innovation and experimentation, using the Departmental Plan and the Departmental Report on Results, respectively. Similarly, a more in-depth look at capturing operational risks is part of the next planning cycle. The planning cycle for 2019-20 is currently underway, and sectors have been specifically asked to document deliverables that can be categorized as experimentation, so that these activities may be closely tracked and reported upon. As we finalize the documents, we will consider the communication strategy around these documents, to help ensure that the Agency improves its communication regarding innovation, experimentation and acceptable levels of risk.
The organizational changes that have been put in place will help to strengthen collaboration around innovation, both horizontally within the Agency, as well as with our external stakeholders. We will continue to look at ways that we can strengthen innovation and innovative practices in our daily work, and how we can improve our communication around these efforts.
2.3 Innovation capacity assessment results by attribute
Culture
22. This attribute relates to aligning innovation goals, cultural attributes and employee behaviours to an organization’s innovation strategy. There were 7 questions in the survey relating to culture. The general results are presented in Table 3 below.
| Survey Questions | Great extent | Moderate extent | Small extent | Not at all | Do not know |
|---|---|---|---|---|---|
| Is innovation deemed as important for your sector? | 43% | 38% | 11% | 4% | 4% |
| Is technology seen as a driver for innovation? | 37% | 33% | 18% | 8% | 6% |
| Are you involved in innovation activities? | 21% | 38% | 26% | 14% | 1% |
| Are the agency’s values linked to innovation? | 17% | 41% | 23% | 7% | 12% |
| Do agency leaders engage with the staff around innovation? | 14% | 41% | 29% | 10% | 7% |
| Does your sector’s culture support risk taking and innovation? | 13% | 40% | 31% | 9% | 8% |
| Does your sector view failure as a learning opportunity? | 12% | 35% | 24% | 11% | 19% |
What we heard
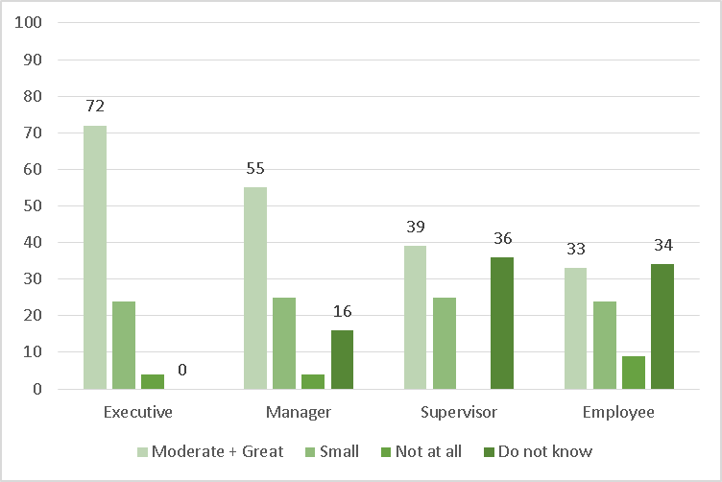
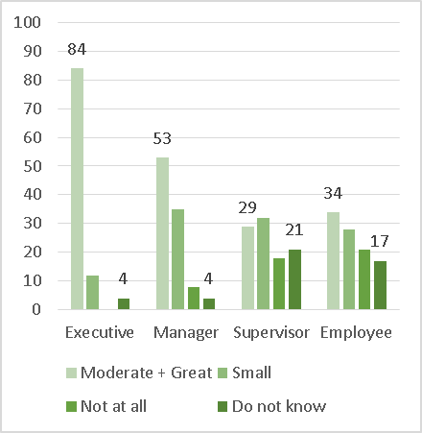
23. Overall, the agency’s culture supports innovation. Six of the attributes have positive response rates greater than 50%, and positive responses range from 48% to 81%. Staff understand that innovation is a priority for their sector, they are involved in various activities, and believe that innovation is aligned to the agency’s values. The key elements, leadership engagement, staff knowledge of the importance of innovation, and staff involvement, are very strong for the agency (see graphs 1 to 3).
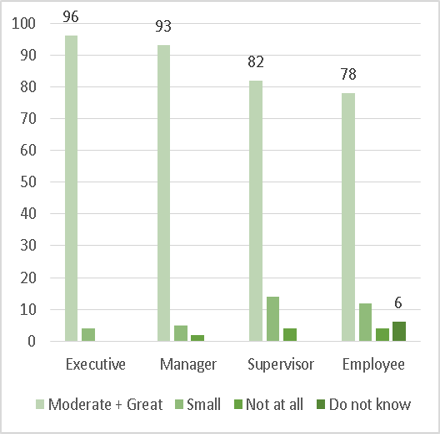
Text Alternative
| Occupational Level | Executive | Manager | Supervisor | Employee |
|---|---|---|---|---|
| Moderate + Great | 96% | 93% | 82% | 78% |
| Small | 4% | 5% | 14% | 12% |
| Not at all | 0% | 2% | 4% | 4% |
| Do not know | 0% | 0% | 0% | 5% |

Text Alternative
| Occupational Level | Executive | Manager | Supervisor | Employee |
|---|---|---|---|---|
| Moderate + Great | 76% | 47% | 43% | 56% |
| Small | 20% | 45% | 32% | 26% |
| Not at all | 4% | 5% | 18% | 10% |
| Do not know | 0% | 2% | 7% | 8% |

Text Alternative
| Occupational Level | Executive | Manager | Supervisor | Employee |
|---|---|---|---|---|
| Moderate + Great | 96% | 73% | 68% | 52% |
| Small | 4% | 24% | 21% | 29% |
| Not at all | 0% | 4% | 4% | 17% |
| Do not know | 0% | 0% | 7% | 1% |
24. The results indicate that all occupational levels are involved in activities and believe that they are being engaged. Of note are the questions on sectors viewing failure as a learning opportunity and how much support there is for risk taking in innovation. The survey results indicate that 46% of employees believe that failure is viewed as a learning opportunity for their sector, while 19% did not know. With respect to support for risk taking in innovation, 53% of the respondents believe that there is support within their sector to take risks.
25. Negative responses for the 7 questions averaged roughly 10%. This demonstrates that agency staff believe that their sector’s culture supports innovation, and that they have the ability to think about new approaches to their work and take action. The results demonstrate that the agency’s culture supports innovation.
Organization
26. This attribute refers to putting the organizational elements in place to ensure that innovation is supported and conducted in a transparent, efficient and effective manner. There were 7 questions in the survey about the organization. The results are presented in Table 4 below.
| Survey Questions | Great extent | Moderate extent | Small extent | Not at all | Do not know |
|---|---|---|---|---|---|
| Does your sector management offer recognition for innovation? | 23.25% | 38.25% | 19% | 7.5% | 12% |
| Do you think your sector have people with the skills to innovate? | 21.75% | 41% | 22.5% | 2.5% | 12.25% |
| Does your sector encourage staff to be part of informal and formal innovation groups that look at new ideas? | 16.25% | 29.5% | 30.75% | 9.5% | 14% |
| Does your sector commit / allocate resources to support innovation activities? | 11.5% | 33.75% | 27.5% | 11% | 16.25% |
| Does your sector recruit and retain individuals with innovation capabilities? | 9.75% | 30.75% | 26.75% | 7.75% | 25% |
| Does your sector identify the workforce implications of its innovation strategy? | 7.25% | 32% | 20.25% | 11% | 29.5% |
| Does your sector quickly respond to changes and innovation opportunities? | 10% | 28.25% | 36.25% | 10.25% | 15.25% |
What we heard
27. Organization is the second-highest rated attribute; 3 of the 7 response levels are greater than 50%, and positive responses range from 38% to 61.5%. Staff generally perceive that they are supported in exploring new approaches and ways to achieve the agency’s objectives and priorities, and are recognized for their efforts.
28. The results indicate that staff believe that the agency has people with the skills to innovate. This is consistent with the Public Service Employee Survey 2017 (Q26)Footnote 6 result for the question, “in my work unit, I believe we have people who can do the job” — 78% positive response. However, there are concerns in the area of recruitment and retention. The results by work location are similar; however, there is a difference in perspective on this question by occupational level (see Graph 4).

Text Alternative
| Occupational Level | Executive | Manager | Supervisor | Employee |
|---|---|---|---|---|
| Moderate + Great | 76% | 47% | 39% | 36% |
| Small | 20% | 33% | 29% | 26% |
| Not at all | 4% | 5% | 7% | 9% |
| Do not know | 0% | 15% | 25% | 29% |
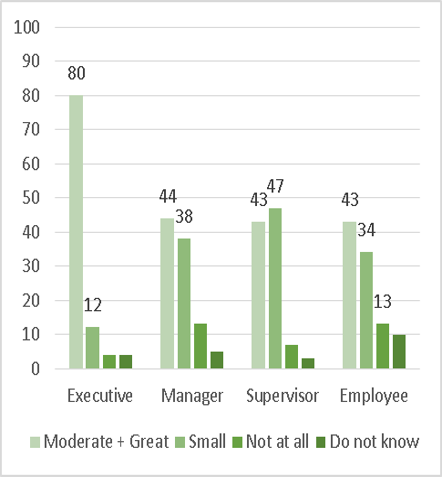
29. One key element of the organization attribute is for leaders to recognize employee innovation initiatives. The survey results indicate that 62% of respondents acknowledge that sector management recognizes employees for work performed on innovation-related activities (see Graph 5).

Text Alternative
| Occupational Level | Executive | Manager | Supervisor | Employee |
|---|---|---|---|---|
| Moderate + Great | 80% | 67% | 68% | 58% |
| Small | 12% | 16% | 14% | 21% |
| Not at all | 4% | 5% | 11% | 14% |
| Do not know | 4% | 5% | 11% | 14% |
31. There were 2 questions with relatively higher “do not know” responses. One in 4 respondents indicated that they don’t know the extent to which their sector is recruiting and retaining people with the skills to innovate, and one in 3 respondents don’t know the extent to which their sector identifies the workforce implications of the agency’s innovation strategy.
Considerations
32. In general, the organization attribute results are positive. Respondents from all occupational levels believe that the main organizational requirements for the agency to mature as an innovative organization are in place. Staff have the ability to innovate, and sector management recognizes innovation activity outcomes. The agency appears to have some room to grow in this area, particularly with regards to how quickly it reacts to innovation opportunities, integrating sector innovation strategies into workforce planning, and committing resources to support innovation initiatives.
Internal innovation activities
33. This attribute is about building the right capabilities that are aligned with an organization’s innovation strategy. There were 7 questions in the survey related to internal innovation activities. The results are presented in Table 5 below.
| Survey Questions | Great extent | Moderate extent | Small extent | Not at all | Do not know |
|---|---|---|---|---|---|
| Does your sector management communicate about innovation within the PSC? | 14% | 35% | 32.5% | 9.75% | 8.75% |
| Are staff empowered to identify internal opportunities and share innovative ideas? | 11% | 34.25% | 33.75% | 12.75% | 8.25% |
| Are innovation successes shared / publicized? | 10.5% | 32% | 32.75% | 11% | 13.75% |
| Does your sector engage in process innovation initiatives to improve efficiencies and reduce costs? | 9.5% | 32.5% | 26.5% | 10.75% | 20.75% |
| Does your sector clearly define your innovation planning and prioritization process? | 7.5% | 26.25% | 26% | 18.75% | 21.5% |
| Does your sector assess and manage the risks related to innovation? | 9.25% | 24% | 20.75% | 9% | 37% |
| Are innovation failures and lessons learned shared? | 4.25% | 18% | 32.5% | 26.25% | 19% |
What we heard
34. The positive survey response levels for the 7 questions ranged from 22% to 49%; 3 questions generated “do not know” responses greater than 20%.
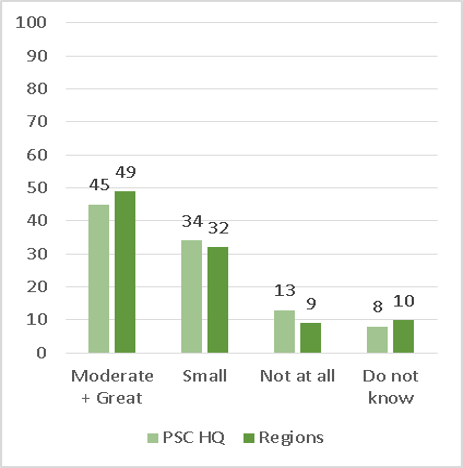
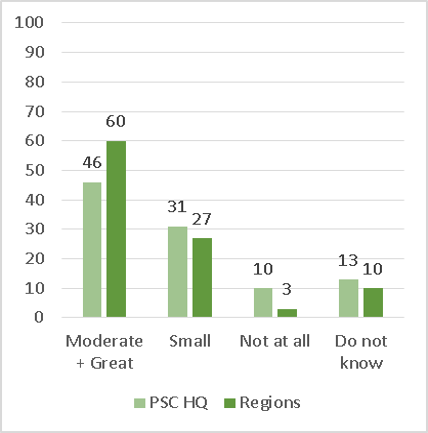
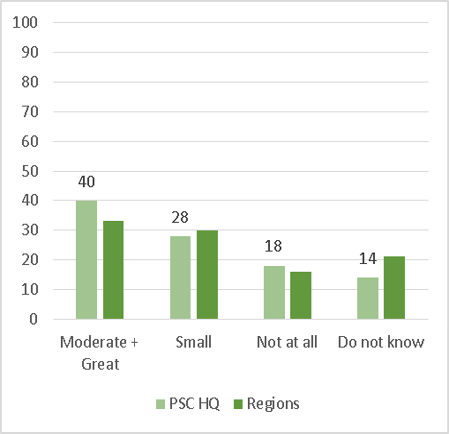
35. In terms of sector management’s general communications on innovation, there is a 49% positive response level. Regional office respondents (see Graph 6) have a relatively greater positive response level (61%). The percentage of “do not know” and “not at all” responses is low, which suggests that general communications regarding innovation are provided to and received by staff across the country.

Text Alternative
| Work Location | PSC HQ | Regions |
|---|---|---|
| Moderate + Great | 47% | 61% |
| Small | 34% | 27% |
| Not at all | 11% | 5% |
| Do not know | 8% | 7% |
36. With respect to empowerment, 45% of respondents believe they are empowered to identify opportunities and share innovative ideas. There are different responses by occupational level (see Graph 7), but the results by work location are similar (see Graph 8).
Text Alternative
| Occupational Level | Executive | Manager | Supervisor | Employee |
|---|---|---|---|---|
| Moderate + Great | 80% | 44% | 43% | 43% |
| Small | 12% | 38% | 47% | 34% |
| Not at all | 4% | 13% | 7% | 13% |
| Do not know | 4% | 5% | 4% | 10% |
Text Alternative
| Work Location | PSC HQ | Regions |
|---|---|---|
| Moderate + Great | 45% | 49% |
| Small | 34% | 32% |
| Not at all | 13% | 9% |
| Do not know | 8% | 10% |
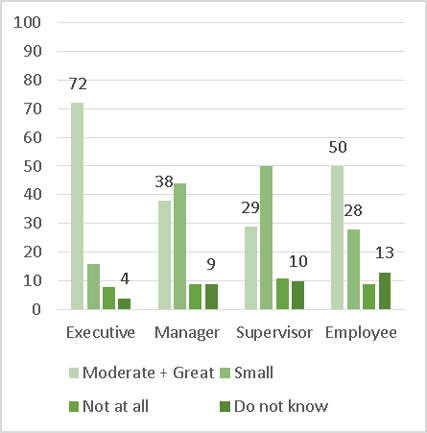
37. There is a general perception that innovation successes are more likely to be shared than failures and lessons learned (see graphs 9 and 10). This may be due to communication flows or potential gaps in understanding for certain occupational levels. Graph 10 highlights that executives responded significantly more positively to questions about whether innovation failures and lessons learned are shared.
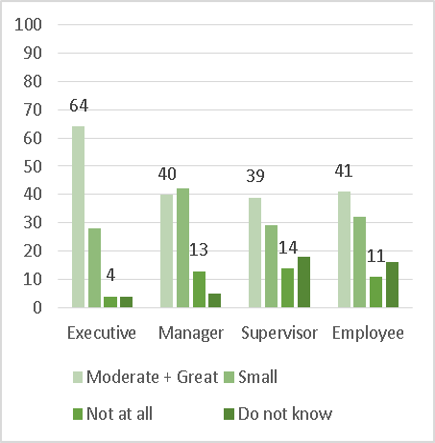
Text Alternative
| Occupational Level | Executive | Manager | Supervisor | Employee |
|---|---|---|---|---|
| Moderate + Great | 64% | 40% | 39% | 41% |
| Small | 28% | 42% | 29% | 32% |
| Not at all | 4% | 13% | 14% | 11% |
| Do not know | 4% | 5% | 18% | 16% |

Text Alternative
| Occupational Level | Executive | Manager | Supervisor | Employee |
|---|---|---|---|---|
| Moderate + Great | 44% | 18% | 14% | 22% |
| Small | 32% | 36% | 36% | 32% |
| Not at all | 16% | 34% | 36% | 25% |
| Do not know | 8% | 11% | 14% | 22% |
38. With respect to risk management, 37% of respondents don’t know how well sectors assess and manage the risks related to innovation. Positive responses and “do not know” responses vary significantly according to occupational level (see Graph 11).

Text Alternative
| Occupational Level | Executive | Manager | Supervisor | Employee |
|---|---|---|---|---|
| Moderate + Great | 60% | 36% | 21% | 31% |
| Small | 28% | 33% | 29% | 17% |
| Not at all | 4% | 7% | 11% | 10% |
| Do not know | 8% | 24% | 39% | 42% |
Considerations
39. While the culture and organization attributes are positive and demonstrate that the agency’s environment fosters innovation, there are internal innovation activity elements that have been identified as opportunities for improvement. These are specifically related to closing the knowledge gap across occupational levels, and sharing information on innovation failures and the agency’s risk management approach related to innovation. Strengthening communication channels would help staff understand that taking risks to innovate is acceptable within the agency. This could also assist in bridging the gaps in perception between executives and managers, supervisors and employees about staff empowerment to be innovative and share ideas.
External innovation activities
40. This attribute is about collaborating with external partners and learning from other jurisdiction experiences to strengthen an organization’s innovation capacity. There were 2 questions in the survey related to external innovation activities. The results are presented in Table 6.
| Survey Questions | Great extent | Moderate extent | Small extent | Not at all | Do not know |
|---|---|---|---|---|---|
| Does your sector collaborate with external stakeholders on innovation projects and manage roles and responsibilities? | 11.25% | 27.5% | 24.25% | 7.25% | 29.75% |
| Does your sector leverage the innovative practices of comparable Canadian and global jurisdictions? | 6.5% | 22% | 24.25% | 12.75% | 34.5% |
What we heard
41. The collaboration question received a relatively higher number of “do not know” responses from all occupational levels, except executives. In particular, there is a high percentage of “do not know” responses from supervisors (36%) and employees (34%). This may be due to a lack of communications, or employee and supervisor understanding of how well their sector collaborates with external stakeholders on innovation.
42. Based on the number of “not at all” and “do not know” responses, leveraging innovation practices from domestic and international partners is an area for improvement for the agency. While 28.5% of respondents indicate that the agency takes advantage of innovation practices from comparable jurisdictions, over 47% of respondents either don’t know the extent to which this happens, or don’t know whether it is occurs.
43. Roughly 40% of respondents indicate that sectors collaborate with external stakeholders on innovation projects. However, there is a significant gap in knowledge by occupational level on sector collaboration with external stakeholders on innovation projects (see Graph 12).
Text Alternative
| Occupational Level | Executive | Manager | Supervisor | Employee |
|---|---|---|---|---|
| Moderate + Great | 72% | 55% | 39% | 33% |
| Small | 24% | 25% | 25% | 24% |
| Not at all | 4% | 4% | 0% | 9% |
| Do not know | 0% | 16% | 36% | 34% |
Considerations
44. The survey results indicate that collaboration with external stakeholders is an area for improvement for the agency. It appears that while the agency has been conducting more outreach over the past year and a half than in the recent past, more could be done to highlight what is occurring and how these types of actions benefit the agency and the public service overall.
Strategic alignment
45. This attribute is about articulating clear innovation strategies that are aligned to an organization’s priorities and mandate. There were 5 questions in the survey related to strategic alignment. The results are presented in Table 7.
| Survey Questions | Great extent | Moderate extent | Small extent | Not at all | Do not know |
|---|---|---|---|---|---|
| Has the vision for innovation been articulated within the PSC? | 13.25% | 34.75% | 30.75% | 8.75% | 12.5% |
| Are your sector’s innovation priorities aligned with the PSC’s overall innovation vision and priorities? | 15% | 27% | 16% | 4.75% | 37.25% |
| Does your sector forecast trends to prioritize innovation needs? | 5.25% | 27.75% | 18.5% | 9.5% | 39% |
| Does your sector have innovation metrics as part of its Key Performance Indicators? | 6.5% | 23% | 17.75% | 14% | 38.75% |
| Do processes exist to seek and obtain funding to support innovation initiatives? | 3.5% | 15.25% | 19.25% | 10.75% | 51.25% |
What we heard
46. The positive survey response levels for the 5 questions ranged from 19% to 48%. Four of the questions generated “do not know” responses greater than 37% — with one being greater than 50%.
47. Almost half of the staff indicated that a vison for innovation has been articulated within the agency. However, there is a significant variance in positive responses by occupational level (see Graph 13). In addition, regional office respondents had a relatively higher positive response (see Graph 14).
Text Alternative
| Occupational Level | Executive | Manager | Supervisor | Employee |
|---|---|---|---|---|
| Moderate + Great | 72% | 38% | 29% | 50% |
| Small | 16% | 44% | 50% | 28% |
| Not at all | 8% | 9% | 11% | 9% |
| Do not know | 4% | 9% | 10% | 13% |
Text Alternative
| Work Location | PSC HQ | Regions |
|---|---|---|
| Moderate + Great | 46% | 60% |
| Small | 31% | 27% |
| Not at all | 10% | 3% |
| Do not know | 13% | 10% |
48. As well, 42% of respondents believe that their sector’s innovation priorities are aligned with the agency’s priorities. This said, 37% do not know the extent. The graphs below show the extent to which sector innovation priorities are aligned with the agency’s overall innovation vision and priorities. In general, executives have a more positive view on this subject (see Graph 15). This graph also shows that managers, supervisors and employees had a relatively higher “do not know” response rate. The regional offices have a slightly greater positive response rate than the headquarters respondents (see Graph 16).

Text Alternative
| Occupational Level | Executive | Manager | Supervisor | Employee |
|---|---|---|---|---|
| Moderate + Great | 64% | 42% | 43% | 40% |
| Small | 24% | 18% | 7% | 16% |
| Not at all | 4% | 5% | 7% | 4% |
| Do not know | 8% | 35% | 43% | 40% |
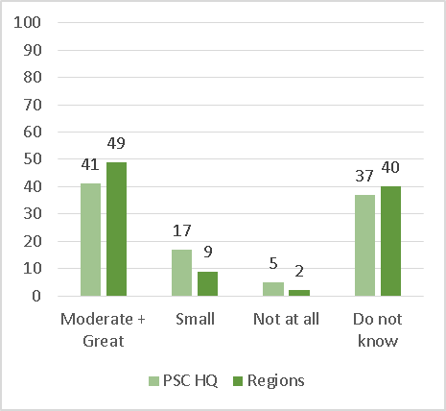
Text Alternative
| Work Location | PSC HQ | Regions |
|---|---|---|
| Moderate + Great | 41% | 49% |
| Small | 17% | 9% |
| Not at all | 5% | 2% |
| Do not know | 37% | 40% |
49. Over half of survey respondents did not know the extent to which processes exist to seek and obtain funding for innovation initiatives. There is a relatively large response rate variance between occupational levels (see Graph 17). In particular, 64% of supervisors indicated that they did not know about funding mechanisms. From a regional perspective, Graph 18 shows that nearly 60% of regional offices respondents are not aware of any processes. Given the results, the agency may need to increase awareness of the funding mechanisms available for staff to request and obtain resources to develop and implement innovation initiatives.

Text Alternative
| Occupational Level | Executive | Manager | Supervisor | Employee |
|---|---|---|---|---|
| Moderate + Great | 36% | 29% | 11% | 16% |
| Small | 36% | 24% | 21% | 17% |
| Not at all | 12% | 15% | 4% | 11% |
| Do not know | 16% | 32% | 64% | 57% |

Text Alternative
| Work Location | PSC HQ | Regions |
|---|---|---|
| Moderate + Great | 18% | 21% |
| Small | 20% | 12% |
| Not at all | 12% | 7% |
| Do not know | 50% | 60% |
Considerations
50. In terms of strategic alignment, it should be noted that the agency has publicized its innovation activities in various corporate planning and results documents, and that the culture and organization attributes demonstrate strong support for innovation. This said, the alignment between the strategic and operational levels requires some improvement to fully realize the agency’s innovation potential. Specifically, increasing staff awareness of funding mechanisms to support innovative ideas, forecasting trends to prioritize activities, and developing indicators to measure results could help all staff understand how to translate the agency’s innovation vision and support into innovative action.
Stakeholder expectations
51. This attribute is about considering and incorporating stakeholder expectations and needs into the design and development of innovative policies, programs and service delivery mechanisms. There were 2 questions in the survey related to stakeholder expectations. The results are presented in Table 8 below.
| Survey Questions | Great extent | Moderate extent | Small extent | Not at all | Do not know |
|---|---|---|---|---|---|
| Do you collaborate with internal and external stakeholders to support innovation? | 10.75% | 28.25% | 28.25% | 17.75% | 15% |
| Does your sector engage with stakeholders to understand their expectations regarding PSC innovation priorities? | 9.5% | 22.25% | 19.25% | 9% | 40% |
What we heard
52. There were 2 questions related to this attribute. Positive responses ranged from 32% to 39%. It is notable that one of the questions has a 40% “do not know” response level. The collaboration element of this attribute has a positive response rate of 39%. Results vary greatly between occupational levels. As demonstrated in Graph 19, 84% of executives believe that they collaborate with stakeholders, whereas only 29% of supervisors and 34% of employees have the same perspective. It is also interesting to note that the regional offices and headquarters have a similar perception of collaboration (see Graph 20).
Text Alternative
| Occupational Level | Executive | Manager | Supervisor | Employee |
|---|---|---|---|---|
| Moderate + Great | 84% | 53% | 29% | 34% |
| Small | 12% | 35% | 32% | 28% |
| Not at all | 0% | 9% | 18% | 21% |
| Do not know | 4% | 4% | 21% | 17% |
Text Alternative
| Work Location | PSC HQ | Regions |
|---|---|---|
| Moderate + Great | 40% | 32% |
| Small | 28% | 30% |
| Not at all | 18% | 16% |
| Do not know | 14% | 21% |
53. Overall, 40% of respondents indicated that they don’t know the extent to which the agency engages with stakeholders to understand their expectations regarding innovation (see Graph 21).

Text Alternative
| Occupational Level | Executive | Manager | Supervisor | Employee |
|---|---|---|---|---|
| Moderate + Great | 64% | 29% | 29% | 29% |
| Small | 16% | 25% | 28% | 18% |
| Not at all | 4% | 15% | 4% | 9% |
| Do not know | 16% | 31% | 39% | 44% |
54. This is important given the nature of the innovation initiatives that the agency is currently working on. Innovations such as the Public Service Resourcing System transformation project, Second Language Evaluation pilots, and Employee Referral Program pilots all require the agency to understand stakeholder needs and involve them in projects. While executives believe that the organization works closely with stakeholders on innovation initiatives, the perception varies across occupational levels.
Considerations
55. This is one area where improvements could be made, particularly given the relatively high percentage (40%) of employees who are not aware of how collaboratively the agency works with stakeholders on innovation. Working collaboratively with stakeholders and having all employees understand this is very important, given the nature of the initiatives that are currently being led by the agency.
Appendix A ─ References (non-exhaustive)
- The Brookfield Institute for Innovation + Entrepreneurship. Exploring Policy Innovation: Tools, Techniques + Approaches. May 2018.
- Canadian Government Executive. President of the Public Service Commission Willing To Do What It Takes. Interview, May/June 2018.
- Clerk of the Privy Council. 25th Annual Report to the Prime Minister on the Public Service of Canada. 2018.
- Daglio, M., Gerson D., Kitchen H. Building Organisational Capacity for Public Sector Innovation. Background paper prepared for the Organisation for Economic Co-operation and Development Conference on Innovating the Public Sector: from Ideas to Impact. Paris: 12-13 November, 2014.
- Federal, Provincial and Territorial Declaration on Public Sector Innovation. November 2017.
- Institute Of Public Administration Of Canada. A Discussion Policy Innovation in the Canadian Public Sector. December 2015.
- Policy Horizons Canada. Who we are. 2018.
- Public Service Commission of Canada. The 100 years of the Public Service Commission of Canada 1908-2008. 2008.
- The Organisation for Economic Co-operation and Development
- Treasury Board of Canada Secretariat. 2017 Public Service Employee Survey Results.
- Treasury Board of Canada Secretariat. 2017 Public Service Employee Survey: Summary report of results for the overall public service.
Page details
- Date modified: