
Quality of Canada Western Red Spring wheat in 2024
This report presents harvest quality data for Canada Western Red Spring (CWRS) wheat grown in 2024. Wheat samples were submitted to the Canadian Grain Commission’s Harvest Sample Program by producers. Quality data is compiled from the results of analytical tests performed in the Grain Research Laboratory and will be updated as more samples are received.
Canada Western Red Spring
CWRS is the largest class of wheat grown in western Canada. CWRS is well known for its excellent milling performance, having high flour yield, low ash, and minimal protein loss from wheat to flour during milling. Flour milled from CWRS wheat has high protein content, strong yet extensible dough properties, and very high water absorption. These characteristics make it ideal for the production of high-volume pan bread. Due to its high protein and good gluten strength, CWRS wheat is used extensively, either alone or in blends with weaker wheats, for the production of a diverse range of products such as hearth breads, flat breads, steamed breads, and noodles.
Summary of CWRS quality in 2024
The quality of CWRS was excellent, with 94% of the crop in the top two grades. The majority of samples graded No. 2 were downgraded due to hard vitreous kernels (HVK) levels below 65%. Mean protein content was 14.1%, slightly above the ten-year average of 13.8%. The crop was safe and sound, with 99.0% of CWRS samples having DON levels less than 1.0 ppm and 89% of samples having FN values greater than 350 seconds. AAC Brandon was the top CWRS variety grown in 2024 but declined in acreage as newer varieties, such as AAC Wheatland, AAC Starbuck, AAC Hodge and AAC Hockley, increased.

Grade distribution
No. 1 and No. 2 CWRS:
94%

Protein
Protein content:
14.1%

Deoxynivalenol (DON)
DON < 1.0 ppm:
99.0%

Falling Number (FN)
FN > 351 seconds:
89%

Variety
Top varieties:
- AAC Brandon
- AAC Wheatland
- AAC Starbuck
- AAC Viewfield
- AAC Hodge
- AAC Hockley

Graph data
| Variety | 2020 | 2021 | 2022 | 2023 | 2024 |
|---|---|---|---|---|---|
| AAC Brandon | 42 | 38 | 32 | 29 | 25 |
| AAC Viewfield | 12 | 14 | 14 | 13 | 11 |
| AAC Starbuck | 0 | 4 | 9 | 12 | 13 |
| AAC Wheatland | 0 | 3 | 8 | 13 | 15 |
| AAC Hodge | 0 | 0 | 0.05 | 2 | 5 |
| AAC Hockley | 0 | 0 | 0.1 | 2 | 5 |

Graph data
| No. 1 | No. 2 | ≤ No. 3 | Feed | |
|---|---|---|---|---|
| Grade distribution | 67 | 27 | 2.4 | 4 |
| Hard vitreous kernels | 0 | 21 | 0 | 0 |
| Fusarium damage | 0 | 2 | 0 | 0 |
| Test weight | 0 | 1.7 | 0 | 0 |

Graph data
| Year | % |
|---|---|
| 2015 | 14.1 |
| 2016 | 13.6 |
| 2017 | 13.1 |
| 2018 | 13.7 |
| 2019 | 13.6 |
| 2020 | 13.4 |
| 2021 | 14.7 |
| 2022 | 13.9 |
| 2023 | 13.8 |
| 2024 | 14.1 |
Milling and functional quality
The milling performance and functional quality of CWRS was excellent this year. The crop was sound, with all aggregate samples having a Falling Number (FN) value greater than 350 seconds. Amylograph peak viscosity was higher than last year, exceeding 600 BU for milled No. 1 aggregate samples and 500 BU for milled No. 2 aggregate samples. Test weight for No. 1 aggregates remained similar to 2023 but it was slightly lower for No. 2 prairie aggregates at 79 kg/hL. Weight per 1000 kernels for the No. 1 eastern prairies aggregate was consistent with 2023, but the No. 1 western prairies and the No. 2 all prairies aggregates had lower weights. This reflects the smaller kernel size in the west that resulted from hot, dry conditions late in the 2024 season. Despite this, all CWRS aggregates achieved strong milling yields on the Bühler mill (75.9% or greater on a clean wheat basis), consistent with 2023 CWRS crop.
Wheat ash was slightly higher than last year in all CWRS aggregates, though flour ash remained relatively similar to last year. Colour values of dough sheet were consistent with last year, showing bright L* readings. Farinograph absorption was similar to 2023 for all aggregates. Dough strength for the No. 1 western prairies aggregate showed a slight increase in 2024 compared to 2023, with slightly higher Farinograph stability, Extensograph Rmax and bake test mixing energy, while maintaining excellent extensibility. The No. 1 eastern prairies and the No. 2 prairie aggregates showed similar to slightly lower dough strength than last year, as measured by Farinograph stability, Extensograph Rmax and bake test mixing energy. Alveogram results were similar to 2023 for all CWRS aggregates. Bake tests showed good loaf volumes.
Eastern prairie aggregates No. 1 CWRS
Eastern prairie aggregates are from eastern Saskatchewan and Manitoba (regions 1, 2, 3, 4 and 6 on the crop region map).

| Quality parameterFootnote 1 | 2024 | 2023 |
|---|---|---|
| Test weight, kg/hL | 82 | 82 |
| Weight per 1000 kernels, g | 35.1 | 34.6 |
| Protein content, % | 13.8 | 13.8 |
| Protein content, % (dry matter basis) | 15.9 | 16.0 |
| Ash content, % | 1.54 | 1.39 |
| Falling Number, seconds | 399 | 382 |
| Quality parameter | 2024 | 2023 |
|---|---|---|
| Clean wheat basis, % | 76.5 | 76.4 |
| Quality parameter | 2024 | 2023 |
|---|---|---|
| 74% extraction | 74% extraction | |
| Protein content, % | 12.9 | 13.0 |
| Protein loss, % | 0.9 | 0.8 |
| Wet gluten content, % | 35.3 | 33.7 |
| Gluten index, % | 96.3 | 98.1 |
| Ash content, % | 0.44 | 0.42 |
| Dough sheet brightness (L*) at 2hFootnote 2 | 76.4 | 77.2 |
| Dough sheet redness (a*) at 2hFootnote 2 | 2.0 | 1.9 |
| Dough sheet yellowness (b*) at 2hFootnote 2 | 25.8 | 25.9 |
| Starch damage, % | 8.1 | 8.2 |
| Amylograph peak viscosity, BU | 697 | 552 |
| Quality parameter | 2024 | 2023 |
|---|---|---|
| 74% extraction | 74% extraction | |
| Absorption, % | 64.5 | 64.3 |
| Dough development time, minutes | 6.5 | 7.2 |
| Stability, minutes | 10.0 | 11.4 |
| Mixing tolerance index, BU | 25 | 26 |


Figure description
Each Farinogram shows three curves that indicate minimum, maximum and mean torque measured over time. The curves rise steeply, gradually curve towards a maximum value and then decline slightly.
| Quality parameter | 2024 | 2023 |
|---|---|---|
| 74% extraction | 74% extraction | |
| Absorption, % | 65.4 | 65.2 |
| Dough development time, minutes | 6.9 | 6.2 |
| Stability, minutes | 14.1 | 13.3 |
| Mixing tolerance index, BU | 19 | 20 |


Figure description
Each Farinogram shows three curves that indicate minimum, maximum and mean torque measured over time. The curves rise steeply, gradually curve towards a maximum value and then decline slightly.
| Quality parameter | 2024 | 2023 |
|---|---|---|
| 74% extraction | 74% extraction | |
| Maximum resistance, BU | 609 | 696 |
| Extensibility (length), cm | 20.2 | 20.2 |
| Area, cm2 | 154 | 180 |
Figure description
Each Extensogram shows four curves that indicate the torque measured over length of stretched dough. The curves gradually rise towards a maximum value and then rapidly decline.
| Quality parameter | 2024 | 2023 |
|---|---|---|
| 74% extraction | 74% extraction | |
| Maximum resistance, BU | 561 | 625 |
| Extensibility (length), cm | 19.0 | 16.1 |
| Area, cm2 | 131 | 122 |
| Quality parameter | 2024 | 2023 |
|---|---|---|
| 74% extraction | 74% extraction | |
| P (maximum over pressure), mm H2O | 116 | 115 |
| L (length), mm | 120 | 126 |
| P/L | 0.97 | 0.91 |
| W (deformation energy), 10-4 joules | 469 | 491 |
| Ie (elasticity index), % | 62.9 | 64.2 |
| Quality parameter | 2024 | 2023 |
|---|---|---|
| 74% extraction | 74% extraction | |
| Absorption, % | 68 | 68 |
| Mixing time, minutes | 5.4 | 5.6 |
| Mixing energy, Wh/kg | 12.0 | 14.2 |
| Loaf volume, cm3/100 g flour | 947 | 944 |
Western prairie aggregates No. 1 CWRS
Western prairie aggregates are from British Columbia, Alberta and western Saskatchewan (regions 5, 7, 8, 9 and 10 on the crop region map).
| Quality parameterFootnote 1 | 2024 | 2023 |
|---|---|---|
| Test weight, kg/hL | 82 | 82 |
| Weight per 1000 kernels, g | 31.0 | 33.3 |
| Protein content, % | 14.4 | 14.2 |
| Protein content, % (dry matter basis) | 16.7 | 16.4 |
| Ash content, % | 1.51 | 1.46 |
| Falling Number, seconds | 416 | 414 |
| Quality parameter | 2024 | 2023 |
|---|---|---|
| Clean wheat basis, % | 75.9 | 76.0 |
| Quality parameter | 2024 | 2023 | ||
|---|---|---|---|---|
| 74% extraction | 60% extraction | 74% extraction | 60% extraction | |
| Protein content, % | 13.6 | 13.5 | 13.6 | 13.5 |
| Protein loss, % | 0.8 | 0.9 | 0.6 | 0.7 |
| Wet gluten content, % | 37.4 | 36.4 | 37.5 | 36.1 |
| Gluten index, % | 95.1 | 97.1 | 95.0 | 97.3 |
| Ash content, % | 0.44 | 0.38 | 0.43 | 0.39 |
| Dough sheet brightness (L*) at 2hFootnote 2 | 75.8 | 77.1 | 76.7 | 78.2 |
| Dough sheet redness (a*) at 2hFootnote 2 | 1.9 | 1.7 | 2.0 | 1.6 |
| Dough sheet yellowness (b*) at 2hFootnote 2 | 25.8 | 26.7 | 26.1 | 25.8 |
| Starch damage, % | 7.9 | 7.7 | 7.9 | 7.7 |
| Amylograph peak viscosity, BU | 672 | 742 | 631 | 663 |
| Quality parameter | 2024 | 2023 | ||
|---|---|---|---|---|
| 74% extraction | 60% extraction | 74% extraction | 60% extraction | |
| Absorption, % | 65.2 | 64.7 | 65.8 | 65.1 |
| Dough development time, minutes | 7.9 | 17.3 | 7.6 | 8.7 |
| Stability, minutes | 13.6 | 28.3 | 11.9 | 25.7 |
| Mixing tolerance index, BU | 18 | 5 | 22 | 9 |


Figure description
Each Farinogram shows three curves that indicate minimum, maximum and mean torque measured over time. The curves rise steeply, gradually curve towards a maximum value and then decline slightly.
| Quality parameter | 2024 | 2023 | ||
|---|---|---|---|---|
| 74% extraction | 60% extraction | 74% extraction | 60% extraction | |
| Absorption, % | 66.1 | 65.1 | 66.6 | 65.5 |
| Dough development time, minutes | 8.9 | 10.3 | 7.0 | 11.5 |
| Stability, minutes | 19.6 | 50.1 | 16.5 | 47.5 |
| Mixing tolerance index, BU | 17 | 0 | 10 | 0 |


Figure description
Each Extensogram shows four curves that indicate the torque measured over length of stretched dough. The curves gradually rise towards a maximum value and then rapidly decline.
| Quality parameter | 2024 | 2023 | ||
|---|---|---|---|---|
| 74% extraction | 60% extraction | 74% extraction | 60% extraction | |
| Maximum resistance, BU | 713 | 880 | 634 | 847 |
| Extensibility (length), cm | 20.1 | 19.8 | 20.6 | 17.9 |
| Area, cm2 | 178 | 211 | 163 | 183 |


Figure description
Each Extensogram shows four curves that indicate the torque measured over length of stretched dough. The curves gradually rise towards a maximum value and then rapidly decline.
| Quality parameter | 2024 | 2023 | ||
|---|---|---|---|---|
| 74% extraction | 60% extraction | 74% extraction | 60% extraction | |
| Maximum resistance, BU | 567 | 679 | 590 | 628 |
| Extensibility (length), cm | 18.5 | 17.9 | 17.7 | 16.1 |
| Area, cm2 | 129 | 151 | 126 | 127 |
| Quality parameter | 2024 | 2023 | ||
|---|---|---|---|---|
| 74% extraction | 60% extraction | 74% extraction | 60% extraction | |
| P (maximum over pressure), mm H2O | 120 | 131 | 124 | 130 |
| L (length), mm | 124 | 120 | 121 | 110 |
| P/L | 0.97 | 1.09 | 1.02 | 1.18 |
| W (deformation energy), 10-4 joules | 502 | 535 | 509 | 505 |
| Ie (elasticity index), % | 64.2 | 64.0 | 63.7 | 64.1 |
| Quality parameter | 2024 | 2023 | ||
|---|---|---|---|---|
| 74% extraction | 60% extraction | 74% extraction | 60% extraction | |
| Absorption, % | 67 | 67 | 69 | 69 |
| Mixing time, minutes | 5.3 | 5.8 | 5.2 | 5.4 |
| Mixing energy, Wh/kg | 14.0 | 15.1 | 14.2 | 13.9 |
| Loaf volume, cm3/100 g flour | 980 | 984 | 969 | 970 |
| Quality parameter | 2024 | 2023 | ||
|---|---|---|---|---|
| 74% extraction | 60% extraction | 74% extraction | 60% extraction | |
| Absorption, % | 63 | 63 | 65 | 65 |
| Mixing time, minutes | 4.1 | 4.3 | 3.5 | 3.7 |
| Mixing energy, Wh/kg | 7.3 | 7.4 | 6.5 | 6.4 |
| Loaf volume, cm3/100 g flour | 1154 | 1106 | 1042 | 1059 |
All prairie aggregates No. 2 CWRS
All prairie aggregates are from British Columbia, Alberta, Saskatchewan and Manitoba (regions 1 to 10 on the crop region map).
| Quality parameterFootnote 1 | 2024 | 2023 |
|---|---|---|
| Test weight, kg/hL | 79 | 81 |
| Weight per 1000 kernels, g | 32.8 | 36.1 |
| Protein content, % | 13.8 | 13.0 |
| Protein content, % (dry matter basis) | 16.0 | 15.1 |
| Ash content, % | 1.55 | 1.42 |
| Falling Number, seconds | 373 | 360 |
| Quality parameter | 2024 | 2023 |
|---|---|---|
| Clean wheat basis, % | 76.5 | 76.4 |
| Quality parameter | 2024 | 2023 |
|---|---|---|
| 74% extraction | 74% extraction | |
| Protein content, % | 12.8 | 12.3 |
| Protein loss, % | 1.0 | 0.7 |
| Wet gluten content, % | 34.4 | 32.8 |
| Gluten index, % | 97.5 | 97.4 |
| Ash content, % | 0.43 | 0.42 |
| Dough sheet brightness (L*) at 2hFootnote 2 | 76.1 | 77.4 |
| Dough sheet redness (a*) at 2hFootnote 2 | 1.9 | 1.6 |
| Dough sheet yellowness (b*) at 2hFootnote 2 | 26.2 | 25.4 |
| Starch damage, % | 7.8 | 7.8 |
| Amylograph peak viscosity, BU | 522 | 470 |
| Quality parameter | 2024 | 2023 |
|---|---|---|
| 74% extraction | 74% extraction | |
| Absorption, % | 64.1 | 63.7 |
| Dough development time, minutes | 6.4 | 6.5 |
| Stability, minutes | 10.7 | 9.9 |
| Mixing tolerance index, BU | 26 | 31 |


Figure description
Each Farinogram shows three curves that indicate minimum, maximum and mean torque measured over time. The curves rise steeply, gradually curve towards a maximum value and then decline slightly.
| Quality parameter | 2024 | 2023 |
|---|---|---|
| 74% extraction | 74% extraction | |
| Absorption, % | 65.1 | 64.6 |
| Dough development time, minutes | 5.4 | 5.6 |
| Stability, minutes | 13.5 | 13.1 |
| Mixing tolerance index, BU | 16 | 17 |


Figure description
Each Farinogram shows three curves that indicate minimum, maximum and mean torque measured over time. The curves rise steeply, gradually curve towards a maximum value and then decline slightly.
| Quality parameter | 2024 | 2023 |
|---|---|---|
| 74% extraction | 74% extraction | |
| Maximum resistance, BU | 563 | 621 |
| Extensibility (length), cm | 20.7 | 18.8 |
| Area, cm2 | 149 | 147 |


Figure description
Each Extensogram shows four curves that indicate the torque measured over length of stretched dough. The curves gradually rise towards a maximum value and then rapidly decline.
| Quality parameter | 2024 | 2023 |
|---|---|---|
| 74% extraction | 74% extraction | |
| Maximum resistance, BU | 526 | 561 |
| Extensibility (length), cm | 18.3 | 16.1 |
| Area, cm2 | 118 | 113 |
| Quality parameter | 2024 | 2023 |
|---|---|---|
| 74% extraction | 74% extraction | |
| P (maximum over pressure), mm H2O | 117 | 115 |
| L (length), mm | 118 | 116 |
| P/L | 0.99 | 0.99 |
| W (deformation energy), 10-4 joules | 464 | 445 |
| Ie (elasticity index), % | 63.3 | 61.8 |
| Quality parameter | 2023 | 2022 |
|---|---|---|
| 74% extraction | 74% extraction | |
| Absorption, % | 67 | 67 |
| Mixing time, minutes | 5.5 | 5.5 |
| Mixing energy, Wh/kg | 13.9 | 14.0 |
| Loaf volume, cm3/100 g flour | 967 | 979 |
Protein data by grade and by province

Graph data
| Protein range, % | 2021 | 2022 | 2023 | 2024 |
|---|---|---|---|---|
| < 12.0 | 4 | 11.4 | 9.6 | 7.6 |
| 12.0 to 12.9 | 8.7 | 16 | 16.5 | 16.8 |
| 13.0 to 13.9 | 18.9 | 28 | 32.1 | 27.6 |
| 14.0 to 14.9 | 30.7 | 30.4 | 26.3 | 28 |
| > 15.0 | 37.6 | 14.2 | 15.5 | 20 |

Graph data
| Protein range, % | MB | SK | AB |
|---|---|---|---|
| < 12.0 | 1.1 | 10.2 | 7.9 |
| 12.0 to 12.9 | 6.9 | 22.1 | 15.8 |
| 13.0 to 13.9 | 32.4 | 30.7 | 20.3 |
| 14.0 to 14.9 | 42.7 | 22.9 | 26.1 |
| > 15.0 | 16.9 | 14.1 | 29.9 |
| Province | Number of samples | Mean | SD |
|---|---|---|---|
| Manitoba | 303 | 14.2 | 0.8 |
| Saskatchewan | 803 | 13.9 | 1.2 |
| Alberta and B.C. | 626 | 14.4 | 1.4 |
| Western Canada | 1732 | 14.1 | 1.3 |
| Province | Number of samples | Mean | SD |
|---|---|---|---|
| Manitoba | 173 | 14.0 | 0.9 |
| Saskatchewan | 331 | 13.3 | 1.3 |
| Alberta and B.C. | 194 | 14.0 | 1.7 |
| Western Canada | 698 | 13.7 | 1.4 |
| Province | Number of samples | Mean | SD |
|---|---|---|---|
| Manitoba | NSFootnote * | NS | NS |
| Saskatchewan | 29 | 14.5 | 1.2 |
| Alberta and B.C. | NS | NS | NS |
| Western Canada | 63 | 14.6 | 1.5 |
| Province | Number of samples | Mean | SD |
|---|---|---|---|
| Manitoba | 32 | 14.6 | 0.8 |
| Saskatchewan | 29 | 14.1 | 2.0 |
| Alberta and B.C. | 40 | 16.2 | 1.8 |
| Western Canada | 101 | 15.1 | 1.9 |
| Province | Number of samples | Mean | SD |
|---|---|---|---|
| Manitoba | 533 | 14.2 | 0.9 |
| Saskatchewan | 1202 | 13.7 | 1.3 |
| Alberta and B.C. | 885 | 14.4 | 1.6 |
| Western Canada | 2620 | 14.0 | 1.4 |
Protein data by grade and by crop region
Ten crop regions in western Canada were designated for Canada Western Red Spring (CWRS) wheat based on similarity of environmental characteristics within each region. Consideration was given to directional movement, political boundaries and production (seeded area) in choosing these regions. In addition, areas with a low level of production were grouped with larger production areas to ensure sufficient sample volume for analysis.
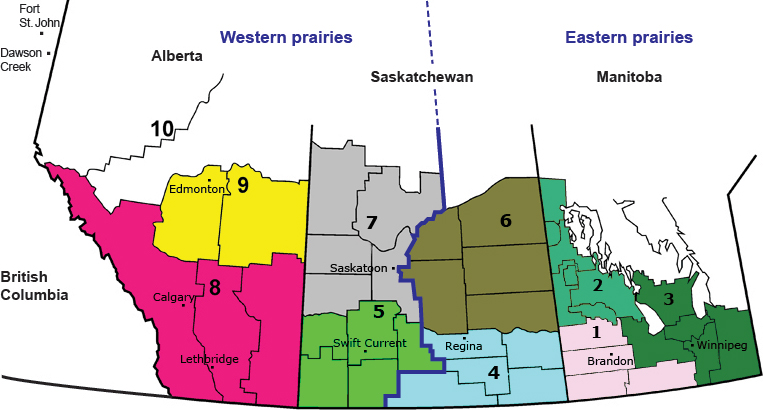
Text description
- Region 1: southwestern Manitoba
- Region 2: central western Manitoba
- Region 3: southeastern Manitoba
- Region 4: southeastern Saskatchewan
- Region 5: southwestern Saskatchewan
- Region 6: central eastern Saskatchewan
- Region 7: central western Saskatchewan
- Region 8: southern Alberta
- Region 9: central eastern Alberta
- Region 10: northern Alberta
| Region | Number of samples | Mean | Standard deviation |
|---|---|---|---|
| 1 | 170 | 14.1 | 0.8 |
| 2 | 71 | 14.3 | 0.8 |
| 3 | 62 | 14.4 | 0.7 |
| 4 | 168 | 13.7 | 1.4 |
| 5 | 101 | 14.3 | 1.7 |
| 6 | 330 | 13.7 | 1.0 |
| 7 | 204 | 14.2 | 1.2 |
| 8 | 211 | 14.7 | 1.5 |
| 9 | 255 | 14.4 | 1.3 |
| 10 | 160 | 13.9 | 1.5 |
| Region | Number of samples | Mean | Standard deviation |
|---|---|---|---|
| 1 | 100 | 14.1 | 1.0 |
| 2 | 30 | 14.1 | NSFootnote * |
| 3 | 43 | 13.6 | 0.8 |
| 4 | 78 | 13.0 | 1.5 |
| 5 | NS | NS | NS |
| 6 | 118 | 13.2 | 1.3 |
| 7 | 125 | 13.7 | 1.2 |
| 8 | 61 | 14.9 | 1.8 |
| 9 | 113 | 13.8 | 1.5 |
| 10 | NS | NS | NS |
Grading factor data
Producer samples submitted to Harvest Sample Program are graded based on the Official Grain Grading Guide. Data below summarizes the occurrence and frequency of wheat grading factors. Downgrading can be due to 1 or more grading factors present in the same sample.
Grading factors present (%) in Canada Western Red Spring wheat from all provinces as of December 2, 2024
| Samples | No. 1 CWRS | No. 2 CWRS | No. 3 CWRS | Feed |
|---|---|---|---|---|
| Number of samples | 1732 | 699 | 63 | 101 |
| % of total | 66.7 | 26.9 | 2.4 | 3.9 |
| Grading factor | No. 1 CWRS | No. 2 CWRS | No. 3 CWRS | Feed |
|---|---|---|---|---|
| Broken (BKN) | 0.0 | 1.6 | 7.9 | 9.9 |
| Contrasting classes (CON CL) | 0.0 | 0.1 | 0.0 | 2.0 |
| Dark immature kernels (DKIM) | 0.0 | 0.1 | 0.0 | 0.0 |
| Ergot (ERG) | 0.0 | 0.1 | 0.0 | 14.9 |
| Frost (FR) | 0.0 | 0.4 | 0.0 | 0.0 |
| Fusarium damage (FUS DMG) | 0.0 | 7.9 | 17.5 | 9.9 |
| Hard vitreous kernels (HVK) | 0.0 | 79.4 | 0.0 | 0.0 |
| Midge damage (MDGE) | 0.0 | 6.0 | 4.8 | 0.0 |
| Mildew (MIL) | 0.0 | 7.0 | 0.0 | 0.0 |
| Matter other than cereal grains (MOTCG) | 0.0 | 0.7 | 4.8 | 4.0 |
| Non-registered variety (NON REGV) | 0.0 | 0.0 | 0.0 | 8.9 |
| Natural stain (NSTN) | 0.0 | 0.1 | 1.6 | 0.0 |
| Severely sprouted kernels (SEVSPTD) | 0.0 | 6.0 | 23.8 | 27.7 |
| Sawfly damage (SFLY DMG) | 0.0 | 0.1 | 0.0 | 0.0 |
| Shrunken kernels (SHR) | 0.0 | 0.0 | 0.0 | 22.8 |
| Total foreign material (TFM) | 0.0 | 0.6 | 7.9 | 0.0 |
| Total Shrunken and Broken (TSHRBKN) | 0.0 | 0.0 | 0.0 | 1.0 |
| Total sprouted (TSPTD) | 0.0 | 4.6 | 23.8 | 5.0 |
| Test weight (TWT) | 0.0 | 6.3 | 19.0 | 6.9 |
Deoxynivalenol (DON) data
Deoxynivalenol (DON) is a mycotoxin that can be found in grain infected with Fusarium head blight. DON is not an official grading factor listed in the Canada Grain Regulations or the Official Grain Grading Guide. Instead, the Canadian Grain Commission uses the visual assessment of Fusarium damaged kernels as a proxy for DON.
Even if DON isn’t an official grading factor, it may be included as a contract specification in grain transactions. The Canadian Grain Commission provides DON results to producers who participate in the Harvest Sample Program.

Graph data
| DON (ppm) | % |
|---|---|
| < 0.3 | 89.2 |
| 0.3 to 1.0 | 9.5 |
| > 1.0 | 1.3 |
| DON (ppm) | Number of samples | % of total |
|---|---|---|
| Below limit (< 0.3 ppm) | 2318 | 89.22 |
| 0.3 to 1.0 | 247 | 9.51 |
| 1.1 to 2.0 | 24 | 0.92 |
| 2.1 to 3.0 | 4 | 0.15 |
| 3.1 to 4.0 | 2 | 0.08 |
| 4.1 to 5.0 | 0 | 0 |
| 5.1 to 6.0 | 1 | 0.04 |
| Above limit (> 6.0 ppm) | 2 | 0.08 |
| Total samples | 2598 | 100 |
Falling Number (FN) data
Falling Number (FN) results are an indicator of sprout damage in wheat. FN is not an official grading factor listed in the Canada Grain Regulations or the Official Grain Grading Guide. Instead, the Canadian Grain Commission uses the visual assessment of sprouted and severely sprouted kernels as a proxy for FN.
Even if FN isn’t an official grading factor, it may be included as a contract specification in grain transactions. The Canadian Grain Commission provides FN results to producers who participate in the Harvest Sample Program.

Graph data
| Falling Number | % of samples |
|---|---|
| > 351 | 88.4 |
| 301 to 350 | 6.8 |
| 251 to 300 | 3.1 |
| < 250 | 1.7 |
| Falling Number (seconds) | Number of samples | % of total |
|---|---|---|
| > 450 | 102 | 3.93 |
| 401 to 450 | 996 | 38.34 |
| 351 to 400 | 1199 | 46.15 |
| 301 to 350 | 176 | 6.77 |
| 251 to 300 | 80 | 3.08 |
| 201 to 250 | 28 | 1.08 |
| 151 to 200 | 11 | 0.42 |
| 101 to 150 | 4 | 0.15 |
| 61 to 100 | 2 | 0.08 |
| 60 | 0 | 0 |
| Total samples | 2598 | 100 |