This report presents harvest quality data for Canada Western Amber Durum (CWAD) wheat grown in 2024. Wheat samples were submitted to the Canadian Grain Commission’s Harvest Sample Program by producers. Quality data is compiled from the results of analytical tests performed in the Grain Research Laboratory.
Canada Western Amber Durum
CWAD is the second largest wheat class grown in western Canada. CWAD is used in a wide variety of products, including long and short dried pasta, fresh pasta, sheeted pasta, couscous and baked bread. CWAD has superior milling quality, producing high semolina yield with low ash content and speck count. It also has the high yellow pigment content necessary to produce end products with a bright yellow colour. The high protein content and strong gluten characteristics of CWAD ensures superior pasta cooking quality and good performance in durum bread.
Summary of CWAD quality in 2024
The quality of CWAD was generally good, with more than 70% of the crop in the top two grades. Test weight was the main downgrading factor due to the dry and hot conditions in major durum growing regions during the grain filling and ripening stages. Mean protein content was 15.3%, slightly higher than in 2023 and significantly higher than the ten-year average of 14.3%. The crop was safe and sound, with more than 99% of CWAD samples having DON levels less than 1.0 ppm and 96% of samples having FN values greater than 350 seconds. Transcend remained the top CWAD variety grown in 2024. New varieties, such as CDC Defy, AAC Stronghold, and AAC Grainland, have increased in acreage in recent years while Transcend acreage is gradually decreasing.
Figure 1 Top CWAD varieties grown in western Canada from 2020 to 2024
Graph data
% of total
Variety
2020
2021
2022
2023
2024
Transcend
39
35
32
29
22
CDC Precision
16
16
16
14
9
Brigade
10
8
8
6
4
AAC Spitfire
9
8
7
5
4
CDC Alloy
4
7
7
6
5
AAC Stronghold
2
7
8
9
11
AAC Grainland
0
1
4
6
7
CDC Defy
0
0
2
8
17
Figure 2 Grade distribution and grading factors for CWAD as of November 7, 2024 (based on 851 samples)
Graph data
% of samples
Parameter
No. 1
No. 2
No. 3
≤ No. 4
Grade distribution
45.1
27.5
12.2
15.2
Test weight
0
18
8.8
0
Hard vitreous kernels
0
7
1.6
0
Figure 3 Mean protein content (13.5% mb, %) in CWAD from 2015 to November 7, 2024
Graph data
Protein
Year
%
2015
14.0
2016
12.7
2017
13.6
2018
14.3
2019
14.0
2020
13.8
2021
15.7
2022
14.6
2023
14.9
2024
15.3
Milling and functional quality
In 2024, CWAD had very high protein levels, very high yellow pigment content and superior pasta processing quality. The hard vitreous kernel (HVK) content was excellent for all grades, including No.1 CWAD at 92%. Test weight and weight per thousand kernels for No.1 CWAD were comparable to 2023. No. 2 CWAD had the same test weight but lower weight per thousand kernels than in 2023 and No. 4 CWAD had both lower test weight and weight per thousand kernels. The 2024 CWAD crop was very sound and all aggregate wheat samples had FN values greater than 400 seconds. Ash content in wheat was higher than in 2023 for all grades.
Total milling yield and semolina yield in the 2024 CWAD aggregates were lower than in 2023 for each grade. This was largely due to the smaller kernels produced under the dry and hot 2024 growing conditions. All semolina samples were very clean with low speck count and large granulation. Semolina ash was slightly higher for all grades compared to last year. Rheological tests demonstrated strong and balanced gluten properties based on gluten index and Alveogram parameters. The pasta produced from semolina milled from all grades of 2024 CWAD had an excellent bright yellow color, high firmness and superior cooking quality.
Harvest quality data for CWAD prairie aggregates Footnote 1
Prairies aggregate are from all durum producing regions in Saskatchewan and Alberta (regions 12 to 15 on the crop region map).
In 2024, No. 2 CWAD and No. 4 CWAD were downgraded due to test weight. Based on the Official Grain Grading Guide's export grade determination table for CWAD, the minimum test weight for No. 1, No. 2, No. 3 and No. 4 CWAD is 80 kg/hL, 79 kg/hL, 78 kg/hL and 75 kg/hL, respectively.
Protein content (%) Footnote 4 , No. 2 CWAD as of December 2, 2024
Province
Number of samples
Mean
SD
Manitoba
NS
NS
NS
Saskatchewan
198
15.2
2.3
Alberta and B.C.
47
15.0
1.9
Western Canada
247
15.2
2.2
Protein content (%) Footnote 4 , No. 3 CWAD as of December 2, 2024
Province
Number of samples
Mean
SD
Manitoba
NS
NS
NS
Saskatchewan
77
16.3
2.5
Alberta and B.C.
34
16.3
1.9
Western Canada
112
16.3
2.3
Protein content (%) Footnote 4 , No. 4 CWAD as of December 2, 2024
Province
Number of samples
Mean
SD
Manitoba
NS
NS
NS
Saskatchewan
NS
NS
NS
Alberta and B.C.
NS
NS
NS
Western Canada
23
14.9
3.1
Protein content (%) Footnote 4 , No. 5 CWAD as of December 2, 2024
Province
Number of samples
Mean
SD
Manitoba
NS
NS
NS
Saskatchewan
107
18.3
1.9
Alberta and B.C.
NS
NS
NS
Western Canada
113
18.2
1.9
Protein content (%) Footnote 4 , all grades, CWAD as of December 2, 2024
Province
Number of samples
Mean
SD
Manitoba
NS
NS
NS
Saskatchewan
726
15.3
2.5
Alberta and B.C.
165
15.2
1.8
Western Canada
895
15.3
2.4
Protein data by grade and by crop region
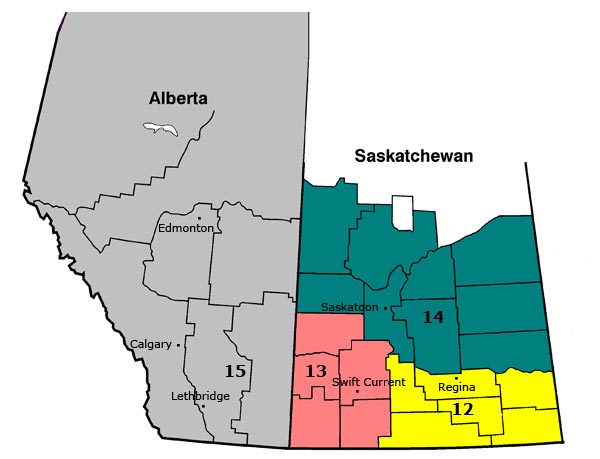
Four crop regions in western Canada were designated for Canada Western Amber Durum (CWAD) based on similarity of environmental characteristics within each region. Consideration was given to directional movement, political boundaries and production (seeded area) in choosing these regions. In addition, areas with a low level of production were grouped with larger production areas to ensure sufficient sample volume for analysis.
Canada Western Amber Durum (CWAD) crop regions
Text description
Region 12: southeastern Saskatchewan
Region 13: southwestern Saskatchewan
Region 14: central Saskatchewan
Region 15: Alberta
Protein content (%) Footnote 4 , No. 1 CWAD as of December 2, 2024
Grading factors present (%) in Canada Western Amber Durum wheat from all provinces as of December 2, 2024
Samples
No. 1 CWAD
No. 2 CWAD
No. 3 CWAD
No. 4 CWAD
No. 5 CWAD
Number of samples
400
247
112
23
113
% of total
44.7
27.6
12.5
2.6
12.6
Grading factor
No. 1 CWAD
No. 2 CWAD
No. 3 CWAD
No. 4 CWAD
No. 5 CWAD
Broken (BKN)
0.0
0.8
3.6
0.0
0.9
Ergot (ERG)
0.0
0.0
1.8
0.0
0.9
Fusarium damage (FUS DMG)
0.0
0.0
1.8
0.0
0.0
Grass green kernels (GRASS GR)
0.0
0.4
0.0
0.0
0.0
Hard vitreous kernels (HVK)
0.0
25.5
14.3
43.5
0.0
Midge damage (MDGE)
0.0
12.6
0.9
0.0
0.9
Mildew (MIL)
0.0
4.0
1.8
4.3
0.9
Matter other than cereal grains (MOTCG)
0.0
0.4
0.9
0.0
0.9
Non-registered variety (NON REGV)
0.0
0.0
0.0
0.0
0.9
Severe midge damage (SEVMDGE)
0.0
7.3
3.6
0.0
0.0
Severely sprouted kernels (SEVSPTD)
0.0
3.6
6.3
8.7
0.0
Shrunken kernels (SHR)
0.0
0.4
0.0
0.0
94.7
Sprouted kernels (SPTD)
0.0
0.0
0.0
4.3
0.0
Total foreign material (TFM)
0.0
1.2
0.0
0.0
0.9
Total Shrunken and Broken (TSHRBKN)
0.0
0.0
0.0
0.0
7.1
Total sprouted (TSPTD)
0.0
2.4
1.8
4.3
0.9
Test weight (TWT)
0.0
64.4
71.4
30.4
3.5
Wheat of other classes (WOOC)
0.0
7.3
3.6
26.1
0.0
Deoxynivalenol (DON) data
Deoxynivalenol (DON) is a mycotoxin that can be found in grain infected with Fusarium head blight. DON is not an official grading factor listed in the Canada Grain Regulations or the Official Grain Grading Guide. Instead, the Canadian Grain Commission uses the visual assessment of Fusarium damaged kernels as a proxy for DON.
Even if DON isn’t an official grading factor, it may be included as a contract specification in grain transactions. The Canadian Grain Commission provides DON results to producers who participate in the Harvest Sample Program.
Distribution of deoxynivalenol values for CWAD as of December 2, 2024
Graph data
Distribution of deoxynivalenol values for CWAD as of December 2, 2024
DON (ppm)
%
< 0.3
92.4
0.3 to 1.0
6.9
> 1.0
0.22
Deoxynivalenol (DON) values ( ppm) in Canada Western Amber Durum wheat as of December 2, 2024
DON ( ppm)
Number of samples
% of total
Below limit (< 0.3 ppm)
829
92.42
0.3 to 1.0
62
6.91
1.1 to 2.0
4
0.45
2.1 to 3.0
1
0.11
3.1 to 4.0
0
0
4.1 to 5.0
0
0
5.1 to 6.0
0
0
Above limit (> 6.0 ppm)
1
0.11
Total samples
897
100
Falling Number (FN) data
Falling Number (FN) results are an indicator of sprout damage in wheat. FN is not an official grading factor listed in the Canada Grain Regulations or the Official Grain Grading Guide. Instead, the Canadian Grain Commission uses the visual assessment of sprouted and severely sprouted kernels as a proxy for FN.
Even if FN isn’t an official grading factor, it may be included as a contract specification in grain transactions. The Canadian Grain Commission provides FN results to producers who participate in the Harvest Sample Program.
Distribution of Falling Number values for CWAD as of December 2, 2024
Graph data
Distribution of Falling Number values for CWAD as of December 2, 2024
Falling Number
% of samples
> 351
95.9
301 to 350
2.1
251 to 300
0.7
< 250
1.3
Falling Number values (seconds) in Canada Western Amber Durum wheat as of December 2, 2024