Quality of Canada Western Red Spring wheat in 2023

This report presents harvest quality data for Canada Western Red Spring (CWRS) wheat grown in 2023. Wheat samples were submitted to the Canadian Grain Commission’s Harvest Sample Program by producers. Quality data is compiled from the results of analytical tests performed in the Grain Research Laboratory.

Canada Western Red Spring

CWRS is the largest class of wheat grown in western Canada. CWRS is well known for its excellent milling performance, having high flour yield, low ash, and minimal protein loss from wheat to flour during milling. Flour milled from CWRS wheat has high protein content, strong yet extensible dough properties, and very high water absorption. These characteristics make it ideal for the production of high-volume pan bread. Due to its high protein and good gluten strength, CWRS wheat is used extensively, either alone or in blends with weaker wheats, for the production of a diverse range of products such as hearth breads, flat breads, steamed breads, and noodles.

Summary of CWRS quality in 2023

The quality of CWRS was excellent, with more than 97% of the crop in the top two grades. The majority of samples graded No. 2 were downgraded due to levels of hard vitreous kernels (HVK) below 65%. Mean protein content was 13.8%, slightly above the ten-year average of 13.7%. The crop was safe and sound, with more than 99.6% of CWRS samples having DON levels less than 1.0 ppm and 80% of samples having FN values greater than 350 seconds. AAC Brandon was the top CWRS variety grown in 2023 but declined in acreage as newer varieties, such as AAC Starbuck and AAC Wheatland, increased.

Grade distribution

No. 1 and No. 2 CWRS:
97%

More information

Protein

Protein content:
13.8%

More information

Deoxynivalenol (DON)

DON < 1.0 ppm:
99.6%

More information

Falling Number (FN)

FN > 351 seconds:
80%

More information

Variety

Top varieties:

  • AAC Brandon
  • AAC Viewfield
  • AAC Starbuck
  • AAC Wheatland
Figure 1  Top CWRS varieties grown in western Canada from 2019 to 2023
Description follows
Graph data
% of total
Variety20192020202120222023
AAC Brandon4242383229
AAC Viewfield612141413
AAC Starbuck004912
AAC Wheatland003813
CDC Landmark78754
AAC Elie76544
Figure 2  Grade distribution and grading factors for CWRS as of November 27, 2023 (based on 2964 samples)
Description follows
Graph data
% of samples
No. 1No. 2≤ No. 3Feed
Grade distribution67.628.82.91.1
Hard vitreous kernels02400
Mildew02.900
Sprouted02.500
Figure 3  Mean protein content (13.5% mb, %) in CWRS from 2014 to November 27, 2023
Description follows
Graph data
Protein, %
Year%
201413.4
201514.1
201613.6
201713.1
201813.7
201913.6
202013.4
202114.7
202213.9
202313.8

Milling and functional quality

The milling performance and functional quality of CWRS was very good this year. The crop was sound and all aggregate wheat samples had wheat FN values greater than 350 seconds. The flour Amylograph peak viscosity was above 550 BU for the No. 1 milling grade and 470 BU for the No. 2 milling grade. The test weight was slightly lower than in 2022 and is related to the dry growing conditions this year in some areas of the Canadian prairies. Despite this, all CWRS aggregates had very strong milling yields on the Bühler laboratory mill, reaching 76% or higher (clean wheat basis).

Wheat ash was lower than last year, particularly for the No. 1 milling grade, eastern prairies aggregates. Flour ash was slightly lower in all CWRS aggregates. Colour was similar to last year, with slightly brighter L* values. Farinograph absorption was similar to 2022 for all CWRS aggregates. Dough strength increased in 2023 compared to 2022, as measured by Farinograph stability, Extensograph Rmax and bake test mixing energy, while maintaining excellent extensibility. Bake tests showed good loaf volumes.

Eastern prairie aggregates No. 1 CWRSFootnote 1

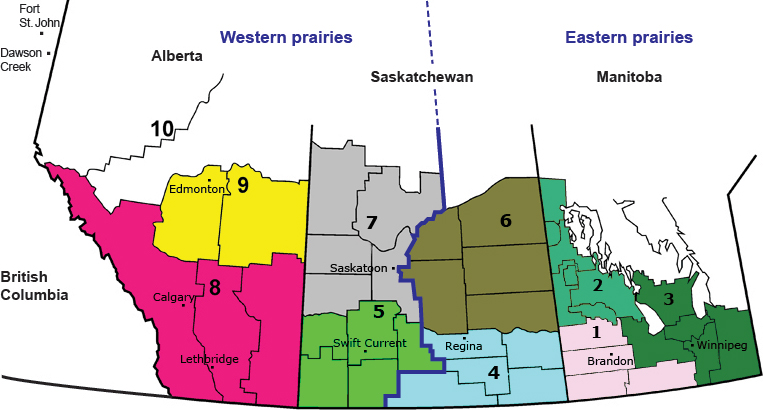
Eastern prairie aggregates are from eastern Saskatchewan and Manitoba (regions 1, 2, 3, 4 and 6 on the crop region map).

Wheat
Quality parameter20232022
Test weight, kg/hL81.782.8
Weight per 1000 kernels, g34.634.2
Protein content, %13.814.3
Protein content, % (dry matter basis)16.016.5
Ash content, %1.391.55
Falling Number, seconds382400
Particle size index, %5050
Milling flour yield - Bühler Laboratory Mill
Quality parameter20232022
Clean wheat basis, %76.476.2
Flour
Quality parameter20232022
74% extraction74% extraction
Protein content, %13.013.4
Protein loss, %0.80.9
Wet gluten content, %33.736.1
Gluten index, %98.194.6
Ash content, %0.420.43
Dough sheet brightness (L*) at 2hFootnote 277.276.6
Dough sheet redness (a*) at 2hFootnote 21.91.9
Dough sheet yellowness (b*) at 2hFootnote 225.925.9
Starch damage, %8.28.0
Amylograph peak viscosity, BU552638
Farinogram, 50 g bowl
Quality parameter20232022
74% extraction74% extraction
Absorption, %64.364.2
Dough development time, minutes7.26.7
Stability, minutes11.48.4
Mixing tolerance index, BU2632
Farinogram, 300 g bowlFootnote 3
Quality parameter20232022
74% extraction74% extraction
Absorption, %65.265.5
Dough development time, minutes6.27.1
Stability, minutes13.311.9
Mixing tolerance index, BU2022
Extensogram (135 minutes)
Quality parameter20232022
74% extraction74% extraction
Maximum resistance, BU617534
Extensibility (length), cm21.521.5
Area, cm2167146
Alveogram
Quality parameter20232022
74% extraction74% extraction
P (maximum over pressure), mm H2O115109
L (length), mm126147
P/L0.910.74
W (deformation energy), 10-4 joules491481
Ie (elasticity index), %64.260.7
Baking (Canadian short process)
Quality parameter20232022
74% extraction74% extraction
Absorption, %6867
Mixing time, minutes5.64.4
Mixing energy, Wh/kg14.211.1
Loaf volume, cm3/100 g flour9441008

Western prairie aggregates No. 1 CWRSFootnote 1

Western prairie aggregates are from British Columbia, Alberta and western Saskatchewan (regions 5, 7, 8, 9 and 10 on the crop region map).

Wheat
Quality parameter20232022
Test weight, kg/hL81.682.9
Weight per 1000 kernels, g33.335.5
Protein content, %14.214.0
Protein content, % (dry matter basis)16.416.2
Ash content, %1.461.50
Falling Number, seconds414417
Particle size index, %5049
Milling flour yield - Bühler Laboratory Mill
Quality parameter20232022
Clean wheat basis, %76.075.6
Flour
Quality parameter20232022
74% extraction60% extraction74% extraction60% extraction
Protein content, %13.613.513.113.0
Protein loss, %0.60.70.91.0
Wet gluten content, %37.536.134.435.1
Gluten index, %95.097.394.795.4
Ash content, %0.430.390.440.40
Dough sheet brightness (L*) at 2hFootnote 276.778.276.677.2
Dough sheet redness (a*) at 2hFootnote 22.01.61.71.6
Dough sheet yellowness (b*) at 2hFootnote 226.125.825.526.0
Starch damage, %7.97.78.38.3
Amylograph peak viscosity, BU631663711713
Farinogram, 50 g bowl
Quality parameter20232022
74% extraction60% extraction74% extraction60% extraction
Absorption, %65.865.165.365.0
Dough development time, minutes7.68.76.27.3
Stability, minutes11.925.79.814.7
Mixing tolerance index, BU2292017
Farinogram, 300 g bowlFootnote 3
Quality parameter20232022
74% extraction60% extraction74% extraction60% extraction
Absorption, %66.665.566.265.8
Dough development time, minutes7.011.56.78.9
Stability, minutes16.547.512.735.6
Mixing tolerance index, BU100158
Extensogram (135 minutes)
Quality parameter20232022
74% extraction60% extraction74% extraction60% extraction
Maximum resistance, BU555796553631
Extensibility (length), cm20.518.620.020.1
Area, cm2146183140160
Alveogram
Quality parameter20232022
74% extraction60% extraction74% extraction60% extraction
P (maximum over pressure), mm H2O124130121131
L (length), mm121110126122
P/L1.021.180.961.07
W (deformation energy), 10-4 joules509505483511
Ie (elasticity index), %63.764.160.660.8
Baking (Canadian short process)
Quality parameter20232022
74% extraction60% extraction74% extraction60% extraction
Absorption, %69696868
Mixing time, minutes5.25.44.44.7
Mixing energy, Wh/kg14.213.911.311.8
Loaf volume, cm3/100 g flour96997010051016
Baking (Sponge and dough)
Quality parameter20232022
74% extraction60% extraction74% extraction60% extraction
Absorption, %65656363
Mixing time, minutes3.53.73.94.1
Mixing energy, Wh/kg6.56.46.36.3
Loaf volume, cm3/100 g flour1042105910291034

All prairie aggregates No. 2 CWRSFootnote 1

All prairie aggregates are from British Columbia, Alberta, Saskatchewan and Manitoba (regions 1 to 10 on the crop region map).

Wheat
Quality parameter20232022
Test weight, kg/hL80.981.8
Weight per 1000 kernels, g36.134.2
Protein content, %13.013.5
Protein content, % (dry matter basis)15.115.7
Ash content, %1.421.52
Falling Number, seconds360357
Particle size index, %5251
Milling flour yield - Bühler Laboratory Mill
Quality parameter20232022
Clean wheat basis, %76.476.3
Flour
Quality parameter20232022
74% extraction74% extraction
Protein content, %12.312.7
Protein loss, %0.70.9
Wet gluten content, %32.834.0
Gluten index, %97.495.2
Ash content, %0.420.45
Dough sheet brightness (L*) at 2hFootnote 277.476.4
Dough sheet redness (a*) at 2hFootnote 21.61.7
Dough sheet yellowness (b*) at 2hFootnote 225.425.6
Starch damage, %7.87.9
Amylograph peak viscosity, BU470520
Farinogram, 50 g bowl
Quality parameter20232022
74% extraction74% extraction
Absorption, %63.763.7
Dough development time, minutes6.55.2
Stability, minutes9.97.8
Mixing tolerance index, BU3134
Farinogram, 300 g bowlFootnote 3
Quality parameter20232022
74% extraction74% extraction
Absorption, %64.664.7
Dough development time, minutes5.67.0
Stability, minutes13.110.3
Mixing tolerance index, BU1731
Extensogram (135 minutes)
Quality parameter20232022
74% extraction74% extraction
Maximum resistance, BU570447
Extensibility (length), cm22.022.0
Area, cm2161127
Alveogram
Quality parameter20232022
74% extraction74% extraction
P (maximum over pressure), mm H2O115106
L (length), mm116147
P/L0.990.72
W (deformation energy), 10-4 joules445457
Ie (elasticity index), %61.859.5
Baking (Canadian short process)
Quality parameter20232022
74% extraction74% extraction
Absorption, %6766
Mixing time, minutes5.54.4
Mixing energy, Wh/kg14.010.5
Loaf volume, cm3/100 g flour979951

Protein data by grade and by province

Figure 4  Distribution of protein content (13.5% mb, %) in CWRS from 2021 to November 27, 2023
Description follows
Graph data
% of samples
Protein range, %202120222023
< 12.03.899.019.29
12.0 to 12.98.1115.1917.28
13.0 to 13.919.6727.5633.01
14.0 to 14.930.1331.0225.13
> 15.038.2117.2115.30
Figure 5  Distribution of protein content (13.5% mb, %) in CWRS as of November 27, 2023
Description follows
Graph data
% of samples
Protein range, %ABSKMB
< 12.08.1711.705.39
12.0 to 12.914.1018.2720.44
13.0 to 13.928.4235.2334.01
14.0 to 14.924.5024.2628.21
> 15.024.8110.5411.89
Protein content (%)Footnote 4, No. 1 CWRS as of December 19, 2023
ProvinceNumber of samplesMeanSD
Manitoba52114.01.0
Saskatchewan96313.91.1
Alberta and B.C.69714.31.2
Western Canada218114.01.2
Protein content (%)Footnote 4, No. 2 CWRS as of December 19, 2023
ProvinceNumber of samplesMeanSD
Manitoba15513.11.1
Saskatchewan48813.01.2
Alberta and B.C.32913.31.4
Western Canada97213.11.3
Protein content (%)Footnote 4, No. 3 CWRS as of December 19, 2023
ProvinceNumber of samplesMeanSD
Manitoba6NSFootnote *NS
Saskatchewan2613.31.6
Alberta and B.C.18NSNS
Western Canada5013.61.6
Protein content (%)Footnote 4, CW Feed as of December 19, 2023
ProvinceNumber of samplesMeanSD
Manitoba11NSFootnote *NS
Saskatchewan22NSNS
Alberta and B.C.3914.61.4
Western Canada7214.01.6
Protein content (%)Footnote 4, all grades, CWRS as of December 19, 2023
ProvinceNumber of samplesMeanSD
Manitoba69313.81.1
Saskatchewan149913.61.2
Alberta and B.C.108314.01.4
Western Canada327513.81.3

Protein data by grade and crop region

Ten crop regions in western Canada were designated for Canada Western Red Spring (CWRS) wheat based on similarity of environmental characteristics within each region. Consideration was given to directional movement, political boundaries and production (seeded area) in choosing these regions. In addition, areas with a low level of production were grouped with larger production areas to ensure sufficient sample volume for analysis.

Canada Western Red Spring (CWRS) crop regions
Alberta, Saskatchewan and Manitoba crop regions 1 to 10. Details of regions follow.
Text description
  • Region 1: south western Manitoba
  • Region 2: central western Manitoba
  • Region 3: south eastern Manitoba
  • Region 4: south eastern Saskatchewan
  • Region 5: south western Saskatchewan
  • Region 6: central eastern Saskatchewan
  • Region 7: central western Saskatchewan
  • Region 8: southern Alberta
  • Region 9: central eastern Alberta
  • Region 10: northern Alberta
Protein content (%)Footnote 4, No. 1 CWRS as of December 19, 2023
RegionNumber of samplesMeanStandard deviation
130013.81.1
210213.80.9
311914.50.8
420813.61.2
511214.41.3
639613.81.0
724713.91.2
827514.81.2
929414.01.1
1012814.01.2
Protein content (%)Footnote 4, No. 2 CWRS as of December 19, 2023
RegionNumber of samplesMeanStandard deviation
17913.01.2
25612.90.6
320NSFootnote *NS
47812.61.2
59NSNS
624513.21.1
715612.91.4
83714.41.4
921013.11.3
108213.41.3

Grading factor data

Producer samples submitted to Harvest Sample Program are graded based on the Official Grain Grading Guide. Data below summarizes the occurrence and frequency of wheat grading factors. Downgrading of wheat can be due to 1 or more grading factors present in the sample.

Grading factors present (%) in Canada Western Red Spring wheat from all provinces as of December 19, 2023

SamplesNo. 1 CWRSNo. 2 CWRSNo. 3 CWRSFeed
Number of samples21839735072
% of total66.629.71.52.2
Grading factorNo. 1 CWRSNo. 2 CWRSNo. 3 CWRSFeed
Broken (BKN)0.02.310.019.4
Contrasting classes (CON CL)0.00.50.00.0
Dark immature (DKIM)0.00.02.00.0
Ergot (ERG)0.00.00.019.4
Frost (FR)0.04.112.02.8
Fusarium damage (FUS DMG)0.00.90.00.0
Green (GR)0.00.10.01.4
Grass green kernels (GRASS GR)0.00.20.00.0
Hard vitreous kernels (HVK)0.083.70.01.4
Immature (IM)0.00.10.00.0
Midge damage (MDGE)0.01.30.01.4
Mildew (MIL)0.08.78.00.0
Matter other than cereal grains (MOTCG)0.00.82.02.8
Non-registered variety (NON REGV)0.00.00.013.9
Natural stain (NSTN)0.00.02.00.0
Rotted kernels (ROT KRNL)0.00.00.01.4
Ruptured (RUP)0.00.10.00.0
Severely sprouted (SEVSPTD)0.05.832.029.2
Sawfly damage (SFLY DMG)0.00.10.00.0
Shrunken kernels (SHR)0.00.00.04.2
Total foreign material (TFM)0.02.124.012.5
Total shrunken and broken (TSHRBKN)0.00.10.01.4
Total sprouted (TSPTD)0.03.318.08.3
Test weight (TWT)0.00.10.00.0
Wheat of other classes (WOOC)0.00.02.00.0

Deoxynivalenol (DON) data

Deoxynivalenol (DON) is a mycotoxin that can be found in grain infected with Fusarium head blight. DON is not an official grading factor listed in the Canada Grain Regulations or the Official Grain Grading Guide. Instead, the Canadian Grain Commission uses the visual assessment of Fusarium damaged kernels as a proxy for DON.

Even if DON isn’t an official grading factor, it may be included as a contract specification in grain transactions. The Canadian Grain Commission provides DON results to producers who participate in the Harvest Sample Program.

Figure 6  Distribution of deoxynivalenol values for CWRS as of November 27, 2023
Description follows
Graph data
Distribution of deoxynivalenol values for CWRS as of November 27, 2023
DON (ppm)%
< 0.382.7
0.3 to 1.017.0
> 1.00.3
Deoxynivalenol (DON) values (ppm) in Canada Western Red Spring wheat as of December 19, 2023
DON (ppm)Number of samples% of total
Below limit (< 0.3 ppm)266180.49
0.3 to 1.063519.21
1.1 to 2.0100.3
2.1 to 3.000
3.1 to 4.000
4.1 to 5.000
5.1 to 6.000
Above limit (> 6.0 ppm)00
Total samples3306100

Falling Number (FN) data

Falling Number (FN) results are an indicator of sprout damage in wheat. FN is not an official grading factor listed in the Canada Grain Regulations or the Official Grain Grading Guide. Instead, the Canadian Grain Commission uses the visual assessment of sprouted and severely sprouted kernels as a proxy for FN.

Even if FN isn’t an official grading factor, it may be included as a contract specification in grain transactions. The Canadian Grain Commission provides FN results to producers who participate in the Harvest Sample Program.

Figure 7  Distribution of Falling Number values for CWRS as of November 27, 2023
Description follows
Graph data
Distribution of Falling Number values for CWRS as of November 27, 2023
Falling Number% of samples
> 35179.4
301 to 35014.9
251 to 3004.1
< 2501.5
Falling Number values (seconds) in Canada Western Red Spring wheat as of December 19, 2023

Falling Number (seconds)Number of samples% of total
> 450732.21
401 to 45088326.71
351 to 400166050.21
301 to 35049815.06
251 to 3001434.33
201 to 250371.12
151 to 20060.18
101 to 15030.09
61 to 10030.09
6000
Total samples3306100

Page details

2023-12-20