
Environmental change in the Kitikmeot Region of western Nunavut and Ulukhaktok region of eastern Northwest Territories
Table of contents
- Executive Summary
- Authors and contributors
- Citation information
- Introduction
- Why are the weather and the climate changing so quickly?
- How does climate change affect sea ice, permafrost, snow, lakes, and rivers in the Kitikmeot region?
- What should research and monitoring focus on?
- Future directions: toward bridging different ways of knowing
- Acknowledgements
- References
Download the report
Polar Knowledge Canada
For media inquiries, contact:
communications@polar-polaire.gc.ca
Executive Summary
There are many impacts observed across the Canadian North because of changing environmental conditions. Increasing heat in the atmosphere caused by human pollution is causing the Arctic to warm up faster then anywhere else on Earth, and more frequent and intense weather has been occurring across the North. More unpredictable weather, tundra fires, forceful winds and storminess is expected to occur, with important impacts on northern communities. Air temperature controls all aspects of Arctic life, including which animals and plants can survive, when rivers and oceans freeze and break up, and the thickness of sea ice and permafrost. Canadian Arctic communities are warming the most in winter. Rainfall changes affect caribou and muskoxen, as they must break ice to get to their food. The snow season is shorter. Permafrost is warming and thawing. Arctic plants are changing in complex ways, in some areas climate change is causing them to grow more, shrubs becoming denser, and more grasses are present. Eventually, the tree line will move Northward. Ocean water is changing with increasing freshwater and sediments from melt, and this affects ocean life from microscopic species to fish and marine mammals. Global sea level rise will be less significant in the Canadian Arctic compered to low-laying islands elsewhere in the world. Arctic Sea Ice is melting, and this affects the safety of ice travel.
There still is much to learn about the effects of climate change to the environment in the Canadian Arctic. Key indicators such as rain, temperature, vegetation change and more can be observed, measured and monitored. More monitoring, both local and regional, is needed so that these indicators can tell us about the environment and how it is changing over time. Monitoring will provide information to help improve our understanding of the key indicators, so that we can give more complete answers to questions about regional concerns. Natural scientists need to work with Indigenous Knowledge holders to better understand these key indicators.
To better understand the environmental effects of climate change and to build linkages between Indigenous Knowledge and Science, the Working Group came up with the following list of six Emerging Opportunities:
- Develop research partnerships with northern communities that focus on community-based research needs; include knowledge sharing and knowledge co-production for all aspects of environmental change research in the region.
- Develop a new set of environmental indicators with Indigenous rights holders. These would include indicators developed by Indigenous Knowledge holders and scientists and would be included in the research design. The indicators could be adapted for regional and local needs.
- Establish Community-Based Monitoring initiatives with long-term support that builds capacity in the community and enables the collection of consistent, continuous, and high-quality observations of key environmental indicators.
- Create opportunities for Inuit youth to participate in monitoring programs and use research tools and educational resources to develop their own youth-led projects.
- Develop models that predict how climate change will affect each community, to help them adapt.
- Develop tools for two-way exchange of information that are available to the public and simple to use.

Description: Summary of Environmental change – snow, ice, and precipitation - temperature impacts
An infographic shows simplified impacts of the rise in temperature on environment.
In the upper left corner of the infographic the capture reads "Climate change impacts land, freshwater, and ocean ecosystems in complex and interconnected ways." Below there is an image symbolizing sky with a sun shining. In the centre of the sky there is an image of a thermometer with an arrow beside it symbolizing rise in temperature. From the image of clouds on the sky the rain is falling on the herd of migrating caribou below. The capture reads "More rain-on-snow events". An arrow pointing from the image of a thermometer to an image of the cloud suggests that more rain is caused by a general rise in temperatures.
On the right the arrow from the image of the sun points downward and reflect from the surface of the images of tundra and ice pointing upwards. The capture beside reads "Areas without snow absorbing more heat".
Below the image of the sky there are images symbolizing the tundra, ice floe and the ocean. On the tundra in the center of the image there are images of houses, people, snowmobiles, and fishing racks, symbolizing an Inuit village. Captures on the image of the tundra read "More permafrost thaw" and" More landslides in steep slope areas" Number of arrows symbolising dispersing sun rays and warming temperature point in every direction. From the image of an esker rivers flows towards the ocean. Captures nearby read "More sediment entering streams" and "Changes in timing and amount of river flow". Series of arrows originating from the image of a snow-covered tundra point downward towards the ocean symbolizing the flow of water from the melting snow. Arrows originating from the image of a thermometer point downward towards the images of plants on the tundra which are accompanied by captures reading "More plant growth is possible" and "Snow melting earlier". On the image of the icefloe there are images of cracks in the ice and capture" More sea ice loss ". An arrow points from the image of the ice towards the image of the ocean and the capture reads "More freshwater remaining at ocean surface". An arrow originating from this capture point towards another capture which reads "Less nutrients brought up from deeper waters". Directly below the images of rivers flowing into the ocean, the ocean appears muddy and the capture reads "More sediment from erosion". Arrows pointing into opposing direction from the image of the thermometer and the image of the ocean suggesting interconnectivity between rising temperatures and "Sub-sea sediments release methane" and "Changes to ocean currents" and "Increase in surface water acidity". Images of fish and research ship appear on the ocean. Below there are four textboxes explaining the environmental impacts of rising temperatures.
Freshwater-Increased runoff changes river flow and reduces water quality. Rain-on-snow events make it harder for animals to find food or to stay warm.
Land-Warmer temperatures and longer snow-free periods destabilize permafrost and extend plant growing seasons.
Ocean and sea ice- Changes in water quality and the way waters mix impact the ocean life that make up the base of the marine food web. Sea ice loss also affects ocean mixing in addition to loss of habitat.
Climate change feedbacks-Warming soils, reduced snow cover, and changes to ocean currents can have a feedback effect lead to even more warming.
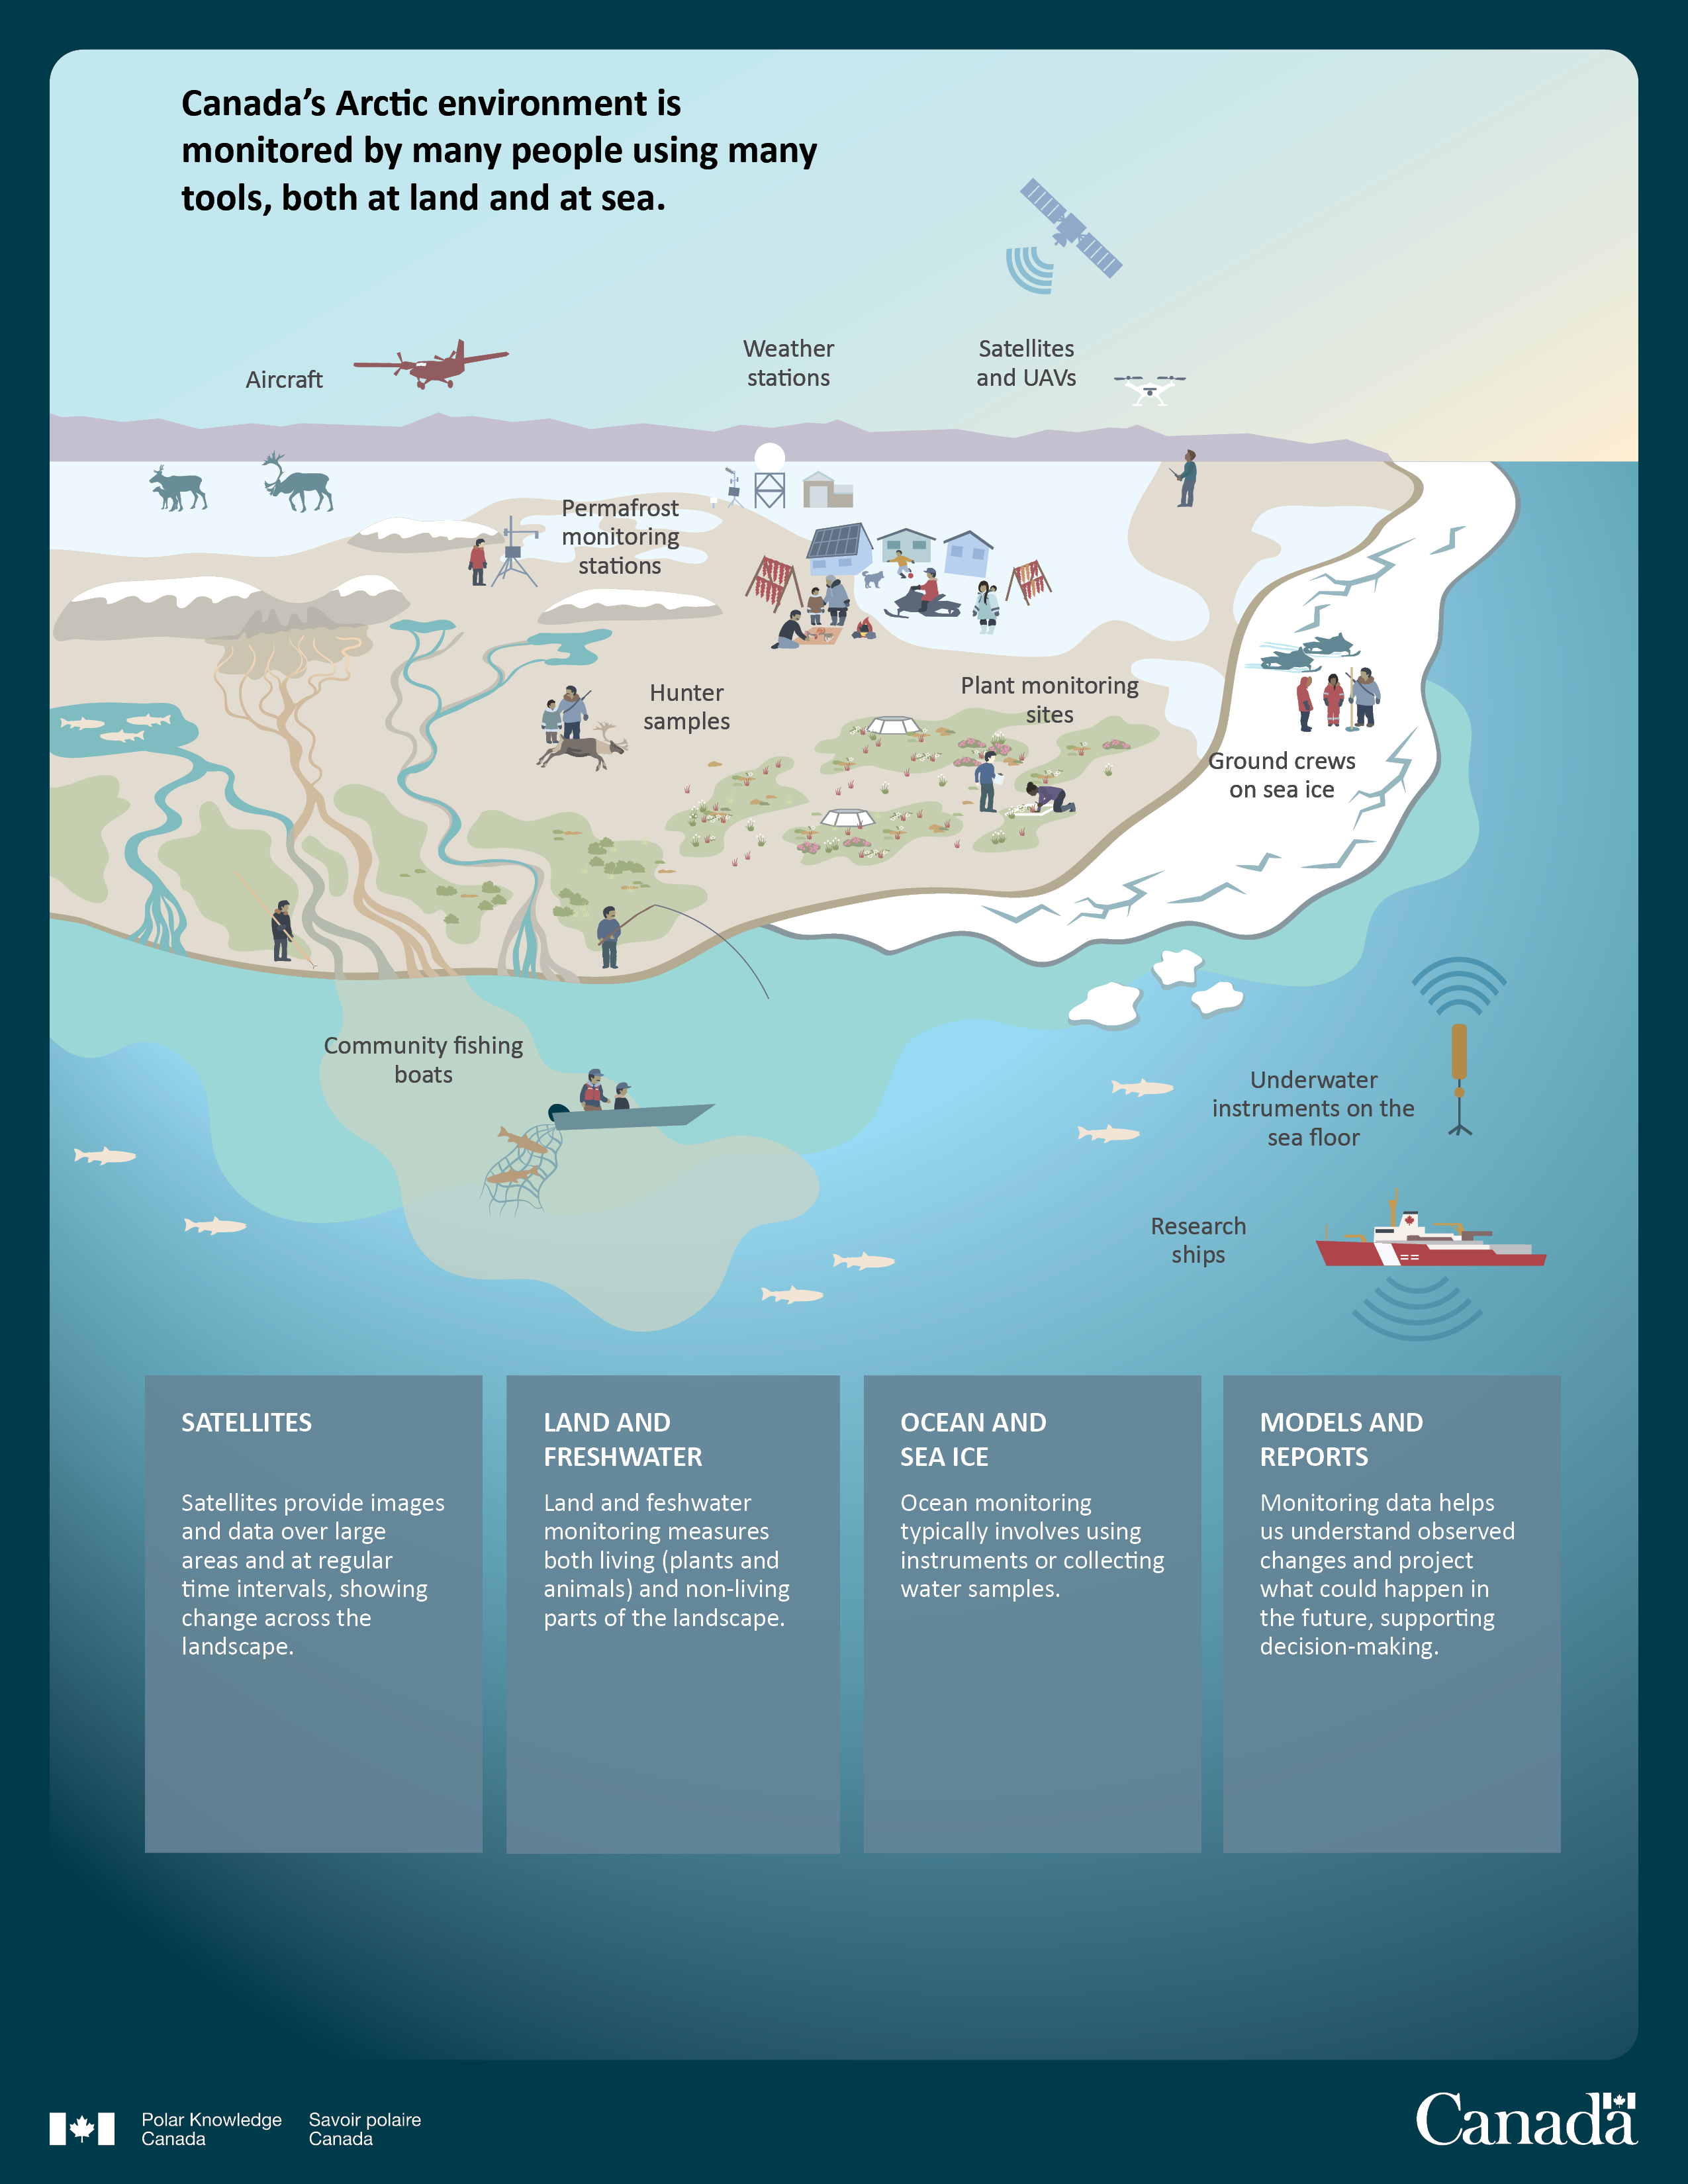
Description: Summary of Environmental change – snow, ice, and precipitation - monitoring methods
An infographic shows simplified methods of environmental monitoring. In the left upper corner the text reads" Canada's Arctic environment is monitored by many people using many tools, both at land and at sea." Below there is an image of a plane with a capture "aircraft", beside there is a text " weather stations" with an image symbolizing weather station, and an image of a satellite and drone with a capture "satellites and UAVs". Underneath there is an image of the tundra with caribou, flowing rivers and snow-covered eskers.
On the left a human figure beside a drilling equipment symbolizes taking samples of the permafrost. The capture beside reads" permafrost monitoring stations". On the right there is an image of Inuit houses with fish drying racks, dogs, snowmobilers and elders teaching children. The image symbolizes passing of knowledge between generation in a traditional Inuit village. On the right on the icefloe an image of human figures symbolizing researchers and Inuit guide with snowmobiles beside them symbolizes research and ice monitoring. The capture reads "grounds crews on sea ice".
In the center of the tundra Inuit hunter and youth stand together beside the carcass of a caribou. The capture reads "hunter samples". On the right of the hunters there are images of flowers growing on the tundra and human figures symbolizing researchers inspecting the flowers. The capture beside them reads "plant monitoring sites". Underneath, two human figures fish in the river and the ocean using a spear and a fishing rod. An image of a boat on the surface of the ocean is underneath the image of the tundra. The boat pulls a fishing net with fish entangled in the net and other fish swimming beside. A capture beside the boat reads "community fishing boats". On the right there is an image of a sensor on the ocean floor emitting a signal and an image of a Canadian Coast Guard research ship. The text captures below read "underwater instruments on sea floor" and "research ships". Below the images there are four textboxes with text which read:
Satellites: Satellites provide images and data over a large area and at regular intervals, showing change across the landscape.
Land and fresh water: land and freshwater monitoring measures both living (plants and animals) and nonliving parts of the landscape.
Ocean and sea ice: ocean monitoring typically involves using instruments or collecting water samples.
Models and reports: monitoring data helps us understand observed changes and project what could happen in the future supporting decision making.
Authors and contributors
- Donald McLennan* Arctic Research Foundation
- Kristina Brown* Fisheries and Oceans Canada
- Randall Scharien University of Victoria
- Brent Else University of Calgary
- Katherine Wilson Memorial University of Newfoundland
- Elyn Humphreys Carleton University
- Philip Marsh Wilfrid Laurier University
- Jennifer Ullulaq** Gjoa Haven, Nunavut
- Brian Park and Tyra Cockney-Goose** Inuvik, Inuvialuit
- Gary Aipellie and Nysana Qillaq** Clyde River, Nunavut
* Corresponding author
**Indigenous Knowledge Holders
Citation information
McLennan, D., Brown, K., Scharien, R., Else, B., Wilson, K., Humphreys, E., Marsh, P., Ullulaq, J., Park, B., Cockney-Goose, T., Aipellie, G. and Qillaq, N., 2022, Environmental change in the Kitikmeot Region of western Nunavut and Ulukhaktok region of eastern Northwest Territories. Polar Knowledge: Aqhaliat Report, Volume 4, Polar Knowledge Canada, p. 8–33. DOI: 10.35298/pkc.2021.01.eng
Introduction
In this paper we answer three questions about climate change that people from the Kitikmeot Region (Nunavut) and from Ulukhaktok (Northwest Territories) asked at a workshop at the Canadian High Arctic Research Station in March 2020.1
- Why is the weather changing so quickly? It is very cold, but the ocean is warmer, and ice breaks up sooner – there is also more vegetation even though winter is colder. Why is this happening?
- What are the main impacts of climate change on sea ice, permafrost, snow, lakes, and rivers in the Kitikmeot region?
- What areas should research and monitoring focus on to prepare for changing environmental conditions? Because Inuit depend on the land and ice for food and to maintain their culture, workshop participants want a better understanding of climate change so that communities can develop ways to adapt.
For the purposes of this document, we will be using the Government of Nunavut terms and definitions for weather, climate and climate change shown in Table 1.2
Table 1 Government of Nunavut terms and definitions for weather, climate, and climate change.
| English | Inuktitut | Inuinnaqtun | Definition |
|---|---|---|---|
| weather | sila | hila | "The short-term (hours or days) conditions of the air and sky over an area. It is described by the temperature, clouds, winds and rainfall or snowfall" (GN and NTI, 2005, p. 135). |
| climate | silaup qanuinnirigajuktanga | hilaup ilitquhia | "[t]he usual temperature, rain or snow and wind conditions of an area over a very long number of seasons" (GN and NTI, 2005, p. 39). |
| climate change | silaup asijjiqpallianinga | hilaup aalannguqtirninga | "A difference in the usual and extreme global temperatures that is not just a short cycle, but lasts for decades" (GN and NTI, 2005, p. 35). |
Why are the weather and the climate changing so quickly?
Climate change is caused by humans polluting the atmosphere.3 Between 1971 and 2019 the Arctic warmed more than three times faster than the rest of the planet, Figure 1; AMAP.4 This has disrupted normal global weather patterns. Very warm air has begun entering the Arctic and very cold air sometimes moves all the way to the southern United States.5 Ice and snow reflect heat from the sun while open water and land absorb it. With less sea ice there is more open ocean to absorb heat. Also, a shorter snow season means that the land absorbs more heat. This feedback of heat from the earth's surface to the atmosphere accelerates warming. As a result, the Arctic is experiencing more direct effects of warming than any other place on Earth. We are just beginning to understand how this warming is impacting Arctic communities and ecosystems.
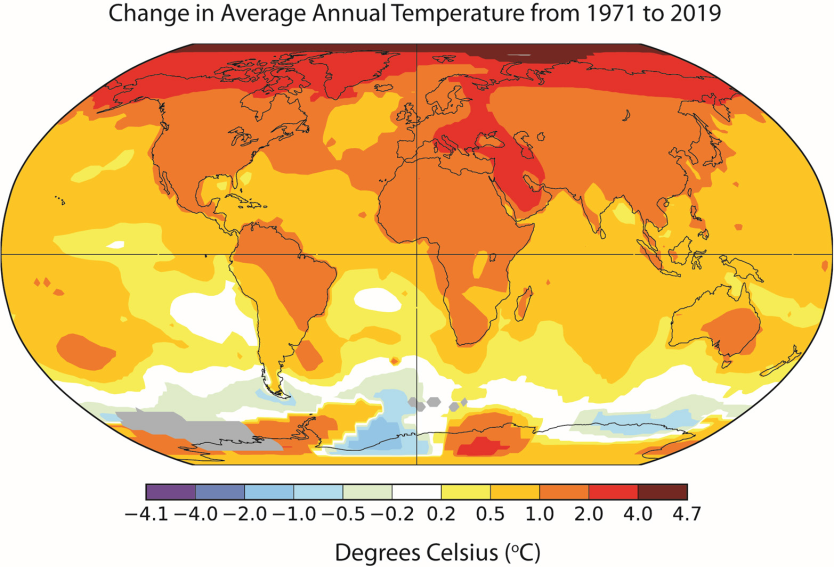
Figure 1: Changes in Average Annual Temperature from 1971 to 2019.9 The areas of the planet that have warmed the most are shown in red.
More heat in the atmosphere is causing extreme weather events around the world including unusual heat waves, droughts, hurricanes, and wildfires that are more frequent and hotter.
Indigenous Knowledge Box 1: Observed Change in Weather Across Nunavut (Gjoa Haven, Inuvik, and Clyde River)
Discussions from the Indigenous Knowledge workshop, 7 July 2021
Indigenous peoples and northerners are observing that the weather is changing in the Arctic. In Inuvik there have been changes to the sea ice and the weather is less predictable. In Gjoa Haven there is an increase in the amount of cloud, changes to precipitation and differences in the length of the snowmelt. Also, there have been observable differences in sea ice thickness with the past year having exceptionally thick ice that lasted longer. In Clyde River the weather is getting warmer resulting in ice formation later than observed decades before, a longer breakup season, and an earlier snowmelt. The ice and rain have changed with less snow than two decades ago, and less blizzards, cold northern winds and cold temperatures in general. As well, Clyde River used to get blizzards that lasted one to two weeks and now blizzards are only one to two days, and the wind direction is less consistently from the North.
How does climate change affect sea ice, permafrost, snow, lakes, and rivers in the Kitikmeot region?
Temperature is the most important factor for arctic ecosystems
Air temperature controls all aspects of arctic ecosystems including the rate at which plants grow, what kinds of plants and animals can survive, when lakes, rivers and the oceans freeze and break up, the depth and season of sea ice, and the depth of the thaw in the soil. As temperatures warm, plants are growing more rapidly, shrubs are more abundant, new kinds of animals are appearing, lakes and rivers are melting earlier, sea ice is freezing, and the ground thaw is deeper (as shown in the climate change impacts infographic).
Indigenous Knowledge Box 2: Impacts of Changing Conditions Across Nunavut (Gjoa Haven, Inuvik, and Clyde River)
Discussions from the Indigenous Knowledge workshop, 7 July 2021
Over the last two years in Gjoa Haven, the vegetation is richer and lusher, than before, possibly because the ice and snow is melting so slowly. In the spring of 2021, caribou, muskox, and other wildlife are more abundant travelling by the ice near Gjoa Haven instead of the west side of King William Island. This abundance could be because ice in the area this year was thicker and lasted longer.
In the Inuvialuit region, the permafrost changes and related soil conditions create more habitable space for a more vegetation, leading to increasing spread of leafy or deciduous plants especially along the Mackenzie River. This also seems to be leading to changes in plant productivity, like berries which are variable from year to year. In the Inuvialuit region, community members are concerned about traveling to cabins because they're unsure of travel conditions, due to less predictable weather. In the past, there was a predictable time of year that people could go out, but this is now changed. Wet land conditions and melting or slumping of permafrost all impacts travel and cabins. There is also concern that the water runoff from permafrost may affect freshwater systems. Additionally, in this region, there is also rising sea levels and coastal erosion that is impacting communities.
In Clyde River, there have been similar concerns of weather impacting travel routes. For example, old travel routes used by our ancestors that were mapped out are no longer being used because of changes in conditions in a lot of areas. The hunters and campers have to be careful to figure out new travel routes as the maps of routes are no longer usable. Conditions are too slushy.
Canadian Arctic communities are warming - mostly in winter
The Canadian Arctic is getting warmer, and some areas are warming more than others (Figure 2). Most warming is occurring in winter: December in Nunavik, and November in the Inuvialuit region. Summers are only warming slightly across Inuit Nunangat.
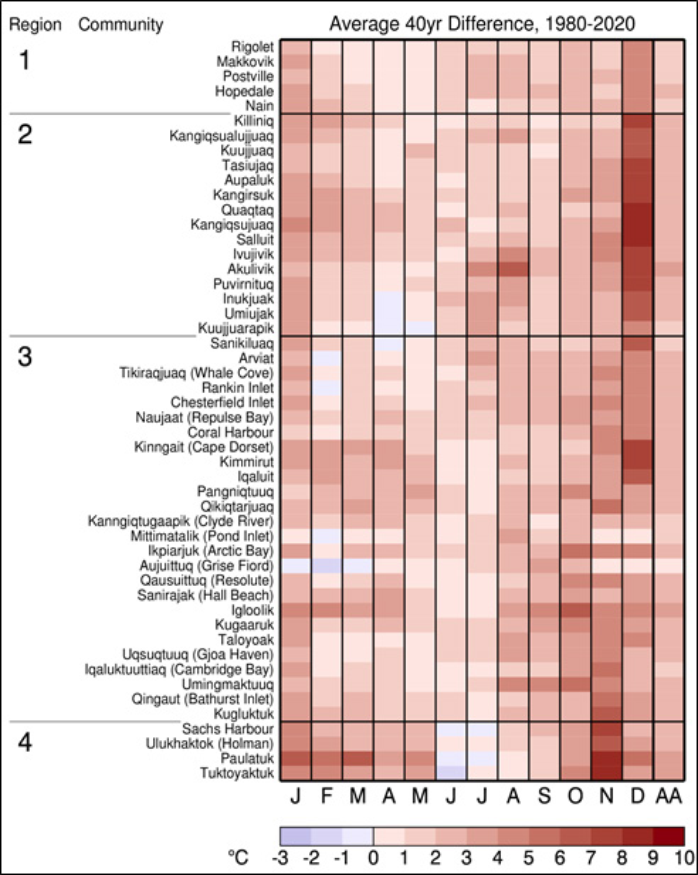
Figure 2: Northern Community Temperature Changes 1980 to 2020 for all Inuit Nunangat communities and by regions: 1 = Nunatsiavut, 2 = Nunavik, 3 = Nunavut, 4 = Inuvialuit. (Source: Lawrence Mudryk, ECCC).* Dark red indicates the most warming.
* For each community, data shown corresponds to the nearest ERA5 reanalysis grid cell. A linear trend is fit for each community-specific time series between 1980 and 2020, and the magnitude of the resulting 40-yr trend is used as the average temperature change that would have occurred locally since 1980. (Analysis and graphic by Lawrence Mudryk, ECCC).
Rainfall changes affect caribou and muskoxen
Arctic rainfall has increased slightly.10 It rains on snow-covered land more often than before. Rain on snow causes hardship for caribou and muskoxen because they must break through ice to get at their food. Groups of these animals have been found dead as a result.11, 12 After rain falls on snow, the snow does not insulate as well. This stresses small mammals because it gets colder underneath the snow, where they live in winter.13
The snow season is shorter
Snow has changed in different ways across the Arctic. Overall, the time when snow is on the ground is shorter.14 This is because the snow is melting earlier in spring. Warmer spring temperatures make the growing season for plants longer, so they can grow more.
Permafrost is warming and thawing
Permafrost is soil and rock that stays frozen for two or more years in a row.15 There is permafrost in most of the Arctic. It has been there for thousands of years and is hundreds of meters deep in some places. Permafrost temperatures are rising as the air warms.16 The depth of ground that thaws each year (the active layer) is increasing,17 and some permafrost is thawing.
On steep slopes permafrost thaw is causing landslides. These can be small or very large. They temporarily block streams and cause mud to flow into them.18 This stops fish movements, degrades fish habitat and water quality near the slide, and affects downstream lakes and coastal areas.
Arctic plants are changing in complex ways
Research shows that climate warming is causing some Arctic plants to grow more.19 In southern areas of the Arctic, shrubs such as willows and alders are growing more rapidly and getting more dense.20 Sedges and grasses are also growing more across the Arctic.21 At the moment, new plant species are not moving north except for limited movement in trees near the tree line. Eventually rising global temperatures will cause trees and other boreal forest plants to move northward into the Arctic.
Lakes and river flows are changing
Changing precipitation and snowmelt alters lake levels, the timing of river break-up, and the amount of water rivers carry. Observers across the Arctic have noticed changes in winter ice travel conditions on rivers and lakes. Ice roads have shorter seasons, which affects communities and industry. River flow is peaking earlier in spring and flows in late summer and in winter have increased.22 Warming and deepening of the layer of ground that thaws in spring also changes the materials rivers carry to the ocean, including carbon and nutrients. This in turn impacts river and ocean food webs. This can also affect fish habitat by raising water temperatures, lowering the amount of oxygen in the water, and changing the food supply. Rivers with long-term discharge records have shown small increases (Anderson, Burnside, and Ellice rivers), small decreases (Coppermine, Tree, and Back rivers), or no change (Freshwater Creek) in annual discharge over the past 50 years, with a general trend towards increased discharge in spring and fall, and lower discharge in summer.23
Ocean water is changing, and this affects ocean life
The effects of climate change on the land and in the atmosphere are affecting the ocean. In the ocean, waters from different depths mix. This mixing brings nutrients up from deep waters and increases productivity. Rivers and melting sea ice are now bringing more freshwater into the ocean, and this extra freshwater prevents ocean water from mixing. Thawing permafrost and more storm activity are adding sediment to coastal waters and reducing the amount of light. This makes life more difficult for microscopic plants at the base of the food web and impacts fish and marine mammals. Surface waters in the Arctic have become more acidic over the last decade.24 This could have important consequences for many types of marine species, including food for small fish.25
Global sea level rise will be less significant in the Canadian Arctic
While rising sea levels, caused in part by melting glaciers, are threatening coastal areas and low-lying islands elsewhere in the world, this will not be a significant problem in most of the Canadian Arctic. This is because sea level doesn't rise uniformly around the world, and in the Canadian Arctic the land is still rising after being pressed down under the weight of massive glaciers during the last Ice Age.
Arctic Sea Ice is melting, and this affects the safety of ice travel
Arctic sea ice area in Canada has been declining since 1968.14 The Northern Labrador Sea and Hudson Strait have lost the most ice. Everywhere there is less multi-year ice, which is the thick ice that has survived at least two years.14 The shore fast first-year sea ice near most coastal Arctic communities is forming later in the fall and melting earlier in the spring.27 Sea ice that forms later in the autumn is usually rougher and more difficult to travel on because it has been disrupted by strong winds.28 Tides and currents also affect sea ice thickness, creating visible open water, or invisible thin ice hidden by snow.29
Changes in the Arctic affect the rest of the planet
Researchers are starting to understand how changes in the Arctic are affecting the whole planet. Less sea ice and snow means that the land and the ocean absorb more heat. This not only makes the Arctic warmer in summer but also sends cold outbursts of Arctic air far to the south in the winter. Changes in Arctic soils may also play a role. Carbon normally accumulates in Arctic soils because summers are too cold for soil bacteria to break it down. As soil temperatures warm, soil bacteria are decomposing this store of soil carbon. This produces greenhouse gases that are added to the Earth's atmosphere likely causing further warming.26, 30 However, this process is complex and may be balanced by the increased growth of plants. Researchers do not yet understand how much this increased decomposition of soil carbon will contribute to warming the atmosphere.31 Finally, the large amounts of freshwater flowing into the Arctic's oceans could affect major ocean currents like the Gulf Stream, which warms much of northern Europe.32 What is clear is that "what happens in the Arctic does not stay in the Arctic."
What should research and monitoring focus on?
For monitoring changes in the ocean, land, weather, and sea ice, researchers must keep repeating the same measurements and observations over time and look for changes. There are many methods and tools to record and report environmental change, including community-based observations and measurements. These can range from drilling holes to measure sea ice thickness to observing changes in sea ice from satellites (as shown in the monitoring of Canada's Arctic infographic). In this section, we review the monitoring methods used in the Canadian North. We also look at the gaps in our knowledge and suggest some ways to work together to fill them.
Monitoring the ocean
Ocean monitoring in the Canadian Arctic involves using instruments to measure and collect water samples. Researchers can do this from large ships, like the Canadian Coast Guard icebreakers; from smaller ships, like the RV Martin Bergmann in Cambridge Bay; and even from community fishing boats. Some instruments, such as moorings, can be left in the ocean to record data over longer periods of time. Moorings are anchored to the seafloor and often left for a year or longer to measure temperature, currents, and salinity (how much salt is in the water). The largest moorings must be deployed from ships with cranes, but smaller instruments can be safely deployed from small boats, as shown in Figure 3b. Ocean Networks Canada has started to deploy instruments in the Arctic that send data directly to the internet. Their community underwater observatory in Cambridge Bay is a good example, as shown in Figure 3c.
Sea ice is also an excellent platform for measuring the ocean. Small instruments lowered through a hole in the ice measure the ocean temperature and salinity, as shown in Figure 3d. Researchers can also collect water samples through the ice. The Canadian Rangers Ocean Watch program has trained community members in the western Arctic to make such measurements. The Arctic Eider Society runs a similar program that collects winter samples in Sanikiluaq and other Hudson Bay and James Bay communities.

Figure 3: Arctic marine monitoring activities.
- The research icebreaker CCGS Amundsen (a, top left),
Photo credit: B. Else; - community-based research vessel Martin Bergmann (b, top right),
Photo credit: B. Else; - the Ocean Networks Canada underwater observatory (c, bottom left),
Photo credit: ONC; - the Canadian Rangers Ocean Watch (d, bottom right),
Photo credit: D. McLennan.
Monitoring on the land
Measuring environmental factors that directly affect plants and animals is important for observing changes on the land, and within lakes and rivers. These can include: the air temperature, wind speed and direction, and the amount of rain and snow. In Inuit Nunangat, government agencies such as Environment and Climate Change Canada (ECCC) measure these weather factors using weather instruments near local airports (shown in Figure 4a). Permafrost and the length of the growing season also need to be measured. Natural Resources Canada (NRCan) supports a network of permafrost monitoring stations across the Arctic. The International Tundra Experiment (ITEX) has monitored plants across the circumpolar North for many years, comparing plant growth in mini-greenhouses that imitate climate warming to plants outside the greenhouses (Figure 4b).
Environment and Climate Change Canada also monitors the chemistry (the substances in the water) of major Arctic rivers, and the amount of water they discharge into the ocean. Measuring the discharge helps show the impacts from changes in the timing of snowmelt, the amounts of rain and snow, soil erosion from melting permafrost, and the stream temperature. River and stream discharge and water temperatures are very important for fish species such as char that migrate to the oceans in summer.
Only a small number of Arctic lakes are being monitored. On Victoria Island, researchers from the Université du Quebec à Trois Rivières are studying lake temperature and chemistry and how they affect lake plants and animals. The researchers hope to learn whether changes in the tiny organisms (phytoplankton) in lakes affects the nutritional value of the lake char that are an important food source for Cambridge Bay.

Figure 4:
- (a, left) Weather instruments at Ulukhaktok Airport;
- (b, right) ITEX mini greenhouses that track changes in tundra vegetation.
Monitoring the land and ocean from above
Satellites play an important role in monitoring the massive area of the Canadian Arctic. Some monitor the land and sea ice. Optical satellites use the sun's light to provide colour images similar to a digital photograph. Radar satellites use radio waves to produce black and white images that show the roughness of the earth's surface. They operate well in darkness and poor weather and can be used all year in the Arctic. Usually, a satellite image covers an area several hundred kilometres wide and can show features as small as a few metres in size. Researchers use these images to make maps of land cover type (water, bare rock, vegetation), sea ice type, ocean surface temperature, and the amount of vegetation in an area (tundra greenness). Satellites can record long-term changes, such as the decrease in Arctic sea ice. Satellites do not always show the local ice conditions for sea ice travel. Local ice conditions can vary because of sheltered bays, pack ice, weather conditions (wind, snowfall), currents and tides, and location. Satellites can show sea ice roughness and open polynyas,33, 34 but communities do not have free access to this information.
Optical satellites are showing that the land is "greening," meaning that tundra plants— especially shrubs—are growing more.19 Figure 5a shows greening around the circumpolar region, and Figure 5b shows greening in the Kitikmeot region of Nunavut. In both cases, greening is widespread, but the rate of change is not the same everywhere. This suggests that all areas are not warming at the same rate. The greening around Bathurst Inlet and Kugluktuk may be caused by sea ice disappearing earlier.35
Monitoring by airplane, helicopter, and drone is useful for studying smaller areas, such as a watershed, lake, or bay. Drones provide the most detail: for example, they can show individual cracks in sea ice.
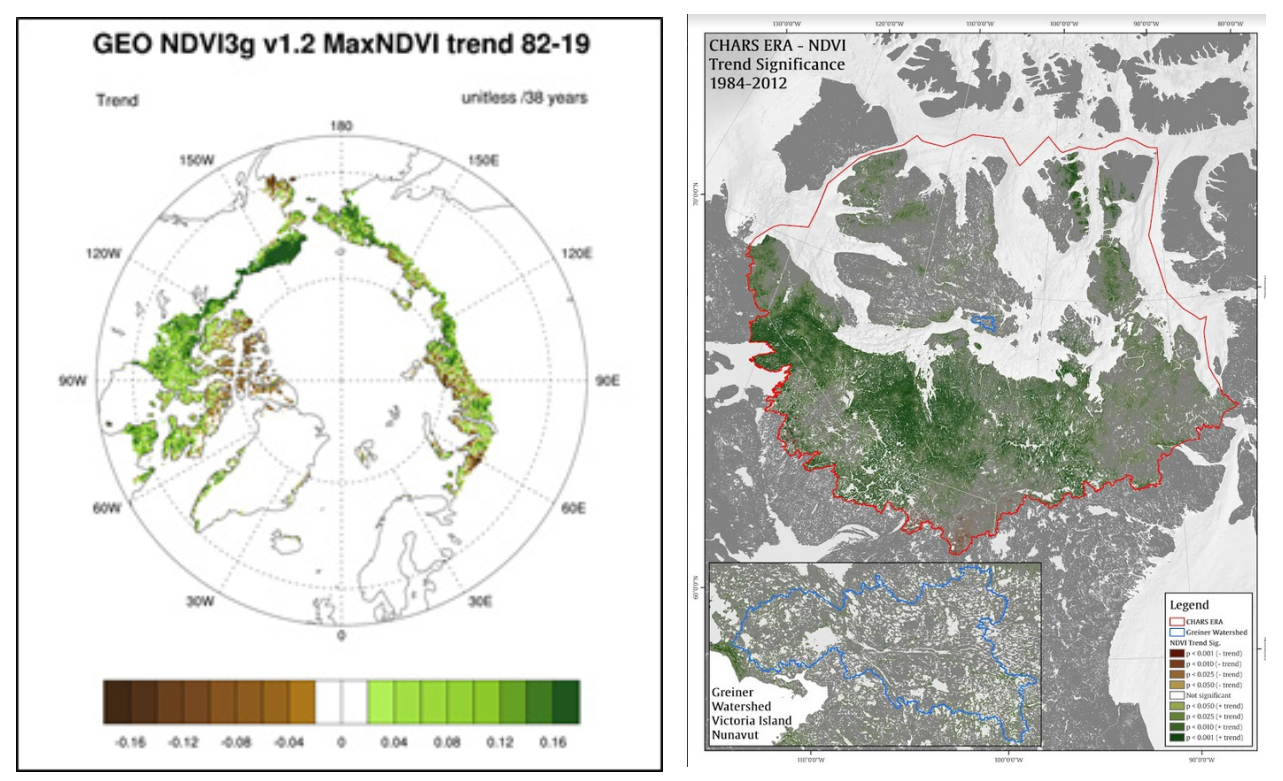
Figure 5:
- (a, left panel): Tundra "greening" as measured by satellites for the entire circumpolar area36 and
- (b, right) in the Kitikmeot Region. GIS projection by Blair Kennedy, ECCC-CWRC, using NASA Landsat (30 m) data.37
Indigenous environmental observations
Indigenous people have been observing and adapting to Arctic environmental change for millennia, passing knowledge between generations through oral histories and stories. Inuit hold the only long-term and consistent environmental climate record for the Canadian Arctic. This Inuit Qaujimajatuqangit (IQ) is not stored in a database. It dwells in the collective memory of Inuit knowledge-holders, who share their expertise orally. It is a source of climate history that can provide a baseline to assess change and fill gaps in Arctic monitoring.
Inuit in Mittimatalik (Pond Inlet), Nunavut have created sea ice travel maps of hazardous and safe areas for winter, early spring, and late spring.38 These maps are being used as a sea ice baseline, along with satellite data and ice charts, to show where and when the sea ice is changing. This is very useful for planning sea ice travel.
Some Inuit observations on change in Arctic environments are available in written form. Examples include Voices from the Bay, from the Hudson Bay area;39 Thunder on the Tundra, about change in the Bathurst caribou herd;40 and The Earth is Faster Now, which presents knowledge from across the circumpolar North.41 Through the Coastal Resources Inventory Program of the Nunavut Government's Fisheries and Sealing Department, Inuit hunters from all Nunavut communities share their knowledge of the environment, plants, and animals. Environmental observations can now be entered directly into live databases through online tools such as SIKU, which operates in Inuit Nunangat; ELOKA in Alaska and the western Arctic; and, also in Alaska, the spring Sea Ice for Walrus outlook. Community based monitoring provides many benefits; more community based monitoring networks are needed in the Canadian Arctic.42
Indigenous Knowledge Box 3: Community Involvement in Research and Monitoring Across Nunavut (Gjoa Haven, Inuvik, and Clyde River)
Discussions from the Indigenous Knowledge workshop, 7 July 2021
Currently, climate research and monitoring projects are conducted by a combination of researchers coming in and by local and Indigenous peoples. This community-led research is seen as good, but it is important to be aware that some communities may be experiencing research fatigue.
A key way to involve northern communities in research and monitoring efforts is to report research analysis back to the communities. Researchers should understand community concerns and viewpoints on time, place, and scale when making predictions. Sometimes when this is not done there is a disconnect between what the community members expect with respect to research outcomes. A lot of research is high-level and not connected to what the local priorities are.
While it is common for research reports and presentations of findings to be given back to the communities, it would be good to see information be made more accessible. For example, information could be presented as posters, videos, and graphics, which is helpful for those on the internet, with cell phones, or on social media. Sharing information on the radio is good for older generations. Information should also be provided to younger generations and shared with schools. Youth want to be involved and information shared at schools or in their curriculum can help the community be more involved.
There is acknowledgement that community involvement in research can go beyond their Indigenous Knowledge. There is interest in community members being involved in the science of projects and using technology and devices and being partners in research. It was suggested that community members could use technology, such as remote-control drones and sensors for checking thickness of sea ice. Technology could also be used to see data. For example, websites like that of SmartICE that show information from sensors collecting data from local hunting grounds, and showing information in English or Inuktitut, are helpful.
Where are the gaps in our knowledge?
We still have much to learn about the effects of climate change in environments in western Nunavut and eastern NWT. Key indicators can be observed, measured, and monitored. They tell us about the environment and how it is changing over time. For example, sea ice thickness can tell us if the weather over the past winter has been "normal" or different from previous years. Table 2 outlines some of the key indicators that we can monitor to track and understand climate change and shows some of the regional concerns that may relate to each key indicator. Table 2 also shows where there are gaps in our knowledge. More monitoring, both local and regional, is needed in these areas. Monitoring will provide information to help improve our understanding of the key indicators, so that we can give more complete answers to questions about regional concerns. Natural scientists need to work with Indigenous Knowledge holders to better understand these key indicators.
Table 1 Key Indicators of Environmental Change in Western Nunavut and Eastern NWT.
| Key Indicator | Regional Concerns | Examples of Monitoring and Observational Knowledge Gaps | Examples of Potential Monitoring Activities |
|---|---|---|---|
| Temperature (Atmosphere) | Less sea ice means more warming of the land, affecting char migration and local/ regional weather and climate | Temperature monitoring is often limited to community airports (ECCC) | Establish temperature sensors around communities to monitor and understand changes across the environment |
| Precipitation (Rain) | Increasing rain-on-snow events that impact caribou grazing and changes in the amount of rain over the growing season | Snow and rain monitoring are often limited to community airports (ECCC) | Set up sensors around communities to measure rain and snow to detect rain on-snow events and record changes in soil moisture |
| Snow Cover | Changes in snow are impacting caribou, muskoxen, and small mammals, as well as the long-term sustainability of the drinking water supply | Snow monitoring is often limited to community airports (ECCC) and through satellite imagery, which is difficult to use at community scales | Fund more co-developed, community-led programs that measure snow depth and use Inuit Knowledge and science observations of tundra animals |
| Permafrost (Soil Temperature) | Slumps and landslides are impacting fish habitat and collapsing ground damages infrastructure | Permafrost monitoring by federal and territorial governments is sparse across the Canadian Arctic | Establish permafrost monitoring sites in communities that link with regional and national networks |
| Vegetation Change | Vegetation is changing, which impacts important food sources for people and animals | Terrestrial monitoring is limited to specific areas of academic research | Establish long-term vegetation monitoring near communities to track changes in plant cycles and growth |
| River Discharge | Changes in river flow are impacting fish habitats and near-shore ecosystems | There is not enough information on river outflow for rivers in the Canadian Arctic; more is needed so we can understand how changes in river flow will impact wildlife and the environment | Conduct routine measurement of river discharge and chemistry across the region, covering different drainage basin types |
| River Nutrients | Increased runoff from the land into the rivers impacts the coastal ocean ecosystem and fish habitat | There is not enough information on water chemistry across the Canadian Arctic to understand long term change | Conduct routine measurement of river discharge and chemistry across the Arctic, covering different drainage basin types |
| Lake Ice and Ecosystems | Changes are affecting safe travel (uncertainty about conditions during freeze-up and melt), lake ecosystems, and the safety of drinking water | Lake monitoring is focused mainly on the large lakes (e.g., Great Slave) | Establish monitoring of nearby community lakes of concern |
| Ocean Temperature | Warming coastal waters impact the marine food web | There are not enough long term records to understand and predict changes in Canadian Arctic Ocean waters | Establish sensors moored in the ocean to constantly monitor deeper waters and surface water during ice-free seasons |
| Ocean Chemistry | Increased acidity of the ocean is impacting the marine food web | Establish community-led observing in the near-shore coastal region to measure river-to-ocean chemistry | |
| Sea Ice | Changes are affecting safe travel due to uncertainty about conditions during freeze-up and melt | Not enough sea ice observations for some areas and times; satellite images are sometimes hard to understand and difficult to access | Translate satellite and ice chart data into locally relevant sea ice observations and establish community led observation programs to monitor sea ice thickness and roughness along major routes |
Future directions: toward bridging different ways of knowing
How do we fill the gaps in our scientific knowledge to address community concerns and future change in the Kitikmeot, in Ulukhaktok, and across Canadian Arctic? What new tools and methods do we need, especially in communities? What are the best ways that scientists and Indigenous Knowledge holders can work together?43 As a group of environmental researchers working across the Canadian Arctic, our Working Group came up with the following list of six Emerging Opportunities. These will enable us to collect the observations we need to better understand the effects of climate change in this region. They will build linkages between Indigenous Knowledge and science.
- Develop research partnerships with northern communities that focus on community-based research needs, and include knowledge sharing and knowledge co-production for all aspects of environmental change research in the region.
- Develop a new set of environmental indicators with Indigenous rights holders. These would include indicators developed by Indigenous Knowledge holders and scientists and would be included in the research design. The indicators could be adapted for regional and local needs.
- Establish community-based monitoring initiatives with long-term support that builds capacity in the community and enables the collection of consistent, continuous, and high-quality observations of key environmental indicators.
- Create opportunities for Inuit youth to participate in monitoring programs and use research tools and educational resources to develop their own youth-led projects.44
- Develop models that predict how climate change will affect each community, to help them adapt.
- Develop tools for two-way exchange of information that are available to the public and simple to use.
Acknowledgements
Participants, Polar Knowledge Canada. Regional Planning and Sharing Workshop. Setting a foundation for future relationships. March 10–11, 2020's Workshop, Workshop March 2020:
- Matilde Tomaselli (POLAR)
- Jennifer Sokol (POLAR)
- Jennifer Fresque-Baxter (Government of Northwest Territories
- Environment and Natural Resources)
- Ellie Adjun (POLAR)
- Kate Broadley (Fuse Consulting)
- Janine Angohiatok (Youth Representative Cambridge Bay)
- Bobby Anavilok (Vice-Chair Kugluktuk Angonaitit Association)
- Joseph Haluksit (Chair Olokhaktomiut Hunters and Trappers Committee)
- George Angohiatok (Vice-Chair Ekaluktutiak HTO)
- Willie Aglukkaq (Representative Gjoa Haven HTO)
- Joe Ashevak (Chair Spence Bay HTO)
- Canute Krejunark (Representative Kugaaruk HTO)
- Ema Qaqqutaq (Kitikmeot Regional Wildlife Board)
- Nick Amautinuar (Interpreter)
- Jason Etuangat (Youth Representative Pangnirtung)
- François Carrier (POLAR)
- Rafal Stolarz (POLAR)
- Kevin Methuen (Government of Nunavut, Department of Environment)
- Elisabeth Jansen-Hadlari (Facilitator, Hadlari Consulting)
- Brent Else (University of Calgary)
- Stephanie Taptuna (Nunavut Impact Review Board)
- Lynda Orman (POLAR)
- Ann Balasubramaniam (POLAR)
Missing or absent due to weather:
- Pamela Hakongak Gross (Mayor Cambridge Bay)
- Malik Awan (Government of Nunavut Department of Environment)
- Bert Dean (Nunavut Tunngavik Incorporated)
- Donald McLennan (POLAR).
Other participants in Polar Knowledge Canada's Collaborative Assessment Project Environmental Working Group, Scoping Workshop May 6th and 7th 2021:
- Richard Dewey, Ocean Networks Canada and Alexandre Langlois, Université de Sherbrooke
- Indigenous Knowledge Workshop Facilitator, Madeleine Redfern, Ajungi Arctic Consulting
- Infographics, by Kate Broadley, Fuse Consulting Plain language editing, John Bennett, Polar Knowledge Canada
- Facilitators, Samantha McBeth and Ann Balasubramaniam, Polar Knowledge Canada
- Laura Bowley and the Neolé Team
References
- Polar Knowledge Canada. Regional Planning and Knowledge Sharing Workshop – Setting a foundation for respectful relationships. 2021 10-11 March 2020 in Cambridge Bay, Nunavut, pp. ii and 14. doi: 10.35298/ pkc.2021.RPKSW.eng. Available at: https://www.canada.ca/content/dam/polar-polaire/documents/pdf/knowledge-sharing-forum/knowledge-sharing-forum-enweb.pdf.
- GN and NTI. 2005. Terminology on Climate Change. Government of Nunavut, Department of Culture, Language, Elders and Youth and Nunavut Tunngavik Incorporated. ISBN 1-55325-082-6. Available at: https://climatechangenunavut.ca/sites/default/files/terminolgy_on_climate_change.pdf.
- Fyfe, J., Gillett, N. and Zwiers, F. 2013. Overestimated global warming over the past 20 years. Nature Clim Change,3:767-769. Available at: https://doi.org/10.1038/nclimate1972.
- AMAP. 2021. Arctic Climate Change Update: Key trends and impacts summary for policy makers. Available at: https://oaarchive.arctic-council.org/handle/11374/2621.
- Coumou, D., Di Capua, G., Vavrus, S., Wang, L. and Wang, S. 2018. The influence of Arctic amplification on mid-latitude summer circulation. Nature Communications. 9:2959. doi: 10.1038/s41467-018-05256-8.
- Masson-Delmotte, V., Zhai, P., Pirani, A., Connors, S.L., Péan, C., Berger, S., Caud, N., Chen, Y., Goldfarb, L., Gomis, M.I., Huang, M., Leitzell, K., Lonnoy, E., Matthews, J.B.R., Maycock, T.K., Waterfield, T., Yelekçi, O., Yu, R. and Zhou, B. (eds.). In Press. IPCC, 2021: Summary for Policymakers. In: Climate Change 2021: The Physical Science Basis. Contribution of Working Group I to the Sixth Assessment Report of the Intergovernmental Panel on Climate Change.
- Meredith, M., Sommerkorn, M., Cassotta, S., Derksen, C., Ekaykin, A., Hollowed, A., Kofinas, G., Mackintosh, A., Melbourne-Thomas, J., Muelbert, M.M.C., Ottersen, G., Pritchard, H. and Schuur, E.A.G. 2019. Polar Regions In: IPCC Special Report on the Ocean and Cryosphere in a Changing Climate. H.-O. Pörtner, D.C. Roberts, V. Masson-Delmotte, P. Zhai, M. Tignor, E. Poloczanska, K. Mintenbeck, A. Alegría, M. Nicolai, A. Okem, J. Petzold, B. Rama, N.M. Weyer (eds.).
- Overland, J., Dunlea, E., Box, J.E., Corell, R., Forsius, M., Kattsov, V., Skovgård Olsen, M., Pawlak, J., Reiersen, L.-O., and Wang, M. 2019. The urgency of Arctic change, Polar Science. Vol. 21, pp. 6-13. ISSN 1873-9652. Available at: https://doi.org/10.1016/j.polar.2018.11.008.
- GISTEMP Team. 2021. GISS Surface Temperature Analysis (GISTEMP), version 4. NASA Goddard Institute for Space Studies. Availabe at: https://data.giss.nasa.gov/gistemp/.
- Vincent, L. A., X. Zhang R. D. Brown, Y. Feng, E. Mekis, E. J. Milewska, H. Wan, and X. L. Wang. Observed Trends in Canada's Climate and Influence of Low-Frequency Variability Modes. Climate. 2015 28: 4545–4560.
- Grenfell, T.C. and Putkonen, J. A method for the detection of the severe rain-on-snow event on Banks Island, October 2003, using passive microwave remote sensing. Water Resouces Research. 2008 44(W03425), Available at: https://doi.org/10.1029/2007WR005929.
- Langlois, A., Johnson, C.-A., Montpetit, B., Royer, A., Blukacz-Richards, E.A., Neave, E., et al. 2017. Detection of rain-on-snow (ROS) events and ice layer formation using passive microwave radiometry: A context for Peary caribou habitat in the Canadian Arctic. Remote Sensing of Environment,189:84-95.
- Callaghan, T.V., Johansson, M., Brown, R.D., Groisman, P.Y., Labba, N., Radionov, V. et al. 2011. Multiple Effects of Changes in Arctic Snow Cover. AMBIO, 40:32-45.
- Derksen, C., Burgess, D., Duguay, C., Howell, S., Mudryk, L., Smith, S., Thackeray, C. and Kirchmeier-Young, M. 2019. Changes in snow, ice, and permafrost across Canada; Chapter 5 in Canada's Changing Climate Report, (ed.) E. Bush and D.S. Lemmen; Government of Canada, Ottawa, Ontario, pp. 194-260.
- Vincent, W.F., Lemay, M. and Allard, M. 2017. Arctic permafrost landscapes in transition: towards an integrated Earth system approach. Arctic Science. 3(2):39-64. Available at: https://doi.org/10.1139/as-2016-0027.
- Romanovsky, V.E., Smith, S.L. and Christiansen, H.H. 2010. Permafrost Thermal State in the Polar Northern Hemisphere during theInternational Polar Year 2007– 2009: A Synthesis. Permafrost and Periglac. Process. 2010 21: 106-116. doi: 10.1002/ppp.689.
- AMAP. 2017. Snow, Water, Ice and Permafrost in the Arctic (SWIPA) 2017. Arctic Monitoring and Assessment Programme (AMAP), Oslo, Norway. Xiv:269.
- Chin, K.S., Lento, J., Culp, J.M., Lacelle, D. and Kokelj, S.V. 2016. Permafrost thaw and intense thermokarst activity decreases abundance of stream benthic macroinvertebrates. Global Change Biology. Available at: https://doi.org/10.1111/gcb.13225.
- Myers-Smith, I.H., Grabowski, M.M., Thomas, H.J.D., Angers-Blondin, S., Daskalova, G.N., Bjorkman, A.D., Cunliffe, A.M., Assmann, J.J., Boyle, J., McLeod, E., McLeod, S., Joe, R., Lennie, P., Arey, D., Gordon, R. and Eckert, C. 2019. Eighteen years of ecological monitoring reveals multiple lines of evidence for tundra vegetation change. Ecological Monographs, 89(2):e01351.10.1002/ecm.1351.
- Myers-Smith, I.H., et al. 2011. Environ. Res. Lett., 6(04):15.
- Gauthier, G., Berteaux, D. Bety, J., Tarroux, A., Therrien, J.F., MacKinnon, L., Legagneux, P. and Cadieux, M.C. 2010. The tundra food web of Bylot Island in a chnaging climate and the role of exchnages between ecosystems. Ecoscience, 18(3):233-235.
- Holmes, R.M. et al. 2018. River Discharge (in Arctic Report Card 2018). Available at: https://www.arctic.noaa.gov/Report-Card.
- Déry, S.J. et al., 2016. Recent trends and variability in river discharge across northern Canada. Hydrol. Earth Syst. Sci., 20:4801-4818.
- Steiner, N. et al. 2015. Observed trends and climate projections affecting marine ecosystems in the Canadian Arctic, Environ. Rev., 23:191-239. dx.doi.org/10.1139/er-2014-0066.
- Steiner, N.S., et al. 2019. Impacts of the Changing Ocean-Sea Ice System on the Key Forage Fish Arctic Cod (Boreogadus Saida) and Subsistence Fisheries in the Western Canadian Arctic—Evaluating Linked Climate, Ecosystem and Economic (CEE) Models, Front. Mar. Sci. Available at: https://doi.org/10.3389/fmars.2019.00179.
- Najafi, M., Zwiers, F. and Gillett, N. 2015. Attribution of Arctic temperature change to greenhouse-gas and aerosol influences. Nature Clim Change, 5:246-249. Available at: https://doi.org/10.1038/nclimate2524.
- Stroeve, J.C., Markus, T., Boisvert, L., Miller, J. and Barrett, A. 2014. Changes in Arctic melt season and implications for sea ice loss, Geophys. Res. Lett., 41:1216-1225. doi:10.1002/2013GL058951.
- Segal, R., Scharien, R.K., Duerden, F. and Tam, C.L. 2020a. "The best of both worlds" – Connecting remote sensing and Arctic communities for safe sea ice travel, Arctic. 73(4):461-484. doi: 10.14430/arctic71896.
- Melling, H., Haas, C. and Brossier, E. 2015. Invisible polynyas: Modulation of fast ice thickness by ocean heat flux on the Canadian polar shelf, J. Geophys. Res. Oceans, 120 :777-795. doi:10.1002/2014JC010404.
- Schuur, E.A.G., McGuire, A.D., Schädel, C., Grosse, G., Harden, J.W., Hayes, D.J., et al. 2015. Climate change and the permafrost carbon feedback. Nature, 520(7546):171- 179. Available at: https://doi.org/10.1038/nature14338.
- Wieder, W.R., Sulman, B.N., Hartman, M.D., Koven, C.D. and Bradford, M.A. 2019. Arctic soil governs whether climate change drives global losses or gains in soil carbon. Geophysical Research Letters. 46, 486-495. Available at: https://doi.org/10.1029/2019GL085543.
- Holliday, N.P., Bersch, M., Berx, B., Chafik, L., Cunningham, S., Florindo-López, C., Hátún, H., et al., 2020. Ocean circulation causes the largest freshening event for 120 years in eastern subpolar North Atlantic. Available at: https://doi.org/10.1038/s41467-020-14474-y.
- Murashkin, D., Spreen, G., Huntemann, M. and Dierking, W. 2018. Method for detection of leads from Sentinel-1 SAR images. Annals of Glaciology, 59(76pt2):124-136. doi:10.1017/aog.2018.6.
- Segal, R., Scharien, R., Cafarella, S. and Tedstone, A. 2020b. Characterizing winter landfast sea-ice surface roughness in the Canadian Arctic Archipelago using Sentinel-1 synthetic aperture radar and the Multi-angle Imaging SpectroRadiometer. Annals of Glaciology, 61(83):284-298. doi:10.1017/aog.2020.48.
- Fauchald, P., Park, T., Tommervik, H., Myeni, R. and Hausner, V.H. 2017. Arctic greening from warming promotes declines in caribou populations. Science Advances, 3: e1601365.
- Frost, G.V., et al. 2020.Tundra Greenness. NOAA Arctic Report Card 2020. Available at: https://repository.library.noaa.gov/view/noaa/27903.
- Ju, J. and Masek, J.G. 2018. ABoVE: NDVI Trends across Alaska and Canada from Landsat, 1984-2012. ORNL DAAC, Oak Ridge, Tennessee, USA. Available at: https://doi.org/10.3334/ORNLDAAC/1576.
- Wilson, K.J., Arreak, A., Sikumiut Committee, Bell, T. and Ljubicic, G.J. 2021. The Mittimatalik Siku Asijjipallianinga (Sea Ice Climate Atlas): How Inuit Knowledge, Earth Observations, and Sea Ice Charts Can Fill IPCC Climate Knowledge Gaps. Front. Clim., 3:715105. doi:10.3389/fclim.2021.715105.
- MacDonald, M., Arragutainaq, L. and Novalinga, Z. 1997. Voices From the Bay: Traditional Ecological Knowledge of Inuit and Cree in the Hudson Bay Bioregion, Canadian Arctic Resources Committee, and the Environmental Committee of Municipality of Sanikiluaq, p. 100. Available at: https://arcticeider.com/product/voices-from-the-bay-traditional-ecological-knowledge-of-inuit-and-cree-in-the-hudson-bay-bioregion/.
- Thorpe, N., Hakongak, N., Eyegetok, S. and the Kitikmeot Elders. 2011. Thunder on the Tundra: Inuit Qaujimajatuqangit of the Bathurst Caribou, Vancouver, Tuktu and Nogak Project, p. 208.
- Krupnik, I. and J. Dyanna (eds.). 2002. The Earth is Faster Now: Indigenous Observations of Arctic Environmental Change. Fairbanks, Alaska: Arctic Research Consortium of the United States. pp. 384. ISBN 0-9720449-0-6.
- Johnson, N., Alessa, L., Behe, C., Danielsen, F., Gearheard, S., Gofman-Wallingford, V., Kliskey, A., Krümmel, E.M., Lynch, A., Mustonen, T., Pulsifer, P. and Svoboda, M. 2020. The Contributions of CommunityBased Monitoring and Traditional Knowledge to Arctic Observing Networks: Reflections on the State of the Field. 2015 ARCTIC, Vol. 68, Suppl. 1. Available at: http://dx.doi.org/10.14430/arctic4447.
- Wong C., Ballegooyen, K., Ignace, L., Johnson, M.J.(G.) and Swanson, H. 2020. Towards reconciliation: 10 Calls to Action to natural scientists working in Canada. FACETS 2020, 5: 769-783. doi:10.1139/facets-2020-0005.
- Pedersen, C., et al. 2020. ScIQ: An invitation and recommendations to combine science and Inuit Qaujimajatuqangit for meaningful engagement of Inuit communities in research, Arctic Science 2020 ,6: 326-339. dx.doi.org/10.1139/as-2020-0015.
Page details
- Date modified: