
Fact sheet: Cancer in Canada
Download the alternative format
(PDF format, 868 KB, 7 pages)
Organization: Public Health Agency of Canada
Published: 2018-06-05
Nearly half of all Canadians will develop cancer during their lifetime, and about one quarter of Canadians are expected to die from the disease.Footnote 1 Cancer is the leading cause of death in Canada - responsible for 30% of all deaths- followed by cardiovascular disease (heart disease and stroke), chronic respiratory diseases, and accidents.Footnote 2
Although the overall risk of dying from cancer is declining in Canada, the number of new cancer diagnoses and cancer deaths continues to rise.Footnote 1 The steady increase in the number of cancer cases and deaths is primarily due to the aging and growth of the population, a phenomenon that is expected to continue over the coming decades.Footnote 3
The Public Health Agency of Canada (PHAC), in collaboration with other governmental and non-governmental organizations, conducts national surveillance of cancer to support the planning and evaluation of cancer-related policies, programs, and services. For this fact sheet, data from the Canadian Cancer Registry, the Canadian Vital Statistics – Death Database, and the Canadian Community Health Survey were used to provide current statistics on the burden of cancer in Canada.
What is cancer?
Cancer is characterized by uncontrolled growth and spread of abnormal cells anywhere in the body.Footnote 4 While there are more than 100 different types of cancer, the top four types (i.e. lung, colorectal, breast, and prostate) make up 50% of all cancer cases diagnosed in Canada.Footnote 1
How many Canadians live with cancer (prevalence)?
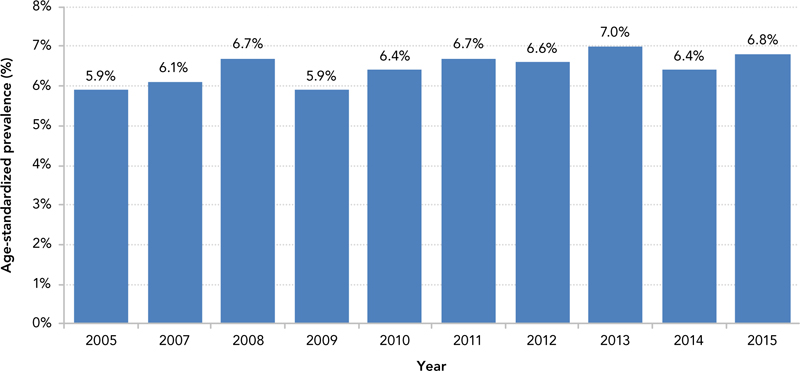
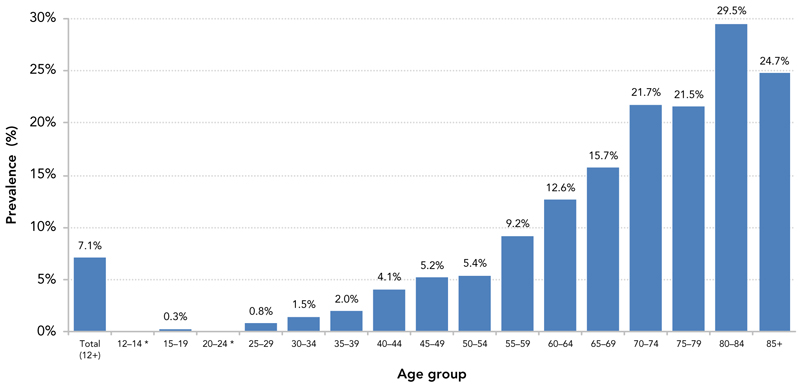
In 2015, 7.1% (2.1 million) Canadians aged 12 years and older reported being diagnosed with cancer at some point during their lifetime. The age-adjusted prevalence of cancer increased slightly during the most recent 10 years, from 5.9% to 6.8% (Figure 1), mostly due to improved survival among those diagnosed with the disease. The prevalence of cancer increases dramatically with age (Figure 2). By 70 years of age, more than 20% of Canadians (1 in 5) report having been diagnosed with cancer during their lifetime.
Figure 1: Age-standardized lifetime prevalence of cancer among individuals aged 12 years and older, Canada, 2005–2015
Text Description
| Year | Age-standardized prevalence (%) |
|---|---|
| 2005 | 5.9% |
| 2007 | 6.1% |
| 2008 | 6.7% |
| 2009 | 5.9% |
| 2010 | 6.4% |
| 2011 | 6.7% |
| 2012 | 6.6% |
| 2013 | 7.0% |
| 2014 | 6.4% |
| 2015 | 6.8% |
Data Source: Canadian Community Health Survey 2015 – Statistics Canada.
Note: Prevalence estimates are age-standardized to the 2011 Canadian population.
Figure 2: Age-specific lifetime prevalence of cancer among individuals aged 12 years and older, Canada, 2015
Text Description
| Age Group | Prevalence (%) |
|---|---|
| Total (12+) | 7.1% |
| 12–14 * | - |
| 15–19 | 0.3% |
| 20–24 * | - |
| 25–29 | 0.8% |
| 30–34 | 1.5% |
| 35–39 | 2.0% |
| 40–44 | 4.1% |
| 45–49 | 5.2% |
| 50–54 | 5.4% |
| 55–59 | 9.2% |
| 60–64 | 12.6% |
| 65–69 | 15.7% |
| 70–74 | 21.7% |
| 75–79 | 21.5% |
| 80–84 | 29.5% |
| 85+ | 24.7% |
Data Source: Canadian Community Health Survey, 2015 – Statistics Canada
Note: Asterisks (*) denote estimates supressed due to large sampling variability (i.e. coefficient of variation (CV) > 35%).
How many Canadians are newly diagnosed with cancer each year (incidence)?
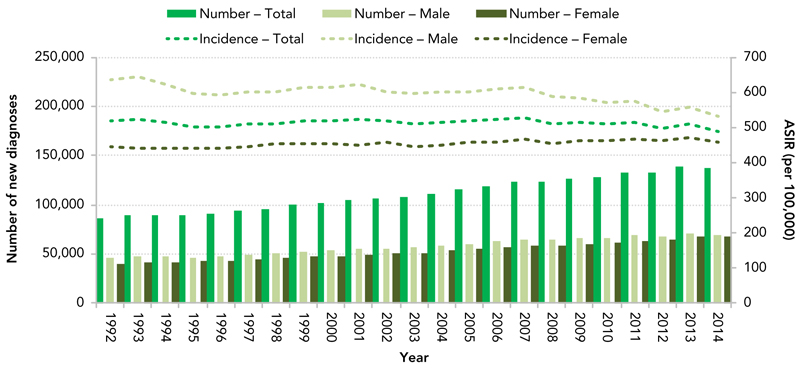
In 2014, approximately 137,000Footnote † Canadians (excluding Quebec) were diagnosed with cancer. Between 1992 and 2014, the number of new cancers diagnosed increased 59%, from 86,000 to 137,000 (Figure 3). However, during the same period of time, the age-standardized incidence rate (ASIR), a measure of cancer risk that removes the effect of age and population size, decreased from 520 per 100,000 to 488 per 100,000 for both sexes combined (Figure 3). In particular, since 2007, the combined ASIR declined by 0.7% per year. Thus, although the number of new cancers diagnosed each year in Canada continues to increase because of the growing and aging population, the risk of developing the disease is declining.
Figure 3: Number of new cancer diagnoses and age-standardized incidence rate (ASIR) of cancer, by sex, Canada (excluding Quebec), 1992–2014
Text Description
| Year | Total | Male | Female | |||
|---|---|---|---|---|---|---|
| Number | Incidence Rate | Number | Incidence Rate | Number | Incidence Rate | |
| 1992 | 86270 | 519.7 | 46195 | 634.6 | 40075 | 444.7 |
| 1993 | 89000 | 525 | 48220 | 645.3 | 40775 | 443 |
| 1994 | 89125 | 513.9 | 47700 | 622.4 | 41425 | 439.2 |
| 1995 | 88790 | 501.4 | 46495 | 595 | 42300 | 439.6 |
| 1996 | 90450 | 499.9 | 47220 | 590.5 | 43230 | 439.1 |
| 1997 | 94170 | 509.4 | 49240 | 602.5 | 44925 | 446.6 |
| 1998 | 96395 | 510.9 | 50005 | 599.2 | 46390 | 452 |
| 1999 | 100200 | 520.8 | 52580 | 616.1 | 47620 | 455 |
| 2000 | 102050 | 519.7 | 53720 | 615 | 48330 | 452.1 |
| 2001 | 105190 | 523.8 | 55920 | 624.2 | 49270 | 451.1 |
| 2002 | 106980 | 518.6 | 55525 | 602.1 | 51460 | 460.1 |
| 2003 | 107680 | 509.3 | 56330 | 595.2 | 51345 | 447.4 |
| 2004 | 111715 | 514.8 | 58570 | 601.4 | 53150 | 451.4 |
| 2005 | 115305 | 518.9 | 60165 | 602.4 | 55140 | 458.4 |
| 2006 | 119030 | 522.3 | 62515 | 608.6 | 56510 | 459 |
| 2007 | 123535 | 528.8 | 65020 | 614.1 | 58515 | 465.1 |
| 2008 | 122870 | 512.5 | 64395 | 590.3 | 58480 | 454.9 |
| 2009 | 126290 | 513.6 | 65510 | 582 | 60780 | 462.7 |
| 2010 | 128175 | 508.2 | 66030 | 570.4 | 62145 | 462.8 |
| 2011 | 132520 | 512.6 | 68635 | 575.5 | 63890 | 466.4 |
| 2012 | 132120 | 497.1 | 67190 | 545.4 | 64925 | 462.8 |
| 2013 | 138990 | 508.3 | 71085 | 559.5 | 67900 | 472.2 |
| 2014 | 137045 | 488.2 | 69555 | 530.1 | 67485 | 459.4 |
Data Source: The Canadian Cancer Registry database at Statistics Canada.
Note: Data from Quebec were not available. Rates are age-standardized to the 2011 Canadian population.
How many Canadians die from cancer each year (mortality)?
In 2013, over 55,000Footnote ‡ Canadians (excluding Quebec) died from cancer. Between 1992 and 2013, the total number of deaths due to cancer increased 38%, from 40,000 to approximately 55,000 (Figure 4). Meanwhile, the age-standardized mortality rate (ASMR) decreased from 247 per 100,000 to 200 per 100,000 or by an average of 1.1% per year for both sexes combined (Figure 4). In particular, since 2003, the combined ASMR declined by 1.5% per year. The steady decline in the ASMR over time shows that the risk of dying from cancer in Canada is decreasing, mostly due to improvements in detection and treatment.
Figure 4: Number of cancer deaths and age-standardized mortality rate (ASMR) of cancer, by sex, Canada (excluding Quebec), 1992–2013.

Text Description
| Year | Total | Male | Female | |||
|---|---|---|---|---|---|---|
| Number | Mortality rate | Number | Mortality rate | Number | Mortality rate | |
| 1992 | 39,881 | 247.5 | 21794 | 317.6 | 18087 | 201.1 |
| 1993 | 40,953 | 247.6 | 22067 | 313.1 | 18886 | 204 |
| 1994 | 41,983 | 248.9 | 22599 | 314.2 | 19384 | 205.5 |
| 1995 | 42,436 | 245.8 | 22902 | 311.7 | 19534 | 201.6 |
| 1996 | 43,256 | 244.6 | 22903 | 304.9 | 20353 | 205.1 |
| 1997 | 42,762 | 236.5 | 22871 | 297.7 | 19891 | 196 |
| 1998 | 44,163 | 238.7 | 23495 | 298.7 | 20668 | 199.2 |
| 1999 | 45,196 | 239.3 | 24051 | 298.7 | 21145 | 199.4 |
| 2000 | 45,977 | 237.9 | 24286 | 294.7 | 21691 | 200.1 |
| 2001 | 46,533 | 235.2 | 24798 | 294.8 | 21735 | 195.6 |
| 2002 | 47,503 | 233.9 | 25017 | 289.2 | 22486 | 197.8 |
| 2003 | 48,567 | 232.8 | 25439 | 285.9 | 23128 | 198 |
| 2004 | 49,038 | 228.7 | 25680 | 280 | 23358 | 194.9 |
| 2005 | 49,357 | 224.4 | 25990 | 276.2 | 23367 | 189.8 |
| 2006 | 49,653 | 219.6 | 26154 | 270.7 | 23499 | 186.2 |
| 2007 | 50,901 | 219.2 | 26776 | 267.4 | 24125 | 186.2 |
| 2008 | 51,478 | 216 | 27124 | 264.2 | 24354 | 183.8 |
| 2009 | 51,992 | 212.4 | 27428 | 258.9 | 24564 | 180.7 |
| 2010 | 52,454 | 208.7 | 27353 | 250.3 | 25101 | 180 |
| 2011 | 53,021 | 205.3 | 27812 | 246.7 | 25209 | 176.5 |
| 2012 | 53,991 | 202.6 | 28415 | 243.4 | 25576 | 174.1 |
| 2013 | 54,947 | 199.7 | 28911 | 238.6 | 26036 | 172.2 |
Data Source: Canadian Vital Statistics – Death Database at Statistics Canada.
Note: Data from Quebec are excluded for consistency with incidence. Rates are age-standardized to the 2011 Canadian population.
Cancer among males and females
Historically, males have been more likely than females to be diagnosed with cancer. The incidence gap between the sexes has, however, begun to narrow as rates among males have been declining while rates among females have been slowly increasing (Figure 3).
Between 1992 and 2014, the incidence rate of cancer in females increased 0.3% per year, from 445 to 459 per 100,000 (Figure 3). The incidence rate of cancer in males was relatively stable between 1992 and 2007, around 600 per 100,000, but then began to decline by 1.8% per year to 530 per 100,000 in 2014 (Figure 3). The decline in cancer incidence in males in the past 10 years is primarily due to declines in the incidence of prostate and lung cancers.
Similar to cancer incidence, the cancer mortality rate is higher in males than females, but the gap is diminishing (Figure 4). Since 1992, the cancer mortality rate has been declining faster in males than females (1.3% vs 0.8% per year, on average, respectively).
Cancer and aging
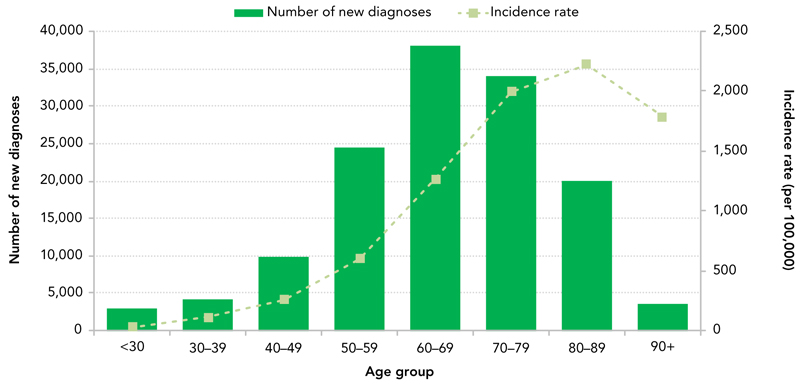
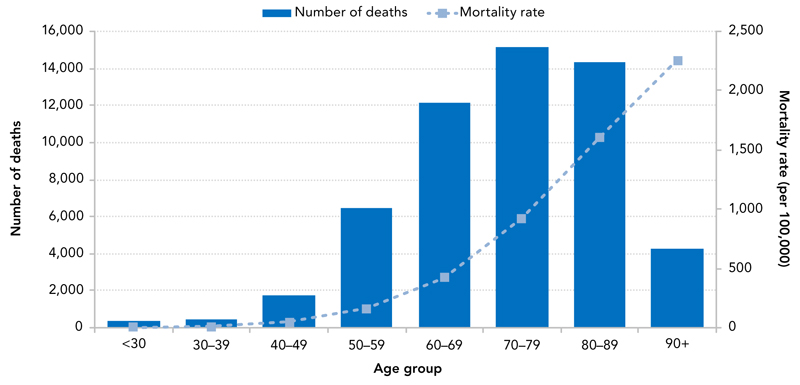
Cancer disproportionately affects older Canadians; approximately 88% of new cancer diagnoses (Figure 5) and 95% of cancer deaths (Figure 6) occur among Canadians over 50 years of age.
The likelihood of being diagnosed with cancer increases with each decade of life, from 29 cases per 100,000 in Canadians less than 30 years of age to more than 2,200 cases per 100,000 among Canadians aged 80 to 89 years (Figure 5). After 90 years of age, the rate of cancer starts to decline.
The likelihood of dying from cancer grows continuously with age (Figure 6). In 2013, the cancer mortality rate among Canadians under 30 years of age was approximately 4 per 100,000 and it was over 2,200 per 100,000 in those 90 years of age and older.
Figure 5: Number of new cancer diagnoses and cancer incidence rates, by age group, Canada (excluding Quebec), 2014
Text Description
| Age Group | Number of new diagnoses | Incidence |
|---|---|---|
| <30 | 2,845 | 29 |
| 30–39 | 4,130 | 111 |
| 40–49 | 9,760 | 259 |
| 50–59 | 24,460 | 602 |
| 60–69 | 38,065 | 1,267 |
| 70–79 | 34,065 | 1,995 |
| 80–89 | 20,090 | 2,227 |
| 90+ | 3,620 | 1,789 |
Data Source: The Canadian Cancer Registry database at Statistics Canada.
Note: Data from Quebec were not available.
Figure 6: Number of cancer deaths and cancer mortality rates, by age group, Canada (excluding Quebec), 2013
Text Description
| Age Group | Number of deaths | Mortality rate (per 100,000) |
|---|---|---|
| <30 | 350 | 4 |
| 30–39 | 455 | 12 |
| 40–49 | 1,775 | 46 |
| 50–59 | 6,435 | 161 |
| 60–69 | 12,180 | 421 |
| 70–79 | 15,155 | 920 |
| 80–89 | 14,300 | 1,611 |
| 90+ | 4,305 | 2,257 |
Data Source: Canadian Vital Statistics – Death Database at Statistics Canada.
Note: Data from Quebec are excluded for consistency with incidence.
Can cancer be prevented?
Cancer is a complex disease with many risk and protective factors influencing its development. Although some factors are not avoidable, such as aging or family history, several can be modified.
Cancer risk can be reduced by:
- being a non-smoker
- maintaining a healthy body weight
- eating a well-balanced diet (e.g., a diet low in red and processed meats, and high in fruits and vegetables)
- staying active/exercising
- reducing alcohol consumption
- getting vaccinated against HPV and Hepatitis B
- avoiding tanning beds and using SUNSENSE
- enhancing air quality (e.g., by ensuring adequate ventilation in homes, removing indoor air pollutants, such as radon, and by heating homes with electricity, natural gas, or a heating oil system)
- learning ways to effectively cope with stress.
This is not an exhaustive list. For more information please visit the Canadian Cancer Society's Prevention and Screening page (www.cancer.ca).
Want to learn more?
Visit Canada.ca and Search "cancer"
Get data Public Health Infobase
Follow us on Twitter @GovCanHealth
Like us on the Healthy Canadians Facebook page
More
References
- Footnote 1
Canadian Cancer Society's Advisory Committee on Cancer Statistics. Canadian Cancer Statistics 2017. Toronto, ON: Canadian Cancer Society; 2017. Available at: www.cancer.ca/en/cancer-information/cancer-101/canadian-cancer-statistics-publication (accessed: 2017 September 19).
- Footnote 2
Statistics Canada. Table 102-0561 - Leading causes of death, total population, by age group and sex, Canada, annual, CANSIM (database). Available at http://www5.statcan.gc.ca/cansim/ a26?lang=eng&id=1020561 (accessed: 2017 September 19).
- Footnote 3
Canadian Cancer Society's Advisory Committee on Cancer Statistics. Canadian Cancer Statistics 2015. Toronto, Ontario. Canadian Cancer Society; 2015. Available at: www.cancer.ca/en/cancer-information/ cancer-101/canadian-cancer-statistics-publication/past-editions- canadian-cancer-statistics/?region=on (accessed: 2017 September 19).
- Footnote 4
Canadian Cancer Society. What is cancer?. Toronto, ON: Canadian Cancer Society; 2017. Available at: www.cancer.ca/en/cancer- information/cancer-101/what-is-cancer/?region=on
- Footnote †
Quebec has not submitted data to the Canadian Cancer registry since 2010; therefore, all estimates (1992 – 2014) exclude cases diagnosed in the province of Quebec.
- Footnote ‡
Data from Quebec were not included for consistency with incidence; therefore all estimates (1992–2013) exclude cancer deaths in Quebec.
Page details
- Date modified: