
Adverse Events Following Immunization (AEFI) Quarter 4 Report for 2015 – Q4
Safety assessment summary for Quarter 4:
- No vaccine safety signals were identified in Quarter 4 (Q4) of 2015.
- This report presents 659 AEFI reports received from provincial or territorial jurisdictions during Q4.
Background
Vaccines are closely monitored in Canada at all phases of the vaccine product ‘life cycle’ from discovery through market authorization (pre-market) and beyond, as people begin using them (post-market). Many stakeholders are involved in various activities related to vaccine safety assessment and monitoring including the federal government, provincial, territorial and local public health authorities, health care providers, vaccine industry and the public. The Public Health Agency of Canada (the Agency) conducts vigilant post-market safety surveillance through a national reporting system, the Canadian Adverse Events Following Immunization Surveillance System (CAEFISS).
An adverse event following immunization (AEFI) is defined as any untoward medical occurrence which follows immunization and which does not necessarily have a causal relationship with the usage of the vaccine. The adverse event may be any unfavourable or unintended sign, abnormal laboratory finding, symptom or disease. Serious AEFIs are those which are life-threatening, result in hospitalization or a prolongation of hospitalization, result in persistent or significant disability, or where the outcome is a birth defect or death. Reports not meeting the serious event's definition are classified as non-serious.
The primary purpose of vaccine post market surveillance is to detect safety concerns. These concerns include a possible increase in the severity or frequency of expected AEFIs, or occurrence of one or more unexpected events (i.e. an event that is not consistent with Canadian product information or labelling). This allows immunization providers and public health immunization program providers to take public health action at the level of the:
- individual (such as further investigations to confirm a diagnosis and determine possible causes, consultation to rule out allergy to one or more vaccine components, or evaluate whether or not to give subsequent doses of a vaccine), and/or
- immunization program (such as investigation of a cluster of adverse events, review of procedures to ensure that vaccine storage requirements have been strictly followed, or consideration of a change in policy to adopt a less reactogenic vaccine).
The Agency also shares AEFI data with Health Canada’s Health Products and Foods Branch, the national regulatory authority for vaccines in Canada. This enables more formal action related to vaccines marketed in Canada to take place if needed. These actions may include issuing communications to immunization providers or the public regarding the safety concern or requiring additional information or investigation by the vaccine distributor, or changes to the product labeling.
Vaccine safety surveillance reports summarizing CAEFISS data are released by the Agency on a routine basis. The Quarterly Reports summarize all AEFI reports received by the Agency from January to March (Quarter 1), April to June (Quarter 2), July to September (Quarter 3) and October to December (Quarter 4), regardless of the date the vaccine was given.
In order to provide a general idea of how the data may vary from year to year, each quarter’s data are shown along with an average of the preceding prior years’ quarterly data (in other words, the data in this quarter, Q4, are shown along with the average Q4 data from the previous 4 years). However, because these data reflect reports received in the particular quarter, and not necessarily when the vaccine was given, they can be subject to wide variations depending on when and how reports are received, processed and forwarded by provincial/territorial public health authorities. Therefore the ability to compare and interpret patterns in these data is limited and the purpose of this report is to provide only a data snapshot.
Notes on interpretation: AEFI reports submitted to the Agency represent a suspicion, opinion or observation by the reporter as opposed to an assertion or proof that the vaccine may have caused the event. Additional limitations to AEFI report data include varied reporting standards and underreporting, lack of certainty regarding the diagnostic validity of a reported event, missing information regarding other potential causes, and other reporting biases.
Results Highlighted for Quarter 4 of 2015
This Quarterly Report (Q4) includes reports received from October 1st to December 31st, 2015 and comparisons are made to the average number of reports received in the same quarter over the previous four calendar years (2011-2014). The reports analysed were extracted from the CAEFISS database on March 7th, 2016 by the Agency.
All reports are coded with a main reason for reporting, meaning that if more than one event is described, the one that led to reporting is coded as the primary AEFI. In addition, all those describing a serious event were reviewed and unless highlighted in this report, found either to be expected (based on known vaccine-related adverse reactions) or to have alternate explanations not related to vaccination.
Number of AEFI and Serious AEFI Reports
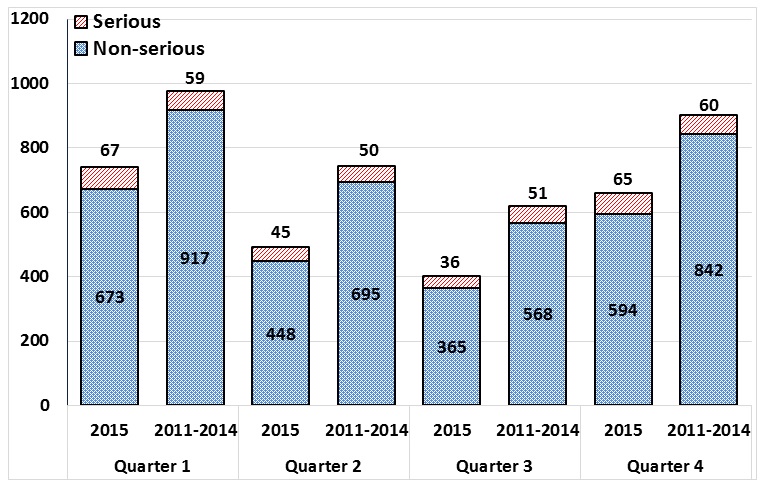
A total of 659 AEFI reports were received by the Agency in Q4 of 2015. During Q4 of 2011, 2012, 2013 and 2014 the Agency received an average of 902 (range: 609-1287) reports [Figure 1].
A total of 65 AEFI reports received by the Agency in Q4 of 2015 were classified as serious (10% of all AEFI reports). During Q4 for 2011, 2012, 2013 and 2014 the Agency received an average of 60 (range: 37-74) serious AEFI reports (6 to 10% of all AEFI reports).
Text Equivalent
This is a stacked columns bar graph. The bars show the total number of AEFI reports received each calendar quarter(Q) with Q1 encompassing January, February and March, Q2 April, May and June, Q3 July, August and September and Q4 October, November and December. The y-axis shows the total count for each quarter, ranging from 0-1200. The x-axis is quarter and ranges from Q1 to Q4. Two time periods are depicted on the graph. The first bars show the total number of reports received in 2015 for Q1, Q2, Q3, and Q4 of 2015 only, for non-serious cases in blue and serious cases in red; non-serious: 673 during Q1, 448 in Q2, 365 in Q3, and 594 in Q4; serious: 67 in Q1, 45 in Q2, 36 in Q3, and 65 in Q4. A second set of bars shows the average number of reports of each quarter from 2011 to 2014, for non-serious cases in blue and serious cases in red: non-serious: 917 in Q1, 695 in Q2, 568 in Q3 and 842 in Q4; serious: 59 in Q1, 50 in Q2, 51 in Q3, and 60 in Q4.
Frequency of Serious and Non-serious AEFI Reports by Age Group
Table 1 - shows the number of serious and non-serious AEFI reports by age group in Q4 of 2015 and comparison with 2011-2014 average.
| Age Group | Serious AEFI reports | Non-serious AEFI reports | ||
|---|---|---|---|---|
| Q4 2015 | Average Q4 2011-2014 | Q4 2015 | Average Q4 2011-2014 | |
| 0 to <1 year | 14 | 17 | 53 | 90 |
| 1 to <2 years | 19 | 16 | 65 | 103 |
| 2 to <7 years | 10 | 8 | 41 | 101 |
| 7 to <18 years | <5 | <5 | 99 | 117 |
| 18 to <65 years | 12 | 9 | 245 | 310 |
| 65+ years | 6 | <5 | 88 | 105 |
| Unknown | <5 | <5 | <5 | 19 |
| Total | 65 | 60 | 594 | 842 |
Fewer non-serious reports were received in Q4 of 2015 compared to 2011-2014 average. This could be explained by a technical issue which prevented one jurisdiction from forwarding their data nationally in 2015. However, the number of serious reports received was similar or higher in Q4 of 2015 compared to 2011-2014, except for infants aged less than one year for whom fewer reports were submitted, but these differences, being small, may be coincidental.
AEFIs by Major Classification
Figure 2 - presents the main types of AEFIs (both serious and non-serious) reported during Q4.
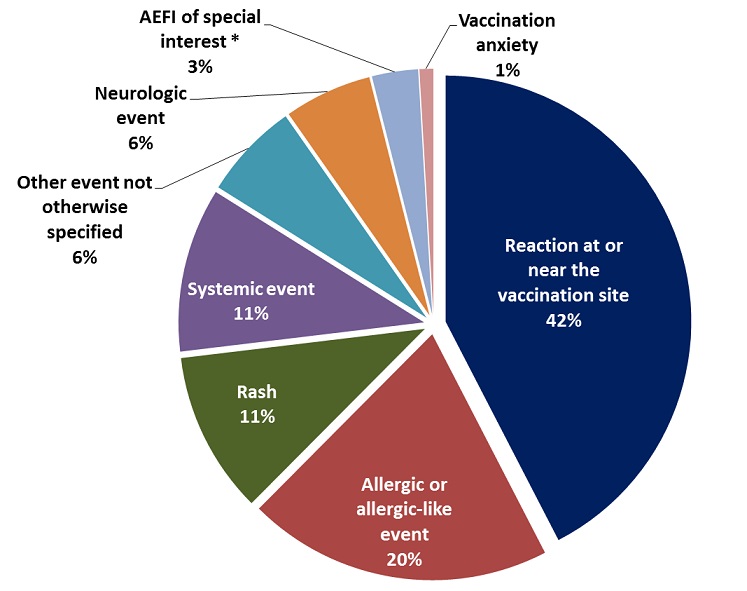
* AEFIs of special interest: arthritis, hypotonic-hyporesponsive episode, intussusception, para/anesthesia, parotitis, persistent crying or thrombocytopenia.
Text Equivalent
This is a pie chart presenting the main reasons for reporting an adverse event following immunization during the Q4 of 2015. In order of decreasing frequency, main reasons for reporting are: reaction at or near the vaccination site (42%), allergic or allergic-like event (20%), rash (11%), systemic event (11%), neurologic event (6%), other event (6%), arthritis, hypotonic-hyporesponsive episode, intussusception, para/anaesthesia, parotidis, persistent crying or thrombocytopenia (3%), and vaccination anxiety (1%).
The main types of AEFI reported by level of seriousness for Q4 of 2015 compared to the 2011-2014 average is shown in Table 2. In Q4 of 2015 as well as in the past 4 years, reactions at or near the vaccination site and allergic or allergic-like events were the main AEFIs reported for non-serious cases and neurologic events (which are most often seizures triggered by fever) followed by systemic events (i.e. events involving many body systems often accompanied by fever), were the most frequent serious AEFIs.
| Primary AEFI event reportedTable Note 1 | Serious AEFI reports | Non-serious AEFI reports | ||
|---|---|---|---|---|
| 2015 | Average 2011-14 | 2015 | Average 2011-14 | |
| Reaction at or near the vaccination site | < 5 | 7 | 276 | 214 |
| Allergic or allergic-like event | 7 | < 5 | 125 | 137 |
| Rash | < 5 | < 5 | 69 | 157 |
| Systemic event | 18 | 13 | 53 | 72 |
| Other eventTable Note 2 | 9 | 10 | 33 | 59 |
| Neurologic event | 23 | 18 | 15 | 22 |
| AEFI of special interestTable Note 3 | < 5 | 8 | 16 | 35 |
| Vaccination anxiety | 0 | 0 | 6 | 13 |
| Vaccination error without an associated AEFI | 0 | 0 | < 5 | 17 |
| Total | 65 | 60 | 594 | 842 |
- Table 2 - Note 1
-
Each AEFI report is assigned a primary AEFI event that is a main reason for reporting
- Table 2 - Note 2
-
Other events include: gastro-intestinal reaction, arthralgia, SIDS/SUDS, vaccination failure, and undefined – other
- Table 2 - Note 3
-
Arthritis, HHE, intussusception, para/anesthesia, parotitis, persistent crying, and thrombocytopenia
Vaccines administered in AEFI Reports
Table 3 lists the most commonly administered vaccines among AEFI reports received for Q4 of 2015. Most reports for serious AEFIs followed pneumococcal vaccine administration, which is consistent with the average of the previous four years. Similarly, influenza was the most frequently reported vaccine among non-serious AEFIs, consistent with the 4-year historical average for Q4. The measles, mumps, and rubella vaccine, with or without varicella, was also frequently reported, both for serious and non-serious AEFIs.
| Vaccines administered | Serious AEFI reports | Non-serious AEFI reports | ||
|---|---|---|---|---|
| 2015 | Average 2011-2014 | 2015 | Average 2011-2014 | |
| 1. DTaP booster | 1 | 2 | 7 | 25 |
| 2. DTaP infant series | 18 | 20 | 70 | 116 |
| 3. Hepatitis B | 2 | 4 | 45 | 48 |
| 4. Human papillomavirus (HPV) | 1 | 3 | 34 | 43 |
| 5. Influenza | 22 | 17 | 227 | 353 |
| 6. Measles, mumps, rubella, varicella(MMRV and MMR + V) | 22 | 18 | 99 | 163 |
| 7. Meningococcal | 18 | 17 | 83 | 104 |
| 8. Other vaccines | 0 | 0 | 11 | 24 |
| 9. Pneumococcal | 29 | 25 | 145 | 190 |
| 10. Rotavirus | 9 | 8 | 26 | 29 |
| 11. Tdap booster | 4 | 1 | 77 | 17 |
| 12. Travel vaccines | 0 | 2 | 31 | 51 |
| 13. Zoster virus | 0 | 1 | 28 | 19 |
| Total | 126 | 118 | 883 | 1,240 |
Summary
This Q4 report for 2015 is based on reports of adverse events received at the Agency from provincial/territorial public health authorities and active, pediatric hospital-based surveillance. Detailed evaluation of the reports and reporting patterns in collaboration with provincial/territorial vaccine safety focal points of the Vaccine Vigilance Working Group (VVWG) and Health Canada have not identified any vaccine safety signals of concern. The tables and figures in this report provide a snapshot of the data reviewed and provide an overview of adverse event reporting in Canada.
Page details
- Date modified: