
Benefits of immunization: Canadian Immunization Guide
For health professionals
Updated: August 2016
On this page
- Benefits of Immunization
- Impact of Vaccines on Vaccine Preventable Diseases
- Table 1: incidence of select vaccine preventable diseases in Canada - pre-vaccine era compared with 2007-2011
- Figure 1: Haemophilus influenzae type b disease - reported number of cases and incidence rates, Canada, 1979-2010
- Figure 2: Diphtheria - reported number of cases and incidence rates, Canada, 1924-2008
- Figure 3: Rubella - reported number of cases and incidence rates, Canada, 1979 to 2010
- Cost Benefit of Vaccines
- Selected References
Benefits of immunization
Immunization is one of the most important accomplishments in public health that has, over the past 50 years, led to the elimination, containment and control of diseases that were once very common in Canada. Before vaccines became available, many Canadian children were hospitalized or died from diseases such as diphtheria, pertussis, measles and polio. Today, although these disease causing bacteria and viruses still exist, such diseases are rarely seen in Canada. However, if the current vaccination programs were reduced or stopped, diseases controlled through immunization would re-appear in Canada. This phenomenon has been observed in other countries where large epidemics occurred following a decline in immunization rates, resulting in many preventable hospitalizations and deaths.
Immunization is important in all stages of life. Infants and young children are particularly susceptible to vaccine preventable diseases because their immune systems are less mature and therefore less able to fight infection; as a result, they require timely immunization. Older children and adults also require immunization to restore waning immunity and to build new immunity against diseases that are more common in adults.
Immunization directly protects individuals who receive vaccines. Through community (or herd)immunity, immunization against many diseases also prevents the spread of infection in the community and indirectly protects:
- newborns who have not yet received all of their vaccines
- people who cannot be vaccinated for medical reasons, such as people who had an organ transplant or are undergoing treatment for cancer or other illnesses
- people who may not adequately respond to immunization such as the elderly.
Impact of vaccines on vaccine preventable diseases
Table 1, Figure 1, Figure 2, and Figure 3 illustrate the impact of vaccines on infectious diseases in Canada. Refer to the vaccine-specific chapters in Part 4 for additional information about the success of immunization programs against specific vaccine preventable diseases.
| Disease and impact | Vaccine introduction and disease reporting | Pre-vaccine era | 2007-2011Table 1 - Footnote 1 | |||
|---|---|---|---|---|---|---|
| Pre-vaccine period | 5-year average annual incidence per 100,000 | Peak annual number of casesTable 1 - Footnote 2 | 5-year average annual incidence per 100,000 | Peak annual number of cases | ||
Diphtheria Infection of the throat causes severe breathing difficulty which may result in asphyxia. Infection also results in the dissemination of diphtheria toxin, which damages the heart and central nervous system. In the pre-vaccine era case fatality was about 5% to 10%, with the highest death rates occurring in the very young and the elderly. |
|
1925-1929 | 84.2 | 9,010 | 0.006 | 4 |
Haemophilus influenzae type b (Hib) invasive disease (in children less than 5 years of age,this infection can cause otitis media, meningitis, epiglottitis, bacteremia, cellulitis, pneumonia or septic arthritis in young children. The case fatality rate of meningitis is about 5%. Severe neurologic sequelae occur in 10% to 15% of survivors and deafness in 15% to 20% |
|
1986-1990 | 30.1Table 1 - Footnote 3 | 671 | 0.49Table 1 - Footnote 3 | 18 |
Hepatitis B (HB) Infection in approximately 3 to 10% of adults results in chronic infection leading to a chronic carrier state that may result in cirrhosis, liver cancer, and death. |
|
1989-1993 | 9.1Table 1 - Footnote 4 | 3,378Table 1 - Footnote 5 | 5.3Table 1 - Footnote 6 | 2,011Table 1 - Footnote 7 |
Measles Bronchopneumonia and otitis media occur in about 1/10 cases and encephalitis occurs in 1/1,000 cases (the infection is fatal in 15% and neurologic sequelae in 25%). Case fatality rate is 1 to 2 per 1,000. Subacute sclerosing panencephalitis is a rare but fatal complication. |
|
1950-1954 | 372.7 | 61,370 | 0.60Table 1 - Footnote 8 | 752Table 1 - Footnote 8 |
Meningococcal serogroup C invasive disease Invasive meningococcal disease most often results in meningitis or septicemia. Severe cases can result in delirium and coma and, if untreated, shock and death. The case fatality rate is 10%, and 10% to 20% of survivors have long term sequelae such as digit or limb amputations, neurologic disabilities, and deafness. |
|
1997-2001 | 0.30 | 186 | 0.06 | 30 |
Mumps Acute parotitis develops in 40%, of which 25% are unilateral. Complications include orchitis (20% to 30% of post-pubertal males), oophoritis (5% of post-pubertal females), meningitis (less than 10% of cases), deafness (0.5 to 5/100,000 cases) and encephalitis (less than 1/50,000 cases). Rarely, mumps can cause permanent infertility. |
|
1950-1954 | 251.2 | 43,671 | 1.84 | 1,110 |
Pertussis Young infantsare most affected by complications, such as vomiting after a coughing spell, weight loss, breathing problems, choking spells, pneumonia, convulsions, encephalopathy, and, death. Older children and adults may develop persistent cough. |
|
1938-1942 | 156.0 | 19,878 | 3.88 | 1,961 |
Poliomyelitis Paralysis occurs in less than 1% of infections but among those paralyzed, about 2% to 5% of children and 15% to 30% of adults die. |
|
1950-1954 | 17.5 | 5,384 | 0 | 0 |
Rubella and congenital rubella syndrome (CRS) Although rubella is generally a mild disease, encephalitis occurs in 1/6,000 cases. However, rubella infection in pregnancy can cause (CRS). Infection in the first 10 weeks of pregnancy has an 85% risk of leading to CRS. CRS can result in miscarriage, stillbirth and fetal malformations (congenital heart disease, cataracts, deafness and intellectual disability). |
|
|
|
|
|
|
Tetanus Infection leads to general rigidity, and convulsive spasms, with death in about 10% of cases. Higher rates of death occur among infants. |
|
1935-1939 | 0.13 | 25 | 0.01 | 6 |
|
Abbreviations: |
||||||
Figure 1: Haemophilus influenzae type b disease - reported number of casesFootnote 1 and incidence rates, Canada, 1979-2010Footnote 2

Abbreviations:
Hib = Haemophilus influenzae type b
PRP-D = Hib conjugate vaccine containing purified polyribosylribitol phosphate capsular polysaccharide of Hib covalently bound to diphtheria protein.
Haemophilus influenzae type b disease - reported number of casesFootnote 1 and incidence rates, Canada, 1979-2010Footnote 2 - Text Equivalent
Figure 2: Diphtheria - reported number of cases and incidence rates, Canada, 1924-2008

Figure 2: Diphtheria - reported number of cases and incidence rates, Canada, 1924-2008 - Text Equivalent
Figure 3: Rubella - reported number of cases and incidence rates, Canada, 1979 to 2010
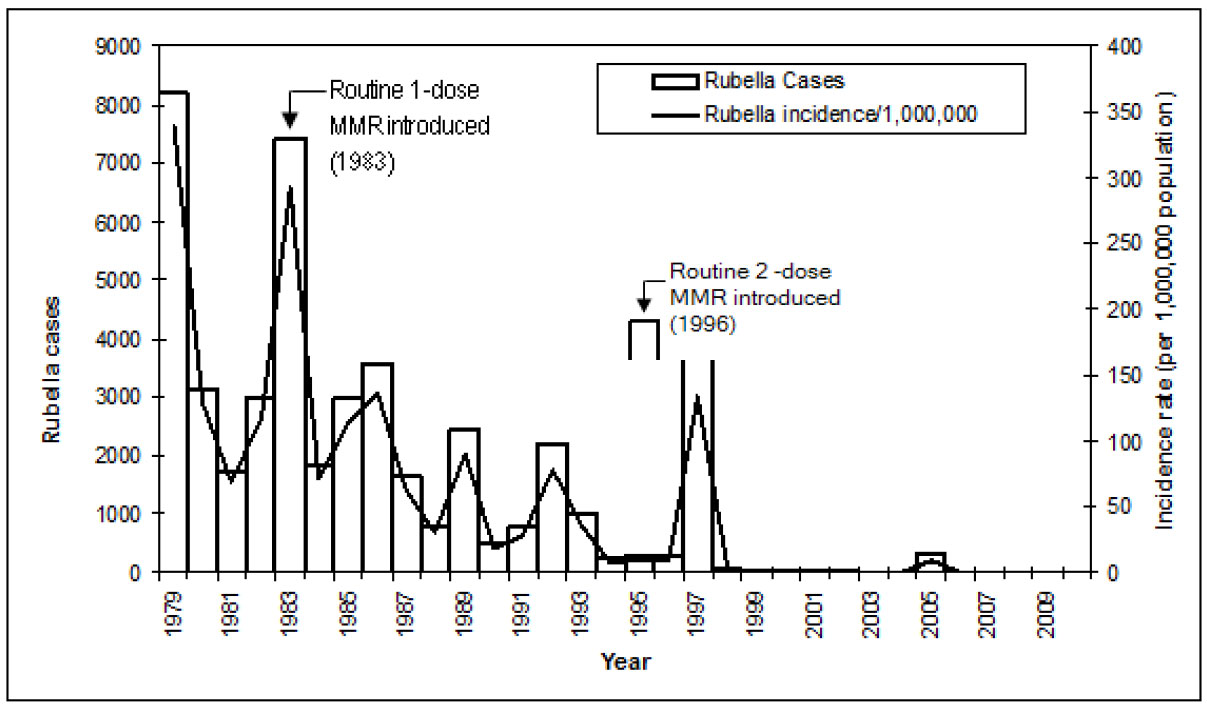
Abbreviation:
MMR = measles-mumps-rubella vaccine
Figure 3: Reported number of cases and incidence rates of rubella in Canada, 1979 to 2010 - Text Equivalent
Cost benefit of vaccines
Vaccine preventable diseases result in significant costs to individuals, the health care system, and society, including costs associated with absenteeism from work or school, visits to health care providers, hospitalizations, and premature deaths. In addition to being one of the most beneficial, immunization is also one of the most cost effective public health interventions.
Many vaccines provide savings in health care costs (refer to Table 2). This means that the cost of implementing the immunization program is less than the cost of treating the illness that would occur if the program was not implemented. Because immunization with these vaccines maintains health and results in cost savings, the decision to include these vaccines in publicly funded immunization programs is straightforward. Other vaccines, particularly those administered through routine immunization programs, are highly cost effective. This means that these vaccines are less costly than the health care or societal cost savings they produce.
| Immunization program | Cost saving per $1 spent |
|---|---|
| Influenza for adults 65 years of age and older | $45 |
| Measles, mumps, rubella for children | $16 |
| Pneumococcal polysaccharide for adults 65 years of age and older | $8 |
| Diphtheria, pertussis, tetanus for children | $6 |
While newer vaccines tend to be costlier and may not be cost saving, they compare very favorably to other public health interventions in terms of cost per life year saved (refer to Table 3). In Canada, evaluation of the benefits and costs of new immunization programs is done by Provinces and Territories. Refer to Immunization in Canada in Part 1 for additional information about immunization policy and program development.
| Public health intervention | Cost per life year savedTable 3 - Footnote 1 |
|---|---|
| Vaccines | |
| Hepatitis B screening in pregnancy and immunization of children of carriers | $164 |
| Human papillomavirus vaccine for 12 year old girls in a school-based immunization program | $12,921 |
| Varicella vaccine for children | $16,000 |
| Pneumococcal conjugate vaccine for children | $125,000 |
| Other interventions | |
| Mandatory seat belt law | $69 |
| Chlorination of drinking water | $3,100 |
| Smoking cessation counseling | $1,000 to $10,000 |
| Annual screening for cervical cancer | $40,000 |
| Driver and passenger air bags/manual lap belts (vs. airbag for driver only and belts) | $61,000 |
| Smoke detectors in homes | $210,000 |
| Crossing control arm for school buses | $410,000 |
| Radiation emission standard for nuclear power plants | $100,000,000 |
Selected references
- Centers for Disease Control and Prevention. An ounce of prevention - what are the returns? Second edition, 1999. Accessed July 2015 at: http://www.cdc.gov/mmwr/PDF/other/ozprev.pdf
- Centers for Disease Control and Prevention. Basics and Common Questions: How Vaccines Prevent Disease. Accessed July 2015 at: ttp://www.cdc.gov/vaccines/parents/vaccine-decision/prevent-diseases.html
- Centers for Disease Control and Prevention. Basics and Common Questions: What Would Happen If We Stopped Vaccinations? Accessed July 2015 at: http://www.cdc.gov/vaccines/vac-gen/whatifstop.htm
- Centers for Disease Control and Prevention. Basics and Common Questions: Why Immunize? Accessed July 2015 at: http://www.cdc.gov/vaccines/vac-gen/why.htm
- Centers for Disease Control and Prevention. Vaccine Contraindications and Precautions: Recommendations and Guidelines. Accessed July 2015 at: http://www.cdc.gov/vaccines/recs/vac-admin/contraindications.htm
- Coyle D, Coyle K, Bettinger JA et al. Cost effectiveness of infant vaccination for rotavirus in Canada. Can J Infect Dis Med Microbiol 2012;23(2):71-77.
- Ess SM, Szucs TD. Economic evaluation of immunization strategies. Clin Infect Dis 2002;35:294-7.
- Schiefele, David W. The Impact of Vaccines in Canada: More Than a Century of Success. Accessed July 2015 at: http://www.onehealth.ca/r_alberta_nwt/video_conferences/R080312B-HOa.pdf
- Tengs, TO, Adams ME, Pliskin JS et al. Five hundred live-saving interventions and their cost-effectiveness. Risk Anal 1995;15:369-90.
- Tully S, Anonychuk A, Sanchez D et al. Time for change? An economic evaluation of integrated cervical screening and HPV immunization programs in Canada. Vaccine 2012;30:425-35.
- World Health Organization, United Nations Children's Fund, World Bank. State of the World's Vaccines and Immunization. Geneva, Switzerland: World Health Organization; 2009;3rd edition. Accessed July 2015 at http://whqlibdoc.who.int/publications/2009/9789241563864_eng.pdf
Page details
- Date modified: