
Invasive bacterial diseases in northern Canada

 Download this article as a PDF
 Published by: The Public Health Agency of Canada
Issue: Volume 47 No. 11, November 2021: Multisystem Inflammatory Syndrome in Children
Date published: November 2021
ISSN: 1481-8531
Submit a manuscript
About CCDR
Browse
Volume 47 No. 11, November 2021: Multisystem Inflammatory Syndrome in Children
Surveillance
Invasive bacterial diseases in northern Canada, 1999 to 2018
Grace Huang1, Irene Martin2, Raymond S Tsang2, Walter H Demczuk2, Gregory J Tyrrell3, Y Anita Li1, Catherine Dickson1, Francesca Reyes-Domingo1, Susan G Squires1
Affiliations
1 Infectious Disease Programs Branch, Public Health Agency of Canada, Ottawa, ON
2 National Microbiology Laboratory, Public Health Agency of Canada, Winnipeg, MB
3 Department of Laboratory Medicine and Pathology, University of Alberta, Edmonton, AB
Correspondence
Suggested citation
Huang G, Martin I, Tsang RS, Demczuk WH, Tyrrell GJ, Li YA, Dickson C, Reyes-Domingo F, Squires SG. Invasive bacterial diseases in northern Canada, 1999 to 2018. Can Commun Dis Rep 2021;47(11):491–99. https://doi.org/10.14745/ccdr.v47i11a09
Keywords: Indigenous health, surveillance, Haemophilus influenzae, streptococcus, meningococcal disease, pneumococcal disease, vaccine, epidemiology
Abstract
Background: The International Circumpolar Surveillance (ICS) program conducts surveillance on five invasive bacterial diseases: pneumococcal disease (IPD), group A streptococcus (iGAS), Haemophilus influenzae (Hi), meningococcal disease (IMD) and group B streptococcus (GBS). Invasive bacterial diseases have a higher burden of disease in northern populations than the rest of Canada.
Methods: To describe the epidemiology of invasive bacterial diseases in northern Canada from 1999 to 2018, data for IPD, iGAS, Hi, IMD and GBS were extracted from the ICS program and the Canadian Notifiable Diseases Surveillance System (CNDSS) and analyzed.
Results: The annualized incidence rates for IPD, iGAS, Hi, GBS and IMD were 23.3, 10.5, 8.9, 1.9 and 1.1 per 100,000 population, respectively. The incidence of IPD, iGAS and Hi serotype b were 2.8, 3.2 and 8.8 times higher, respectively, in northern Canada than in the rest of Canada. Rates of disease decreased statistically significantly for IPD (β=−0.02) and increased statistically for iGAS (β=0.08) and Hi serotype a (β=0.04) during the study period. In Northern Canada, the annualized incidence rates for IPD, iGAS and Hi were statistically higher for Indigenous residents than for non-Indigenous residents. The highest incidence rates were among the very young and older age groups.
Conclusion: Invasive bacterial diseases represent a high burden of disease in Canada's northern populations. Indigenous peoples, children and seniors are particularly at risk.
Introduction
The International Circumpolar Surveillance (ICS) program is a population-based invasive bacterial disease surveillance network of countries with circumpolar regionsFootnote 1. The ICS program conducts surveillance on invasive bacterial diseases caused by Streptococcus pneumoniae (invasive pneumococcal disease, IPD), Haemophilus influenzae (invasive Haemophilus influenzae, Hi), Streptococcus pyogenes (invasive group A streptococcus, iGAS), Neisseria meningitidis (invasive meningococcal disease, IMD) and Streptococcus agalactiae (invasive group B streptococcus, GBS). Disease rates caused by these pathogens are elevated among the Indigenous peoples in countries with Arctic regionsFootnote 2Footnote 3Footnote 4Footnote 5Footnote 6Footnote 7.
The ICS program started monitoring IPD in Canada in 1999 and expanded to monitoring the other four diseases in 2000. Six Canadian regions participate in the ICS program: Nunavut, the Northwest Territories, Yukon, northern Labrador and two northern Québec regions, Nunavik and Cree Territory. The ICS program also includes two reference laboratories, the National Microbiology Laboratory (NML) and the Laboratoire de santé publique du Québec (LSPQ), and a network of regional laboratories located across Canada that serves the northern regions. Up until 2009, the National Centre for Streptococcus (NCS) participated in the ICS program as a reference laboratory.
In 2018, the Canadian ICS population was estimated to be 168,090, accounting for 0.45% of the total national intercensal population of 37 million. While Indigenous people account for 4.9% of the total Canadian population, they represent approximately 60% of the northern Canadian populationFootnote 8.
The National Advisory Committee on Immunization (NACI) provides national vaccine recommendations for IPD, HI and IMD; however, adoption of these recommendations are the responsibility of the provincial and territorial jurisdictions. The H. influenzae serotype b (Hib) vaccine, the meningococcal C conjugate (MenC) vaccine for infants and the Men-C-ACYW vaccine for early adolescents have been part of routine childhood immunization programs since 1997, 2007 and 2011, respectivelyFootnote 9. As part of the routine childhood immunization schedule, all six northern regions implemented the 7-valent pneumococcal conjugate vaccine (PCV7) for children younger than two years of age between 2002 and 2007, replacing PCV7 with the 10-valent pneumococcal conjugate vaccine (PCV10) by 2010Footnote 10 and subsequently with the 13-valent pneumococcal conjugate vaccine (PCV13) by 2011 (according to a survey sent to ICS invasive bacterial diseases working group members). In mid-2018, Cree Territory and Nunavik switched to a four-dose PCV10 and PCV13 (3+1) vaccination schedule (personal communication, ICS invasive bacterial diseases working group members, 2019). NACI recommends that the 23-valent pneumococcal polysaccharide vaccine (PPV23) be given to those aged two years or older with high risk of IPD, and adults 65 years and olderFootnote 11. High-risk children and adults include those with certain chronic diseases, immunocompromising conditions or functional or anatomic aspleniaFootnote 11. The Canadian Immunization Guide recommendations for PPV23 have been implemented in all six regions, with minor differences in the age of vaccine administration in some regionsFootnote 11Footnote 12Footnote 13Footnote 14Footnote 15Footnote 16Footnote 17.
The objective of this report is to describe the epidemiology of invasive bacterial diseases in northern Canada over the first 20 years of the ICS program (1999–2018) and compare their incidence rates to the rest of Canada. This report includes ICS data that have been previously published (1999–2013)Footnote 5Footnote 7. These data were included in this paper to provide a comprehensive analysis of invasive bacterial diseases over the first 20 years of the ICS program.
Methods
Epidemiological data
Data were extracted from the ICS program (1999–2018) and the Canadian Notifiable Diseases Surveillance System (CNDSS, 2000–2018). CNDSS data from before 2000 were not available. CNDSS data for invasive Hi non-serotype b were not included as only certain provinces and territories have reported these for certain years. CNDSS data for GBS were also not included because only GBS of newborns are nationally reported whereas ICS conducts surveillance on all GBS cases. Cases meeting the national case definition were included Footnote 18. Because there is no national case definition for general population GBS, the ICS case definition extends the national case definition for GBS of the newborn to individuals of all ages in northern Canada. Data include non-nominal demographic information, clinical information, severity, outcomes, underlying conditions and immunization history.
Laboratory data
S. pneumoniae isolates were serotyped using the Quellung reaction with pool, group, type and factor commercial antisera (Statens Serum Institut, Copenhagen, Denmark)Footnote 19. S. pyogenes isolates were identified using β-hemolysis on sheep blood agar, bacitracin susceptibility and pyrrolidonyl arylamidase test. M serotyping of invasive S. pyogenes isolates from 1999 to September 2006 was performed using a serological typing protocol described by Tyrrell et al.Footnote 20. From October 2006 to 2018, molecular emm typing of invasive S. pyogenes isolates was performed using polymerase chain reaction (PCR) tests and DNA sequencing according to the Centers for Disease Control and Prevention (CDC) protocol; the CDC invasive S. pyogenes emm sequence database was searched for designation of emm type using the basic local alignment search tool (BLAST)Footnote 21Footnote 22. S. agalactiae isolates were serotyped by latex agglutination (SSI Diagnostica; Statens Serum Institute, Copenhagen, Denmark) as described by Slotved et al.Footnote 23. H. influenzae was identified using Gram stain morphology and standard biochemical testsFootnote 24. The bacterial slide agglutination test, using commercial antisera (Difco, Becton Dickinson, Mississauga, Ontario), was used for serotyping, with results confirmed using PCRFootnote 25. N. meningitidis was identified by standard biochemical tests with serogrouping determined by a bacterial agglutination tests using in-house-produced antisera against the 12 different serogroupsFootnote 26.
Phenotypic antimicrobial susceptibilities for the Canadian isolates were determined using Sensititre STP6F micro-broth dilution panels (Thermo Fisher, United States). Resistant, intermediate or susceptible interpretations of minimum inhibitory concentration for erythromycin, clindamycin, penicillin, cefepime, cefotaxime, ceftriaxone, meropenem, trimethoprim/sulfamethoxazole and tetracycline were determined using Clinical Laboratory Standards Institute guidelinesFootnote 27.
Population data
Population estimates were based on the final postcensal estimates for July 1, 2016Footnote 8. The Indigenous populations for northern Canada were estimated using the 1996, 2001, 2006, 2011 and 2016 CensusFootnote 8Footnote 28Footnote 29Footnote 30Footnote 31. The proportion of the Indigenous population for a given census year was used to estimate the Indigenous population for the years until the next census.
Analysis
The direct method was used to calculate age-standardized rates by multiplying the age-specific rates by the 2011 general Canadian population weightsFootnote 32. Confidence intervals (95% CIs) of age-standardized rates were calculated using the method based on the gamma distributionFootnote 33. Two-tailed Fisher's exact and chi-square tests were used to compare proportions. Poisson and negative binomial regression were used to estimate disease trends. The exact Poisson test was used to compare rates. Statistical significance was set at p<0.05.
Analyses were conducted using Excel 2016 (Microsoft Corp., Redmond, Washington, United States), SAS Enterprise Guide 7.1 (SAS Institute Inc., Cary, North Carolina, United States) and R version 3.6.2 (R Foundation for Statistical Computing, Vienna, Austria).
Incidence rates for neonatal GBS cases were not calculated because annual live birth estimates for the northern regions were not available for this report. Age-standardized rates by sex for IMD and GBS were not calculated due to small numbers. GBS is not reportable in the province of Québec, and therefore Cree Territory and Nunavik are not included in the analyses.
Results
Overview
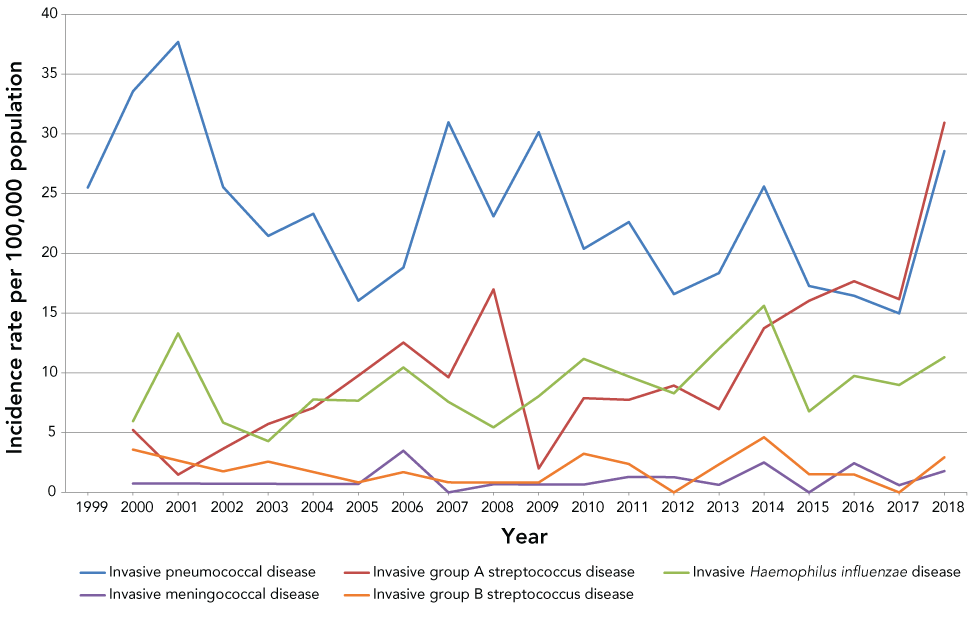
From 1999 to 2018, a total of 692 cases of IPD were reported in northern Canada. From 2000 to 2018, a total of 311 cases of iGAS, 258 cases of Hi, 44 cases of GBS and 31 cases of IMD were reported in the same region. Demographic information for each disease is presented in Table 1, and the overall incidence for each disease from 1999 to 2018 is presented in Figure 1.
| Disease | N | Crude incidence rate per 100,000 population | Median age, years |
Age range | Annualized incidence rate per 100,000 population by ethnicity | Hospitalization | FatalityTable 1 footnote a | ||||||||
|---|---|---|---|---|---|---|---|---|---|---|---|---|---|---|---|
| Cases | Incidence rate ratio | Fatality rate ratio | |||||||||||||
| Indigenous ethnicity | Non-Indigenous ethnicity | Difference between ethnicities, p-value | N | % | Male:female | p-value | N | % | Male:female | p-value | |||||
| IPD | 692 | 23.3 | 37 | 0-98 | 31.3 | 7.0 | <0.0001Table 1 footnote b | 585 | 84.5 | 1.3 | 0.006Table 1 footnote b | 59 | 8.5 | 1.3 | 0.3 |
| iGAS | 311 | 10.5 | 50 | 0-98 | 14.8 | 2.7 | <0.0001Table 1 footnote b | 273 | 87.8 | 1.3 | 0.03Table 1 footnote b | 30 | 9.6 | 1.2 | 0.6 |
| Hi | 258 | 8.9 | 1 | 0-93 | 13.1 | 0.9 | <0.0001Table 1 footnote b | 222 | 86.0 | 1.1 | 0.5 | 19 | 7.4 | 1.6 | 0.3 |
| GBS | 44 | 1.9 | 32.5 | 0-88 | 1.8 | 1.3 | 0.3 | 41 | 93.2 | 0.9 | 0.7 | 0 | 0 | -Table 1 footnote c | |
| IMD | 31 | 1.1 | 1 | 0-56 | 1.4 | 0.6 | 0.06 | 28 | 90.3 | 0.7 | 0.4 | 4 | 12.9 | All male | 0.06 |
Figure 1: Overall crude incidence rates of invasive bacterial diseases in the ICS regions by disease and year, 1999–2018
Text description: Figure 1
Year |
Disease specific crude incidence rate | ||||
|---|---|---|---|---|---|
| Invasive pneumococcal disease | Invasive group A streptococcus disease | Invasive Haemophilus influenzae disease | Invasive meningococcal disease | Invasive group B streptococcus disease | |
| 1999 | 25.50599 | 0 | 0 | 0 | 0 |
| 2000 | 33.56856 | 5.221776 | 5.967744 | 0.745968 | 3.584904 |
| 2001 | 37.69708 | 1.478317 | 13.30485 | 0.739158 | 2.665766 |
| 2002 | 25.54595 | 3.649422 | 5.839075 | 0.729884 | 1.755603 |
| 2003 | 21.46537 | 5.724098 | 4.293074 | 0.715512 | 2.581378 |
| 2004 | 23.31167 | 7.064142 | 7.770557 | 0.706414 | 1.702215 |
| 2005 | 16.04554 | 9.766851 | 7.673955 | 0.697632 | 0.842623 |
| 2006 | 18.81258 | 12.54172 | 10.45143 | 3.483811 | 1.692319 |
| 2007 | 30.96806 | 9.634508 | 7.569971 | 0 | 0.838666 |
| 2008 | 23.10662 | 16.99016 | 5.436851 | 0.679606 | 0.830482 |
| 2009 | 30.15479 | 2.01032 | 8.041279 | 0.670107 | 0.821025 |
| 2010 | 20.38173 | 7.889702 | 11.17708 | 0.657475 | 3.228931 |
| 2011 | 22.61464 | 7.753591 | 9.691989 | 1.292265 | 2.380348 |
| 2012 | 16.59762 | 8.937178 | 8.298808 | 1.27674 | 0 |
| 2013 | 18.35896 | 6.963744 | 12.02829 | 0.633068 | 2.336321 |
| 2014 | 25.59828 | 13.73566 | 15.60871 | 2.497393 | 4.606349 |
| 2015 | 17.26892 | 16.03543 | 6.784219 | 0 | 1.517658 |
| 2016 | 16.45098 | 17.66957 | 9.748727 | 2.437182 | 1.498778 |
| 2017 | 14.97598 | 16.17406 | 8.985587 | 0.599039 | 0 |
| 2018 | 28.55613 | 30.93581 | 11.30347 | 1.784758 | 2.931283 |
Invasive pneumococcal disease
The regression analyses found a significant overall downward trend in IPD incidence rate (per 100,000 population) over time (β=−0.02; p=0.01), but there was a sharp 92% increase in the number of cases reported from 2017 to 2018. The age-standardized incidence rates for males (28.26; CI: 25.30–31.53) and females (23.86; CI: 20.77–27.36) did not differ significantly. The incidence rate (per 100,000 population) was highest among infants younger than one year old (146.78; CI: 117.59–183.23), children one to four years old (49.80; CI: 41.13–60.29) and adults 60 years and older (51.07; CI: 43.22–60.32). The difference in the average annual incidence rates between those of Indigenous and non-Indigenous origin was significant in northern regions (Table 1). The age-standardized incidence rate of IPD in northern regions was 2.8 times higher than the rest of Canada (Table 2).
| Disease | Age-standardized incidence rates | |||
|---|---|---|---|---|
| Northern regions | Rest of Canada | |||
| 95% | CI | 95% | CI | |
| IPDTable 2 footnote b | 25.68 | 23.45–28.09Table 2 footnote c | 9.13 | 9.05–9.21Table 2 footnote c |
| iGAS | 14.16 | 12.31–15.86Table 2 footnote c | 4.45 | 4.40–4.50Table 2 footnote c |
| HibTable 2 footnote d | 0.70 | 0.45–1.13Table 2 footnote c | 0.08 | 0.08–0.09Table 2 footnote c |
| IMD | 0.75 | 0.51–1.17 | 0.52 | 0.51–0.54 |
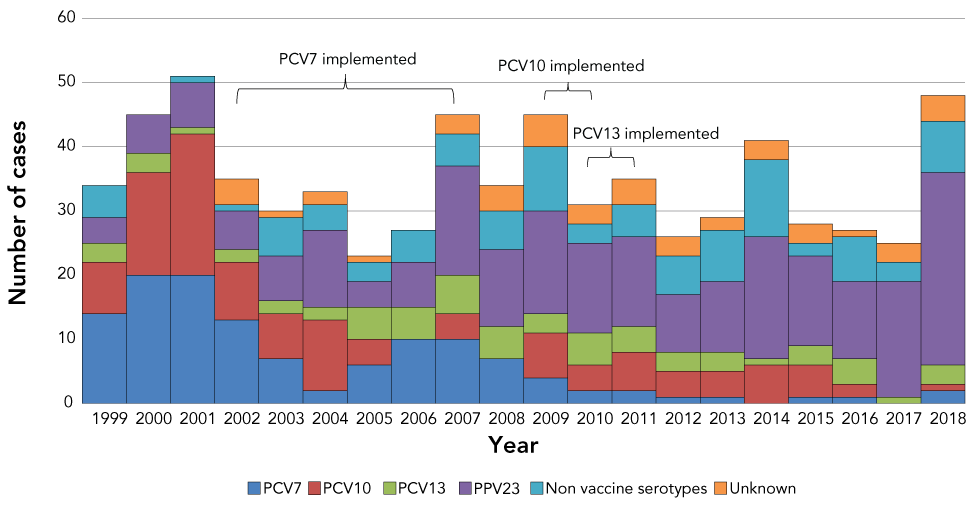
PCV7 serotypes (β=−0.19; p<0.0001) and PCV10-specific serotypes (β=−0.01; p<0.0001) have decreased significantly from 1999 to 2018 (Figure 2). PPV23-specific serotypes (β=0.06; p<0.0001) and non-vaccine serotypes have increased significantly from 1999 to 2018 (β=0.04; p<0.05). There were no statistically significant changes to the PCV13-specific serotypes from 1999 to 2018. Of the cases with available serotype data collected between 1999 and 2010, the most common were serotype 1 (18%), 8 (11%) and 14 (7%). After 2010, the most common serotypes were 7F (12%), 22F (9%), 10A (9%) and 9N (8%).
Figure 2: Distribution of invasive pneumococcal disease serotypes in northern Canada, by year and by vaccine serotypeFootnote a, 1999–2018
Text description: Figure 2
| Year | Number of cases | |||||
|---|---|---|---|---|---|---|
| PCV7 | PCV10 | PCV13 | PPV23 | Non vaccine serotypes | Unknown | |
| 1999 | 14 | 8 | 3 | 4 | 5 | 0 |
| 2000 | 20 | 16 | 3 | 6 | 0 | 0 |
| 2001 | 20 | 22 | 1 | 7 | 1 | 0 |
| 2002 | 13 | 9 | 2 | 6 | 1 | 4 |
| 2003 | 7 | 7 | 2 | 7 | 6 | 1 |
| 2004 | 2 | 11 | 2 | 12 | 4 | 2 |
| 2005 | 6 | 4 | 5 | 4 | 3 | 1 |
| 2006 | 10 | 0 | 5 | 7 | 5 | 0 |
| 2007 | 10 | 4 | 6 | 17 | 5 | 3 |
| 2008 | 7 | 0 | 5 | 12 | 6 | 4 |
| 2009 | 4 | 7 | 3 | 16 | 10 | 5 |
| 2010 | 2 | 4 | 5 | 14 | 3 | 3 |
| 2011 | 2 | 6 | 4 | 14 | 5 | 4 |
| 2012 | 1 | 4 | 3 | 9 | 6 | 3 |
| 2013 | 1 | 4 | 3 | 11 | 8 | 2 |
| 2014 | 0 | 6 | 1 | 19 | 12 | 3 |
| 2015 | 1 | 5 | 3 | 14 | 2 | 3 |
| 2016 | 1 | 2 | 4 | 12 | 7 | 1 |
| 2017 | 0 | 0 | 1 | 18 | 3 | 3 |
| 2018 | 2 | 1 | 3 | 30 | 8 | 4 |
All ICS regions had implemented the PCV13 vaccine schedule by January 1, 2011. Thirty-four cases that occurred after PCV13 implementation were age-appropriately vaccinated with at least one dose and serotyped. Individuals were age-appropriately vaccinated based on the minimum three-dose national recommendation. Of these 34 cases, three cases (9%) had vaccine-breakthrough disease. Breakthrough disease occurs if the serotype of the case is any of the serotypes covered by the vaccine administered. Two of these cases were serotype 19A and one was serotype 3. Of the 55 PPV23-vaccinated and serotyped cases, 46 cases (84%) had vaccine-breakthrough disease.
Of the 670 cases with information on clinical manifestation, bacteremia (n=577; 86.1%) and pneumonia (n=442; 66.0%) were the most commonly reported manifestations. Of the 692 IPD cases, 585 (85%) were hospitalized.
Of the 649 cases with information on fatality, 59 were fatal (9.1%).The majority of the fatal cases were 60 years and older (n=24; 41%), followed by those aged 40 to 59 years (n=20; 34%). Individuals in these two age groups had significantly higher risk of fatality than those in younger age groups (case fatality ratio [CFR] =14.2% vs. 4.4%; p<0.0001). The CFR did not vary between Indigenous and non-Indigenous people (9.5% vs. 6.1%; p=0.31). Of the 53 fatal cases with serotype information, 45% were PPV23-specific serotypes not covered by PCV13. The top six reported serotypes were 20, 10A, 15C, 22F, 15A and 3.
When fatality and hospitalization rates were compared for males and females, hospitalization was significantly higher for males (Table 1).
Antimicrobial susceptibility was examined for the IPD isolates with available data (Table 3).
| Antibiotic | Proportion of susceptible IPD isolates, % | Proportion of susceptible iGAS isolates, % |
|---|---|---|
| Ampicillin | 100 | 100 |
| Cefotaxime | 100 | 100 |
| Ceftriaxone | 98.3 | 100 |
| Cefuroxime | 100 | N/A |
| Chloramphenicol | 99.8 | 98.1 |
| Clindamycin | 97.3 | 90.0 |
| Erythromycin | 92.4 | 81.4 |
| Levofloxacin | 99.8 | 98.9 |
| Ofloxacin | 99.4 | 100 |
| Oxacillin | 97.6 | 100 |
| Penicillin | 96.1 | 100 |
| Rifampin | 100 | 100 |
| Tetracycline | 93.3 | 100 |
| Sulfamethoxazole/Trimethoprim | 92.9 | 76.2 |
| Vancomycin | 100 | 100 |
Invasive group A streptococcal disease
The incidence rate (β=0.08; p<0.0001) of iGAS (per 100,000 population) increased significantly from 2000 to 2018. The age-standardized incidence rates for males (16.07; CI: 13.65–18.84) and females (11.83; CI: 9.58–14.52) did not differ significantly. The incidence rate (per 100,000 population) was highest for infants younger than one year old (51.25; CI: 34.90–75.27) and adults 60 years and older (36.64; CI: 30.00–44.75). The difference in the average annual incidence rates between those of Indigenous and non-Indigenous origin was significant in northern regions (Table 1). The age-standardized incidence rate of iGAS in northern regions was 3.2 times higher than the rest of Canada (Table 2).
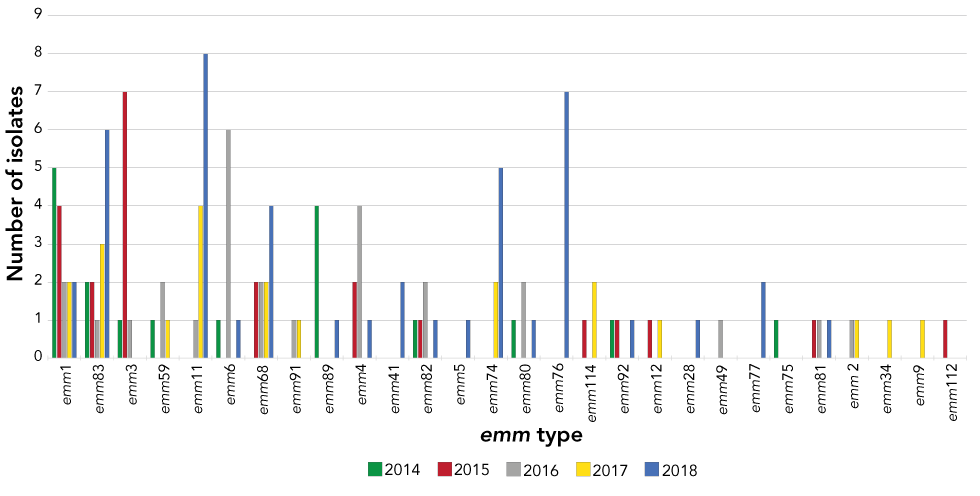
Of the 311 iGAS cases, 249 were serotyped. The most common emm types were emm1 with 28 cases (11.2%), emm83 with 17 cases (6.8%), emm3 with 15 cases (6.0%) and emm11 and emm59 with 14 cases each (5.6%) (Figure 3). The predominant emm type varied across the years, and while emm1 was circulating most years, it was not always the most common strain in a given year. The most common strain in 2017 and 2018 was emm11.
Figure 3: Distribution of iGAS cases by emm type in northern Canada, 2014–2018
Text description: Figure 3
| Number of isolates by emm type | Number of cases | ||||
|---|---|---|---|---|---|
| 2014 | 2015 | 2016 | 2017 | 2018 | |
| emm1 | 5 | 4 | 2 | 2 | 2 |
| emm83 | 2 | 2 | 1 | 3 | 6 |
| emm3 | 1 | 7 | 1 | 0 | 0 |
| emm59 | 1 | 0 | 2 | 1 | 0 |
| emm11 | 0 | 0 | 1 | 4 | 8 |
| emm6 | 1 | 0 | 6 | 0 | 1 |
| emm68 | 0 | 2 | 2 | 2 | 4 |
| emm91 | 0 | 2 | 2 | 2 | 4 |
| emm89 | 4 | 0 | 0 | 0 | 1 |
| emm4 | 0 | 2 | 4 | 0 | 1 |
| emm41 | 0 | 0 | 0 | 0 | 2 |
| emm82 | 1 | 1 | 2 | 0 | 1 |
| emm5 | 0 | 0 | 0 | 0 | 1 |
| emm74 | 0 | 0 | 0 | 2 | 5 |
| emm80 | 1 | 0 | 2 | 0 | 1 |
| emm76 | 0 | 0 | 0 | 0 | 7 |
| emm114 | 0 | 1 | 0 | 2 | 0 |
| emm92 | 1 | 1 | 0 | 0 | 1 |
| emm12 | 0 | 1 | 0 | 1 | 0 |
| emm28 | 0 | 0 | 0 | 0 | 1 |
| emm49 | 0 | 0 | 1 | 0 | 0 |
| emm77 | 0 | 0 | 0 | 0 | 2 |
| emm75 | 1 | 0 | 0 | 0 | 0 |
| emm81 | 0 | 1 | 1 | 0 | 1 |
| emm2 | 0 | 0 | 1 | 1 | 0 |
| emm34 | 0 | 0 | 0 | 1 | 0 |
| emm9 | 0 | 0 | 0 | 1 | 0 |
| emm112 | 0 | 1 | 0 | 0 | 0 |
Of the 307 cases with information on clinical manifestation, bacteremia (n=196; 63.8%) and cellulitis (n=96; 31.3%) were the most commonly reported manifestations, and 273 (88.9%) cases were hospitalized. Of the 296 cases with outcome information, 30 deaths (CFR: 10%) were reported. When fatality and hospitalization rates were compared for males and females, hospitalization was significantly higher for males (Table 1). The emm types with the highest fatality ratios were emm87 (50.0%) and emm2 (50.0%), followed by emm3 (33.3%) and emm75 (33.3%).
Antimicrobial susceptibility was examined for the iGAS isolates with available data (Table 3).
Invasive Haemophilus influenzae disease
There was no significant change in the (β=0.02; p=0.06) incidence rate of Hi (per 100,000 population) from 2000 to 2018. The age-standardized incidence rates for males (7.84; CI: 6.44–9.54) and females (6.85; CI: 5.44–8.63) did not differ significantly. The incidence rate (per 100,000 population) was highest among infants younger than one year old (195.15; CI: 160.29–237.59), children one to four years old (39.90; CI: 23.05–49.67) and adults 60 years and older (9.54; CI: 6.45–14.12). The difference in the average annual incidence rates between those of Indigenous and non-Indigenous origin was significant in northern regions (Table 1).
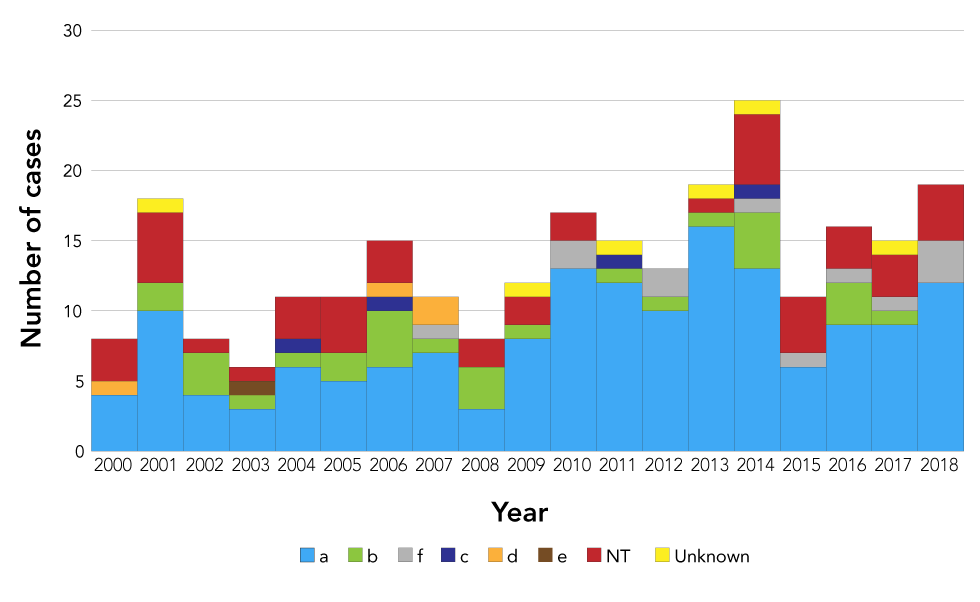
Hi serotype a (Hia) accounted for 60.5% of cases (n=156), non-typeable strains accounted for 17.8% (n=46), Hib accounted for 11.2% (n=29), serotype f accounted for 4.7% (n=12), serotype c and d accounted for 1.6% each (n=4), serotype e accounted for 0.4% (n=1) and 2.7% (n=6) had unknown serotype (Figure 4). Rates of Hia increased significantly from 2000 to 2018 (β=0.04; p=0.01), and 69.2% (n=108) of Hia cases were in children up to two years old. The age-standardized incidence rate of Hib in northern regions was 8.8 times higher than the rest of Canada (Table 2).
Figure 4: Distribution of invasive Haemophilus influenzae serotypes in northern Canada by year, 2000–2018
Text description: Figure 4
| Year | Number of cases by serotype | |||||||
|---|---|---|---|---|---|---|---|---|
| a | NT | b | f | c | d | e | Unknown | |
| 2000 | 4 | 3 | 0 | 0 | 0 | 1 | 0 | 0 |
| 2001 | 10 | 5 | 2 | 0 | 0 | 0 | 0 | 1 |
| 2002 | 4 | 1 | 3 | 0 | 0 | 0 | 0 | 0 |
| 2003 | 3 | 1 | 1 | 0 | 0 | 0 | 1 | 0 |
| 2004 | 6 | 3 | 1 | 0 | 1 | 0 | 0 | 0 |
| 2005 | 5 | 4 | 2 | 0 | 0 | 0 | 0 | 0 |
| 2006 | 6 | 3 | 4 | 0 | 1 | 1 | 0 | 0 |
| 2007 | 7 | 0 | 1 | 1 | 0 | 2 | 0 | 0 |
| 2008 | 3 | 2 | 3 | 0 | 0 | 0 | 0 | 0 |
| 2009 | 8 | 2 | 1 | 0 | 0 | 0 | 0 | 1 |
| 2010 | 13 | 2 | 0 | 2 | 0 | 0 | 0 | 0 |
| 2011 | 12 | 0 | 1 | 0 | 1 | 0 | 0 | 1 |
| 2012 | 10 | 0 | 1 | 2 | 0 | 0 | 0 | 0 |
| 2013 | 16 | 1 | 1 | 0 | 0 | 0 | 0 | 1 |
| 2014 | 13 | 5 | 4 | 1 | 1 | 0 | 0 | 1 |
| 2015 | 6 | 4 | 0 | 1 | 0 | 0 | 0 | 0 |
| 2016 | 9 | 3 | 3 | 1 | 0 | 0 | 0 | 0 |
| 2017 | 9 | 3 | 1 | 1 | 0 | 0 | 0 | 1 |
| 2018 | 12 | 4 | 0 | 3 | 0 | 0 | 0 | 0 |
| Grand total | 155 | 46 | 29 | 12 | 4 | 4 | 1 | 7 |
There were no significant changes in Hib rates from 2000 to 2018 (β=−0.01; p=0.7). Of the 29 Hib cases, three were adults and 26 children aged three years and younger. Of the 29 Hib cases, 14 (48%) were age-appropriately vaccinated, 10 (35%) were either unvaccinated or not up-to-date with their vaccinations, three (10%) were age ineligible for vaccination and two (7%) had unknown vaccine history.
Of the 246 cases with information on clinical manifestation, bacteremia (n=201; 81.7%) and pneumonia (n=87; 35.4%) were the most commonly reported manifestations. Of the 258 cases of Hi, 222 (86.0%) were hospitalized. Of the 226 cases with outcome information, 19 deaths (8.4%) were reported. Of these 19 cases, 11 were serotype a, five were non-typeable, two were serotype f and one was serotype b.
No significant difference was observed in the hospitalization and fatality rates of males and females (Table 1).
Invasive meningococcal disease
There was no significant change in the incidence rate of IMD (per 100,000 population) from 2000 to 2018 (β=0.03; p=0.3). The incidence rate (per 100,000 population) was the highest for infants younger than one year old (29.57; CI: 17.83–49.04) and children one to four years old (3.99; CI: 2.00–7.98).
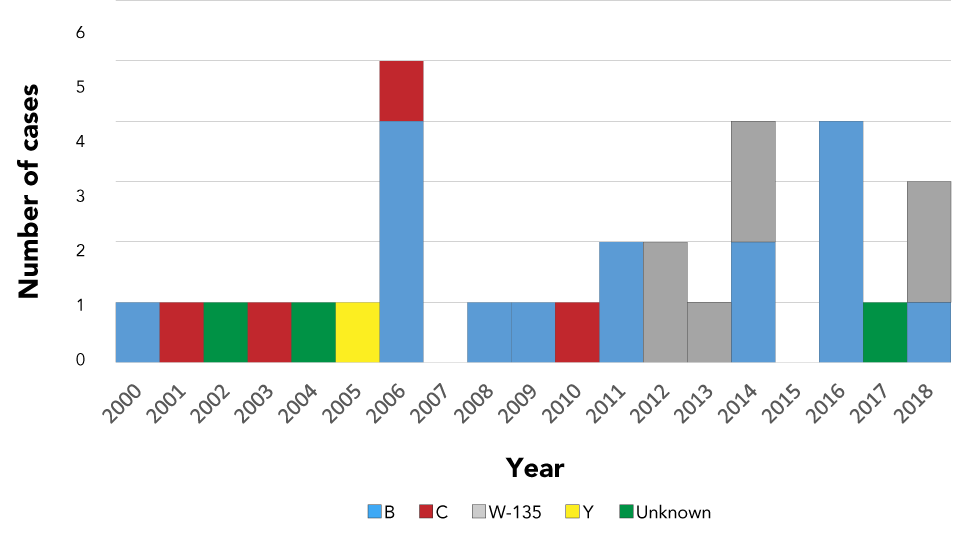
Of the 31 cases of IMD, 16 cases (52%) were serogroup B, seven (23%) were serogroup W, four (13%) were serogroup C, one (3%) was serogroup Y and three (10%) were of unknown serogroup (Figure 5). The seven serogroup W cases all occurred between 2012 to 2018, constituting 47% of all IMD cases during that period. No serogroup W cases were reported prior to 2012.
Figure 5: Distribution of invasive meningococcal disease cases, by year and serogroup, northern Canada, 2000–2018
Text description: Figure 5
| Year | Number of cases by serogroup | ||||
|---|---|---|---|---|---|
| B | C | W-135 | Y | Unknown | |
| 2000 | 1 | 0 | 0 | 0 | 0 |
| 2001 | 0 | 1 | 0 | 0 | 0 |
| 2002 | 0 | 0 | 0 | 0 | 1 |
| 2003 | 0 | 1 | 0 | 0 | 0 |
| 2004 | 0 | 0 | 0 | 0 | 1 |
| 2005 | 0 | 0 | 0 | 1 | 0 |
| 2006 | 4 | 1 | 0 | 0 | 0 |
| 2008 | 1 | 0 | 0 | 0 | 0 |
| 2009 | 1 | 0 | 0 | 0 | 0 |
| 2010 | 0 | 1 | 0 | 0 | 0 |
| 2011 | 0 | 0 | 0 | 0 | 0 |
| 2012 | 0 | 0 | 2 | 0 | 0 |
| 2013 | 0 | 0 | 1 | 0 | 0 |
| 2014 | 2 | 0 | 2 | 0 | 0 |
| 2016 | 4 | 0 | 0 | 0 | 0 |
| 2017 | 0 | 0 | 0 | 0 | 1 |
| 2018 | 1 | 0 | 2 | 0 | 0 |
The median age of the serogroup B cases was younger than one year, with a range of 0–30 years; the median age of the serogroup W cases was younger than one year, with a range of 0–28 years; and the median age of the serogroup C cases was 29.5 years, with a range of 0–56 years.
The difference in the average annual incidence rates between those of Indigenous and non-Indigenous origin was not significant (Table 1). Of the 30 cases with information on clinical manifestation, meningitis (n=21; 70%) and bacteremia (n=13; 43%) were most commonly reported and 90% were hospitalized. Of the 30 cases with fatality information, four deaths (CFR: 13%) were reported.
No significant difference was observed in the hospitalization and fatality rates of males and females (Table 1).
Invasive group B streptococcal disease
There was no significant change in the incidence rate of GBS from 2000 to 2018 (β=−0.01; p=0.6). The incidence rate (per 100,000 population) was highest for infants younger than one year (46.16; CI: 29.09–73.26) and adults 60 years and older (3.97; CI: 2.07–7.64). The difference in the average annual incidence rates between those of Indigenous and non-Indigenous origin was not significant (Table 1).
Of the 44 GBS cases, 16 cases (36%) were neonatal and 28 cases (64%) were non-neonatal. Of the 16 neonatal cases, 10 were early onset disease, five were late onset disease and one was unknown. Of the seven neonatal cases with serotype information, four cases were serotype III and the remaining three were serotype Ia, Ib and V. Of the 15 neonatal cases with information on clinical manifestation, bacteremia (n=10) and meningitis (n=6) were most commonly reported.
Of the 28 non-neonatal cases, the median age was 55.5 years (range 0–88 years). Of the 25 non-neonatal cases with serotype information, 6 (24%) were serotypes III and V each, three (12%) were serotypes Ia, Ib and VI each, two (8%) were serotype IV, and one was serotype II and one serotype VI (4% each). Of the 27 non-neonatal cases with information on clinical manifestation, bacteremia (n=21; 78%), septic arthritis (n=6, 22%) and cellulitis (n=5, 19%) were most commonly reported. Of all the non-neonatal cases, 93% were hospitalized; no deaths were reported.
No significant difference was observed in the hospitalization and fatality rates between males and females (Table 1).
Discussion
In this report, we describe the epidemiology of invasive bacterial diseases in northern Canada from 1999 to 2018 and compared the incidence rates there to those in the rest of Canada. The rates of most of the invasive disease remained stable over time with the exception of IPD, which trended down, and iGAS, which trended up over time. The incidence of IPD, iGAS and Hib were 2.8, 3.2 and 8.8 times higher, respectively, in northern Canada than in the rest of the country. The average annual incidence rates for IPD, iGAS and Hi in northern Canada were significantly higher for those who identified as Indigenous than those of non-Indigenous origin. The highest incidence rates were among the very young and older people.
Similar to the Alaskan ICS population (personal communication, T. Zulz, Jan 19, 2021), in northern Canada, IPD presented the highest burden of disease and accounted for over half of the total reported cases during the study period. The incidence of iGAS in northern regions has been increasing, a trend that has also been observed nationally, where the incidence rate has increased three-fold from 2000 to 2018Footnote 34, with outbreaks in the community, military bases and in sheltersFootnote 35Footnote 36Footnote 37Footnote 38. Hia accounted for over 60% of cases and has been increasing significantly over the years. There is also a high prevalence of Hia in the Alaskan population (personal communication, T. Zulz, Jan 19, 2021). According to data collected from the US Active Bacterial Core surveillance sites, between 2002–2008 and 2009–2015, the prevalence of Hia disease increased by 13% annually with an overall increase of 148%Footnote 39.
The burden of disease for IMD and GBS is much lower than the other three diseases, and IMD and GBS rates did not significantly change during the study period. The results also indicate that there was no statistical difference between the age-standardized incidence rates of IMD for the rest of Canada and northern Canada.
The rates of IPD have significantly decreased over the years due to a significant decrease in PCV7 and PCV10-specific vaccine serotypes, indicating that the conjugate vaccine programs have been successful at reducing the circulation of the serotypes these vaccines protect against. There were no significant decreases of PCV13-specific serotypes over the years. Further study is required to monitor the impact of the PCV13 vaccine versus the PCV10 vaccine, especially following the recent switch from the PCV13 vaccine schedule to a mixed PCV10 and PCV13 vaccine schedule in the Québec regions.
Non-vaccine serotypes have significantly increased following the introduction of the conjugate vaccine programs. PPV23-specific serotypes have also increased and the high percentage of breakthrough disease indicates that the PPV23 vaccine is not as effective at preventing disease in the 65-year-and-older ICS population compared to the conjugate vaccines in the younger ICS population.
Rates of Hib have not significantly changed in northern Canada during this study period. No IMD serogroup C cases have been reported since 2010 and this may be due to the implementation of the Men-C-C vaccine in routine childhood vaccine programs by the mid-2000sFootnote 40. Within the last seven years, serogroup B and W have been reported exclusively and the highest burden has been in infants younger than one year.
Strengths and limitations
The ICS program is an important source of epidemiological and laboratory-linked information. It is the only enhanced invasive bacterial disease surveillance system that provides information on ethnicity in Canada, which means that it can be used to monitor the epidemiology of invasive bacterial diseases among the Indigenous peoples of northern Canada.
ICS is a passive surveillance system and some cases may be missed. In some communities, antibiotics may have been started prior to the collection of cultures. Results are unstable due to the small number of cases and small population sizes; therefore, caution should be used when interpreting the results. Because of incomplete reporting of clinical manifestation, vaccine history and underlying conditions and risk factors, these results may be under or overestimated. In addition, not all cases had further serotyping done.
Conclusion
The burden of invasive bacterial diseases is higher in the northern ICS population than the rest of Canada, especially in the Indigenous population. We have limited health information for the large Indigenous population in northern Canada, but existing health disparities need to be monitored and addressed. Ongoing surveillance is needed to continue monitoring disease trends, support prevention and control strategies, and inform immunization recommendations.
Authors' statement
- GH — Methodology, software, formal analysis, investigation, data curation, writing-original draft, writing–review and editing, visualization
- IM — Methodology, formal analysis, writing–original draft, writing–review and editing
- RST — Methodology, formal analysis, writing–original draft, writing–review and editing
- WHD — Methodology, formal analysis, writing–original draft, writing–review and editing
- GJT — Methodology, formal analysis, writing–original draft, writing–review and editing
- YAL — Methodology, formal analysis, writing–review, editing and project administration
- CD — Conceptualization, writing–review and editing
- FR-D — Methodology and writing–review and editing
- SGS — Conceptualization, methodology, writing–review and editing, project administration
Competing interests
None.
Acknowledgements
We would like to thank all members of the Canadian International Circumpolar Surveillance Invasive Bacterial Diseases Working Group for their invaluable contribution to the International Circumpolar Surveillance.
Funding
Canada's participation in the International Circumpolar surveillance was paid for by the Public Health Agency of Canada.

Page details
- Date modified: