
Microbeads in toiletries: method 445.0 : chapter 3
Appendix 3. Infrared radiation spectra of common plastics
Figure 1. Nylon infrared radiation (IR) spectrum

Long description for figure 1
Figure 1 is a graphic indicating the infrared radiation spectrum for nylon. The peaks are indicated in the data table below.
| Peak number |
X axis (cm-1) |
Y axis (% T) |
|---|---|---|
| 1 | 3299.31 | 61.06 |
| 2 | 3074.67 | 90.95 |
| 3 | 2933.15 | 67.80 |
| 4 | 2859.71 | 76.96 |
| 5 | 1632.23 | 26.15 |
| 6 | 1533.78 | 30.15 |
| 7 | 1473.85 | 64.01 |
| 8 | 1464.01 | 62.48 |
| 9 | 1416.91 | 63.71 |
| 10 |
1371.08 | 67.83 |
| 11 | 1273.35 | 61.08 |
| 12 | 1198.89 | 63.02 |
| 13 | 1139.29 | 78.41 |
| 14 | 934.78 | 78.78 |
| 15 | 685.39 | 54.97 |
| 16 | 578.35 | 55.85 |
| 17 | 533.14 | 70.76 |
Figure 2. Polycarbonate (PC) IR spectrum
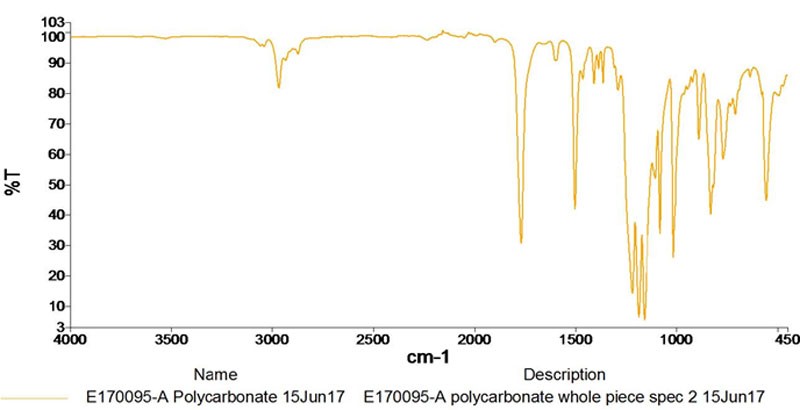
Long description for figure 2
Figure 2 is a graphic indicating the infrared radiation spectrum for polycarbonate. The peaks are indicated in the data table below.
| Peak number | X axis (cm-1) | Y axis (%T) |
|---|---|---|
| 1 | 3041.43 | 95.65 |
| 2 | 2968.78 | 82.09 |
| 3 | 1769.77 | 30.73 |
| 4 | 1601.92 | 91.01 |
| 5 | 1503.95 | 42.09 |
| 6 | 1464.95 | 84.98 |
| 7 | 1409.38 | 83.48 |
| 8 | 1386.85 | 88.35 |
| 9 | 1364.65 | 83.68 |
| 10 | 1290.82 | 81.31 |
| 11 | 1218.82 | 14.26 |
| 12 | 1186.98 | 6.47 |
| 13 | 1158.99 | 5.54 |
| 14 | 1102.98 | 52.29 |
| 15 | 1080.02 | 33.99 |
| 16 | 1013.83 | 26.06 |
| 17 | 918.92 | 83.91 |
| 18 | 887.20 | 65.18 |
| 19 | 828.69 | 40.29 |
| 20 | 767.54 | 58.67 |
| 21 | 706.81 | 73.38 |
| 22 | 633.72 | 85.76 |
| 23 | 554.04 | 44.88 |
Figure 3. Polyethylene (PE, HDPE) IR spectrum

Long description for figure 3
Figure 3 is a graphic indicating the infrared radiation spectrum for polyethylene. The peaks are indicated in the data table below.
| Peak number | X axis (cm-1) | Y axis (%T) |
|---|---|---|
| 1 | 2915.24 | 37.01 |
| 2 | 2847.97 | 40.01 |
| 3 | 1472.73 | 73.89 |
| 4 | 1462.54 | 72.16 |
| 5 | 730.25 | 75.74 |
Figure 4. Poly(methylmethacrylate) (PMMA) IR spectrum
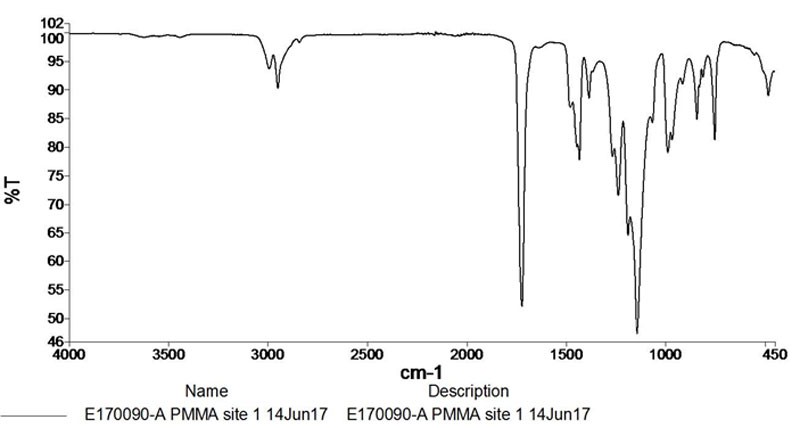
Long description for figure 4
Figure 4 is a graphic indicating the infrared radiation spectrum for poly(methylmethacrylate). The peaks are indicated in the data table below.
| Peak number | X axis (cm-1) | Y axis (%T) |
|---|---|---|
| 1 | 2994.40 | 93.81 |
| 2 | 2950.96 | 90.39 |
| 3 | 1723.65 | 52.07 |
| 4 | 1435.04 | 77.90 |
| 5 | 1386.49 | 88.66 |
| 6 | 1239.11 | 71.59 |
| 7 | 1190.30 | 64.57 |
| 8 | 1143.20 | 47.27 |
| 9 | 986.93 | 79.18 |
| 10 | 840.58 | 84.95 |
| 11 | 750.70 | 81.42 |
| 12 | 481.39 | 89.08 |
Figure 5. Polypropylene (PP) IR spectrum
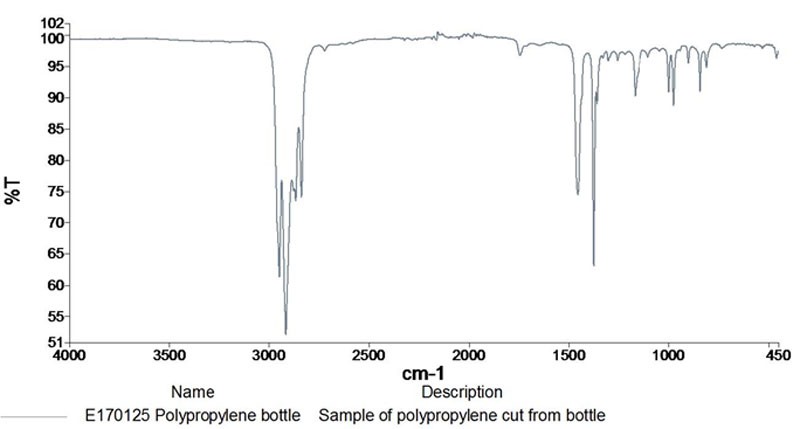
Long description for figure 5
Figure 5 is a graphic indicating the infrared radiation spectrum for polypropylene. The peaks are indicated in the data table below.
| Peak number | X axis (cm-1) | Y axis (%T) |
|---|---|---|
| 1 | 3059.92 | 92.37 |
| 2 | 3025.47 | 87.26 |
| 3 | 2921.26 | 85.03 |
| 4 | 2849.39 | 91.42 |
| 5 | 1601.02 | 87.08 |
| 6 | 1492.61 | 73.62 |
| 7 | 1451.76 | 73.08 |
| 8 | 1371.31 | 91.5 |
| 9 | 1181.08 | 91.79 |
| 10 | 1154.39 | 91.6 |
| 11 | 1068.57 | 89.89 |
| 12 | 1027.82 | 84.48 |
| 13 | 906.19 | 88.72 |
| 14 | 841.50 | 93.75 |
Figure 6. Polystyrene (PS) IR spectrum
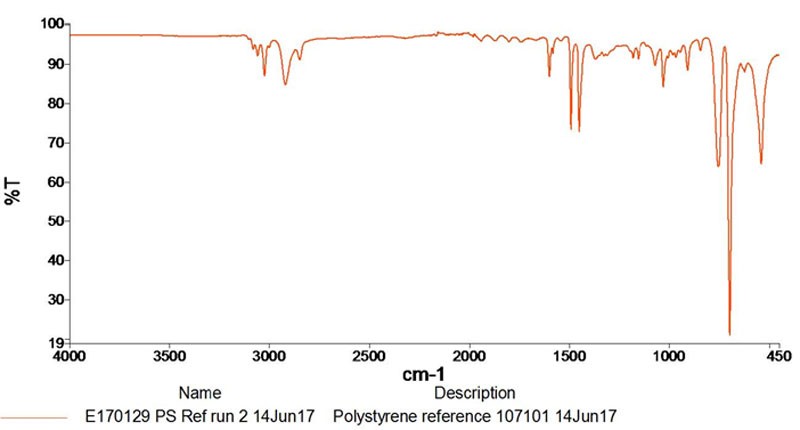
Long description for figure 6
Figure 6 is a graphic indicating the infrared radiation spectrum for polystyrene. The peaks are indicated in the data table below.
| Peak number | X axis (cm-1) | Y axis (%T) |
|---|---|---|
| 1 | 3059.92 | 92.37 |
| 2 | 3025.47 | 87.26 |
| 3 | 2921.26 | 85.03 |
| 4 | 2849.39 | 91.42 |
| 5 | 1601.02 | 87.08 |
| 6 | 1492.61 | 73.62 |
| 7 | 1451.76 | 73.08 |
| 8 | 1371.31 | 91.5 |
| 9 | 1181.08 | 91.79 |
| 10 | 1154.39 | 91.6 |
| 11 | 1068.57 | 89.89 |
| 12 | 1027.82 | 84.48 |
| 13 | 906.19 | 88.72 |
| 14 | 841.50 | 93.75 |
| 15 | 753.97 | 64.13 |
| 16 | 695.05 | 20.85 |
| 17 | 620.81 | 88.32 |
| 18 | 537.8 | 64.88 |
Figure 7. Polytetrafluoroethylene (Teflon) (PTFE) IR spectrum
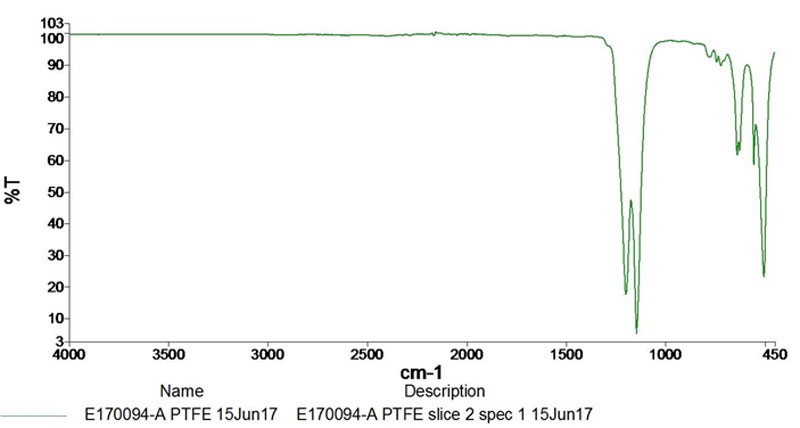
Long description for figure 7
Figure 7 is a graphic indicating the infrared radiation spectrum for polytetrafluoroethylene. The peaks are indicated in the data table below.
| Peak number | X axis (cm-1) | Y axis (%T) |
|---|---|---|
| 1 | 1200.58 | 17.59 |
| 2 | 1145.76 | 5.20 |
| 3 | 773.05 | 92.86 |
| 4 | 719.97 | 90.07 |
| 5 | 638.36 | 61.96 |
| 6 | 625.71 | 63.16 |
| 7 | 553.90 | 58.77 |
| 8 | 503.65 | 23.19 |
Figure 8. Polyvinylchloride (PVC) IR spectrum

Long description for figure 8
Figure 8 is a graphic indicating the infrared radiation spectrum for polyvinylchloride. The peaks are indicated in the data table below.
| Peak number | X axis (cm-1) | Y axis (%T) |
|---|---|---|
| 1 | 2916.29 | 80.62 |
| 2 | 2849.41 | 87.24 |
| 3 | 1733.49 | 93.81 |
| 4 | 1425.80 | 76.74 |
| 5 | 1377.91 | 88.96 |
| 6 | 1328.41 | 88.08 |
| 7 | 1243.89 | 83.15 |
| 8 | 1096.47 | 89.20 |
| 9 | 966.92 | 86.03 |
| 10 | 877.02 | 85.08 |
| 11 | 684.63 | 83.72 |
| 12 | 611.46 | 73.20 |
Authorization
Laboratory Supervisor
__________________________
Name (print)
_____________________________
Signature
__________________________
Date
Quality Assurance Officer
___________________________
Name (print)
_____________________________
Signature
__________________________
Date
___________________________
Name (print)
_____________________________
Signature
__________________________
Date
Biennial review
1. Laboratory Supervisor
__________________________
Name (print)
_____________________________
Signature
__________________________
Date
Quality Assurance Officer
___________________________
Name (print)
_____________________________
Signature
__________________________
Date
2. Laboratory Supervisor
__________________________
Name (print)
_____________________________
Signature
__________________________
Date
Quality Assurance Officer
___________________________
Name (print)
_____________________________
Signature
__________________________
Date
3. Laboratory Supervisor
__________________________
Name (print)
_____________________________
Signature
__________________________
Date
Quality Assurance Officer
___________________________
Name (print)
_____________________________
Signature
__________________________
Date