
Audit of Employment Equity Representation in Recruitment
Table of Contents
- Executive summary
- Introduction
- Current employment equity representation in the federal public service
- Approach to the Audit of Employment Equity Representation in Recruitment
- Employment equity groups did not remain proportionately represented throughout external recruitment processes
- Women
- Indigenous peoples
- Persons with disabilities
- Members of visible minorities
- Members of visible minority sub-groups
- Representation decreased at the organizational screening, assessment and appointment stages for certain groups
- Job application and automated screening
- Organizational screening
- Assessment
- Appointment
- Organizational policies and practices that impact representation
- Conclusion
- Recommendations
- Moving forward: the Public Service Commission’s response
- Annex A: Glossary of key terms
- Annex B: Representation rates of employment equity group applications at each stage of the recruitment process in the audit sample
- Annex C: About the Audit
Executive summary
About the audit
This audit was undertaken as part of the Public Service Commission (PSC)’s oversight mandate to assess the integrity of the public service staffing system. It is part of a series of initiatives that looks at the performance of the staffing system with respect to the representation of employment equity groups.
Achieving priorities related to diversity and inclusion in the federal public service will ensure that Canadians benefit from a public service workforce that is representative of Canada’s diversity. To date, progress towards a representative federal public service is being made. Of the 4 employment equity groups, 3 are represented at or above workforce availability; persons with disabilities are currently underrepresented in the federal government. These results show that more work and a sustained focus on diversity are required.
This audit focused on advertised recruitment processes as one of the key drivers to improving the representation of employment equity groups in the federal public service. The audit had 2 objectives:
- to determine whether the 4 employment equity groups remain proportionately represented throughout recruitment processes
- to identify factors that may influence employment equity group representation
This audit looked at 15 285 applications to 181 externally advertised appointment processes from 30 departments and agencies.
We examined employment equity group representation at 5 key stages of the external advertised appointment process (Figure 2 in this report provides more detail on each of these stages):

Our focus was to explore whether employment equity groups experienced changes in representation at each stage of the appointment process, and to examine these stages for factors that may have influenced their representation.
Main findings
We found that employment equity groups did not remain proportionately represented throughout the recruitment process.
Our audit results showed that:
- women were the only group to experience an overall increase in representation from job application to the appointment stage
- Indigenous candidates experienced a reduction in representation at the assessment stage
- persons with disabilities experienced the largest drop in representation of any of the employment equity groups, with decreases in representation at the assessment and appointment stages
- visible minority groups experienced reductions in representation at the organizational screening and assessment stages
- of the visible minority sub-groups examined in our audit, Black candidates experienced a larger drop in representation than other members of visible minorities, both at the organizational screening and assessment stages
Our ability to identify factors that may influence employment equity representation in recruitment was limited to the information available in the staffing files. Some factors were identified to partially explain the drop in representation of members of visible minorities at the organizational screening stage. However, limited information in staffing files did not provide conclusive evidence of other factors that may be associated with lower success rates of employment equity groups at later stages of the recruitment process. More research will be required to determine potential barriers in externally advertised appointment processes and to develop concrete solutions.
This audit report makes 3 recommendations intended to address the lower success experienced by some employment equity groups in external advertised recruitment processes. The development and implementation of concrete corrective measures will require collaboration between multiple stakeholders including deputy heads, the PSC, other central agencies and employment equity groups.
The audit makes clear that despite efforts across departments and agencies to advance diversity, work remains to achieve inclusive hiring processes in the public service. The PSC will need to further support organizations by providing systems, tools and guidance for implementing a barrier-free appointment process. Most importantly, deputy heads are responsible for reviewing their staffing framework and practices to ensure barrier-free appointment processes for all employment equity groups, including visible minority sub-groups.
Introduction
1. The Public Service Commission (PSC) is responsible for promoting and safeguarding a merit-based, representative and non-partisan federal public service. As part of its oversight activities, the PSC undertakes audits, investigations and research activities to assess the integrity of the public service staffing system and its performance against intended outcomes.
2. The Preamble of the Public Service Employment Act establishes that Canada’s public service is representative of Canada’s diversity. As per sub-section 4(4) of the Employment Equity Act, when delivering its mandate under the Public Service Employment Act, the PSC is responsible for identifying and eliminating employment barriers for the 4 designated employment equity groups. Section 3 of the Employment Equity Act defines “designated groups” as women, Aboriginal peoplesFootnote 1, persons with disabilitiesFootnote 2, and members of visible minorities.
3. This audit is one of a number of PSC activities aimed at improving the performance of the staffing system with respect to representativeness. Other initiatives include the Anonymized Recruitment Pilot Project, the Employment Equity Promotion Rate Study and the Staffing and Non-partisanship Survey.
4. The results of this audit complement the Anonymized Recruitment Pilot Project, which found no discernable differences in the screen-in rates of visible minority candidates and their counterparts in recruitment. However, methodological limitations of the project may have influenced these results. This audit was undertaken in part to provide complementary data while remedying these limitations.
Current employment equity representation in the federal public service
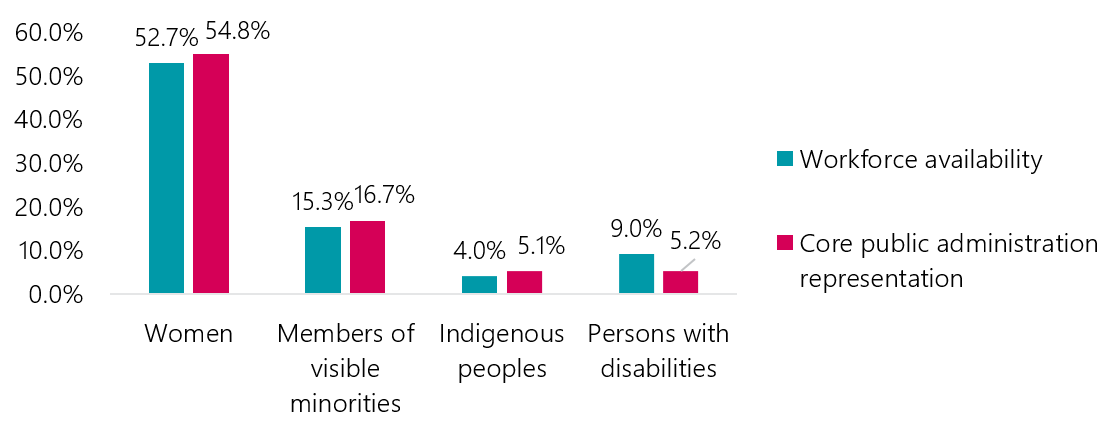
5. Current federal public service statistics on employment equity representation show that 3 of the 4 employment equity groups are represented at or above their respective federal public service workforce availability. Footnote 3
Text version
| Workforce availability and core public administration representation | Women | Members of visible minorities | Indigenous peoples | Persons with disabilities |
|---|---|---|---|---|
| Workforce availability | 52.7% | 15.3% | 4.0% | 9.0% |
| Core public administration representation | 54.8% | 16.7% | 5.1% | 5.2% |
6. One group, persons with disabilities, is currently under-represented. This is partly explained by the introduction of a more inclusive definition of persons with disabilities in the 2017 Canadian Survey on Disability. This resulted in an increase in their workforce availability, from 4.4% in 2011 to 9.0% in 2017. As this more inclusive definition has not yet been introduced in the federal public service self-identification exercise, it is not possible to know what gap will remain when it is adopted for self-identification purposes.
Approach to the Audit of Employment Equity Representation in Recruitment
7. The Audit of Employment Equity Representation in RecruitmentFootnote 4 had 2 objectives:
- to determine whether designated employment equity groups are proportionately represented throughout recruitment processes
- to identify potential factors that may influence representation in the appointment system among the 4 designated employment equity groups
8. The audit focused on externally advertised processes. It did not look at non-advertised processes, inventories or job opportunities restricted to employment equity groups.
9. We drew a sample of over 15 000 applications to ensure that all 4 designated groups were representedFootnote 5. In our audit sample, employment equity representation at the application stage was as follows:
- womenFootnote 6: 7 313 (52.8%)
- members of visible minorities: 4 652 (30.4%)
- persons with disabilities: 679 (4.4%)
- Indigenous peoples: 528 (3.5%)
10. Our audit sample of 15 285 applications was derived from a selection of 181 completed external advertised appointment processes with closing dates between April 1, 2016, and March 31, 2017, drawn from 30 federal departments and agencies. These processes resulted in the appointment of 454 candidates to term and indeterminate public service jobs. More information on the audit’s scope and methodology as well as the list of participating organizations can be found in Annex C, “About the Audit.”
11. The broad definition of members of visible minorities limits our ability to understand challenges faced by individual sub-groups within the visible minority communityFootnote 7. To explore sub-group differences, we conducted additional analyses of the larger visible minority sub-groups in the audit sample.
12. Auditors obtained and analyzed applicant and process data from the PSC’s Public Service Resourcing System as well as from appointment process information submitted by participating organizations. An audit questionnaire was administered to heads of human resources of the participating organizations and a sample of hiring managers. The purpose of this questionnaire was to obtain contextual information on the participating organizations’ practices related to employment equity in external advertised appointment processes.
13. To analyze employment equity group representation throughout the external advertised appointment process, we sub-divided the process into 5 stages (see Figure 2).
| Job application | Automated screening | Organizational screening | Assessment | Appointment |
|---|---|---|---|---|
|
|
|
|
|
14. Results were tracked for all candidates at each of these stages. Auditors recorded whether a candidate:
- was eliminated from a process
- voluntarily withdrew
- was successful and proceeded to the next stage in the process
These results were recorded at each stage of the process for each candidate for the entire audit sample (see Annex B).
15. Auditors worked closely with the PSC’s Data Services and Analysis Directorate to collect and analyze data and to calculate representation rates. All data used to calculate representation rates were obtained from the Public Service Resourcing System and the appointment process information provided by participating organizations.
Employment equity groups did not remain proportionately represented throughout external recruitment processes
16. The first audit objective was to determine whether designated employment equity groups were proportionately represented throughout the recruitment process. To address this objective, representation rates for employment equity groups were calculated based on each group’s percentage share of applications at each stage of the process.
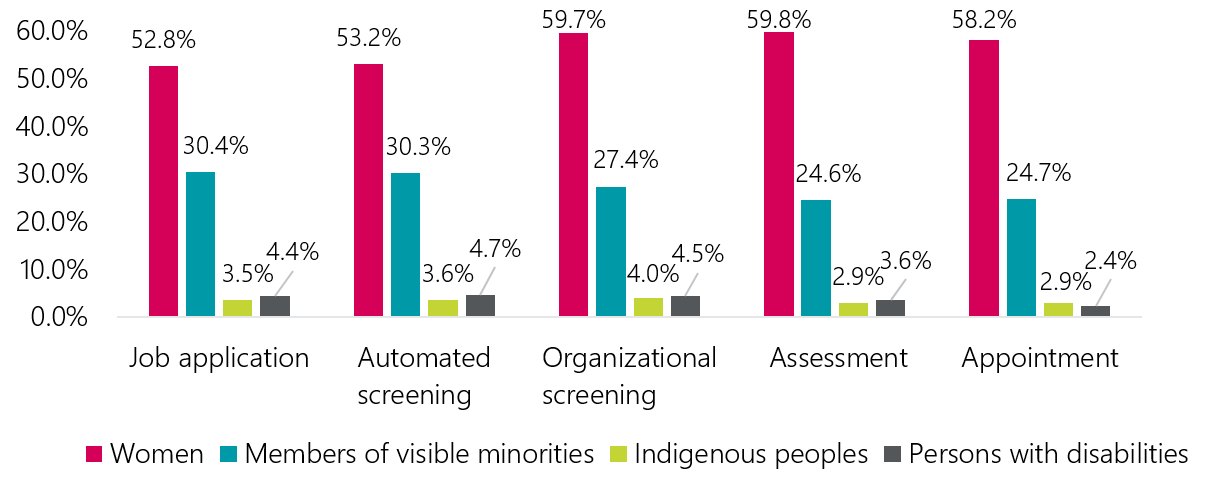
17. Figure 3 below shows the rates of representation of employment equity groups in our audit sample at various stages of the external recruitment process. Please refer to Annex B for numbers and representation rates of each employment equity group at these key stages.
Text version
| Employment equity groups | Job application | Automated screening | Organizational screening | Assessment | Appointment |
|---|---|---|---|---|---|
| Women | 52.8% | 53.2% | 59.7% | 59.8% | 58.2% |
| Members of visible minorities | 30.4% | 30.3% | 27.4% | 24.6% | 24.7% |
| Indigenous peoples | 3.5% | 3.6% | 4.0% | 2.9% | 2.9% |
| Persons with disabilities | 4.4% | 4.7% | 4.5% | 3.6% | 2.4% |
18. As shown above, representation rates varied by employment equity group and did not remain proportionate from job application to appointment. In our audit sample:
- women represented 52.8% of job applications and 58.2% of appointees
- members of visible minorities represented 30.4% of job applications and 24.7% of appointees
- Indigenous peoples represented 3.5% of job applications and 2.9% of appointees
- persons with disabilities represented 4.4% of job applications and 2.4% of appointees
Women
19. Women made up 7 313 of the job applications in our sample, and 260 candidates were appointed to positions. They experienced their largest increase at the organizational screening stage (increasing from 53.2% to 59.7%). Women were the only employment equity group who did not experience a decrease in representation at the assessment stage.

Text version
| Employment equity groups | Job application | Automated screening | Organizational screening | Assessment | Appointment |
|---|---|---|---|---|---|
| Women | 52.8% | 53.2% | 59.7% | 59.8% | 58.2% |
20. Intersectionality is the impact of belonging to 2 or more employment equity groups (for example, women visible minorities). Where the number of observations allowed, we analyzed the intersectionality between gender and other employment equity groups. Our results show that, at the organizational screening stage, women experienced a higher success rate than men; this was also the case for women in the other 3 employment equity groups (Indigenous women, visible minority women and women with disabilities). At the assessment stage, visible minority women experienced greater success than visible minority men; and women with disabilities experienced greater success than men with disabilities. However, Indigenous women had a success rate similar to that of Indigenous men.
Indigenous peoples
21. Indigenous peoples made up 528 of the job applications in our sample, and 13 candidates were appointed. Indigenous candidates experienced their only decrease in representation at the assessment stage (dropping from 4.0% to 2.9%) and, as will be discussed below, this decrease in representation at the assessment stage was associated with interviews. Their representation rate remained stable between assessment and appointment.

Text version
| Employment equity groups | Job application | Automated screening | Organizational screening | Assessment | Appointment |
|---|---|---|---|---|---|
| Indigenous peoples | 3.5% | 3.6% | 4.0% | 2.9% | 2.9% |
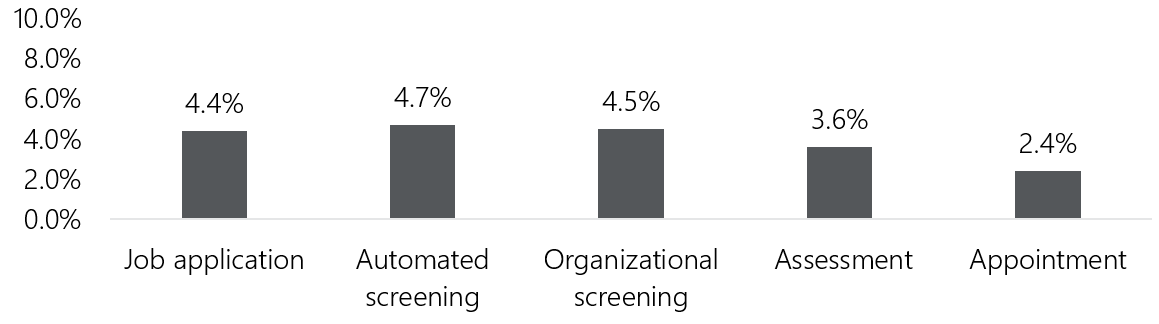
Persons with disabilities
22. Persons with disabilities made up 679 of the job applications in our sample, and 11 candidates were appointed. Persons with disabilities experienced a decline in representation at the assessment (4.5% to 3.6%) and the appointment stages (3.6% to 2.4%). Although care should be taken due to small sample size, it should be noted that it was the largest drop in representation at appointment experienced by any of the employment equity groups.
Text version
| Employment equity groups | Job application | Automated screening | Organizational screening | Assessment | Appointment |
|---|---|---|---|---|---|
| Persons with disabilities | 4.4% | 4.7% | 4.5% | 3.6% | 2.4% |
Members of visible minorities
23. Members of visible minorities made up 4 652 of the job applications in our sample, and 112 candidates were appointed. At the organizational screening stage, members of visible minorities experienced a drop in representation (30.3% to 27.4%), and a further drop at the assessment stage (from 27.4% to 24.6%). As discussed below, this decrease at the assessment stage was associated with written tests. Their representation rate remained stable between assessment and appointment.

Text version
| Employment equity groups | Job application | Automated screening | Organizational screening | Assessment | Appointment |
|---|---|---|---|---|---|
| Members of visible minorities | 30.4% | 30.3% | 27.4% | 24.6% | 24.7% |
Members of visible minority sub-groups
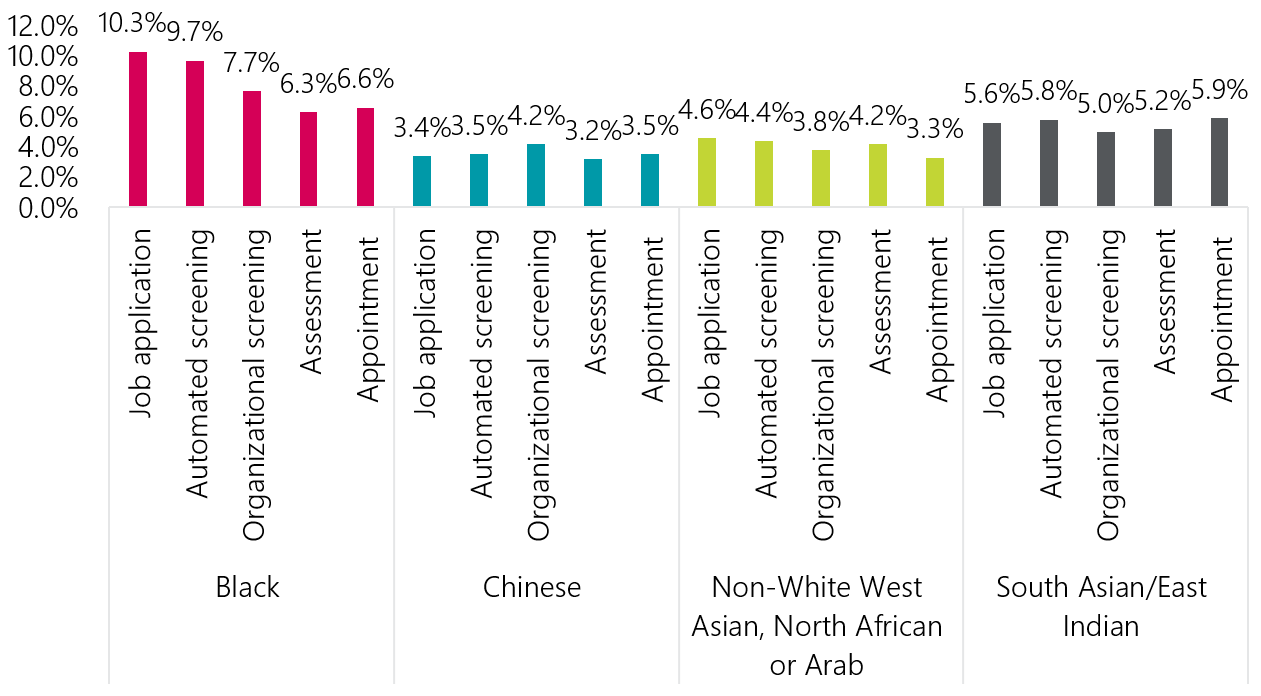
24. We examined the 4 largest sub-groups of members of visible minorities in our audit sample: Black; Chinese; Non-White West Asian, North African or Arab; and South Asian/East Indian applicants. Representation rates for each sub-group were calculated as a percentage of applications in our audit sample remaining at each stage of the recruitment process.
Text version
| Visible minority sub-group | Stage of recruitment process | Representation rates |
|---|---|---|
| Black | Job application | 10.3% |
| Automated screening | 9.7% | |
| Organizational screening | 7.7% | |
| Assessment | 6.3% | |
| Appointment | 6.6% | |
| Chinese | Job application | 3.4% |
| Automated screening | 3.5% | |
| Organizational screening | 4.2% | |
| Assessment | 3.2% | |
| Appointment | 3.5% | |
| Non-White West Asian, North African or Arab | Job application | 4.6% |
| Automated screening | 4.4% | |
| Organizational screening | 3.8% | |
| Assessment | 4.2% | |
| Appointment | 3.3% | |
| South Asian/East Indian | Job application | 5.6% |
| Automated screening | 5.8% | |
| Organizational screening | 5.0% | |
| Assessment | 5.2% | |
| Appointment | 5.9% |
25. Black applicants formed the largest sub-group. As can be seen in Figure 8, our results show that Black candidates experienced the overall largest drop in representation of all visible minority sub-groups from job application to the appointment stage (from 10.3% down to 6.6%). In our audit sample, out of 1 570 applications, 30 Black candidates were appointed.
26. South Asian/East Indian and Chinese applicants experienced an overall increase in representation. Candidates from the Non-White West Asian, North African or Arab sub-group also experienced an overall decrease in their representation rates from job application to appointment (from 4.6% down to 3.3%). These findings indicate that within the visible minority group, sub-groups have different experiences with the external advertised appointment process. This highlights the importance of examining visible minority sub-group data.
Representation decreased at the organizational screening, assessment and appointment stages for certain groups
27. Under the audit’s second objective, we analyzed each stage of the external advertised appointment process to gain insight into potential factors that may influence the representation of employment equity groups at key stages of the process in our audit sample.
28. Our data was obtained from the Public Service Resourcing System and appointment process information provided by participating organizations. As well, as part of the audit, a questionnaire was administered to heads of human resources, and to a sample of hiring managers, in participating organizations. The purpose of this questionnaire was to obtain contextual information on the participating organizations’ practices related to employment equity in external advertised appointment processes.
Job application and automated screening

29. The Public Service Resourcing System is an automated, web-based external staffing tool on the GC Jobs platform. An applicant can apply for a job online by selecting the application link in the job advertisement via the GC Jobs website. It is at this stage that applicants can voluntarily self-declare as women, Indigenous peoples, persons with disabilities, or as members of visible minorities (including several sub-groups as well as the 4 largest sub-groups examined in this report: Black; Chinese; Non-White West Asian, North African or Arab; South Asian/East Asian).
30. After an applicant applies on the GC Jobs portal, hiring managers may choose to pre-screen applications based on responses to a number of self-assessment questions. This process is automated in the Public Service Resourcing System, and screening results are based on applicants’ self-assessment of how they meet identified qualifications. Our audit results show that this screening stage did not reduce employment equity representation.
Organizational screening

31. At the organizational screening stage, hiring organizations review applications to determine which candidates will be invited for further assessment. This screening process generally includes a review of candidates’ citizenship status, education, certifications and previous work experience to ensure they meet requirements. We found that at the organizational screening stage, members of visible minorities experienced a decline in representation, with Black candidates being the most affected of the visible minority sub-groups.
32. We examined appointment process information to identify the reasons members of visible minorities were screened out. Our review determined that members of visible minorities were screened out more often than their counterparts on 2 factors: citizenship status and experience qualifications. For all other identified factors (for example, education, certifications), members of visible minorities fared as well as, if not better than, their counterparts.
33. Due to legislative requirementsFootnote 8, Canadians who meet the essential qualifications of the position are given preference over non-citizens in externally advertised appointment processes. Although the vast majority of candidates in our audit sample were Canadians (93%), visible minority candidates were about twice as likely as their counterparts to be non-citizens. As a result, they were screened out based on citizenship status at about twice the rate of their counterparts.
34. The PSC’s Anonymized Recruitment Pilot Project showed that candidates with federal public service work experience increased their odds of being screened in at the organizational screening stage. In our audit, we examined whether members of visible minorities and their counterparts differed on this aspect.
35. Our audit results show that visible minority candidates were screened out more often than their counterparts on experience qualifications, and they also experienced less success than their counterparts regardless of whether or not they had federal public service experienceFootnote 9.
Assessment

36. At the assessment stage, candidates who are successful at the screening stages are invited for further evaluation. This typically involves written tests, interviews and reference checks to assess a candidate’s knowledge, competencies and/or personal suitability.
37. This stage proved challenging to analyze. Hiring managers have a wide range of flexibilities in determining how candidates will be assessedFootnote 10. In fact, any given assessment tool can measure a number of qualifications such as knowledge, abilities and personal suitability. Conversely, any given qualification may be assessed using a variety of assessment tools. As a result, when we reviewed available information at the assessment stage, it was not always possible to determine whether employment equity success rates were affected by the assessment method itself or a given qualification being assessed.
38. Nonetheless, we gathered information on assessment tools to gain insight as to why candidates from 3 of the 4 employment equity groups (Indigenous peoples, members of visible minorities and persons with disabilities) experienced less success than their counterparts at this stage.
Written tests
39. Members of visible minorities were the only employment equity group who experienced less success than their counterparts when written tests were used. This was particularly the case when knowledge qualifications were assessed. We note that Black candidates experienced less success than other members of visible minority candidates on written tests. In our audit sample, the vast majority of written tests were developed by hiring organizations, and used an open-ended response format which generally relies on a more subjective scoring of responses.
Interviews
40. Indigenous candidates experienced their largest decrease in representation at the assessment stage, and we found that this was associated with the use of interviews. Previous research on the performance of Indigenous candidates during interviews has identified cultural factors, including a hesitance to highlight personal successes, which may be interpreted by interview panels as a lack of achievement. Cultural factors may also be at play for other employment equity sub-groups who may approach interviews differently.
Reference checks
41. The small number of candidates who went through reference checks limits our observations for this stage. Our audit results showed that reference checks resulted in greater success for women. The 3 other employment equity groups experienced less success than their counterparts at this stage of the process.
Appointment

42. At the appointment stage, hiring managers select a candidate for appointment from among those who were found qualified following the assessment stage. With the exception of persons with disabilities, employment equity representation among appointees remained more or less stable between assessment and appointment. Persons with disabilities, however, experienced their largest drop in representation at the appointment stage.
43. Given the small number of persons with disabilities in our audit sample (11) who were appointed, care must be taken in interpreting these results. Further research will be required to determine the extent to which persons with disabilities experience barriers at the appointment stage. This finding is particularly important and time-sensitive given the Government of Canada’s commitment to increase by 5 000 the number of public servants with disabilities by 2025.
Organizational policies and practices that impact representation
44. The PSC, through its appointment framework (which includes the Appointment Policy and the Appointment Delegation and Accountability Instrument), delegates its authorities under the Public Service Employment Act to deputy heads. Under this framework, deputy heads are to ensure a representative workforce benefiting from the diversity of Canadians. Deputy heads are expected to respect employment equity obligations throughout the appointment process, and they must also ensure that appointment processes are designed so as not to discriminate or create systemic barriers.
45. The Employment Equity Act requires employers to implement measures to support the representation of employment equity groups by identifying and eliminating barriers faced by persons in designated groups that result from employment systems, policies and practices.
46. Obligations include collecting information and conducting workforce analyses to determine the degree of representation of employment equity groups. If there are any gaps in representation in occupational groups, organizations must undertake an employment system review to determine whether any employment system, policy or practice is a barrier against persons in designated groups.
47. Through our audit questionnaire, we found that 77% of organizations had conducted a workforce analysis and, of these, 90% had identified representation gaps for one or more employment equity group. However, only 50% of organizations undertook an employment system review in the last 3 to 5 years. Of those that did, 62% reported having no systemic barriers in recruitment policies and practices.
48. The audit questionnaire also found that 54% of hiring managers reported they were not aware that the PSC’s Personnel Psychology Centre offered expertise in assessment accommodation and on developing bias-free assessment methods and tools. We also note that a PSC report (Staffing and Non-partisanship Survey: Perceptions of Federal Public Servants Who Self-Identified as a Member of an Employment Equity Group) shows that most candidates with disabilities did not request assessment accommodation (88%). Of those who requested assessment accommodation, only 66% indicated being satisfied with the accommodation provided.
49. There are also specific requirements in the PSC’s appointment framework aimed at hiring managers. For example, public servants must take training prescribed by their deputy head before being delegated authority to staff. In our questionnaire, we found that 27% of respondent organizations made training related to employment equity mandatory before granting those staffing authorities. We found 19% of responding organizations provided training on workplace diversity and inclusion, and 19% offered unconscious bias training. In addition, 12% of responding organizations required staffing selection boards for interviews to have at least one member from an employment equity group.
50. Under the PSC’s appointment framework, each public servant with delegated staffing authority must sign an attestation form indicating that they will consider employment equity objectives when exercising their appointment-related authorities. In our questionnaire, 74% of the hiring managers who responded indicated they took employment equity considerations into account when they planned their recruitment activities.
Conclusion
51. Our audit results show that the 4 employment equity groups did not remain proportionately represented throughout the external appointment process. Although women experienced an increase or stable representation across various stages, we found that members of visible minorities, Indigenous peoples and persons with disabilities experienced decreases at one or more stages.
52. We noted a decrease in representation rates for members of visible minorities, and Black candidates in particular, at the organizational screening stage. Although we identified some factors, such as citizenship, which may have contributed to the lower success rate of members of visible minorities at this stage, there are likely other issues at play. As seen in the audit, automated screening had no adverse impact on employment equity representation. It may be useful to consider how technology can be further leveraged to remove potential barriers in the screening process for members of visible minorities.
53. Indigenous candidates, persons with disabilities, visible minority candidates and Black candidates in particular all experienced lower representation rates at the assessment stage. With the information available in our audit and the range of assessment options available to hiring managers, we were not able to identify specific contributing factors at the assessment stage. However, best practices in assessment should be implemented more broadly. This should include reviews of assessment tools to enhance fairness, unconscious bias training for hiring managers and the use of diverse assessment boards.
54. Persons with disabilities experienced drops in representation at the assessment and appointment stages. The lower success rates of persons with disabilities at the assessment stage point to the need for a greater awareness of assessment accommodation services. Given the small sample size and limited information available in staffing files, it was not possible to conclude on what may have contributed to their drop in representation at the appointment stage. With the importance being given to increasing representation of persons with disabilities in the federal public service, this is an area that will require further attention.
55. Collaborative research and targeted efforts from a variety of stakeholders including the PSC, other central agencies and employment equity groups, will be required to determine the underlying barriers in externally advertised appointment processes and to develop concrete solutions to address them. This audit points to areas where future research and enhanced accountability measures should be considered in the PSC’s appointment framework.
56. It is important for deputy heads:
- to consider the results of this audit within their own organizational context
- to put into place effective monitoring of employment equity group representation in recruitment
- to make appropriate changes where warranted
Recommendations
Recommendation 1: Deputy heads should review their staffing framework and practices to ensure barrier-free appointment processes for all employment equity groups, including visible minority sub-groups.
Recommendation 2: The PSC should work with other central agencies and employment equity groups to identify specific factors that impact the success of employment equity groups and visible minority sub-groups within the hiring process, and to implement solutions.
Recommendation 3: The PSC should increase its efforts in developing and promoting systems, tools and guidance that support inclusive external recruitment processes, with a focus on developing barrier-free assessment approaches.
Moving forward: the Public Service Commission’s response
57. This audit represents one way the PSC oversees the staffing system: assessing the health and integrity of hiring and identifying barriers to building a diverse public service. Coupled with our study of promotion rates and the perceptions of staffing we captured in our Staffing and Non-Partisanship Survey, it is clear that despite sustained efforts across departments and agencies to advance diversity, work remains to achieve fully inclusive hiring in the public service.
Recommendation 1
58. This audit should serve as a call to action for departments. Hiring decisions, from establishing qualifications to assessing and selecting candidates, fall to departments. For this reason, we expect that deputy heads will use these results to explore their own hiring process and practices, to identify and remove barriers and improve the success of employment equity groups in the various stages of hiring.
59. The PSC will strengthen employment equity obligations in our delegation instrument, reinforcing this as an integral part of our terms and conditions to deputy heads in carrying out public service hiring. We will further support deputy heads and their organizations with guidance on how to effectively review their employment systems to identify and eliminate barriers found within.
Recommendation 2
60. While action at a departmental level is critical, the PSC equally commits to furthering work to look at system-wide barriers. While the audit has uncovered gaps in success rates, it has not exposed the root cause. We therefore commit to working with our central agency partners, organizations, employment equity groups and committees to explore the ‘why’ behind gaps. And while this work is essential to better understanding barriers, tangible action cannot wait.
Recommendation 3
61. The PSC will require training on unconscious bias in recruitment, for all public service managers, as a prerequisite to be able to exercise hiring authority. We will strengthen our support of managers by better sharing the unique expertise and assessment tools offered by the PSC’s Personnel Psychology Centre. Measures will include creating new guides on inclusive assessment methods, and building capacity in the human resources community, for example, through our emerging Accessible Assessment Ambassador network. We will also advance diverse interview boards as one of the leading practices in recruitment to address barriers in the hiring process and improve the quality of assessment of all candidates.
62. The PSC will prioritize accessibility in modernizing the GC Jobs recruitment platform. Through inclusive design, and by leveraging functionality to reduce the potential for bias at the early stages of the hiring process, we will ensure that all Canadians applying to a public service job have an equal opportunity to highlight their unique talents.
63. These measures represent a starting point in the PSC’s response to the findings of the audit. While they reflect our commitment to acting immediately, we will build on them as we further engage with stakeholders on solutions.
Annex A: Glossary of key terms
applicants
- Individuals who apply for jobs that are posted on the Public Service Commission’s GC Jobs portal.
appointment stage
- The stage of the hiring process where a hiring manager selects among qualified candidates a person or persons to be appointed to the position.
assessment stage
- The stage of the hiring process where a candidate’s knowledge, skills and aptitudes are measured. While this audit has identified a particular stage for this, assessment of candidates occurs throughout screening as well.
automated screening stage
- The stage of the hiring process where preliminary screening of applications is performed by the Public Service Resourcing System on behalf of hiring managers. Preliminary screening may consist of ensuring that the applicant falls within the area of selection, and responses to automated screening questionnaires and Yes-No statements.
candidates
- Applicants who proceed through the automated screening stage to the organizational screening and assessment stages.
counterparts
- A group of candidates not belonging to the employment equity group being considered. For example, the counterparts for women are men, whereas the counterparts for members of visible minorities are candidates who did not indicate being a visible minority.
deputy heads
- Refers to deputy ministers, person designated by the Governor in Council as a deputy head, or chief executive officer.
employment equity groups
- As defined in the Employment Equity Act, the 4 employment equity groups are women, members of visible minorities, Aboriginal peoples (referred to as Indigenous peoples throughout this report) and persons with disabilities.
hiring managers
- In this report, hiring managers refer to those with sub-delegated staffing authorities that include the authority to make appointments.
online application stage
- An applicant can apply for a job online by selecting the application link in the job advertisement via the GC Jobs website. It is at this stage that applicants can voluntarily self-declare as women, Indigenous peoples, members of visible minorities or as persons with disabilities.
organizational screening stage
- The manual review of applications performed by organizations from the pool of applications that were referred by the Public Service Resourcing System.
Public Service Resourcing System
- A centralized, web-based staffing tool through which applicants submit their applications. The PSC’s Appointment Policy requires departments and agencies to advertise all jobs open to the public on the System for at least 24 hours.
representation rate
- Calculated based on an employment equity group’s share of all applications that remained in the appointment process after each stage was completed.
success rates
- Calculated as the number of successful applications at a given stage in the appointment process divided by the total number of applications that were assessed at the same stage.
workforce availability
- For the core public administration, workforce availability refers to the estimated availability of people in designated employment equity groups as a percentage of the workforce population. It is based on the population of Canadian citizens who are active in the workforce and who work in occupations that correspond to occupations in the core public administration. Availability is estimated from Census data, and estimates for persons with disabilities are derived from data, also collected by Statistics Canada, in the Canadian Survey on Disability.
Annex B: Representation rates of employment equity group applications at each stage of the recruitment process in the audit sample
| Stage of external advertised appointment process | Women | Indigenous peoples | Persons with disabilities | Members of visible minorities | Black sub-group | Chinese sub-group | Non-White West Asian, North African or Arab sub-group | South Asian/East Indian sub-group | Other sub-groups * | All applications |
|---|---|---|---|---|---|---|---|---|---|---|
| Application | 7 313 | 528 | 679 | 4 652 | 1 570 | 516 | 696 | 851 | 1 019 | 15 285 |
| Public Service Resourcing System screening | 5 615 | 423 | 547 | 3 536 | 1 134 | 410 | 519 | 674 | 799 | 11 669 |
| Organizational screening | 2 661 | 195 | 216 | 1318 | 373 | 201 | 183 | 239 | 322 | 4 816 |
| Assessment | 658 | 33 | 42 | 283 | 73 | 37 | 48 | 60 | 65 | 1 152 |
| Appointment | 260 | 13 | 11 | 112 | 30 | 16 | 15 | 27 | 24 | 454 |
*Other visible minority sub-groups were included in the audit sample, but the numbers were too small to allow for separate reporting.
| Stage of external advertised appointment process | Women | Indigenous peoples | Persons with disabilities | Members of visible minorities | Black sub-group | Chinese sub-group | Non-White West Asian, North African or Arab sub-group | South Asian/East Indian sub-group | Other sub-groups |
|---|---|---|---|---|---|---|---|---|---|
| Application | 52.8% | 3.5% | 4.4% | 30.4% | 10.3% | 3.4% | 4.6% | 5.6% | 6.7% |
| Public Service Resourcing System screening | 53.2% | 3.6% | 4.7% | 30.3% | 9.7% | 3.5% | 4.4% | 5.8% | 6.8% |
| Organizational screening | 59.7% | 4.0% | 4.5% | 27.4% | 7.7% | 4.2% | 3.8% | 5.0% | 6.7% |
| Assessment | 59.8% | 2.9% | 3.6% | 24.6% | 6.3% | 3.2% | 4.2% | 5.2% | 5.6% |
| Appointment | 58.2% | 2.9% | 2.4% | 24.7% | 6.6% | 3.5% | 3.3% | 5.9% | 5.3% |
*Numbers will not add to 100% as an application can belong to more than one employment equity group including visible minority sub-groups.
Notes:
Data on women are based on the number of applicants who identified their gender in their Public Service Resourcing System profile or from the federal government pay system, if available.
Data on employment equity status were drawn from a combination of voluntary self-declaration of employment equity membership provided by individuals as part of their Public Service Resourcing System application, as well as self-identification of employment equity membership voluntarily provided by individuals upon appointment to the public service.
Annex C: About the Audit
Audit objectives
The objectives of this audit were:
- to determine whether the 4 designated employment equity groups (women, members of visible minorities, Indigenous peoples and persons with disabilities) are proportionately represented in recruitment processes
- to identify key factors that influence representation in the appointment system among the 4 designated employment equity groups
Scope and methodology
The audit covered external advertised staffing processes for term and indeterminate positions with a closing date between April 1, 2016 and March 31, 2017. This timeframe was chosen to align with the reference period of the Anonymized Recruitment Pilot Project.
The audit methodology included the following:
- obtaining and analyzing applicant and process data from the PSC’s Public Service Resourcing System
- analyzing the screening results and comparison with the screening results from the Anonymized Recruitment Pilot Project with the use of the same econometric model
- reviewing screening and assessment results for all candidates throughout key stages of the appointment process
- reviewing the assessment tools used (for example, written tests, interview guides, reference check templates), and assessment and rating guides
- administering an audit questionnaire to the Heads of Human Resources of the 30 participating
organizations, as well as 90 sub-delegated managers
- the intent of the questionnaire was to obtain contextual information on the participating organizations’ frameworks and practices related to employment equity in recruitment and hiring processes
The audit questionnaire response rate was 87% for heads of human resources, and 57% for sub-delegated managers. In instances where the original hiring manager was no longer with the organization, another sub-delegated manager was identified by the organization to respond to the questionnaire.
The audit questionnaire was administered in June and July 2019, which differs from the reference period for the external advertised appointment processes included in the sample. Therefore, questionnaire results are not correlated to representation rates observed as part of the audit.
Sampling approach
Determinants in selecting the audit sample included the following:
- all organizations that were part of both the System Wide Staffing Audit and the Horizontal Audit on Credential Validation were excluded from this audit in order to minimize audit burden in the staffing system
- organizations with fewer than 5 appointment processes during the reference period were not included
- a maximum of 20 appointment processes were selected per organization
- recruitment processes that were part of an inventory with multiple work locations or multiple occupational classifications were excluded
The sample was also designed to ensure representation across the 6 occupational categories: Scientific and Professional, Administrative and Foreign Service, Technical, Administrative Support, Operational, and Executive. The sample was allocated across occupational categories within each organization proportional to its number of external advertised appointment processes. A minimum of one process was selected from each stratum.
Applying this sampling methodology, the resulting sample consisted of 181 external advertised appointment processes from 30 organizations. It must be noted that due to the design of the sample, the audit is unable to report on results at the organizational level. The audit sample is designed to provide system-wide information and will not result in reliable results at an organizational level.
Data
Data on women are based on the number of applicants who identified their gender in their Public Service Resourcing System profile or from the federal government pay system, if available. Data on employment equity status for members of visible minorities, Indigenous peoples and persons with disabilities were drawn from a combination of voluntary self-declaration of employment equity membership provided by individuals as part of their Public Service Resourcing System application, as well as self-identification of employment equity membership voluntarily provided by individuals upon appointment to the public service.
Calculation of representation rates and success rates
Employment equity representation rates were calculated at the end of each of the 5 stages of the appointment process. It is the number of an employment equity group’s applications divided by the total number of applications. For visible minority sub-groups, the denominator was the number of job applications at each stage.
Success rates were calculated at 4 stages of the appointment process: Public Service Resourcing System screening, organizational screening, assessment and appointment. It is the number of successful job applications at the end of an appointment process stage divided by the number of job applications that were evaluated during that stage.
If all employment equity groups and their counterparts had identical success rates at each stage of the appointment process then representation rates at application would equal representation rates at appointment.
Limitations
The following limitations are to be taken into consideration in the interpretation of audit findings and conclusions:
- although a random and representative sample was selected from a defined population, the calculation of employment equity representativeness and success rates at key stages of the process did not apply weighting
- due to small sample sizes for Indigenous applicants, persons with disabilities and members of visible minority sub-groups, especially at the appointment stage, comparisons with counterparts is done with caution
- the audit collected information on when applicants were eliminated based on language proficiency
- because a very small number were identified, additional analysis based on employment equity status was not performed
Factors that influenced representation
Auditors collected data on the factors that may have influenced the success rates of the employment equity groups at the various stages of the external advertised appointment process. The data was collected either directly from the Public Service Resourcing System, or through the review of information on screening and assessment results provided by the organizations participating in the audit.
As part of the audit, the following factors were examined:
- employment equity status of the applicant (whether self-declared as part of the application, or self-identified once appointed to the federal public service)
- whether the applicant had work experience in the federal public service (based on the availability of a Personal Record Identifier in the application)
- location of the position (National Capital Region vs. other regions)
- first official language of the applicant
- occupational category
- highest level of education attained by the applicant
- location of the institution where the applicant obtained their highest level of education (in or outside Canada)
- citizenship of the applicant (Canadian or not)
- required education qualification met or exceeded the education standard set by the Treasury Board of Canada Secretariat
- the presence of qualifications that implied federal public service experience
- type of assessment tools used
Participating organizations
Administrative Tribunals Support Service of Canada
Atlantic Canada Opportunities Agency
Canada Border Services Agency
Canada Economic Development for Quebec Regions
Canada School of Public Service
Canadian Grain Commission
Canadian Heritage
Canadian Radio-Television and Telecommunications Commission
Canadian Space Agency
Canadian Transportation Agency
Courts Administration Service
Department of Justice Canada
Environment and Climate Change Canada
Global Affairs Canada
Crown-Indigenous Relations and Northern Affairs Canada (including Indian Oil and Gas)
Innovation, Science and Economic Development Canada
Library and Archives Canada
National Energy Board
Office of the Chief Electoral Officer
Office of the Superintendent of Financial Institutions
Privy Council Office
Public Prosecution Service of Canada
Public Service Commission of Canada
Royal Canadian Mounted Police
Shared Services Canada
Statistics Canada
Transportation Safety Board of Canada
Treasury Board Secretariat of Canada
Veterans Affairs Canada
Western Economic Diversification Canada
Page details
- Date modified: