
2018 Staffing and Non-Partisanship Survey: Perceptions of Federal Public Servants Who Self-Identified as a Member of an Employment Equity Group
On this page
- Highlights
- Introduction
- Perceptions of merit, fairness and transparency
- Managers
- Testing accommodation measures and employment equity considerations
- Conclusion
- Appendix 1 - Sources of information
- Appendix 2
- Appendix 3 - Tables
Key terms
Employees belonging to employment equity groups are defined in this report as survey respondents who self-identified as:
- First Nations, Inuit or Métis (Indigenous peoples)
- a member of a racial or cultural group other than white (members of visible minorities)
- having a disability (persons with disabilities)
- female (women)
Indigenous peoples: while the legislative term “Aboriginal peoples” appears in the Employment Equity Act, this report uses the term “Indigenous peoples,” in keeping with international usage
Testing accommodation measures: Changes made to an assessment to remove barriers to a fair assessment and allow candidates to fully demonstrate their competency. They are most often requested on the basis of a disability. However, they can be requested for any legitimate need relating to one of the 13 prohibited grounds for discrimination set out in the Canadian Human Rights Act.
Positive response rate: Percentage of respondents who answered positively to a question.
Highlights
This report is based on selected results of the first cycle of the Staffing and Non-Partisanship Survey, which was conducted over 8 weeks from February to April 2018. It follows a report on the survey results for the overall federal public service published in September 2018 as well as other reports focused on employment equity groups, including the 2018 Anonymized Recruitment Pilot Project and the 2019 Employment Equity Promotion Rate Study.
The objectives of this report are to:
- examine how federal public service employees who belong to one or more of the 4 designated employment equity groups perceive merit, fairness and transparency in the staffing system
- determine whether employees who are members of an employment equity group have different perceptions of merit, fairness and transparency in the staffing system than other employees, and whether perceptions differ by gender
- explore the perceptions of managers who belong to one or more of the 4 designated employment equity groups compared to the perceptions of other managers
- examine how public servants with disabilities perceived testing accommodation measures (changes made to assessments to remove barriers to a fair assessment)
- explore how managers and staffing advisors perceive staffing advice on employment equity considerations and testing accommodation measures
Overall findings suggest:
- employees who self-identified as members of one or more of the 4 employment equity groups generally gave proportionally fewer positive responses on questions of merit, fairness and transparency in staffing activities
- although managers who belong to one or more employment equity groups gave slightly less positive responses, managers overall
- agreed that hires meet performance expectations and are a good fit within their team
- felt little pressure to hire a particular employee
- felt no personal indebtedness toward employees
- although only a small proportion of persons with disabilities requested testing accommodation measures, most of those who did were satisfied with those measures
Introduction
About the survey
The Staffing and Non-Partisanship Survey was introduced in 2018 as a public-service-wide survey to be run every 2 years, replacing the Survey of Staffing. The survey targeted employees, hiring managers and staffing advisors to gather their views on a wide range of staffing-related topics, including the New Direction in Staffing, organizational staffing policies and practices, as well as political activities and non-partisanship. A copy of the survey questionnaire is available on Statistics Canada’s website.
Invitations to complete the survey were sent to 214 275 public servants across 74 departments and agencies subject to the Public Service Employment Act. A total of 101 892 employees completed the survey, representing an overall response rate of 47.6%.
The information gathered in the survey will be used to:
- identify current and emerging trends at government-wide and organizational levels
- inform potential improvements to staffing policies and practices
- better target efforts to safeguard non-partisanship within the federal public service
Because the content of this survey is different from its predecessor (the Survey of Staffing), year-over-year comparisons are not always possible.
Background
The Public Service Employment Act states that Canada will continue to benefit from a public service that is representative of Canada’s diversity. Under the Employment Equity Act, the Public Service Commission of Canada must:
- identify and eliminate employment barriers in the appointment system for the 4 designated employment equity groups (women, Indigenous peoples, persons with disabilities and members of visible minorities)
- develop positive policies and practices
- provide reasonable accommodation to create a representative public service
In recent decades, the federal public service has made important progress in the representation of the 4 designated employment equity groups, yet gaps persist.
The Public Service Commission’s mandate is to promote and safeguard merit-based appointments and, in collaboration with other stakeholders, to protect the non-partisan nature of the public service. Its mandate also includes promoting and safeguarding a representative public service.
In support of its commitment, the Public Service Commission has undertaken several projects and studies focused on employment equity groups, including the 2018 Anonymized Recruitment Pilot Project and the 2019 Employment Equity Promotion Rate Study.
Objectives of this report
Using findings from the 2018 Staffing and Non-Partisanship Survey, this analysis seeks to:
- examine how federal public service employees who belong to one or more of the 4 designated employment equity groups, perceive merit, fairness and transparency in the staffing system
- determine whether employees who are members of an employment equity group have different perceptions of merit, fairness and transparency in the staffing system than other employees, and whether perceptions differ by gender
- explore the perceptions of managers who belong to one or more of the 4 designated employment equity groups compared to the perceptions of other managers
- examine how public servants with disabilities perceived testing accommodation measures (changes made to remove barriers to fair assessment)
- explore perceptions of managers and staffing advisors regarding staffing advice on employment equity considerations and testing accommodation measures
Methodology
For this report, results from the 2018 Staffing and Non-Partisanship SurveyEndnote E1 for the 4 designated employment equity groups have been compared against results for persons in their comparator groups. Comparator groups are the people who do not belong to the particular employment equity group being looked at. The full list of comparator groups is in Appendix 2 of this report. Respondents who are in more than one employment equity group were included in the analysis of each group under consideration.
Endnote E2Survey results for each group were further split by gender. As a result, this report provides an intersectional analysis by employment equity group and gender.
Perceptions of merit, fairness and transparency
This report analyzes overall perceptions of merit, fairness and transparency in staffing activities in respondents’ work units by examining whether employees feel that:
- staffing activities are carried out in a transparent way
- people hired can do the job
- appointments depend on who you know
- the process of selecting a person for a position is done fairly
The report also explores the extent to which managers feel:
- external pressure to hire a particular employee
- a sense of personal indebtedness to one or more employees
- that appointees meet performance expectations
- that appointees are a good fit for their teams
Perceptions of testing accommodation measures and employment equity considerations
This report also looks into testing accommodation measures and employment equity considerations by analyzing:
- the proportion of employees with disabilities who requested testing accommodation measures, as well as their level of satisfaction with those measures
- staffing advisors’ perceptions of how their advice influences testing accommodation measures and employment equity considerations
- managers’ satisfaction with the advice provided by staffing advisors on testing accommodation measures and employment equity considerations
The results in this report are based on full-time indeterminate and term employees. Also included are managers who are members of the regular Canadian Armed Forces or the Royal Canadian Mounted Police, and who conduct staffing activities under the Public Service Employment Act. Part-time and seasonal employees, casuals, students, contractors, Governor-in-Council appointees and ministers’ exempt staff are excluded from this analysis.
Perceptions of merit, fairness and transparency
This section first presents a brief overview of:
- the work locations of survey respondents and all public servants under the Public Service Employment Act
- responses to questions on the themes of merit, fairness and transparency
Next, each employment equity group is presented in subsections that:
- outline some of the characteristics of those who indicated they belong to an employment equity group
- elaborate on their responses to questions related to merit, appointments being dependent on who you know, fairness, and transparency
- compare the responses by members of the employment equity group against their comparator groups
Finally, a summary of the responses of members of employment equity groups organized by theme (merit, appointments being dependent on who you know, fairness and transparency) is presented at the end of this section.
The survey themes are explored through questions about appointments to the respondents’ work units. The themes examined in this section are:
- Merit: survey respondents were asked how much they agree with the statement “I believe that we hire people who can do the job”
- respondents who indicated they “somewhat agree” or “strongly agree” with the statement are considered to have given a positive response
- Who you know: survey respondents were asked how much they agree with the statement “Appointments depend on who you know”
- since this a negatively worded question, respondents who indicated they “somewhat disagree” or “strongly disagree” that appointments depend on who you know are considered to have given a positive response
- Fairness: survey respondents were asked how much they agree with the statement “The process of selecting a person for a position is done fairly”
- respondents who indicated they “somewhat agree” or “strongly agree” with the statement are considered to have given a positive response
- Transparency: survey respondents were asked how much they agree with the statement “Staffing activities are carried out in a transparent way”
- respondents who indicated they “somewhat agree” or “strongly agree” with the statement are considered to have given a positive response
Work locations
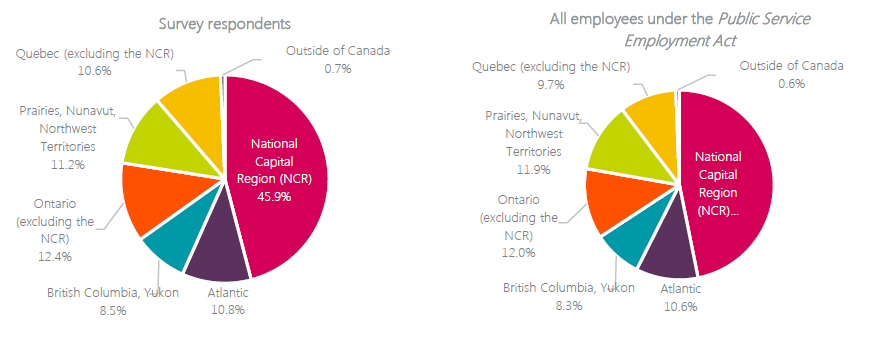
As shown in Figure 1 below, the distribution of survey respondents’ work locations is similar to the location breakdown of all employees under the Public Service Employment ActEndnote E3.
A majority of employees work in the National Capital Region, although a slightly smaller proportion of respondents work in that region compared to all employees (45.9% vs 46.8%).
When compared to all employees, similar proportions of survey respondents work in the same regions outside of the National Capital Region. Although a slightly smaller proportion of respondents work in the Prairies, Nunavut and Northwest Territories (11.2%) when compared to all employees (11.9%), other regions outside the National Capital Region have a slightly larger proportion of survey respondents working in them. This is most pronounced in Quebec excluding the National Capital Region (10.6% vs 9.7%) and Ontario excluding the National Capital Region (12.4% vs 12%), where proportionally more survey respondents work compared to all employees.
Table 6 in Appendix 3 provides detailed results for all groups by key demographic characteristics.
Figure 1:
Work locations of survey respondents and employees under the Public Service Employment Act
Text Alternative
| Survey respondents | All employees under the Public Service Employment Act | |
|---|---|---|
| National Capital Region | 45.9% | 46.8% |
| Atlantic | 10.8% | 10.6% |
| British Columbia, Yukon | 8.5% | 8.3% |
| Ontario (excluding the National Capital Region) | 12.4% | 12.0% |
| Prairies, Nunavut, Northwest Territories | 11.2% | 11.9% |
| Quebec (excluding the National Capital Region) | 10.6% | 9.7% |
| Outside of Canada | 0.7% | 0.6% |
Responses to questions on the themes of merit, fairness and transparency
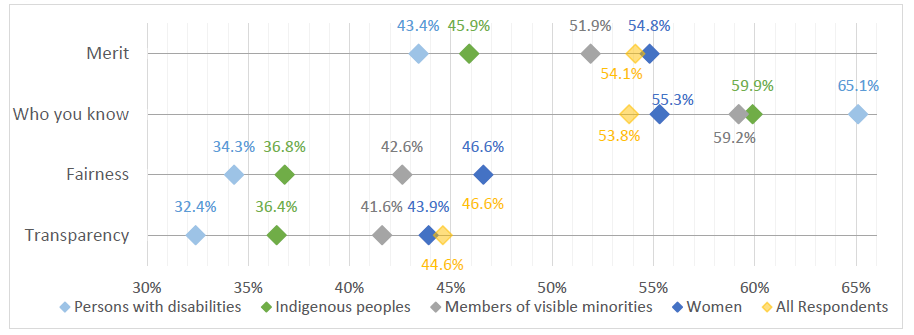
Figure 2 below shows the overall positive responses for each of the 4 employment equity groups and for all respondents. Respondents in all groups had a higher positive response rate on questions related to merit than to either fairness or transparency. The question of transparency received the lowest positive response rate overall.
Over half of women (54.8%) and visible minorities (51.9%) gave positive responses about merit in the hiring process. Less than half of Indigenous peoples (45.9%) and persons with disabilities (43.4%) held the same view. When asked if the process of hiring is done fairly, women had the highest positive response rate of any group (46.6%), while persons with disabilities had the lowest positive response rate (34.3%). When asked if staffing practices are transparent, women again had the highest positive response rate (43.9%), and persons with disabilities had the lowest (32.4%).
Figure 2:
Summary of positive responses by employment equity group on merit, fairness and transparencyEndnote E4

Text Alternative
| Merit | Fairness | Transparency | |
|---|---|---|---|
| Indigenous peoples | 45.9% | 36.8% | 36.4% |
| Persons with disabilities | 43.4% | 34.3% | 32.4% |
| Members of visible minorities | 51.9% | 42.6% | 41.6% |
| Women | 54.8% | 46.6% | 43.9% |
| All respondents | 54.1% | 46.6% | 44.6% |
Note: “All respondents” consists of respondents who indicated their gender was either male or female. Due to their small population, this report excludes those who stated “Other” as their gender or chose not to respond (please refer to Table 5 in Appendix 2).
Women
The analysis of this employment equity group is based on respondents who identified their gender as female in the survey.Endnote E5 Respondents were asked if they were male, female or other.Endnote E6
Women accounted for approximately 56.8% of survey respondents, compared to 52.5% of the available Canadian workforce and 52.5% of the public service population.Endnote E7 Proportionally more women (46.8%) than men (41.2%) applied to an advertised process in 2017; 49.9% of women who applied were offered a position or placed in a pool, a larger proportion than men (47.7%).
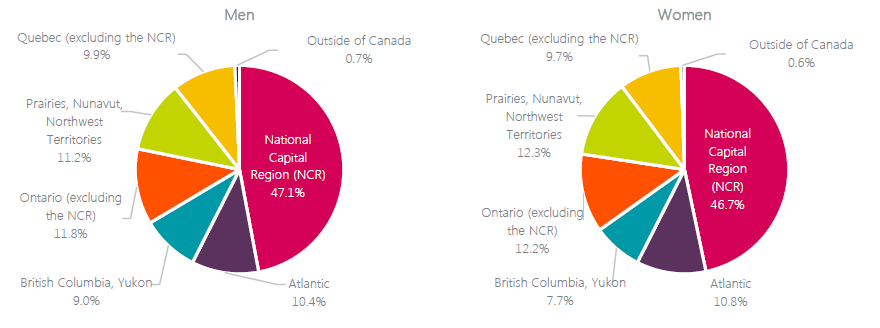
The distribution of women and men by work location is similar. A slightly larger proportion of men work in the National Capital Region (47.1%) than women (46.7%).
Figure 3:
Breakdown of work locations for women and men
Text Alternative
| Men | Women | |
|---|---|---|
| National Capital Region | 47.1% | 46.7% |
| Atlantic | 10.4% | 10.8% |
| British Columbia, Yukon | 9.0% | 7.7% |
| Ontario (excluding the National Capital Region) | 11.8% | 12.2% |
| Prairies, Nunavut, Northwest Territories | 11.2% | 12.3% |
| Quebec (excluding the National Capital Region) | 9.9% | 9.7% |
| Outside of Canada | 0.7% | 0.6% |
Merit
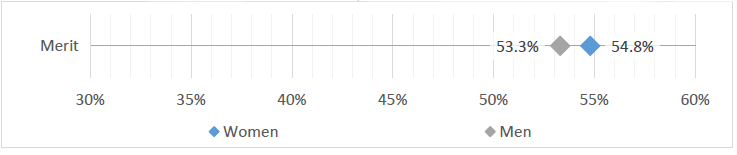
When asked if recent hires can do the job, proportionally more women agreed than men. Among women, 54.8% agreed compared to 53.3% of men, as outlined in Figure 4 below.
Figure 4:
Positive responses regarding merit
Text Alternative
| Merit | |
|---|---|
| Women | 54.8% |
| Men | 53.3% |
Who you know
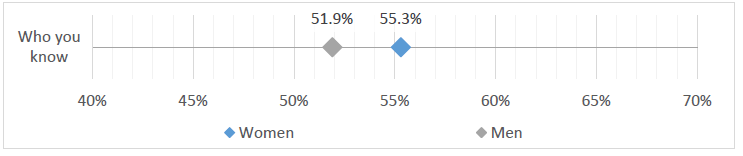
As shown in Figure 5 below, a larger percentage of women agreed when asked if appointments depend on who you know. Among women, 55.3% agreed that appointments depend on who you know compared to 51.9% of all men.
Figure 5:
Agreement that appointments depend on who you know
Text Alternative
| Who you know | |
|---|---|
| Women | 55.3% |
| Men | 51.9% |
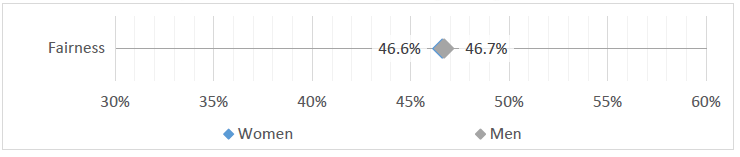
Fairness
When asked if staffing in their work unit is conducted fairly, a similar percentage of men and women gave positive responses. Figure 6 below shows that 46.6% of women and 46.7% of men agreed that the staffing process is done fairly.
Figure 6:
Positive responses regarding fairness
Text Alternative
| Fairness | |
|---|---|
| Women | 46.6% |
| Men | 46.7% |
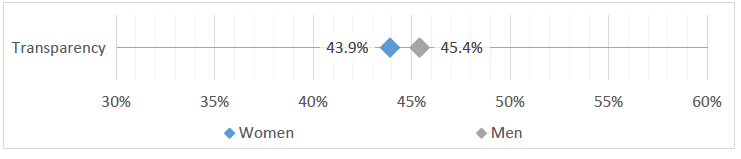
Transparency
A slightly smaller percentage of women than men gave positive responses on the topic of transparency in staffing. Only 43.9% of all women agreed that staffing is carried out transparently, compared to 45.4% of all men, as shown in Figure 7 below.
Figure 7:
Positive responses regarding transparency
Text Alternative
| Transparency | |
|---|---|
| Women | 43.9% |
| Men | 45.4% |
Indigenous peoples
Survey respondents were asked if they were an Indigenous person (specifically First Nations, Métis or Inuit); the analysis of this employment equity group is based on respondents who answered that they are an Indigenous person.Endnote E8
Indigenous peoples accounted for approximately 4.6% of survey respondents, compared to 3.4% of the available Canadian workforce and 5.2% of the public service population.Endnote E9 In terms of gender, 5% of women and 3.9% of men who responded to the survey identified themselves as Indigenous. A slightly smaller share of Indigenous men (42.5%) applied to advertised processes than Indigenous women (47.4%). Of those who applied, however, similar proportions received an offer or were placed in a pool (46.4% for Indigenous men and 47.2% for Indigenous women).
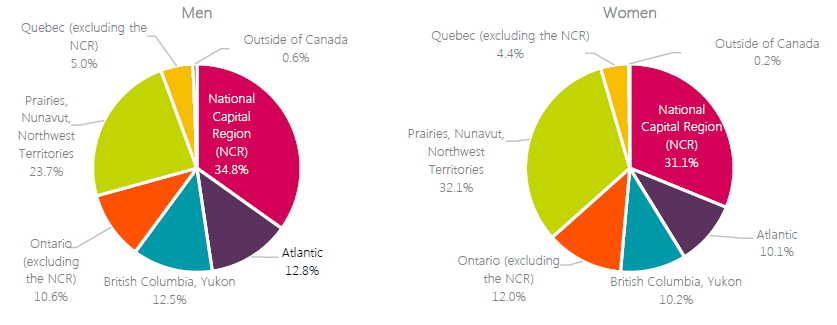
Although 47.1% of all men work in the National Capital Region, only 34.8% of Indigenous men work in the region. A similar pattern is observed for Indigenous women, as 31.1% of Indigenous women work in the National Capital Region, compared to 46.7% of all women.
Figure 8:
Breakdown of work locations of Indigenous peoples
Text Alternative
| Men | Women | |
|---|---|---|
| National Capital Region | 34.8% | 31.1% |
| Atlantic | 12.8% | 10.1% |
| British Columbia, Yukon | 12.5% | 10.2% |
| Ontario (excluding the National Capital Region) | 10.6% | 12.0% |
| Prairies, Nunavut, Northwest Territories | 23.7% | 32.1% |
| Quebec (excluding the National Capital Region) | 5.0% | 4.4% |
| Outside of Canada | 0.6% | 0.2% |
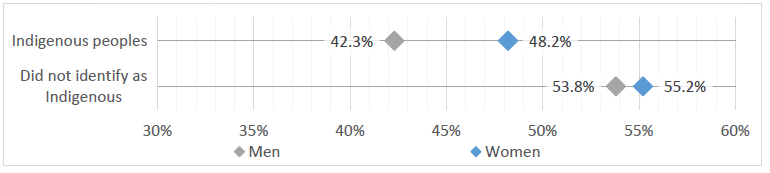
Merit
When asked if people hired in their work unit can do the job, a smaller percentage of Indigenous men gave positive responses than men who did not identify as Indigenous (42.3% vs. 53.8%). As seen in Figure 9 below, Indigenous women were proportionally more positive than Indigenous men, although they still had a lower positive response rate than women who did not identify as Indigenous (48.2% vs. 55.2%).
Figure 9:
Positive responses regarding merit
Text Alternative
| Men | Women | |
|---|---|---|
| Indigenous peoples | 42.3% | 48.2% |
| Did not identify as Indigenous | 53.8% | 55.2% |
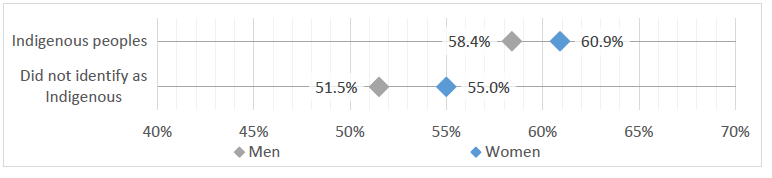
Who you know
A larger percentage of Indigenous men than their comparator group agreed that appointments depend on who you know (58.4% vs 51.5%). This is also true of Indigenous women and their comparator, although, as seen in Figure 10, the difference is not as large (60.9% vs 55%).
Figure 10:
Agreement that appointments depend on who you know
Text Alternative
| Men | Women | |
|---|---|---|
| Indigenous peoples | 58.4% | 60.9% |
| Did not identify as Indigenous | 51.5% | 55.0% |
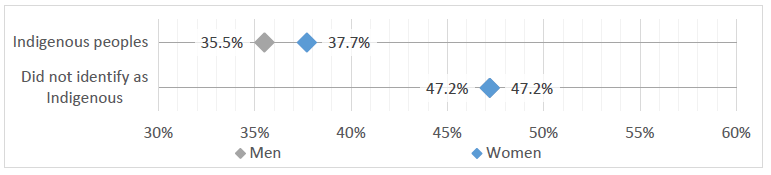
Fairness
When asked if the process of selecting a person for a position is done fairly, Indigenous men and women also had a lower positive response rate than men and women who did not identify as Indigenous, as shown in Figure 11. While 35.5% of Indigenous men and 37.7% of Indigenous women agreed with the statement, identical proportions of men and women who did not identify as Indigenous agreed (47.2%).
Figure 11:
Positive responses regarding fairness
Text Alternative
| Men | Women | |
|---|---|---|
| Indigenous peoples | 35.5% | 37.7% |
| Did not identify as Indigenous | 47.2% | 47.2% |
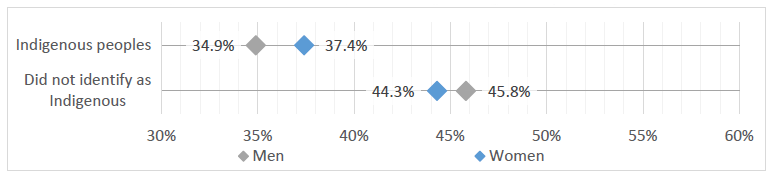
Transparency
As Figure 12 illustrates, a smaller percentage of Indigenous respondents gave positive responses on the topic of transparency than respondents who did not identify as Indigenous. A lower proportion of Indigenous men (34.9%) and Indigenous women (37.4%) believed that staffing was carried out in a transparent way compared to men (45.8%) and women (44.3%) who did not identify as Indigenous.
Figure 12:
Positive responses regarding transparency
Text Alternative
| Men | Women | |
|---|---|---|
| Indigenous peoples | 34.9% | 37.4% |
| Did not identify as Indigenous | 45.8% | 44.3% |
Members of visible minorities
Survey respondents who did not identify themselves as Indigenous peoples were asked whether they belong to one or more racial or cultural groups.Endnote E10 Members of visible minorities are defined as respondents who selected one or more racial or cultural group other than white.
Approximately 15.8% of survey respondents indicated that they were members of visible minorities, compared to 13% of the available Canadian workforce and 14.5% of the public service population.Endnote E11 In terms of gender, 14.7% of women and 16.4% of men who responded to the survey identified themselves as members of visible minorities. Over half of visible minority men (52%) and women (57.2%) who responded to the survey applied to an advertised process in 2017, proportionally more than any other employment equity group. Just under half of these applicants received an offer or were placed in a pool (46.1% for both men and women).
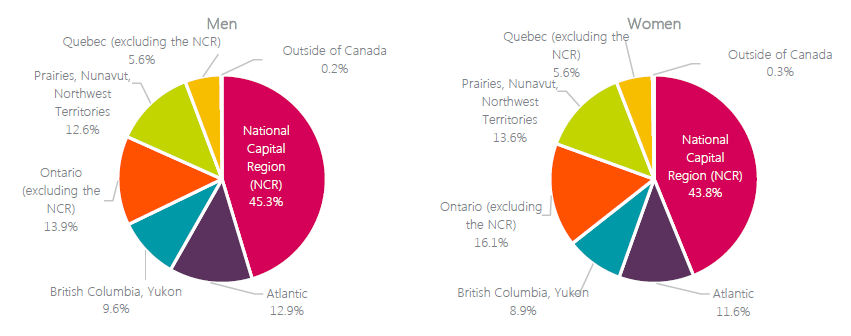
A somewhat larger proportion of visible minority men (50.3%) work in the National Capital Region than all men (47.1%). The pattern is similar for visible minority women (48.3%) when compared to all women (46.7%).
Figure 13:
Breakdown of work locations of members of visible minorities

Text Alternative
| Men | Women | |
|---|---|---|
| National Capital Region | 50.3% | 48.3% |
| Atlantic | 3.1% | 2.5% |
| British Columbia, Yukon | 11.4% | 11.8% |
| Ontario (excluding the National Capital Region) | 16.3% | 18.4% |
| Prairies, Nunavut, Northwest Territories | 10.3% | 9.5% |
| Quebec (excluding the National Capital Region) | 8.0% | 8.8% |
| Outside of Canada | 0.7% | 0.7% |
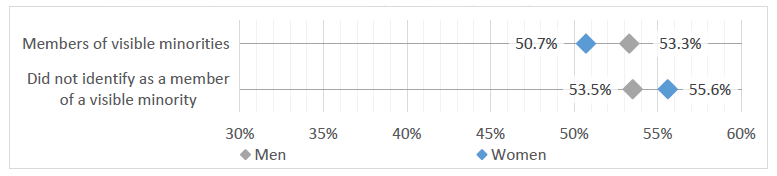
Merit
Half (50.7%) of visible minority women agreed that hires can do the job. This proportion is lower than that of women who are not members of visible minorities (55.6%), who had the highest positive response rate of all groups. In contrast, as Figure 14 below shows, an almost identical percentage of visible minority men and men who are not members of visible minorities gave positive responses, with 53.3% and 53.5% in agreement respectively.
Figure 14:
Positive responses regarding merit
Text Alternative
| Men | Women | |
|---|---|---|
| Members of visible minorities | 53.3% | 50.7% |
| Did not identify as members of visible minorities | 53.5% | 55.6% |
Who you know
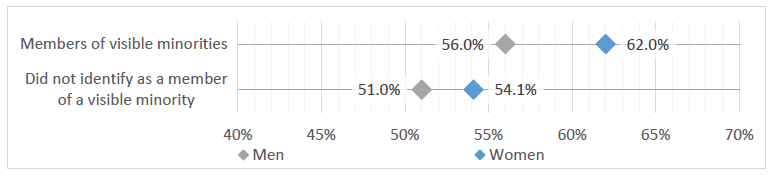
When asked if appointments depend on who you know, a smaller percentage of visible minority men agreed than men in other employment equity groups. However, as Figure 15 illustrates, 56% of visible minority men agreed appointments depend on who you know, proportionally more than men who are not members of visible minorities (51%). A larger percentage of visible minority women agreed than women who are not members of visible minorities (62% vs 54.1%).
Figure 15:
Agreement that appointments depend on who you know
Text Alternative
| Men | Women | |
|---|---|---|
| Members of visible minorities | 56.0% | 62.0% |
| Did not identify as members of visible minorities | 51.0% | 54.1% |
Fairness
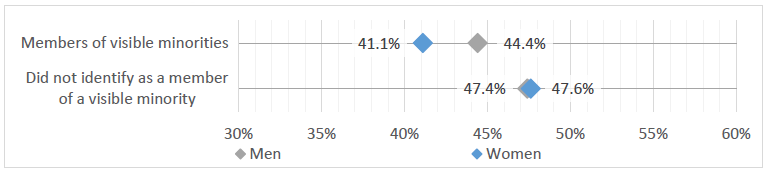
As outlined in Figure 16, members of visible minorities had a lower positive response rate than their comparator group regarding fairness of the staffing process within their work unit (44.4% of visible minority men and 41.1% of visible minority women agree that staffing processes are fair compared to 47.4% of men and 47.6% of women who are not members of visible minorities).
Figure 16:
Positive responses regarding fairness
Text Alternative
| Men | Women | |
|---|---|---|
| Members of visible minorities | 44.4% | 41.1% |
| Did not identify as members of visible minorities | 47.4% | 47.6% |
Transparency
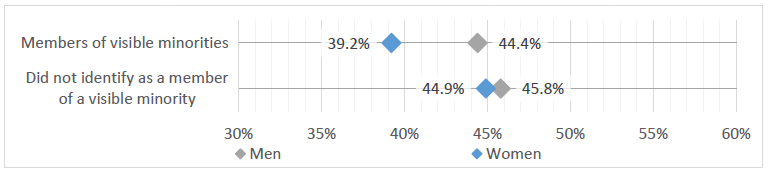
As shown in Figure 17, a slightly smaller percentage of visible minority men gave positive responses on transparency in staffing than men who are not members of visible minorities (44.4% vs 45.8%). An even smaller percentage of visible minority women agreed that staffing is carried out in a transparent way in comparison to women who are not members of visible minorities (39.2% vs 44.9%).
Figure 17:
Positive responses regarding transparency
Text Alternative
| Men | Women | |
|---|---|---|
| Members of visible minorities | 44.4% | 39.2% |
| Did not identify as a member of a visible minority | 45.8% | 44.9% |
Visible minority groups
Survey respondents were also asked to indicate if they belonged to one or more racial or cultural groups (see Table 17 for full breakdown). Filipino respondents had the highest positive response rate of all sub-groups regarding merit, fairness and transparency, while Japanese and Korean respondents had the lowest positive response rate. While Black respondents had the second highest positive response rate regarding hiring employees who can do the job, their positive response rate regarding fairness and transparency of staffing processes was one of the lowest.
Persons with disabilities
Survey respondents were asked to indicate whether they are a person with a disability.Endnote E12 The analysis of this employment equity group is based on respondents who indicated they have a disability.
Approximately 6.6% of survey respondents identified as being persons with disabilities, compared to 4.4% of the available Canadian workforce and 5.6% of the public service population.Endnote E13 By gender, 6.4% of women and 6.7% of men who responded to the survey self-identified as persons with disabilities. Just under half of women (47.7%) with disabilities who responded to the survey had applied to an advertised process in 2017, a slightly larger proportion than men (44.5%). Somewhat less than half of those women (45.5%) who applied were offered a position or placed in a pool, a slightly larger share than men (42.9%).
A slightly smaller proportion of persons with disabilities occupy positions in the National Capital Region compared to all respondents. Among men with disabilities, 45.3% work in the National Capital Region compared to 47.1% of all men. Among women with disabilities, 43.8% work in the National Capital Region compared to 46.7% of all women.
Figure 18:
Breakdown of work locations of persons with disabilities
Text Alternative
| Men | Women | |
|---|---|---|
| National Capital Region | 45.3% | 43.8% |
| Atlantic | 12.9% | 11.6% |
| British Columbia, Yukon | 9.6% | 8.9% |
| Ontario (excluding the National Capital Region) | 13.9% | 16.1% |
| Prairies, Nunavut, Northwest Territories | 12.6% | 13.6% |
| Quebec (excluding the National Capital Region) | 5.6% | 5.6% |
| Outside of Canada | 0.2% | 0.3% |
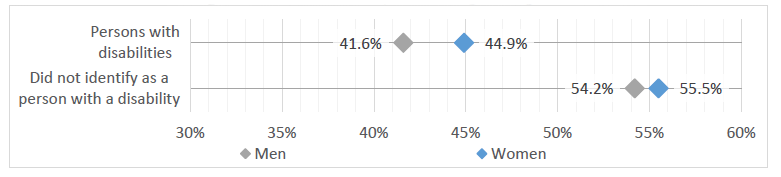
Merit
Men with disabilities had the lowest level of agreement among all groups when asked if people hired in their work unit can do the job. As shown in Figure 19, 41.6% of men with disabilities indicated that hires can do the job, a much lower rate than men who did not identify as a person with a disability (54.2%). Women with disabilities had a slightly higher positive response rate (44.9%), although still notably lower than women who did not identify as a person with a disability (55.5%).
Figure 19:
Positive responses regarding merit
Text Alternative
| Men | Women | |
|---|---|---|
| Persons with disabilities | 41.6% | 44.9% |
| Did not identify as persons with disabilities | 54.2% | 55.5% |
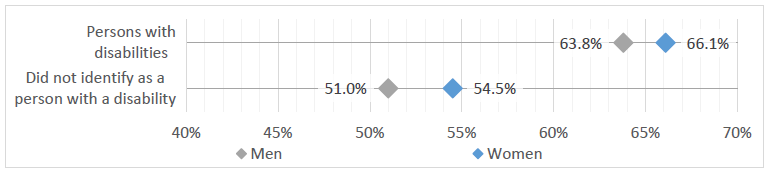
Who you know
Of all groups, women with disabilities agreed at the highest rate that appointments depend on who you know (66.1%). That is much higher than that of women who did not identify as a person with a disability (54.5%). Similarly, as seen in Figure 20, men with disabilities agreed at a higher rate than men who did not identify as a person with a disability (63.8% vs. 51%).
Figure 20:
Agreement that appointments depend on who you know
Text Alternative
| Men | Women | |
|---|---|---|
| Persons with disabilities | 63.8% | 66.1% |
| Did not identify as persons with disabilities | 51.0% | 54.5% |
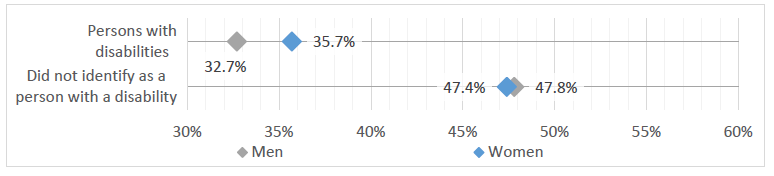
Fairness
Men with disabilities had the lowest positive response rate among all groups when asked about staffing fairness in their work unit; only 32.7% agreed that staffing activities are done fairly. As shown in Figure 21, this is a smaller percentage than men who did not identify as a person with a disability, who had the highest positive response rate (47.8%) of all groups. Women with disabilities also agreed at a lower rate (35.7%) than women who did not identify as a person with a disability (47.4%).
Figure 21:
Positive responses regarding fairness
Text Alternative
| Men | Women | |
|---|---|---|
| Persons with disabilities | 32.7% | 35.7% |
| Did not identify as persons with disabilities | 47.8% | 47.4% |
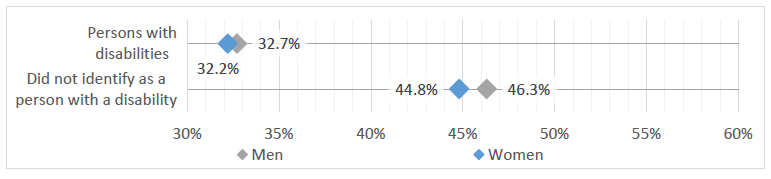
Transparency
Women with disabilities had the lowest positive response rate of all respondents when asked if staffing is carried out in a transparent way, much lower than women who did not identify as a person with a disability (32.2% vs. 44.8%). Men with disabilities also responded proportionally lower (32.7%) than men who did not identify as a person with a disability (46.3%), as seen in Figure 22 below.
Figure 22:
Positive responses regarding transparency
Text Alternative
| Men | Women | |
|---|---|---|
| Persons with disabilities | 32.7% | 32.2% |
| Did not identify as persons with disabilities | 46.3% | 44.8% |
Summary
Figure 23:
Summary of positive responses regarding merit, fairness and transparency
Text Alternative
| Merit | Who you know | Fairness | Transparency | |
|---|---|---|---|---|
| Women | 54.8% | 55.3% | 46.6% | 43.9% |
| Indigenous peoples | 45.9% | 59.9% | 36.8% | 36.4% |
| Persons with disabilities | 43.4% | 65.1% | 34.3% | 32.4% |
| Members of visible minorities | 51.9% | 59.2% | 42.6% | 41.6% |
| All respondents | 54.1% | 53.8% | 46.6% | 44.6% |
Note: “All respondents” consists of respondents who indicated their gender as either male or female, and excludes those who stated “Other” or chose not to respond.
Merit
While 54.1% of all respondents indicated that people hired in their work unit can do the job, Indigenous peoples and persons with disabilities had a lower positive response rate than other groups. Less than half of Indigenous peoples and persons with disabilities, regardless of gender, agreed with the statement, contrasting with other employment equity groups.
Men with disabilities had the lowest positive response rate (41.6%) among all groups, while women who are not members of visible minorities had the highest positive response rate (55.6%). A majority of men (53.3%) and women (54.8%) agreed that the people hired can do the job.
Who you know
While 53.8% of all respondents, regardless of employment equity status, indicated that appointments in their work unit depend on who you know, a higher proportion of employment equity group members agreed than their respective comparator groups.
Women with disabilities agreed at the highest rate among all groups (66.1%) that appointments depend on who you know. Men who did not identify as a person with a disability (51%) and men who are not members of visible minorities (51%) agreed at the lowest rate of all groups. Altogether, men (51.9%) agreed at a lower rate than women (55.3%).
Fairness
While only 46.6% of all respondents, regardless of employment equity status, indicated that staffing activities in their work unit are conducted fairly, a smaller proportion of employment equity group members share that view. Less than 40% of Indigenous peoples and persons with disabilities agreed that staffing is conducted fairly.
Men with disabilities had the lowest positive response rate of all groups (32.7%) while men without disabilities had the highest (47.8%). An almost identical proportion of men and women gave positive responses (46.7% vs 46.6%).
Transparency
Overall, 44.6% of all respondents indicated that staffing activities within their work unit are carried out in a transparent way. Indigenous peoples (36.4%) and persons with disabilities (32.4%) had lower positive response rates than other groups.
Women with disabilities had the lowest positive response rate of any employee group (32.2%) while men who did not identify as a person with a disability had the highest rate (46.3%). Overall, men had a higher percentage of positive responses than women (45.4% vs 43.9%).
Managers
In general, managers in all groups did not feel pressure to hire a particular employee or feel indebtedness to employees. Managers also generally agreed that hires meet performance expectations and are a good fit for their team. Proportionally, managers belonging to employment equity groups were slightly less positive than their comparators, but the differences were usually minor.
As seen in Table 1 below, managers who belong to an employment equity group felt somewhat more pressure to hire a particular employee than their comparators. Men with disabilities in particular were the only group where more than 20% reported feeling moderate or great pressure, at 21.8%. This is a higher rate than their comparator group; 11.8% of men who do not have a disability reported feeling pressure to hire, the lowest proportion among all groups. Men and women had a proportionally similar response rate overall, as 12.3% of men and 12.9% of women reported feeling pressure to hire a particular employee.
| Men | Women | |
|---|---|---|
| Indigenous peoples | 16.2% | 15.7% |
| Did not identify as Indigenous | 12.2% | 12.7% |
| Members of visible minorities | 14.3% | 17.2% |
| Did not identify as members of visible minorities | 12.0% | 12.3% |
| Persons with disabilities | 21.8% | 19.4% |
| Did not identify as persons with disabilities | 11.8% | 12.5% |
| All | 12.3% | 12.9% |
Less than 10% of each manager group felt moderate or great personal indebtedness to one or more employees, as shown in Table 2. Visible minority women reported feeling the most indebted at 9.3%, a higher rate than women who are not members of visible minorities (6.1%). Indigenous women had the lowest percentage of respondents feeling personal indebtedness, at 5.8%, although only marginally lower than their comparator group (6.4%). Again, men and women provided similar responses overall, with an identical proportion of men and women feeling indebted to employees.
| Men | Women | |
|---|---|---|
| Indigenous peoples | 6.9% | 5.8% |
| Did not identify as Indigenous | 6.4% | 6.4% |
| Members of visible minorities | 8.0% | 9.3% |
| Did not identify as members of visible minorities | 6.2% | 6.1% |
| Persons with disabilities | 8.3% | 6.9% |
| Did not identify as persons with disabilities | 6.3% | 6.4% |
| All | 6.4% | 6.4% |
As Table 3 shows, managers in all employee groups agreed that recent hires meet performance expectations. Indigenous men reported the lowest level of agreement at 87.9%, somewhat lower than men who did not identify as Indigenous (92.4%). Proportionally, men and women gave similar responses, as 92.2% of men and 91.6% of women agreed that recent hires met expectations.
| Men | Women | |
|---|---|---|
| Indigenous peoples | 87.9% | 89.9% |
| Did not identify as Indigenous | 92.4% | 91.7% |
| Members of visible minorities | 92.3% | 90.5% |
| Did not identify as members of visible minorities | 92.2% | 91.8% |
| Persons with disabilities | 89.2% | 89.2% |
| Did not identify as persons with disabilities | 92.4% | 91.8% |
| All | 92.2% | 91.6% |
As outlined in Table 4, managers agreed that recent hires are a good fit within their teams. Indigenous men reported the lowest level of agreement at 87%, lower than men who did not identify as Indigenous (93%). Proportionally, men and women had a similar response rate, as 92.7% of men and 92.1% of women agreed that recent hires are a good fit.
| Men | Women | |
|---|---|---|
| Indigenous peoples | 87.0% | 88.8% |
| Did not identify as Indigenous | 93.0% | 92.3% |
| Members of visible minorities | 92.9% | 91.7% |
| Did not identify as members of visible minorities | 92.8% | 92.3% |
| Persons with disabilities | 90.6% | 90.2% |
| Did not identify as persons with disabilities | 92.9% | 92.2% |
| All | 92.7% | 92.1% |
Testing accommodation measures and employment equity considerations
Persons with disabilities
If invited to write a test for a job they applied for, persons with disabilities can request testing accommodation measures. Testing accommodation measures are changes made to the procedures, format or content of an assessment to remove barriers to a fair assessment and allow candidates to fully demonstrate their competency. A team of consultants determines testing accommodation measures on a case-by-case basis, depending on the nature and extent of the functional limitations presented by the candidate.
Survey respondents who are persons with disabilities were asked if they requested testing accommodation measures in 2017 and how satisfied they were with those accommodation measures. Most persons with disabilities did not request testing accommodation measures (87.7%). This is consistent with the 2019 Survey on Workplace Accommodations in the Federal Public Service, conducted by the Treasury Board of Canada Secretariat’s Office of Public Service Accessibility, which shows that only a very small proportion of disability accommodation requests in the past three years were related to a staffing process. Of those Staffing and Non-Partisanship Survey respondents who did make a request, two-thirds (66.1%) indicated they were satisfied to a moderate or great extent with the testing accommodation measures provided.
Managers and staffing advisors
Two-thirds (66.1%) of staffing advisors indicated that managers sought their strategic input on testing accommodation measures for candidates. Of these, 80.7% agreed that their strategic input on testing accommodation measures influenced managers’ staffing actions.
More than half (56.2%) of staffing advisors indicated that managers sought their strategic input on employment equity considerations. Of these, 76.7% agreed that their strategic input on employment equity considerations influenced managers’ staffing actions.
In the survey, managers were asked the extent to which staffing advisors provided them with useful staffing advice. Among those who indicated that staffing advice provided was not useful (16.7%), a very small percentage of managers noted that advice on testing accommodation measures and advice on employment equity considerations was not useful (15.4% and 11.8% respectively).
Conclusion
Based on the results of the 2018 Staffing and Non-Partisanship Survey, this report shows that employees who belong to an employment equity group are generally less positive than their comparator groups about merit, fairness and transparency in the staffing system.
Looking at merit, women have a more positive perception than men. Visible minority men’s perceptions of merit are similar to men who are not members of a visible minority. Regarding fairness, employment equity groups had less positive perceptions in general, although women and men held similar views. Finally, all employment equity groups had a less positive perception of transparency in staffing.
Worth noting, the Public Service Commission has undertaken several projects and studies focused on employment equity groups, such as the 2018 Anonymized Recruitment Pilot Project and the Employment Equity Promotion Rate Study. The results of the Employment Equity Promotion Rate Study demonstrated that the career progression of employment equity groups was slower than their respective comparator group. These results might explain, in part, the generally less positive perceptions of merit, fairness and transparency of employees who belong to an employment equity group.
These findings are based on data from the first cycle of the Staffing and Non-Partisanship Survey and reflect a snapshot of the public service at the time of data collection. The second cycle of the survey will allow us to monitor changes in perceptions.
The Staffing and Non-Partisanship Survey data and interactive tool on Open Government offer additional information for analyzing the survey results.
Questions or comments regarding this report or the Staffing and Non-Partisanship Survey can be sent to cfp.sdip-snps.psc@cfp-psc.gc.ca.
Appendix 1 - Sources of information
Data was taken from the first cycle of the Staffing and Non-Partisanship Survey. Because the content of this survey is different from its predecessor (the Survey of Staffing), year-over-year comparisons are not always possible.
Data collection took place over a period of 8 weeks: between February 22 and April 20, 2018. The survey targeted employees, hiring managers and staffing advisors to gather their views on a wide range of staffing-related topics. In particular, questions regarding merit, fairness and transparency were used in this analysis.
Invitations to complete the survey were sent to 214 275 public servants across 74 departments and agencies subject to the Public Service Employment Act. A total of 101 892 employees completed the survey, representing an overall response rate of 47.6%.
The data presented in this report has been weighted to adjust for non-response and for respondents who did not want to share their data with the Public Service Commission. For this reason, the results can be generalized to the federal public service population in departments and agencies that are subject to the Public Service Employment Act.
The survey frame was made up of all employees who were on the October 2017 Public Services and Procurement Canada incumbent file and employee lists provided by in-scope departments and agencies that did not appear in the incumbent file.
The Canadian workforce availability and public service employment equity group representation percentages are provided by the Treasury Board of Canada Secretariat in their report: Employment Equity in the Public Service of Canada for Fiscal Year 2016 to 2017.
Appendix 2
Comparator groups
7 comparator groups were created for the purposes of this study:
- women who did not identify as an Indigenous person
- women who did not identify as a member of a visible minority
- women who did not identify as a person with a disability
- men
- men who did not identify as an Indigenous person
- men who did not identify as a member of a visible minority
- men who did not identify as a person with a disability
“Other gender” category
For the purposes of this report, “all respondents” consists of respondents who indicated their gender is either male or female. Although some respondents stated “other” or chose not to respond to the gender question, this report excludes those respondents because there were so few. This way, individual respondents cannot be identified based on their responses to demographic questions such as work location or employment equity group status.
| Non-binary |
| Transgender male/female |
| Pansexual/pangender |
| Gender neutral |
| Cisgender |
| Gender fluid |
Appendix 3 - Tables
| Indigenous peoples | Members of visible minorities | Persons with disabilities | All men | All women | All respondents | |||||||||||||
|---|---|---|---|---|---|---|---|---|---|---|---|---|---|---|---|---|---|---|
| Men | Women | Men | Women | Men | Women | |||||||||||||
| Distribution | 1 464 | 37.0% | 2 485 | 62.8% | 6 141 | 45.7% | 7 269 | 54.1% | 2 494 | 44.0% | 3 147 | 55.5% | 37 439 | 43.0% | 49 390 | 56.8% | 87 920 | 100.0% |
| Applied to an advertised process in 2017 | 621 | 42.5% | 1 175 | 47.4% | 3 188 | 52.0% | 4 152 | 57.2% | 1 108 | 44.5% | 1 495 | 47.7% | 15 391 | 41.2% | 23 084 | 46.8% | 38 929 | 44.4% |
| Received an offer or placed in a pool from application | 288 | 46.4% | 554 | 47.2% | 1 465 | 46.1% | 1 909 | 46.1% | 474 | 42.9% | 683 | 45.8% | 7 325 | 47.7% | 11 491 | 49.9% | 19 011 | 48.8% |
| First official language | ||||||||||||||||||
| English | 1 102 | 75.4% | 1 843 | 74.3% | 4 789 | 78.1% | 5 785 | 79.8% | 1 972 | 79.3% | 2 433 | 77.4% | 25 761 | 69.0% | 32 753 | 66.5% | 59 299 | 67.7% |
| French | 359 | 24.6% | 637 | 25.7% | 1 345 | 21.9% | 1 466 | 20.2% | 516 | 20.7% | 709 | 22.6% | 11 600 | 31.0% | 16 509 | 33.5% | 28 280 | 32.3% |
| Age | ||||||||||||||||||
| 24 years and under | 15 | 1.0% | 54 | 2.2% | 203 | 1.6% | 383 | 2.8% | 11 | 0.4% | 29 | 0.9% | 468 | 1.3% | 901 | 1.8% | 1 380 | 1.6% |
| 25 to 29 years | 52 | 3.6% | 127 | 5.1% | 740 | 6.0% | 1 293 | 9.3% | 67 | 2.7% | 105 | 3.3% | 1 892 | 5.1% | 3 310 | 6.7% | 5 241 | 6.0% |
| 30 to 34 years | 124 | 8.5% | 211 | 8.5% | 1 221 | 9.8% | 1 770 | 12.7% | 150 | 6.0% | 184 | 5.9% | 3 446 | 9.2% | 4 916 | 10.0% | 8 447 | 9.7% |
| 35 to 39 years | 190 | 13.0% | 342 | 13.8% | 1 737 | 14.0% | 2 263 | 16.3% | 222 | 8.9% | 346 | 11.0% | 4 857 | 13.0% | 7 151 | 14.5% | 12 123 | 13.9% |
| 40 to 44 years | 225 | 15.4% | 376 | 15.2% | 2 016 | 16.3% | 2 499 | 18.0% | 324 | 13.0% | 484 | 15.4% | 5 638 | 15.1% | 8 106 | 16.5% | 13 865 | 15.9% |
| 45 to 49 years | 269 | 18.4% | 458 | 18.5% | 2 116 | 17.1% | 2 102 | 15.1% | 378 | 15.2% | 564 | 18.0% | 5 878 | 15.7% | 7 804 | 15.9% | 13 818 | 15.8% |
| 50 to 54 years | 276 | 18.9% | 469 | 18.9% | 1 908 | 15.4% | 1 845 | 13.3% | 531 | 21.4% | 624 | 19.9% | 6 591 | 17.6% | 8 248 | 16.8% | 14 986 | 17.2% |
| 55 to 59 years | 203 | 13.9% | 303 | 12.2% | 1 478 | 11.9% | 1 102 | 7.9% | 507 | 20.4% | 508 | 16.2% | 5 378 | 14.4% | 5 937 | 12.1% | 11 402 | 13.1% |
| 60 years and over | 106 | 7.3% | 137 | 5.5% | 979 | 7.9% | 639 | 4.6% | 296 | 11.9% | 297 | 9.5% | 3 204 | 8.6% | 2 838 | 5.8% | 6 099 | 7.0% |
| Years in the federal public service | ||||||||||||||||||
| Less than a year | 29 | 2.0% | 91 | 3.7% | 236 | 3.8% | 266 | 3.7% | 52 | 2.1% | 65 | 2.1% | 1 165 | 3.1% | 1 623 | 3.3% | 2 806 | 3.2% |
| 1 year to less than 3 years | 87 | 6.0% | 203 | 8.2% | 687 | 11.2% | 933 | 12.9% | 143 | 5.7% | 174 | 5.5% | 3 024 | 8.1% | 4 569 | 9.3% | 7 645 | 8.7% |
| 3 years to less than 10 years | 309 | 21.1% | 548 | 22.1% | 1 893 | 30.9% | 2 219 | 30.6% | 429 | 17.2% | 602 | 19.2% | 8 559 | 22.9% | 11 759 | 23.9% | 20 550 | 23.4% |
| 10 years to less than 20 years | 595 | 40.7% | 1 053 | 42.5% | 2 477 | 40.4% | 2 995 | 41.3% | 971 | 39.0% | 1 386 | 44.1% | 14 496 | 38.8% | 20 317 | 41.2% | 35 247 | 40.2% |
| 20 years to less than 30 years | 302 | 20.7% | 457 | 18.4% | 663 | 10.8% | 684 | 9.4% | 567 | 22.8% | 651 | 20.7% | 6 694 | 17.9% | 8 139 | 16.5% | 15 046 | 17.2% |
| 30 years or more | 140 | 9.6% | 128 | 5.2% | 179 | 2.9% | 152 | 2.1% | 329 | 13.2% | 263 | 8.4% | 3 433 | 9.2% | 2 858 | 5.8% | 6 383 | 7.3% |
| Work location | ||||||||||||||||||
| National Capital Region | 509 | 34.8% | 772 | 31.1% | 3 083 | 50.3% | 3 509 | 48.3% | 1 129 | 45.3% | 1 378 | 43.8% | 17 594 | 47.1% | 23 026 | 46.7% | 41 063 | 46.8% |
| Atlantic | 187 | 12.8% | 250 | 10.1% | 191 | 3.1% | 178 | 2.5% | 321 | 12.9% | 365 | 11.6% | 3 891 | 10.4% | 5 314 | 10.8% | 9 304 | 10.6% |
| British Columbia Yukon | 182 | 12.5% | 253 | 10.2% | 698 | 11.4% | 859 | 11.8% | 239 | 9.6% | 281 | 8.9% | 3 364 | 9.0% | 3 792 | 7.7% | 7 289 | 8.3% |
| Ontario (excluding the National Capital Region) | 155 | 10.6% | 297 | 12.0% | 998 | 16.3% | 1 337 | 18.4% | 345 | 13.9% | 507 | 16.1% | 4 396 | 11.8% | 6 032 | 12.2% | 10 570 | 12.0% |
| Prairies Nunavut Northwest Territories | 346 | 23.7% | 795 | 32.1% | 632 | 10.3% | 690 | 9.5% | 313 | 12.6% | 427 | 13.6% | 4 191 | 11.2% | 6 090 | 12.3% | 10 434 | 11.9% |
| Quebec (excluding the National Capital Region) | 73 | 5.0% | 108 | 4.4% | 491 | 8.0% | 639 | 8.8% | 139 | 5.6% | 176 | 5.6% | 3 693 | 9.9% | 4 785 | 9.7% | 8 545 | 9.7% |
| Outside of Canada | 9 | 0.6% | 4 | 0.2% | 41 | 0.7% | 51 | 0.7% | 4 | 0.2% | 9 | 0.3% | 265 | 0.7% | 273 | 0.6% | 541 | 0.6% |
| Highest level of education | ||||||||||||||||||
| Bachelor’s degree | 409 | 28.0% | 688 | 27.7% | 2 335 | 38.1% | 3 240 | 44.6% | 693 | 27.9% | 914 | 29.1% | 12 343 | 33.0% | 16 885 | 34.2% | 29 595 | 33.7% |
| College CEGEP non-university certificate/diploma | 353 | 24.2% | 729 | 29.4% | 751 | 12.2% | 971 | 13.4% | 573 | 23.0% | 843 | 26.8% | 7 391 | 19.8% | 11 064 | 22.4% | 18 661 | 21.3% |
| High school or equivalent | 265 | 18.2% | 465 | 18.8% | 265 | 4.3% | 403 | 5.6% | 315 | 12.7% | 445 | 14.2% | 3 894 | 10.4% | 6 603 | 13.4% | 10 573 | 12.1% |
| Less than high school diploma or equivalent | 22 | 1.5% | 43 | 1.7% | 6 | 0.1% | 11 | 0.2% | 40 | 1.6% | 28 | 0.9% | 223 | 0.6% | 351 | 0.7% | 579 | 0.7% |
| Trade certificate/diploma | 171 | 11.7% | 142 | 5.7% | 151 | 2.5% | 114 | 1.6% | 247 | 9.9% | 137 | 4.4% | 2 691 | 7.2% | 1 881 | 3.8% | 4 617 | 5.3% |
| University: below bachelor's | 68 | 4.7% | 166 | 6.7% | 312 | 5.1% | 399 | 5.5% | 142 | 5.7% | 216 | 6.9% | 1 672 | 4.5% | 2 426 | 4.9% | 4 170 | 4.8% |
| University: above bachelor's | 172 | 11.8% | 247 | 10.0% | 2 315 | 37.7% | 2 121 | 29.2% | 478 | 19.2% | 557 | 17.7% | 9 171 | 24.5% | 10 092 | 20.5% | 19 511 | 22.2% |
| Group | Strongly agree | Somewhat agree | Neither agree nor disagree | Somewhat disagree | Strongly disagree | Grand Total | Positive Responses | |||||||
|---|---|---|---|---|---|---|---|---|---|---|---|---|---|---|
| Indigenous peoples: Men | 328 | 9.5% | 875 | 25.4% | 618 | 18.0% | 743 | 21.6% | 875 | 25.4% | 3 440 | 100% | 1 203 | 34.9% |
| Not identified as Indigenous: Men | 11 629 | 15.3% | 23 142 | 30.5% | 13 683 | 18.0% | 13 673 | 18.0% | 13 713 | 18.1% | 75 842 | 100% | 34 771 | 45.8% |
| Indigenous peoples: Women | 617 | 11.2% | 1 447 | 26.2% | 993 | 17.9% | 1 169 | 21.1% | 1 305 | 23.6% | 5 531 | 100% | 2 064 | 37.4% |
| Not identified as Indigenous: Women | 12 337 | 13.1% | 29 364 | 31.2% | 16 040 | 17.1% | 20 062 | 21.3% | 16 213 | 17.2% | 94 018 | 100% | 41 701 | 44.3% |
| Members of visible minorities: Men | 1 955 | 15.7% | 3 567 | 28.7% | 2 278 | 18.3% | 2 098 | 16.9% | 2 545 | 20.5% | 12 444 | 100.0% | 5 522 | 44.4% |
| Not identified as members of visible minorities: Men | 9 855 | 15.0% | 20 189 | 30.7% | 11 849 | 18.0% | 12 057 | 18.4% | 11 714 | 17.8% | 65 665 | 100.0% | 30 044 | 45.8% |
| Members of visible minorities: Women | 1 631 | 11.3% | 4 033 | 27.9% | 2 542 | 17.6% | 3 190 | 22.1% | 3 053 | 21.1% | 14 450 | 100.0% | 5 664 | 39.2% |
| Not identified as members of visible minorities: Women | 11 156 | 13.3% | 26 444 | 31.6% | 14 294 | 17.1% | 17 743 | 21.2% | 14 133 | 16.9% | 83 770 | 100.0% | 37 600 | 44.9% |
| Persons with disabilities: Men | 589 | 10.8% | 1 196 | 21.9% | 923 | 16.9% | 1 187 | 21.7% | 1 576 | 28.8% | 5 471 | 100% | 1 785 | 32.7% |
| Not identified as persons with disabilities: Men | 11 379 | 15.4% | 22 827 | 30.9% | 13 364 | 18.1% | 13 252 | 18.0% | 12 992 | 17.6% | 73 813 | 100% | 34 206 | 46.3% |
| Persons with disabilities: Women | 585 | 9.0% | 1 508 | 23.2% | 964 | 14.8% | 1 550 | 23.8% | 1 898 | 29.2% | 6 505 | 100% | 2 093 | 32.2% |
| Not identified as persons with disabilities: Women | 12 354 | 13.3% | 29 290 | 31.5% | 16 049 | 17.3% | 19 694 | 21.2% | 15 634 | 16.8% | 93 022 | 100% | 41 644 | 44.8% |
| All Men | 12 002 | 15.1% | 24 126 | 30.3% | 14 380 | 18.1% | 14 508 | 18.2% | 14 632 | 18.4% | 79 648 | 100% | 36 128 | 45.4% |
| All Women | 12 995 | 13.0% | 30 924 | 30.9% | 17 103 | 17.1% | 21 323 | 21.3% | 17 598 | 17.6% | 99 942 | 100% | 43 919 | 43.9% |
| Group | Strongly agree | Somewhat agree | Neither agree nor disagree | Somewhat disagree | Strongly disagree | Grand Total | Positive Responses | |||||||
|---|---|---|---|---|---|---|---|---|---|---|---|---|---|---|
| Indigenous peoples: Men | 370 | 10.5% | 1 122 | 31.8% | 463 | 13.1% | 989 | 28.0% | 581 | 16.5% | 3 525 | 100% | 1 492 | 42.3% |
| Not identified as Indigenous: Men | 13 454 | 17.2% | 28 542 | 36.6% | 12 530 | 16.1% | 14 710 | 18.9% | 8 791 | 11.3% | 78 027 | 100% | 41 996 | 53.8% |
| Indigenous peoples: Women | 805 | 14.3% | 1 913 | 33.9% | 904 | 16.0% | 1 316 | 23.3% | 709 | 12.6% | 5 647 | 100% | 2 718 | 48.2% |
| Not identified as Indigenous: Women | 15 724 | 16.3% | 37 520 | 38.9% | 14 286 | 14.8% | 19 275 | 20.0% | 9 737 | 10.1% | 96 542 | 100% | 53 244 | 55.2% |
| Members of visible minorities: Men | 2 251 | 17.5% | 4 593 | 35.8% | 2 260 | 17.6% | 2 230 | 17.4% | 1 501 | 11.7% | 12 833 | 100.0% | 6 843 | 53.3% |
| Not identified as members of visible minorities: Men | 11 391 | 16.9% | 24 715 | 36.6% | 10 570 | 15.7% | 13 180 | 19.5% | 7 653 | 11.3% | 67 508 | 100.0% | 36 105 | 53.5% |
| Members of visible minorities: Women | 2 139 | 14.5% | 5 369 | 36.3% | 2 432 | 16.4% | 3 067 | 20.7% | 1 793 | 12.1% | 14 800 | 100.0% | 7 508 | 50.7% |
| Not identified as members of visible minorities: Women | 14 183 | 16.5% | 33 626 | 39.1% | 12 481 | 14.5% | 17 249 | 20.1% | 8 486 | 9.9% | 86 025 | 100.0% | 47 809 | 55.6% |
| Persons with disabilities: Men | 694 | 12.3% | 1 653 | 29.3% | 842 | 14.9% | 1 337 | 23.7% | 1 110 | 19.7% | 5 636 | 100% | 2 347 | 41.6% |
| Not identified as persons with disabilities: Men | 13 133 | 17.3% | 28 040 | 36.9% | 12 118 | 16.0% | 14 388 | 18.9% | 8 249 | 10.9% | 75 928 | 100% | 41 173 | 54.2% |
| Persons with disabilities: Women | 788 | 11.8% | 2 203 | 33.1% | 959 | 14.4% | 1 657 | 24.9% | 1 055 | 15.8% | 6 661 | 100% | 2 991 | 44.9% |
| Not identified as persons with disabilities: Women | 15 728 | 16.5% | 37 231 | 39.0% | 14 222 | 14.9% | 18 919 | 19.8% | 9 415 | 9.9% | 95 514 | 100% | 52 959 | 55.5% |
| All Men | 13 884 | 16.9% | 29 783 | 36.4% | 13 075 | 16.0% | 15 784 | 19.3% | 9 406 | 11.5% | 81 932 | 100% | 43 667 | 53.3% |
| All Women | 16 582 | 16.2% | 39 599 | 38.6% | 15 239 | 14.9% | 20 667 | 20.1% | 10 507 | 10.2% | 102 594 | 100% | 56 181 | 54.8% |
| Group | Strongly agree* | Somewhat agree* | Neither agree nor disagree | Somewhat disagree | Strongly disagree | Grand Total | Positive Responses (*) | |||||||
|---|---|---|---|---|---|---|---|---|---|---|---|---|---|---|
| Indigenous peoples: Men | 860 | 24.9% | 1 157 | 33.5% | 757 | 21.9% | 325 | 9.4% | 356 | 10.3% | 3 454 | 100% | 2 017 | 58.4% |
| Not identified as Indigenous: Men | 14 400 | 19.0% | 24 591 | 32.5% | 17 412 | 23.0% | 10 217 | 13.5% | 8 994 | 11.9% | 75 613 | 100% | 38 991 | 51.5% |
| Indigenous peoples: Women | 1 481 | 26.9% | 1 867 | 34.0% | 1 106 | 20.1% | 488 | 8.9% | 557 | 10.1% | 5 499 | 100% | 3 348 | 60.9% |
| Not identified as Indigenous: Women | 17 544 | 18.8% | 33 789 | 36.2% | 20 985 | 22.5% | 11 311 | 12.1% | 9 836 | 10.5% | 93 464 | 100% | 51 333 | 55.0% |
| Members of visible minorities: Men | 2 777 | 22.6% | 4 092 | 33.3% | 3 000 | 24.4% | 1 265 | 10.3% | 1 140 | 9.3% | 12 274 | 100.0% | 6 869 | 56.0% |
| Not identified as members of visible minorities: Men | 12 158 | 18.5% | 21 294 | 32.5% | 14 922 | 22.7% | 9 140 | 13.9% | 8 101 | 12.3% | 65 614 | 100.0% | 33 452 | 51.0% |
| Members of visible minorities: Women | 3 571 | 25.1% | 5 252 | 36.9% | 3 050 | 21.4% | 1 229 | 8.6% | 1 119 | 7.9% | 14 221 | 100.0% | 8 823 | 62.0% |
| Not identified as members of visible minorities: Women | 15 157 | 18.2% | 29 960 | 35.9% | 18 761 | 22.5% | 10 414 | 12.5% | 9 128 | 10.9% | 83 419 | 100.0% | 45 117 | 54.1% |
| Persons with disabilities: Men | 1 637 | 29.7% | 1 875 | 34.1% | 968 | 17.6% | 501 | 9.1% | 525 | 9.5% | 5 505 | 100% | 3 512 | 63.8% |
| Not identified as persons with disabilities: Men | 13 627 | 18.5% | 23 872 | 32.5% | 17 187 | 23.4% | 10 044 | 13.7% | 8 832 | 12.0% | 73 561 | 100% | 37 499 | 51.0% |
| Persons with disabilities: Women | 1 977 | 30.3% | 2 335 | 35.8% | 1 210 | 18.6% | 484 | 7.4% | 514 | 7.9% | 6 520 | 100% | 4 312 | 66.1% |
| Not identified as persons with disabilities: Women | 17 047 | 18.4% | 33 328 | 36.1% | 20 868 | 22.6% | 11 306 | 12.2% | 9 875 | 10.7% | 92 423 | 100% | 50 375 | 54.5% |
| All Men | 15 327 | 19.3% | 25 873 | 32.6% | 18 259 | 23.0% | 10 575 | 13.3% | 9 397 | 11.8% | 79 431 | 100% | 41 200 | 51.9% |
| All Women | 19 106 | 19.2% | 35 823 | 36.1% | 22 154 | 22.3% | 11 839 | 11.9% | 10 436 | 10.5% | 99 357 | 100% | 54 929 | 55.3% |
* Denotes agreement with the statement ("positive" response to a question with a negative sentiment)
| Group | Strongly agree | Somewhat agree | Neither agree nor disagree | Somewhat disagree | Strongly disagree | Grand Total | Positive Responses | |||||||
|---|---|---|---|---|---|---|---|---|---|---|---|---|---|---|
| Indigenous peoples: Men | 345 | 10.0% | 879 | 25.5% | 723 | 21.0% | 775 | 22.5% | 728 | 21.1% | 3 449 | 100% | 1 224 | 35.5% |
| Not identified as Indigenous: Men | 11 590 | 15.2% | 24 424 | 32.0% | 16 574 | 21.7% | 12 854 | 16.9% | 10 770 | 14.1% | 76 213 | 100% | 36 014 | 47.2% |
| Indigenous peoples: Women | 678 | 12.3% | 1 401 | 25.4% | 1 184 | 21.5% | 1 229 | 22.3% | 1 025 | 18.6% | 5 517 | 100% | 2 079 | 37.7% |
| Not identified as Indigenous: Women | 12 574 | 13.4% | 31 765 | 33.8% | 20 343 | 21.6% | 17 675 | 18.8% | 11 759 | 12.5% | 94 116 | 100% | 44 339 | 47.2% |
| Members of visible minorities: Men | 1 719 | 13.8% | 3 822 | 30.6% | 2 897 | 23.2% | 2 038 | 16.3% | 2 011 | 16.1% | 12 488 | 100.0% | 5 542 | 44.4% |
| Not identified as members of visible minorities: Men | 10 077 | 15.3% | 21 213 | 32.1% | 14 180 | 21.5% | 11 306 | 17.1% | 9 236 | 14.0% | 66 013 | 100.0% | 31 290 | 47.4% |
| Members of visible minorities: Women | 1 612 | 11.2% | 4 320 | 30.0% | 3 358 | 23.3% | 2 817 | 19.5% | 2 310 | 16.0% | 14 417 | 100.0% | 5 932 | 41.1% |
| Not identified as members of visible minorities: Women | 11 452 | 13.7% | 28 489 | 34.0% | 17 925 | 21.4% | 15 769 | 18.8% | 10 262 | 12.2% | 83 897 | 100.0% | 29 941 | 47.6% |
| Persons with disabilities: Men | 560 | 10.1% | 1 247 | 22.6% | 1 121 | 20.3% | 1 233 | 22.3% | 1 368 | 24.7% | 5 529 | 100% | 1 807 | 32.7% |
| Not identified as persons with disabilities: Men | 11 384 | 15.4% | 24 047 | 32.4% | 16 177 | 21.8% | 12 417 | 16.7% | 10 132 | 13.7% | 74 156 | 100% | 35 431 | 47.8% |
| Persons with disabilities: Women | 593 | 9.2% | 1 719 | 26.5% | 1 240 | 19.1% | 1 429 | 22.1% | 1 498 | 23.1% | 6 480 | 100% | 2 312 | 35.7% |
| Not identified as persons with disabilities: Women | 12 645 | 13.6% | 31 435 | 33.8% | 20 285 | 21.8% | 17 480 | 18.8% | 11 283 | 12.1% | 93 129 | 100% | 44 080 | 47.4% |
| All Men | 11 989 | 15.0% | 25 418 | 31.8% | 17 378 | 21.7% | 13 689 | 17.1% | 11 562 | 14.4% | 80 036 | 100% | 37 407 | 46.7% |
| All Women | 13 292 | 13.3% | 33 281 | 33.3% | 21 636 | 21.6% | 18 971 | 19.0% | 12 846 | 12.8% | 100 026 | 100% | 46 573 | 46.6% |
| Group | Not at all | To a minimal extent | To a moderate extent* | To a great extent* | Grand Total | Positive Responses (*) | ||||||
|---|---|---|---|---|---|---|---|---|---|---|---|---|
| Indigenous peoples: Men | 545 | 72.4% | 85 | 11.3% | 66 | 8.7% | 57 | 7.5% | 752 | 100% | 123 | 16.2% |
| Not identified as Indigenous: Men | 14 711 | 76.5% | 2 187 | 11.4% | 1 359 | 7.1% | 984 | 5.1% | 19 241 | 100% | 2 343 | 12.2% |
| Indigenous peoples: Women | 633 | 73.2% | 96 | 11.1% | 76 | 8.8% | 59 | 6.9% | 865 | 100% | 729 | 15.7% |
| Not identified as Indigenous: Women | 13 966 | 75.4% | 2 210 | 11.9% | 1 365 | 7.4% | 990 | 5.3% | 18 532 | 100% | 2 355 | 12.7% |
| Members of visible minorities: Men | 1 703 | 72.9% | 298 | 12.8% | 194 | 8.3% | 140 | 6.0% | 2 335 | 100.0% | 135 | 14.3% |
| Not identified as members of visible minorities: Men | 13 358 | 76.9% | 1 935 | 11.1% | 1 201 | 6.9% | 884 | 5.1% | 17 378 | 100.0% | 2 085 | 12.0% |
| Members of visible minorities: Women | 1 394 | 68.8% | 282 | 13.9% | 183 | 9.0% | 165 | 8.2% | 2 024 | 100.0% | 348 | 17.2% |
| Not identified as members of visible minorities: Women | 12 954 | 76.0% | 1 988 | 11.7% | 1 233 | 7.2% | 862 | 5.1% | 17 037 | 100.0% | 2 094 | 12.3% |
| Persons with disabilities: Men | 686 | 66.0% | 127 | 12.2% | 101 | 9.7% | 126 | 12.1% | 1 040 | 100% | 227 | 21.8% |
| Not identified as persons with disabilities: Men | 14 598 | 76.9% | 2 141 | 11.3% | 1 329 | 7.0% | 912 | 4.8% | 18 980 | 100% | 2 241 | 11.8% |
| Persons with disabilities: Women | 642 | 67.8% | 121 | 12.8% | 90 | 9.5% | 94 | 9.9% | 948 | 100% | 184 | 19.4% |
| Not identified as persons with disabilities: Women | 13 967 | 75.6% | 2 189 | 11.9% | 1 364 | 7.4% | 949 | 5.1% | 18 469 | 100% | 2 313 | 12.5% |
| All Men | 15 356 | 76.3% | 2 281 | 11.3% | 1 433 | 7.1% | 1 047 | 5.2% | 20 117 | 100% | 2 480 | 12.3% |
| All Women | 14 652 | 75.2% | 2 319 | 11.9% | 1 459 | 7.5% | 1 056 | 5.4% | 19 486 | 100% | 2 515 | 12.9% |
* Denotes agreement with the statement (“positive” response to a question with a negative sentiment)
| Group | Not at all | To a minimal extent | To a moderate extent* | To a great extent* | Grand Total | Positive Responses (*) | ||||||
|---|---|---|---|---|---|---|---|---|---|---|---|---|
| Indigenous peoples: Men | 640 | 84.4% | 66 | 8.7% | 35 | 4.6% | 18 | 2.3% | 759 | 100% | 53 | 6.9% |
| Not identified as Indigenous: Men | 15 705 | 81.1% | 2 422 | 12.5% | 966 | 5.0% | 271 | 1.4% | 19 364 | 100% | 1 237 | 6.4% |
| Indigenous peoples: Women | 702 | 80.8% | 117 | 13.4% | 43 | 4.9% | 8 | 0.9% | 870 | 100% | 51 | 5.8% |
| Not identified as Indigenous: Women | 15 048 | 81.1% | 2 326 | 12.5% | 888 | 4.8% | 297 | 1.6% | 18 560 | 100% | 1 185 | 6.4% |
| Members of visible minorities: Men | 1 827 | 78.7% | 310 | 13.3% | 152 | 6.6% | 34 | 1.4% | 2 323 | 100.0% | 186 | 8.0% |
| Not identified as members of visible minorities: Men | 14 299 | 81.6% | 2 136 | 12.2% | 835 | 4.8% | 247 | 1.4% | 17 517 | 100.0% | 1 082 | 6.2% |
| Members of visible minorities: Women | 1 588 | 78.9% | 239 | 11.9% | 132 | 6.6% | 54 | 2.7% | 2 013 | 100.0% | 186 | 9.3% |
| Not identified as members of visible minorities: Women | 13 897 | 81.3% | 2 154 | 12.6% | 790 | 4.6% | 247 | 1.4% | 17 088 | 100.0% | 1 037 | 6.1% |
| Persons with disabilities: Men | 825 | 77.8% | 147 | 13.9% | 52 | 4.9% | 36 | 3.4% | 1 060 | 100% | 88 | 8.3% |
| Not identified as persons with disabilities: Men | 15 545 | 81.4% | 2 349 | 12.3% | 946 | 5.0% | 255 | 1.3% | 19 095 | 100% | 1 201 | 6.3% |
| Persons with disabilities: Women | 773 | 80.7% | 119 | 12.4% | 35 | 3.6% | 32 | 3.3% | 958 | 100% | 67 | 6.9% |
| Not identified as persons with disabilities: Women | 15 009 | 81.1% | 2 313 | 12.5% | 900 | 4.9% | 275 | 1.5% | 18 498 | 100% | 1 175 | 6.4% |
| All Men | 16 446 | 81.3% | 2 500 | 12.4% | 1 003 | 5.0% | 291 | 1.4% | 20 240 | 100% | 1 294 | 6.4% |
| All Women | 15 836 | 81.1% | 2 445 | 12.5% | 937 | 4.8% | 307 | 1.6% | 19 526 | 100% | 1 244 | 6.4% |
* Denotes agreement with the statement (“positive” response to a question with a negative sentiment)
| Group | Strongly agree | Somewhat agree | Neither agree nor disagree | Somewhat disagree | Strongly disagree | Grand Total | Positive Responses | |||||||
|---|---|---|---|---|---|---|---|---|---|---|---|---|---|---|
| Indigenous peoples: Men | 263 | 56.5% | 146 | 31.4% | 19 | 4.2% | 14 | 2.9% | 23 | 5.0% | 465 | 100% | 409 | 87.9% |
| Not identified as Indigenous: Men | 7 464 | 64.7% | 3 196 | 27.7% | 389 | 3.4% | 239 | 2.1% | 251 | 2.2% | 11 539 | 100% | 10 660 | 92.4% |
| Indigenous peoples: Women | 331 | 61.8% | 151 | 28.1% | 32 | 5.9% | 12 | 2.2% | 11 | 2.1% | 536 | 100% | 482 | 89.9% |
| Not identified as Indigenous: Women | 7 692 | 63.1% | 3 491 | 28.6% | 372 | 3.1% | 357 | 2.9% | 278 | 2.3% | 12 191 | 100% | 11 183 | 91.7% |
| Members of visible minorities: Men | 822 | 62.1% | 400 | 30.2% | 50 | 3.8% | 34 | 2.6% | 18 | 1.4% | 1 325 | 100.0% | 1 223 | 92.3% |
| Not identified as members of visible minorities: Men | 6 764 | 64.6% | 2 893 | 27.6% | 354 | 3.4% | 210 | 2.0% | 257 | 2.5% | 10 478 | 100.0% | 9 657 | 92.2% |
| Members of visible minorities: Women | 787 | 61.5% | 370 | 29.0% | 53 | 4.2% | 40 | 3.1% | 29 | 2.2% | 1 279 | 100.0% | 1 157 | 90.5% |
| Not identified as members of visible minorities: Women | 7 124 | 63.6% | 3 167 | 28.3% | 332 | 3.0% | 327 | 2.9% | 255 | 2.3% | 11 206 | 100.0% | 10 291 | 91.8% |
| Persons with disabilities: Men | 367 | 62.2% | 159 | 27.0% | 30 | 5.1% | 22 | 3.8% | 11 | 1.9% | 590 | 100% | 526 | 89.2% |
| Not identified as persons with disabilities: Men | 7 370 | 64.5% | 3 182 | 27.8% | 380 | 3.3% | 227 | 2.0% | 266 | 2.3% | 11 425 | 100% | 10 552 | 92.4% |
| Persons with disabilities: Women | 371 | 62.1% | 162 | 27.1% | 21 | 3.5% | 21 | 3.4% | 23 | 3.9% | 598 | 100% | 533 | 89.2% |
| Not identified as persons with disabilities: Women | 7 663 | 63.1% | 3 476 | 28.6% | 383 | 3.2% | 351 | 2.9% | 266 | 2.2% | 12 139 | 100% | 11 139 | 91.8% |
| All Men | 7 760 | 64.3% | 3 358 | 27.8% | 410 | 3.4% | 253 | 2.1% | 279 | 2.3% | 12 060 | 100% | 11 118 | 92.2% |
| All Women | 8 058 | 63.0% | 3 657 | 28.6% | 406 | 3.2% | 371 | 2.9% | 291 | 2.3% | 12 784 | 100% | 11 716 | 91.6% |
| Group | Strongly agree | Somewhat agree | Neither agree nor disagree | Somewhat disagree | Strongly disagree | Grand Total | Positive Responses | |||||||
|---|---|---|---|---|---|---|---|---|---|---|---|---|---|---|
| Indigenous peoples: Men | 285 | 61.4% | 119 | 25.6% | 26 | 5.6% | 16 | 3.4% | 18 | 4.0% | 465 | 100% | 404 | 87.0% |
| Not identified as Indigenous: Men | 7 815 | 68.1% | 2 858 | 24.9% | 332 | 2.9% | 222 | 1.9% | 250 | 2.2% | 11 477 | 100% | 10 674 | 93.0% |
| Indigenous peoples: Women | 338 | 64.1% | 131 | 24.8% | 34 | 6.5% | 16 | 3.1% | 9 | 1.6% | 527 | 100% | 469 | 88.8% |
| Not identified as Indigenous: Women | 8 042 | 66.3% | 3 152 | 26.0% | 364 | 3.0% | 316 | 2.6% | 255 | 2.1% | 12 129 | 100% | 11 194 | 92.3% |
| Members of visible minorities: Men | 858 | 64.2% | 384 | 28.7% | 42 | 3.2% | 28 | 2.1% | 24 | 1.8% | 1 337 | 100.0% | 1 242 | 92.9% |
| Not identified as members of visible minorities: Men | 7 091 | 68.2% | 2 559 | 24.6% | 308 | 3.0% | 201 | 1.9% | 244 | 2.3% | 10 404 | 100.0% | 9 650 | 92.8% |
| Members of visible minorities: Women | 822 | 64.3% | 350 | 27.4% | 48 | 3.7% | 32 | 2.5% | 27 | 2.1% | 1 279 | 100.0% | 1 172 | 91.7% |
| Not identified as members of visible minorities: Women | 7 427 | 66.7% | 2 850 | 25.6% | 330 | 3.0% | 295 | 2.6% | 231 | 2.1% | 11 133 | 100.0% | 10 277 | 92.3% |
| Persons with disabilities: Men | 369 | 63.8% | 155 | 26.8% | 23 | 4.0% | 18 | 3.0% | 14 | 2.3% | 579 | 100% | 525 | 90.6% |
| Not identified as persons with disabilities: Men | 7 740 | 68.1% | 2 822 | 24.8% | 337 | 3.0% | 218 | 1.9% | 257 | 2.3% | 11 374 | 100% | 10 562 | 92.9% |
| Persons with disabilities: Women | 363 | 62.0% | 165 | 28.2% | 22 | 3.8% | 16 | 2.7% | 19 | 3.2% | 585 | 100% | 528 | 90.2% |
| Not identified as persons with disabilities: Women | 8 025 | 66.4% | 3 115 | 25.8% | 376 | 3.1% | 319 | 2.6% | 244 | 2.0% | 12 079 | 100% | 11 140 | 92.2% |
| All Men | 8 135 | 67.8% | 2 989 | 24.9% | 360 | 3.0% | 238 | 2.0% | 272 | 2.3% | 11 994 | 100% | 11 124 | 92.7% |
| All Women | 8 415 | 66.2% | 3 297 | 25.9% | 400 | 3.1% | 335 | 2.6% | 265 | 2.1% | 12 712 | 100% | 11 712 | 92.1% |
| 2018 Staffing and Non-Partisanship Survey Results | Yes | No | Grand Total | |||
|---|---|---|---|---|---|---|
| Persons with disabilities | 1 611 | 12.3% | 11 456 | 87.7% | 13 068 | 100% |
| Group | Not at all | To a minimal extent | To a moderate extent | To a great extent | Grand Total | Positive Responses | ||||||
|---|---|---|---|---|---|---|---|---|---|---|---|---|
| Persons with disabilities | 230 | 14.3% | 315 | 19.6% | 487 | 30.3% | 575 | 35.8% | 1 607 | 100% | 1 062 | 66.1% |
| Group | Merit | Fairness | Transparency | Respondents (unweighted) | |||
|---|---|---|---|---|---|---|---|
| All employees | 100 633 | 53.9% | 84 584 | 46.4% | 80 593 | 44.3% | 87 920 |
| All members of visible minorities |
15 166 | 50.9% | 12 097 | 41.7% | 11 787 | 40.6% | 14 369 |
| South Asian | 2 653 | 48.0% | 2 261 | 41.7% | 2 123 | 39.1% | 2 691 |
| Chinese | 2 903 | 52.1% | 2 459 | 45.6% | 2 367 | 43.7% | 2 748 |
| Black | 3 305 | 55.3% | 2 270 | 39.1% | 2 247 | 38.5% | 2 918 |
| Filipino | 734 | 56.0% | 605 | 46.9% | 589 | 45.9% | 617 |
| Latin American | 1 281 | 52.9% | 1 029 | 43.8% | 1 031 | 43.8% | 1 153 |
| Arab | 1 473 | 53.8% | 1 204 | 45.1% | 1 175 | 44.5% | 1 322 |
| Southeast Asian | 673 | 48.8% | 527 | 40.2% | 560 | 42.4% | 663 |
| West Asian | 549 | 50.3% | 446 | 41.3% | 430 | 40.3% | 515 |
| Korean | 189 | 43.0% | 142 | 33.2% | 137 | 32.3% | 212 |
| Japanese | 202 | 43.5% | 167 | 37.5% | 161 | 35.6% | 217 |
| Other | 1 206 | 42.1% | 987 | 35.4% | 967 | 34.7% | 1 313 |
*This table is for general information purposes and includes respondents that did not indicate “male” or “female” as their gender, thus including respondents who were excluded elsewhere in this report. Because of this, these results may differ from those elsewhere in this report. It is also possible that some respondents chose multiple ethnicities. Results for merit, fairness and transparency use weighted responses.