
Acrylamide in people living in Canada
Learn about human biomonitoring of acrylamide in Canada.
On this page
- About acrylamide
- Data sources for acrylamide biomonitoring
- Results of acrylamide biomonitoring
- Related links
- How to cite this page
About acrylamide
Acrylamide is an industrial chemical used mainly in the production of polymers (large molecules of repeating chemical units). These polymers are used in applications such as water treatment and food packaging.
Acrylamide also forms in some foods when they are cooked at high temperature. It most commonly forms in plant-based foods that are high in carbohydrates, such as potatoes and grains. Higher levels can be found in baked or processed foods such as french fries, chips and crackers.
People are exposed to acrylamide mainly through food. People can also be exposed to acrylamide through cigarette smoke and vaping. Drinking water is a minor source of exposure.
Acrylamide is absorbed in the body after exposure, and accumulates in red blood cells. It breaks down into other chemicals (called metabolites) through different chemical reactions:
- oxidation, which forms glycidamide, an epoxide derivative
- glutathione conjugation of acrylamide or glycidamide, which forms mercapturic acid derivatives
Both acrylamide and glycidamide bind to and react with haemoglobin in red blood cells, forming adducts (a type of chemical bond). Acrylamide and its metabolites (including adducts) are excreted from the body in urine.
Acrylamide and glycidamide haeomoglobin adducts can be measured in a blood sample, and are used as biomarkers of exposure. Their presence in blood reflects exposure over the past 120 days, which is the average life span of red blood cells.
Potential health effects of acrylamide
Exposure to high levels of acrylamide can affect the nervous system. Studies in humans show that prolonged or high exposures to acrylamide may result in peripheral nerve damage. This is indicated by:
- muscle weakness
- numbness in hands and feet
Studies with laboratory animals show that exposure to acrylamide is associated with:
- reproductive effects, such as impaired fertility
- developmental effects, such as lower birth weight
- genotoxic effects (DNA damage)
- increased cancer risk
The International Agency for Research on Cancer has classified acrylamide as probably carcinogenic (causing cancer) to humans.
The presence of a substance in your body doesn't mean it will affect your health.
Managing acrylamide in Canada
We have:
- identified acrylamide as toxic under the Canadian Environmental Protection Act, 1999 due to concerns for human health
- developed risk management tools to reduce exposure to acrylamide from food sources, including:
- working with industry to implement acrylamide reduction strategies
- issuing advice for reducing acrylamide formation in foods prepared at home
- approving the use of a food enzyme (asparaginase) in certain foods to reduce acrylamide formed during cooking
- established a maximum level for acrylamide in certain natural health products used in Canada
- proposed to add acrylamide to the list of ingredients that are prohibited for use in cosmetic products
Data sources for acrylamide biomonitoring
This page presents human biomonitoring data from the Canadian Health Measures Survey (CHMS). You can access more results for acrylamide and other chemicals in the Canadian population through the Canadian biomonitoring dashboard.
Overview of biomonitoring initiatives for blood acrylamide in Canada
| Initiative | Collection period | Target population |
|---|---|---|
| CHMS | 2012 to 2019 | General Canadian population aged 3 to 79 living in the 10 provinces |
We wish to acknowledge all participants, including First Nations, Inuit and Métis peoples, who took part in the biomonitoring study.
Results of acrylamide biomonitoring
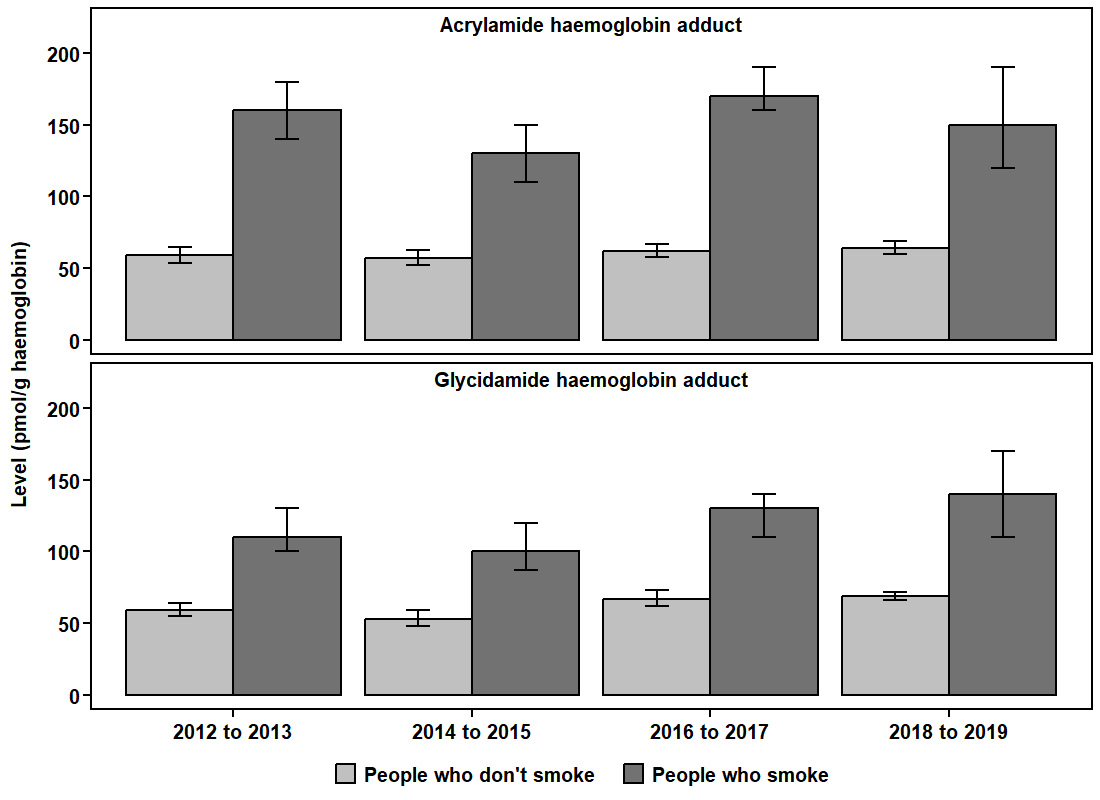
Smoking cigarettes is an important source of exposure to acrylamide. Acrylamide biomonitoring results for the Canadian population are presented by smoking status. Age and sex trends are shown only for people who don't smoke cigarettes.
Levels in the Canadian population, by smoking status
Average levels of acrylamide haemoglobin adduct and glycidamide haemoglobin adduct were higher in people who smoke cigarettes than in people who don't smoke cigarettes.
From 2012 to 2019, average levels increased in people who don't smoke cigarettes, by:
- 9% for acrylamide haemoglobin adduct
- 16% for glycidamide haemoglobin adduct
Text description
| Collection period | Smoking status | Age group (years) | Geometric mean level (pmol/g haemoglobin) | 95% confidence interval (pmol/g haemoglobin) |
|---|---|---|---|---|
| 2012 to 2013 | People who don't smoke | 3 to 79 | 59 | 54–65 |
| 2012 to 2013 | People who smoke | 12 to 79 | 160 | 140–180 |
| 2014 to 2015 | People who don't smoke | 3 to 79 | 57 | 52–63 |
| 2014 to 2015 | People who smoke | 12 to 79 | 130 | 110–150 |
| 2016 to 2017 | People who don't smoke | 3 to 79 | 62 | 58–67 |
| 2016 to 2017 | People who smoke | 12 to 79 | 170 | 160–190 |
| 2018 to 2019 | People who don't smoke | 3 to 79 | 64 | 60–69 |
| People who smoke | 12 to 79 | 150 | 120–190 |
| Collection period | Smoking status | Age group (years) | Geometric mean level (pmol/g haemoglobin) | 95% confidence interval (pmol/g haemoglobin) |
|---|---|---|---|---|
| 2012 to 2013 | People who don't smoke | 3 to 79 | 59 | 55–64 |
| 2012 to 2013 | People who smoke | 12 to 79 | 110 | 100–130 |
| 2014 to 2015 | People who don't smoke | 3 to 79 | 53 | 48–59 |
| 2014 to 2015 | People who smoke | 12 to 79 | 100 | 87–120 |
| 2016 to 2017 | People who don't smoke | 3 to 79 | 67 | 62–73 |
| 2016 to 2017 | People who smoke | 12 to 79 | 130 | 110–140 |
| 2018 to 2019 | People who don't smoke | 3 to 79 | 69 | 66–72 |
| 2018 to 2019 | People who smoke | 12 to 79 | 140 | 110–170 |
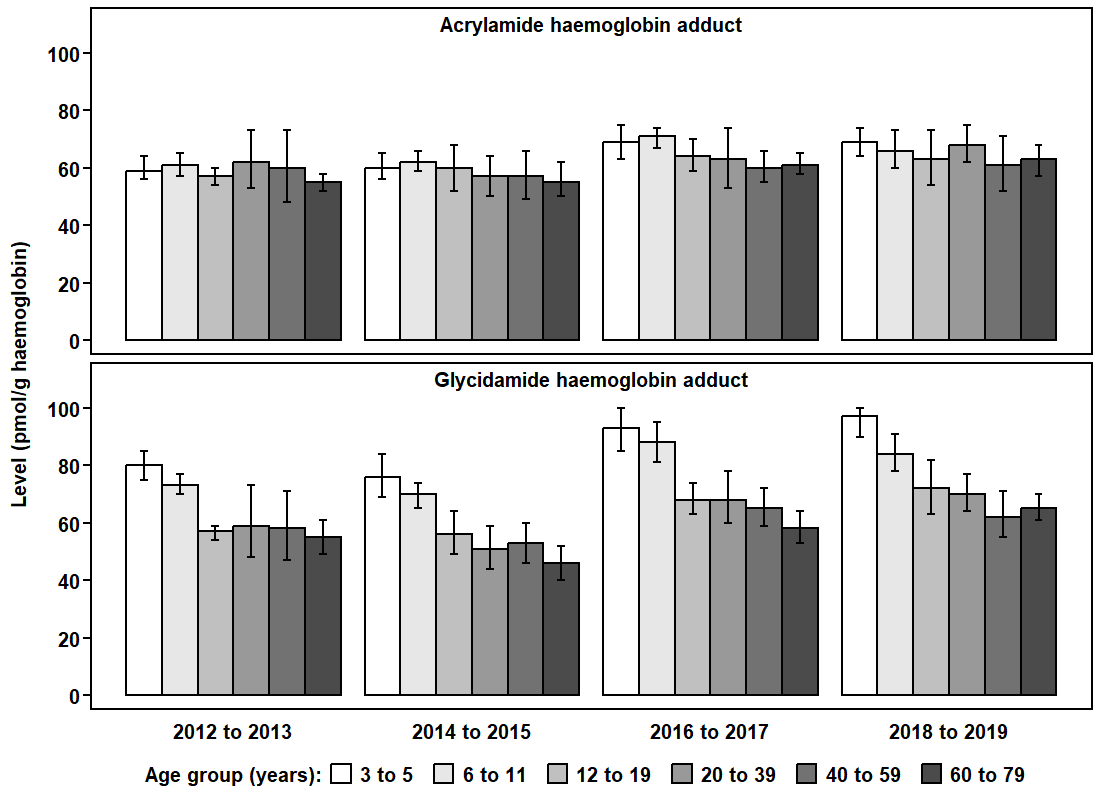
Levels in the Canadian population, by age group
Average levels of acrylamide haemoglobin adduct were similar across age groups. Average levels of glycidamide haemoglobin adduct were higher in children than in adolescents and adults.
Text description
| Collection period | Age group (years) | Geometric mean level (pmol/g haemoglobin) | 95% confidence interval (pmol/g haemoglobin) |
|---|---|---|---|
| 2012 to 2013 | 3 to 5 | 59 | 56–64 |
| 2012 to 2013 | 6 to 11 | 61 | 57–65 |
| 2012 to 2013 | 12 to 19 | 57 | 54–60 |
| 2012 to 2013 | 20 to 39 | 62 | 53–73 |
| 2012 to 2013 | 40 to 59 | 60 | 48–73 |
| 2012 to 2013 | 60 to 79 | 55 | 52–58 |
| 2014 to 2015 | 3 to 5 | 60 | 56–65 |
| 2014 to 2015 | 6 to 11 | 62 | 59–66 |
| 2014 to 2015 | 12 to 19 | 60 | 52–68 |
| 2014 to 2015 | 20 to 39 | 57 | 50–64 |
| 2014 to 2015 | 40 to 59 | 57 | 49–66 |
| 2014 to 2015 | 60 to 79 | 55 | 50–62 |
| 2016 to 2017 | 3 to 5 | 69 | 63–75 |
| 2016 to 2017 | 6 to 11 | 71 | 67–74 |
| 2016 to 2017 | 12 to 19 | 64 | 59–70 |
| 2016 to 2017 | 20 to 39 | 63 | 53–74 |
| 2016 to 2017 | 40 to 59 | 60 | 55–66 |
| 2016 to 2017 | 60 to 79 | 61 | 58–65 |
| 2018 to 2019 | 3 to 5 | 69 | 64–74 |
| 2018 to 2019 | 6 to 11 | 66 | 60–73 |
| 2018 to 2019 | 12 to 19 | 63 | 54–73 |
| 2018 to 2019 | 20 to 39 | 68 | 62–75 |
| 2018 to 2019 | 40 to 59 | 61 | 52–71 |
| 2018 to 2019 | 60 to 79 | 63 | 57–68 |
| Collection period | Age group (years) | Geometric mean level (pmol/g haemoglobin) | 95% confidence interval (pmol/g haemoglobin) |
|---|---|---|---|
| 2012 to 2013 | 3 to 5 | 80 | 75–85 |
| 2012 to 2013 | 6 to 11 | 73 | 70–77 |
| 2012 to 2013 | 12 to 19 | 57 | 54–59 |
| 2012 to 2013 | 20 to 39 | 59 | 48–73 |
| 2012 to 2013 | 40 to 59 | 58 | 47–71 |
| 2012 to 2013 | 60 to 79 | 55 | 49–61 |
| 2014 to 2015 | 3 to 5 | 76 | 69–84 |
| 2014 to 2015 | 6 to 11 | 70 | 65–74 |
| 2014 to 2015 | 12 to 19 | 56 | 49–64 |
| 2014 to 2015 | 20 to 39 | 51 | 44–59 |
| 2014 to 2015 | 40 to 59 | 53 | 46–60 |
| 2014 to 2015 | 60 to 79 | 46 | 40–52 |
| 2016 to 2017 | 3 to 5 | 93 | 85–100 |
| 2016 to 2017 | 6 to 11 | 88 | 81–95 |
| 2016 to 2017 | 12 to 19 | 68 | 63–74 |
| 2016 to 2017 | 20 to 39 | 68 | 60–78 |
| 2016 to 2017 | 40 to 59 | 65 | 59–72 |
| 2016 to 2017 | 60 to 79 | 58 | 53–64 |
| 2016 to 2017 | 3 to 5 | 97 | 90–100 |
| 2016 to 2017 | 6 to 11 | 84 | 78–91 |
| 2016 to 2017 | 12 to 19 | 72 | 63–82 |
| 2016 to 2017 | 20 to 39 | 70 | 64–77 |
| 2016 to 2017 | 40 to 59 | 62 | 55–71 |
| 2016 to 2017 | 60 to 79 | 65 | 61–70 |
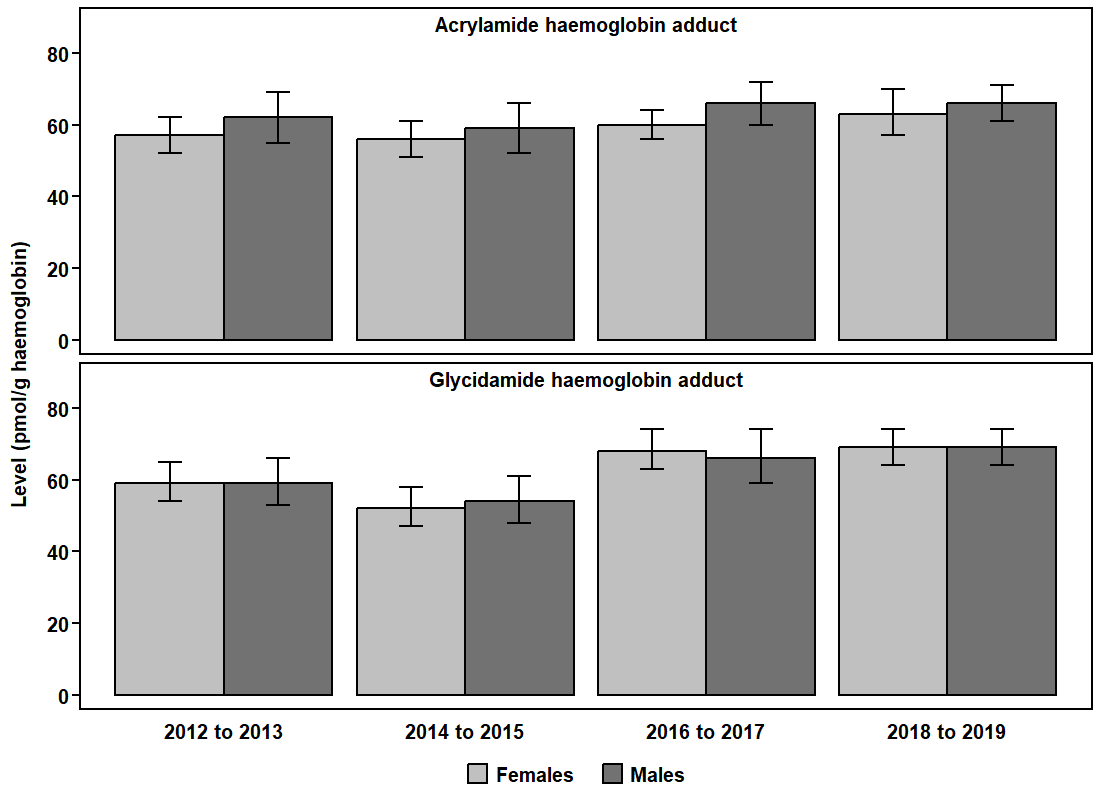
Levels in the Canadian population, by sex
Average levels of acrylamide haemoglobin adduct were higher in males than in females. Average levels of glycidamide haemoglobin adduct were similar between sexes.
Text description
| Collection period | Sex | Geometric mean level (pmol/g haemoglobin) | 95% confidence interval (pmol/g haemoglobin) |
|---|---|---|---|
| 2012 to 2013 | Females | 57 | 52–62 |
| 2012 to 2013 | Males | 62 | 55–69 |
| 2014 to 2015 | Females | 56 | 51–61 |
| 2014 to 2015 | Males | 59 | 52–66 |
| 2016 to 2017 | Females | 60 | 56–64 |
| 2016 to 2017 | Males | 66 | 60–72 |
| 2018 to 2019 | Females | 63 | 57–70 |
| 2018 to 2019 | Males | 66 | 61–71 |
| Collection period | Sex | Geometric mean level (pmol/g haemoglobin) | 95% confidence interval (pmol/g haemoglobin) |
|---|---|---|---|
| 2012 to 2013 | Females | 59 | 54–65 |
| 2012 to 2013 | Males | 59 | 53–66 |
| 2014 to 2015 | Females | 52 | 47–58 |
| 2014 to 2015 | Males | 54 | 48–61 |
| 2016 to 2017 | Females | 68 | 63–74 |
| 2016 to 2017 | Males | 66 | 59–74 |
| 2018 to 2019 | Females | 69 | 64–74 |
| 2018 to 2019 | Males | 69 | 64–74 |
Related links
- Human Biomonitoring of Environmental Chemicals
- 2-Propenamide (Acrylamide)
- Acrylamide in food
- Screening Assessment for the Challenge: 2-Propenamide (Acrylamide)
- Acrylamide and food: Questions and answers
- Some industrial chemicals: IARC Monographs on the Evaluation of Carcinogenic Risks to Humans
How to cite this page
Health Canada. 2025. Acrylamide in people living in Canada. Ottawa, ON. Available: https://www.canada.ca/en/health-canada/services/environmental-workplace-health/reports-publications/environmental-contaminants/human-biomonitoring-resources/acrylamide-people-Canada.html
For more information, contact: biomonitoring-biosurveillance@hc-sc.gc.ca