
HIV in Canada, Surveillance Report to December 31, 2021
Download the pdf format
(PDF format, 2.11 MB, 78 pages)
Organization: Public Health Agency of Canada
Date published: 2024-01-31
ISBN: 978-0-660-49697-9
Pub.: 230264
Acknowledgments
This report was prepared by the Centre for Communicable Diseases and Infection Control, Infectious Diseases and Vaccination Programs Branch, Public Health Agency of Canada. The publication of this report would not have been possible without the collaboration of public health surveillance and epidemiology units in all provinces and territories, whose continuous contribution to national HIV/AIDS surveillance is gratefully appreciated. This report is possible because of the close collaboration and participation of all partners in HIV and AIDS surveillance. Appendix 1 contains a complete list of all data contributors.
We wish to acknowledge the invaluable contributions of members of the Black Expert Working Group, who critically reviewed this report: Dr. Shamara Baidoobonso, Dr. David Este, Dr. Hughes Loemba, Dr. Geoffrey Maina, Dr. Lawrence Mbuagbaw, Maureen Owino, and Wangari Tharao. A special thank you and acknowledgement to Dr. Winston Husbands, whose continued advocacy for Black communities and whose collaborative efforts played an instrumental role in the development of the Black Expert Working Group. We also wish to acknowledge the contributions of Dr. Nathan Lachowsky, Chris Draenos, and Ben Klassen from the Community-Based Research Centre (CBRC) who also critically reviewed this report.
Any comments and suggestions that would improve the usefulness of future publications are welcome and can be sent to the attention of the HIV/AIDS Surveillance System (HASS) within the Centre for Communicable Diseases and Infection Control, Public Health Agency of Canada, at hass@phac-aspc.gc.ca.
Table of contents
- Acknowledgments
- List of report figures
- List of report tables
- List of data tables
- List of acronyms
- Executive summary
- Introduction
- Methods
- Surveillance data at a glance
- Discussion
- Conclusion
- Data tables
- Supplementary tables
- Appendix 1: Data contributors
- Appendix 2: Technical notes
- Appendix 3: Exposure category hierarchy
- References
List of report figures
- Figure 1: Schematic showing the data flow for first-time and previously diagnosed cases from all provinces and territories for 2021.
- Figure 2: Number of first-time diagnoses of HIV and diagnosis rates overall, by sex and year, Canada, 2012 to 2021
- Figure 3: First-time HIV diagnosis rate per 100,000 population, by province or territory, Canada, 2021
- Figure 4: First-time HIV diagnosis rate per 100,000 population, by sex and age group, Canada, 2021
- Figure 5: First-time HIV diagnosis rate per 100,000 population, by age group and year, Canada, 2012 to 2021
- Figure 6a: Percentage distribution of first-time HIV cases among adult males (≥ 15 years old), by exposure category and year of diagnosis, Canada, 2012 to 2021
- Figure 6b: Percentage distribution of first-time HIV cases among adult females (≥ 15 years old), by exposure category and year of diagnosis, Canada, 2012 to 2021
- Figure 7: Proportion of reported first-time HIV cases (≥15 years of age), by exposure category and age group, Canada, 2021
- Figure 8a: Proportions of race and/or ethnicity among all reported first-time HIV diagnoses among all reported cases, Canada, 2021
- Figure 8b: Proportions of race and/or ethnicity among first-time HIV diagnoses where race and/or ethnicity is reported, Canada, 2021
- Figure 9: Number of perinatally HIV-exposed infants and proportion of mothers and pregnant people living with HIV who received antenatal antiretroviral therapy, by year of birth, Canada, 2014 to 2021
- Figure 10: Number of migrants who tested positive for HIV during an immigration medical exam conducted in Canada, 2012 to 2021
- Figure A1: Status of reporting on first-time diagnoses and previously diagnosed cases in all Canadian provinces and territories, 2012 to 2021
- Figure A2: All reported HIV Cases (including first-time and previously diagnosed) by year of diagnosis, Canada, 2012 to 2021
- Figure A3: Status of reporting of AIDS diagnoses in all Canadian provinces and territories, 2012 to 2021
List of report tables
- Table 1: Number and proportion of first-time HIV cases (≥15 years of age), by sex and exposure category, Canada, 2021
- Table 2: Proportion complete of the race and/or ethnicity information in the HASS National Dataset, Canada, 2012-2021
- Table 3: Number and percentage distribution of first-time HIV cases, by sex and race and/or ethnicity, Canada, 2021
- Table 4: Number of AIDS cases (all ages), by sex and year of diagnosis, from reporting Canadian provinces and territories, 2012 to 2021
- Table 5: Number of deaths attributed to HIV infection, by age at death and sex, Canada, 2013 to 2021
- Table 6: Number of deaths attributed to HIV infection (≥ 15 years), by sex, Canada, 2013 to 2021
- Table 7: Number of deaths attributed to HIV infection by age group, Canada, 2013 to 2021
List of data tables
- Data Table 1: Number of first-time diagnoses of HIV and diagnosis rates overall, by sex and year, Canada, 2012 to 2021
- Data Table 2: Number and rate of first-time HIV diagnoses (per 100,000 population) by province and territory, Canada, 2021
- Data Table 3: Number and rate of first-time HIV diagnoses (per 100,000 population), by sex and age group, Canada, 2021
- Data Table 4: Number and rate of first-time HIV diagnoses (per 100,000 population) by age group and year, Canada, 2012 to 2021
- Data Table 5a: Percentage distribution of first-time HIV cases among adults (≥ 15 years old) by exposure category and year of diagnosis, Canada, 2012 to 2021
- Data Table 5b: Percentage distribution of first-time HIV cases among adult males (≥ 15 years old) by exposure category and year of diagnosis, Canada, 2012 to 2021
- Data Table 5c: Percentage distribution of first-time HIV cases among adult females (≥ 15 years old) by exposure category and year of diagnosis, Canada, 2012 to 2021
- Data Table 6: Proportion of reported first-time HIV cases (≥15 years of age) by exposure category and age group, Canada, 2021
- Data Table 7: Number of Canadian-born perinatally HIV-exposed infants by year of birth, current status and use of antiretroviral therapy (ART) for prophylaxis, 1984 to 2021
- Data Table 8: Number and percentage distribution of immigration applicants to Canada diagnosed with HIV as a result of an immigration medical exam (IME) by year and location of test, 2012 to 2021
- Data Table 9: Number and percentage distribution of immigration applicants to Canada diagnosed with HIV as a result of an immigration medical exam (IME) by location of test, sex, age group, and province, 2012 to 2021
- Data Table 10: International statistics on reported HIV cases by country, 2021
List of acronyms
- AIDS
- Acquired Immunodeficiency Syndrome
- ART
- Antiretroviral Therapy
- COVID-19
- SARS-CoV2/ Coronavirus Disease 2019
- CPHSP
- Canadian Perinatal HIV Surveillance Program
- CVSD
- Canadian Vital Statistics Death Database
- gbMSM
- Gay, bisexual and other men who have sex with men
- GCMS
- Global Case Management System
- HASS
- HIV/AIDS Surveillance System
- HIV
- Human Immunodeficiency Virus
- ICD
- International Classification of Diseases
- IDU
- Injection Drug Use
- IME
- Immigration Medical Exam
- IRCC
- Immigration, Refugees and Citizenship Canada
- OOC
- Out of Country
- OOP
- Out of Province
- PHAC
- Public Health Agency of Canada
- PLHIV
- People living with HIV
- PrEP
- Pre-exposure Prophylaxis
- PWID
- People who inject drugs
- PWUD
- People who use drugs
- PT
- Province or Territory
- SC
- Statistics Canada
- STBBI
- Sexually Transmitted and Blood-Borne Infections
- STI
- Sexually Transmitted Infection
Executive summary
The HIV in Canada, Surveillance Report to December 31, 2021, published by the Public Health Agency of Canada (PHAC) presents and describes national epidemiological trends on Human Immunodeficiency Virus (HIV) diagnoses in Canada by geographic region, age at diagnosis, sex, race and/or ethnicity, and exposure category between 2012 and 2021. This surveillance report is the first national HIV surveillance report to present information specifically on first-time diagnoses from all thirteen provinces and territories, providing more robust evidence for the planning, evaluation, and implementation of HIV prevention and care programs.
The COVID-19 (SARS-CoV2 / Coronavirus Disease 2019) pandemic may have had impacts, both known and unknown, on access to HIV testing and care services as well as on surveillance activities in Canada. For this reason, data for 2020 and 2021 should be interpreted with some caution. The true impact and lasting effects of the COVID-19 pandemic on HIV transmission in Canada may become clearer with continued collection and analysis of data in the years to come. Due to surveillance data being refined by the PTs over time, as data are periodically reviewed and updated, surveillance data for previous years may also be reported by PTs along with the current year's dataset. As such, historical data presented in this report does not exactly match historical data presented in previous national reports.
Key findings include:
- In 2021, 1,466 newly diagnosed cases (i.e., diagnosed for the first-time) of HIV were reported in Canada. This is an increase of 10.9% compared with 2020 (1,322 reported cases). This increase may be due, in part, to renewed access to HIV testing services in the later stages of the COVID-19 pandemic.
- The national rate of reported newly diagnosed HIV cases was 3.8 per 100,000 population in 2021, an increase from 3.5 per 100,000 population in 2020. Despite this slight increase, the 2021 rate remained below pre-COVID-19 pandemic levels.
- The overall trends of the past five years show the number of first-time HIV diagnoses in Canada was relatively stable until 2020, with a peak of 1,850 cases in 2016 (rate of 5.2 per 100,000 population) decreasing to 1,322 cases in 2020 (rate of 3.5 per 100,000 population), followed by a slight increase in 2021.
- The HIV diagnosis rate was 5.5 per 100,000 population in males and 2.1 per 100,000 population in females in 2021; showing a slight increase from rates reported in 2020 (which were 5.0 and 2.0 HIV diagnoses per 100,000 population, respectively).
- Recent trends in the HIV diagnosis rate among males show a continued decline in rates following a peak of 8.4 per 100,000 males in 2013. Among females, the trend shows a subtle increase, peaking at 2.7 per 100,000 females in 2019. The same decrease in 2020 and then slight increase in 2021 that occurred overall also occurred for both males and females. For both groups, the 2021 rates remained below pre-COVID-19 pandemic levels.
- When broken down into ten-year age groups, the HIV diagnosis rate in the 30 to 39 years age group continues to be the highest among all age groups with 8.6 per 100,000 population in 2021.
- In all age groups, HIV diagnosis rates were observed to be at least two times greater in males than in females, with the exceptions of the children <15 years and 15-to-19-year age group, in which females had a higher HIV diagnosis rate.
- The highest HIV diagnosis rate across provinces and territories was in Saskatchewan, with 20.3 per 100,000 population. The lowest diagnosis rate was in the Atlantic region with 1.5 per 100,000 population.
- According to reported exposure category, male-to-male sexual contact continues to account for the highest proportion of diagnoses in males, at 54.2% of diagnoses in 2021. Heterosexual contact continues to account for the highest proportion of diagnoses in females, at 60.4% of diagnoses. Injection drug use also remains a significant factor among all cases, accounting for 21.9% of all first-time diagnoses in 2021.
- Race-based data provides a key element in recognizing and understanding disparities in access to HIV care stemming from a history of colonialism and systemic and structural inequities in Canada. However, the reporting of race and/or ethnicity data varies significantly across jurisdictions. Overall, race and/or ethnicity data was reported for only 45.3% of first-time diagnoses in 2021. No race and/or ethnicity data were reported from the following provinces: Manitoba, and Quebec.
- Among the 664 cases for whom race and/or ethnicity was reported, 38.2% of cases were reported as white people, 23.9% were reported as Indigenous people (First Nations, Inuit, Métis, or Indigenous-not otherwise specified), and 15.4% as Black people. These proportions are unlikely to be truly representative of all first-time diagnoses and should be interpreted with caution, as race and/or ethnicity data is not missing randomly.
- In collaboration with community members, the National HIV/AIDS Surveillance System (HASS) has established a Black Expert Working Group to provide advice and co-develop strategies to improve the completeness, interpretation, and contextualization of race and/or ethnicity data. HASS is seeking to establish similar engagements with First Nations, Inuit, and Métis representatives and/or organizations.
- The total number of migrant people (immigrants, refugees, and temporary residents) who tested positive for HIV during an immigration medical exam (IME) was 865 in 2021 (either in Canada or internationally). This is an increase of 16.4% from the 743 migrants who tested positive in 2020 but a decrease from the 1,188 migrants who tested positive for HIV during an IME in 2019. Increasing immigration volumes are likely to be a primary contributor to the increase in the number of migrants testing positive for HIV in 2021 compared to 2020, as Immigration, Refugees and Citizenship Canada (IRCC) indicates that the proportion of IMEs with an HIV diagnosis was lower in 2021 compared to 2019 and 2020 for IMEs performed in Canada.
- Of the 210 infants reported to be perinatally exposed to HIV in 2021, 98.1% were born to people who had received antiretroviral therapy (ART). There were two infants confirmed to have acquired HIV perinatally, both of whom were born to childbearing individuals who did not receive any ART.
- In 2021, there were 64 cases of Acquired Immunodeficiency Syndrome (AIDS) reported, a continued decrease since 2012. However, findings should be interpreted with caution, as AIDS data were only submitted by four provinces in 2021 (New Brunswick, Nova Scotia, Ontario, and Saskatchewan) and, where this information was available, cases are likely underreported.
- In 2021, there were 133 deaths attributed to HIV. This represents a decrease compared with the 136 deaths attributed to HIV in 2020, however these deaths are still likely underreported.
Introduction
Human Immunodeficiency Virus (HIV) continues to be a public health issue that affects many people worldwide. In 2021, there were an estimated 1.5 million new infections and approximately 38.4 million people living with HIV (PLHIV) globally.Footnote 1 Due to advancements in testing (e.g. availability of self-testing), globally, 86% of PLHIV knew their HIV status in 2022.Footnote 1 Additionally, there have been improvement to prevention (such as pre-exposure prophylaxis or PrEP) and treatment of HIV. Despite these advances, in Canada, many barriers to accessing HIV testing, prevention, and treatment remain, including stigma, perception of low likelihood of acquiring HIV and limited knowledge about HIV, HIV testing, and prevention services.Footnote 2 In addition, there are specific barriers such as social HIV stigma, racism, colonialism, criminalization and/or incarceration, homophobia, and transphobia affecting populations that are disproportionately impacted by HIV, including Two-spirit people, gay and bisexual men, trans, queer, questioning, and non-binary people, people who inject drugs (PWID) and African Caribbean and Black Communities and Indigenous communities.Footnote 2
The HIV epidemic has changed significantly over time with antiretroviral therapy (ART) rendering HIV a manageable, chronic condition, with decreased mortality over time for those with access, and decreased transmission over time due to interventions such as harm reduction services, ART, and PrEP.Footnote 3 In fact, those living with HIV who have undetectable viral loads cannot transmit the virus to their sexual partners and PHAC endorses the U=U campaign.Footnote 4 The communities of gay, bisexual, and other men who have sex with men (gbMSM) continue to make up most of new diagnoses (43.7%) in 2020 and, in the same year, an increase was observed in the proportion of diagnoses among people who inject drugs when compared with previous years.Footnote 5 Since 2018, there has been an increase nationally in the proportion of new infections and diagnoses among women, Indigenous people and people who inject drugs.Footnote 5 Footnote 6 However, a decrease in diagnoses was noted in all populations in 2020 due in part to the SARS-CoV-2 (COVID-19) pandemic.Footnote 5 The COVID-19 pandemic impacted sexually transmitted and blood borne infections (STBBI) services, including HIV testing, with 43.9% of HIV testing service providers indicating a decrease in their ability to provide these services at some point during this period.Footnote 7 Due to the public health efforts focused on the COVID-19 pandemic, impacting local public health surveillance practices, there were likely additional challenges in the collection of surveillance information.
Public health surveillance is the ongoing, systematic collection, collation, analysis, interpretation, and dissemination of public health data in efforts to prevent or control disease or injury.Footnote 8 Public health surveillance is useful in assessing the health status of populations; identifying trends; designing, planning, and monitoring the impact of programs and policies; and providing information for research.Footnote 8 We recognize that the term "surveillance" is also used by law enforcement, private security, and other parties for a different purpose. As a result, the term can raise discomfort or have negative meanings for some individuals and communities.Footnote 9 Footnote 10The national HIV surveillance system only collects the minimum amount of data necessary to understand trends in HIV diagnoses, and this does not include personally identifying information. Only provinces or territorial public health authorities have access to personal identifiable information (e.g., name or personal health card number) for the purposes of providing essential health services and they remove this information before sending data to national systems.
The Canadian government has recognized the importance of routine surveillance in the reduction of the burden of STBBIs through the release of the 'Reducing the health impact of sexually transmitted and blood-borne infections in Canada by 2030: A pan-Canadian STBBI framework for action' in 2018.Footnote 11 This framework has evidence-based policy and programs as one of the guiding principles, emphasizing the use of surveillance data to guide the development of interventions and programs.Footnote 12 In addition to this, the importance of surveillance has also been re-iterated through the associated 'Government of Canada five-year action plan on sexually transmitted and blood-borne infections' in 2019.Footnote 4 Key pillars of the action plan include measuring impact, monitoring, and reporting on trends and results in addition to leveraging existing knowledge and targeting future research.Footnote 4 Therefore, routine HIV surveillance presents trends on HIV diagnoses to assist in monitoring Canada's progress in meeting its goals in the STBBI framework and associated action plan.
Additionally, Canada is engaged in and working towards international targets for the elimination of HIV transmission. UNAIDS has developed interim 2025 targets as an update from the '90-90-90' targets for 2020.Footnote 13 These targets aim to reduce the burden of HIV globally, through the reduction in criminalization, stigma, discrimination, gender inequality and violence; increases in treatment and care for people living with HIV (PLHIV), linking people with HIV to person-centered and context specific care and services.Footnote 13 The UN general assembly set global targets to end HIV as a public health threat by 2030, reducing HIV incidence by 90%.Footnote 14
Three different teams at PHAC produce reports describing different aspects of the HIV epidemic in Canada and Canada's progress in meeting national and international HIV transmission reduction goals:
- The National HIV/AIDS Surveillance System (HASS)
- The Estimates and Field Surveillance Section
- The HIV and hepatitis C Enhanced Surveillance Section (ESS), known colloquially as "Tracks"
The National HIV/AIDS Surveillance System (HASS)
The HASS is responsible for routine HIV case surveillance and produces annual information products, including this annual report. The HASS collects and reports data on first-time diagnoses of HIV reported each year in Canada's provinces and territories. This case data includes some limited sociodemographic information (i.e., age, sex, race and/or ethnicity), and exposure categories (the most likely route of HIV acquisition). The HASS produces information products that describe trends in new HIV diagnoses overall but is limited in its ability to highlight trends in new diagnoses among key populations who are disproportionately impacted.
The Estimates and Field Surveillance Section
Routine HIV surveillance (i.e., HASS) is used to summarize the information related to people who presented for HIV testing and who also then received an HIV diagnosis. However, it does not capture the number of people who are living with HIV and have not yet tested (i.e., are not even aware themselves that they have HIV). Also, it does not capture the total number of people living with HIV and receiving HIV treatment and care in Canada. Instead, this information is estimated using statistical models and methods with data from a variety of sources. The Public Health Agency of Canada develops estimates of HIV incidence (new infections), and prevalence (people living with HIV), as well as the HIV care continuum every two years, in partnership with provincial and territorial public health authorities and other government departments. In addition, as part of the goal to increase access to combination HIV prevention, the Public Health Agency of Canada also monitors and reports on trends in pre-exposure prophylaxis (PrEP) use in Canada. National HIV estimates provide an understanding of temporal changes in HIV transmission patterns, can be used to guide the planning and funding for prevention, treatment, care, and ongoing support for people living with and affected by HIV, and allow public health agencies to identify gaps in care and determine the types of interventions that might help increase the number of people who achieve and maintain viral suppression. The latest information about people living with HIV in Canada can be found on the STBBI surveillance page under "Reporting on Canada's progress towards STBBI elimination".
The HIV and Hepatitis C Enhanced Surveillance Section
The Enhanced HIV and Hepatitis C Surveillance Section oversees the Tracks surveillance system which is designed to gather information to describe prevalence of HIV, hepatitis C and other sexually transmitted and blood-borne infections (STBBI), HIV-related risk behaviours, and use of (STBBI)-related services among key populations. They routinely conduct cross-sectional, bio-behavioural surveys among PWIDFootnote 15; First NationsFootnote 16, Inuit and Métis people; gbMSM; and African, Caribbean and Black peopleFootnote 17. Bio-behavioural surveys are an instrumental tool for measuring and addressing the HIV epidemic, especially among key populations who are often underserved, marginalized and more likely to acquire HIV.Footnote 18 These bio-behavioural surveys are comprised of a questionnaire completed by the respondent along with a dried blood spot (DBS) collected from a finger-prick blood sample that is tested for HIV, hepatitis C and other STBBI. The questionnaire collects information on socio-demographic characteristics, social determinants of health, use of health and prevention services (including testing), substance use and injecting behaviours, sexual behaviours, and care and treatment for HIV and hepatitis C. Tracks consults with the provinces and territories to select sentinel sites (participant recruitment locations) and collaborates with local public health and/or community-based organizations to conduct the bio-behavioural survey. The survey findings provide the evidence needed to assess the progress towards reaching national and international STBBI targetsFootnote 4 and are a rich source of information that has been used at the local, provincial, territorial, and federal levels to inform public health policies, programs, plans and interventions, for key populations (e.g. the federal action plan on STBBI).
Review and Renewal of the National HIV/AIDS Surveillance System
The National HIV/AIDS Surveillance System (HASS) is currently undergoing a review and renewal with the ultimate goal of better meeting evidence needs. The review phase has involved an internal technical assessment, an evidence review, engagement with data providers in the provinces and territories (PTs), and community consultation. The principles articulated in the Pan-Canadian STBBI Framework for Action – health equity, human rights, meaningful engagement of people living with HIV and key populations, and evidence-based policy and programs – underpin the HASS Review and Renewal processFootnote 11. By contributing to higher quality information to inform policies and programs and meaningfully engaging with partners and stakeholders, the Review and Renewal process can contribute to the strategic goals outlined in the Government of Canada's Five-Year Action Plan on STBBIFootnote 4: reducing the incidence of STBBI in Canada; improving access to testing, treatment, and ongoing care and support; and reducing stigma and discrimination that create vulnerabilities to STBBI.
As a result of community advocacy and through a collaborative effort with community members, HASS has co-developed a Black Expert Working Group (BEWG), composed of individuals with expertise in HIV care, research, and advocacy. This working group was established to support the crucial role of Black community members' collaboration in the improvement of systems for HIV (including diagnosis, data collection, and management) that would be more favourable to the wellbeing of Black communities. The BEWG will provide advice and guidance to HASS and our surveillance partners, contributing to our collective efforts to improve the quality and completeness of race and/or ethnicity data and helping to ensure that this information is interpreted and presented in reports in a useful and appropriate manner. The BEWG has critically reviewed the sections of this report that present race and/or ethnicity information to ensure that the language and framing are appropriate and useful. HASS is currently exploring similar engagements with other disproportionately impacted populations, including with First Nations, Inuit, and Métis representatives and/or organizations.
National HIV surveillance reports
Starting with the 'HIV in Canada, Surveillance Report to December 31, 2020', national HIV surveillance reports now present data specifically about first-time HIV diagnoses rather than all positive test results in that year.Footnote 5 While the inclusion of previously diagnosed HIV cases is important for planning treatment and care needs, the inclusion of these cases has been shown to inflate the number of HIV diagnoses per year and overestimate prevalence.Footnote 19 Although the ability to report first-time diagnoses separately from previously diagnosed HIV cases, for all reported years, varies by province and territory, the focus on first time diagnoses improves our knowledge of the domestic transmission of HIV, better informing prevention activities.
It is the nature of surveillance data to be continuously updated over time across all jurisdictions (federal, provincial, and local), and as such this present report replaces all previous national HIV surveillance reports and presents the most recent surveillance data compiled for HIV, with first-time diagnosis case data included up to December 31, 2021.
The objectives of this surveillance report are to describe the epidemiology of first-time HIV diagnoses in Canada in 2021, by geographic region, age at diagnosis, sex, race and/or ethnicity, and exposure category, and to describe trends between 2012 and 2021. Updated information on immigration medical screening results for HIV, data on childbearing individuals with infants perinatally exposed to HIV, AIDS diagnoses and HIV mortality is also provided. While the term HIV refers to the viral infection itself, the terms AIDS refers to the most advanced stage of disease caused by HIV.
Data provided in this report can be divided into two sections:
- The first section focuses on HIV diagnoses in Canada in 2021 by geographic region, age at diagnosis, sex, race and/or ethnicity and exposure category in addition to presenting selected analyses from 2012-2021.
- The second section focuses on data from the Canadian Perinatal HIV Surveillance Program (2014 to 2021), immigration medical screening for HIV (2012-2021), AIDS case surveillance (2012-2021), and HIV mortality (2012-2020).
Methods
Data sources
Data from four different sources of information on HIV/AIDS are presented in this report:
- The National HIV/AIDS Surveillance System (HASS), maintained by the Public Health Agency of Canada (PHAC);
- The Canadian Perinatal HIV Surveillance Program (CPHSP), maintained by the Canadian Pediatric and Perinatal HIV and AIDS Research Group (CPARG);
- Immigration medical screening, maintained by Immigration, Refugees and Citizenship Canada (IRCC);
- The Canadian Vital Statistics Death Database (CVSD), maintained by Statistics Canada.
National HIV/AIDS Surveillance System
The National HIV/AIDS Surveillance System (HASS) is a passive, case-based surveillance system that compiles non-identifying information about people newly diagnosed with HIV infection who meet the threshold for the national case definition (PHAC national HIV case definition / National AIDS case definition).Footnote 20 The collection of HIV diagnosis data, through public health and laboratory reporting, is the responsibility of each individual province or territory (PT), and they voluntarily submit a subset of the de-identified data that they collect about every new diagnosis to PHAC on an annual basis using the National Case Report FormFootnote 21 or a secure electronic dataset transmission. The Directive for the collection, use and dissemination of information relating to public health (PHAC, 2013, unpublished document) outlines the practices adhered to by PHAC in the storage of raw data, including case report forms and electronic datasets.
Beginning in 2020, PHAC requests the submission of data of first-time HIV diagnoses. The first-time diagnosis data are submitted either as a dataset including only first-time diagnoses for that jurisdiction or an all-case dataset including a variable indicating whether the case was previously diagnosed (either out of province/territory or out of country). Provinces and territories routinely exclude identified 'duplicate' cases, i.e., those previously diagnosed in their PT, from their annual data submission to PHAC. Further details about 2021 data submissions from PT public health authorities are found in Appendix 2.
This surveillance report presents information about HIV cases diagnosed on or before December 31, 2021, including age, sex, race and/or ethnicity, and behaviours and exposures that may be associated with the transmission of HIV (presented in this report as "exposure categories"). Data were submitted to PHAC by all but one provincial or territorial surveillance program by November 10, 2022 with the remaining submitting in September 2023. The data were validated by the PTs as they were received and the process was completed as of September, 2023. Differences between the data published in this report and the data published in provincial and territorial surveillance reports are possible. These differences may be due to updates to the provincial or territorial surveillance data that occur after data are submitted to PHAC. Should differences be noted, the provincial and territorial reports are recommended as the primary source of information. The following provinces resubmitted updated historical data, in addition to 2021 data: Ontario (since 1985) and Quebec (since 2012). Due to surveillance data being refined by the PTs over time, as data are periodically reviewed and updated, surveillance data for previous years may also be reported by PTs along with the current year's dataset. As such, historical data presented in this report does not exactly match historical data presented in previous national reports.
Canadian Perinatal HIV Surveillance Program
The Canadian Pediatric AIDS Research Group (CPARG) collects national data on the HIV status of infants born to women and other people who are pregnant and who are living with HIV through the Canadian Perinatal HIV Surveillance Program (CPHSP). CPHSP is supported by PHAC and the Canadian Institutes of Health Research-Canadian HIV Trials Network. Two groups of children are the focus of this sentinel-based, active surveillance system: infants born to people who are pregnant and living with HIV, and children living with HIV receiving care at any participating site, which are 22 pediatric and adult HIV centres or public health units from all Canadian provinces and territories, whether they were born in Canada or abroad.Footnote 22 A national, non-nominal, confidential survey on infants known to participating pediatricians in the 22 sites is used to collect information about infants and the person who gave birth to them. CPHSP sites cover an estimated 95% of infants born in Canada who were exposed to HIV.
Upon obstetric or pediatric referral for care, information regarding infants and the person who gave birth to them is captured and entered by participating sites. This information includes: country of birth of the person who is pregnant, self-reported race and/or ethnicity of the person who is pregnant, exposure category for acquiring HIV of the person who is pregnant, antiretroviral regimen and duration of therapy administered, mode of delivery of the infant, gestational age, and birth weight. Virologic tests for HIV using polymerase chain reaction tests (confirmed on at least two separate samples) and/or by HIV serology beyond 18 months of age are used to report the HIV status of the infant. HIV status is updated annually and include: "confirmed living with HIV", "confirmed not living with HIV", or "HIV status not confirmed."
CPHSP Surveillance data for 2021, including data updates for previous years, were submitted to PHAC in March 2022.
Immigration medical screening
Immigration medical exam (IME) information for all migrants who tested positive for HIV during the immigration medical screening process, in Canada or internationally, is included in the Global Case Management System (GCMS) maintained by Immigration, Refugees and Citizenship Canada (IRCC). The GCMS is IRCC's integrated and worldwide web-based system used to process applications for foreign nationals applying for permanent and temporary residence in Canada and includes information on an individual's IME. The following individuals must complete an IME administered by third-party panel physicians on behalf of IRCC, either in Canada or internationally: all foreign nationals applying for permanent residence and some applying for temporary residence in Canada. In 2002, IRCC added mandatory routine HIV screening to the IME for all applicants 15 years of age and older, as well as for applicants under the age of 15 years who have certain risk factorsFootnote 23. Information collected includes data on individuals who tested positive in Canada in 2021 and those who tested positive outside of Canada and arrived in Canada in 2021.
Aggregate data were provided to PHAC by IRCC in July 2022. Data submissions by IRCC include non-identifying data on individuals who tested positive for HIV during an IME and includes the following information: country of birth, sex, age group, and the province or territory where the IME was conducted (if in Canada), and the year tested (for those tested in Canada) or the year the applicant landed in Canada (for those tested outside of Canada). Immigrants (permanent residents in the economic and family classes); refugees (resettled refugees, protected persons, and asylum claimants); and temporary residents (visitors, international students, temporary foreign workers, and temporary resident permit holders) are classified broadly as "migrants".
IRCC routinely shares, with applicable provinces and territories, nominal data from in-Canada and international test results where HIV was detected and a valid Canadian residential address, which indicates the PT of residence. This supports continuity of care for individuals living with HIV. Data received by the PTs from IRCC has historically either been counted as new diagnoses or excluded from counts of new diagnoses when reported to PHAC (by PTs), with the specific procedure varying by PT. Efforts to improve the differentiation of these cases continued in the 2021 data submission.
Canadian Vital Statistics Death Database
In Canada, it is required that all deaths, of any cause, be registered with the provincial and territorial vital statistics registrars.Footnote 24 Provincial and territorial vital statistics registries submit data on all deaths that occurred annually to Statistics Canada, which is responsible for the Canadian Vital Statistics Death Database (CVSD), a cumulative record of death statistics compiled through the submission of data from death registration forms collected by the central registry in each province and territory. The cause of death is classified based on International Classification of Diseases (ICD) codes. The 9th revision of the International Classification of Diseases (ICD-9) was used to classify deaths occurring between 1979 and 1999, with codes 042 to 044 indicating deaths attributed to HIV infection. Deaths occurring from 2000 onward attributed to HIV infection are classified using codes B20 to 24 under the 10th revision (ICD-10).
Mortality data specific to year of death, cause of death, sex, and age at death were extracted from the publicly available data "Deaths and age-specific mortality rates, by selected grouped causes"Footnote 25 in the CVSD on August 29, 2023. For the national HIV/AIDS surveillance report, the focus is on deaths attributed specifically to HIV/AIDS.
Data analysis
The national dataset was developed using standardized data verification and recoding procedures applied to all datasets submitted by the individual provinces and territories. Each PT is provided with their data in report table format to review and validate. After the resolution of discrepancies (if any) and upon final agreement from the provinces and territories, the national datasets were prepared.
Case counts and rates (cases per 100,000 population) overall and stratified by geographic region, age group, and sex are presented in this report. Rates were calculated using population data extracted from the Annual Demographic Statistics dataset from Statistics Canada, Demography Division published to indicate the estimated size of the Canadian population on July 1, 2021.
No additional statistical procedures for comparative analyses or accounting for missing data were used in this report. If deemed necessary by provincial and territorial surveillance data providers, data with small cell sizes (n ≤ 5 cases) were suppressed or data categories were merged to create larger categories.
First-time diagnoses reported in Canada between 2012 and 2021 were used to compile the national dataset. The following definitions were used to create the national datasets:
- First-time diagnosis: HIV diagnosed and reported for the first time ever for the individual in the given reporting year and with no evidence of previous diagnosis, neither in another country nor in another Canadian province or territory.
- Previous diagnosis: individuals who had evidence of a known previous HIV diagnosis in another country or in another Canadian province or territory, as reported by an indicator in individual case records (see next section for more details).
Finalizing the first-time HIV diagnoses dataset
The 2021 report represents the first reporting year where all thirteen provinces and territories (PTs) submitted data for first-time diagnoses only or submitted data about all cases and included an indicator to identify cases that had previously been diagnosed out of the country (OOC) or out of the province or territory (OOP). OOP cases are those who received their first ever HIV diagnosis in a province or territory other than the PT making the report of the case. The final count of first-time HIV diagnoses for the surveillance period, January 1 to December 31, 2021, was produced by combining the cases from the PTs who report only first-time diagnoses with those cases identified as first-time diagnoses from the PTs who submit all cases. Cases identified as previously diagnosed were excluded (Figure 1).
In 2021, there were 1,679 total reported HIV cases, of which 213 were previous diagnoses (161 were classified as OOC, 26 were classified as OOP, and 26 were classified generally as a previous diagnosis). With the previously diagnosed cases removed, there were a total of n=1,466 cases classified as first-time HIV diagnoses and used for further analyses in this report (Figure 1).
As part of the data submission for this report and for the 2020 report, some PTs provided OOC and OOP indicators for previous years. Data submissions by PT for reporting years between 2012 and 2021 are outlined in Figure A1 (Appendix 2). All known OOC and OOP cases were excluded in the creation of the 2012-2021 national first-time diagnosis dataset, which includes 17,233 records for use in trend analysis. Due to variation in the ability to provide OOC/OOP flags for historical years by PTs, this total likely includes some previously diagnosed cases. For this reason, trend analyses must be considered with caution. With updates to historical data by PT public health authorities as part of future data submissions, it is anticipated that the accuracy of the first-time diagnosis dataset may improve over time.
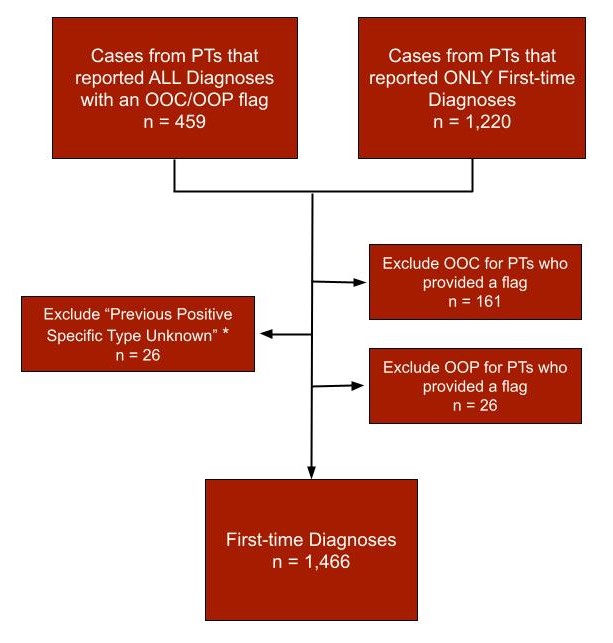
Figure 1: Text description
This flowchart breaks down HIV case data submitted by provinces and territories (PTs) for cases diagnosed in 2021. It details how data was handled to create the final national dataset that includes only first-time diagnoses.
Three data types were combined: 1) cases from PTs that reported all diagnoses with an out of country or out of province flag (OOC/OOP), with an n value of 459; 2) cases from PTs that reported only first-time diagnoses, with an n value of 1,220.
Previously diagnosed cases were excluded from the final dataset. This included 161 OOC cases from PTs that provided a flag as well as 26 OOP cases from PTs who provided a flag. There were also an additional 26 cases that were previous positives specific type unknown – where there was insufficient information available to attribute them to either OOC or OOP – that were removed.
The final national dataset consisted of only first-time diagnoses, with a final n value of 1,466.
Abbreviations: PT, Province or Territory; OOC, Out of Country; OOP, Out of Province; n, number
* The 'Previous Positives Specific Type Unknown' are previously diagnosed cases that have been identified as previous positives, but insufficient information is available to attribute them to either OOC or OOP.
Surveillance data at a glance
First-time diagnoses
Overall trends in HIV diagnoses
In 2021, there were 1,466 cases of first-time HIV diagnoses reported in Canada. This is an increase of 10.9% compared with the number of cases reported in 2020 (1,322 cases). The national HIV diagnosis rate was 3.8 per 100,000 population (5.5 per 100,000 population in males and 2.1 per 100,000 population in females). Between 2012 and 2019, the national diagnosis rate fluctuated within a narrow range (between 4.7 and 5.2 per 100,000) before decreasing sharply overall, as well as in males and females, in 2020. Though there was a slight increase in 2021, this rate has not yet returned to pre-COVID-19 pandemic levels. In the five-year period before the pandemic (2015-2019), the HIV diagnosis rate in males decreased overall from 7.7 per 100,000 population in 2015 to 6.6 per 100,000 population in 2019. In comparison, the HIV diagnosis rate in females increased from 2.2 per 100,000 population in 2015 to 2.7 per 100,000 population in 2019 (Figure 2, Data Table 1).
Note that the data tables used to generate figures are found at the end of this report (Data Tables, 1-10)
Diagnosis rate – the number of people diagnosed with HIV for the first time in a given year for every 100,000 people in the population of Canada that year. This diagnosis data is what is presented in this report.
Incidence – the estimated number of new infections occurring during a specific period of time, including people who have not been tested.
Prevalence – the estimated number of people living with HIV - both diagnosed and undiagnosed.
Incidence and prevalence are estimated by the Estimates and Field Surveillance Section and are not presented in this report.Footnote 6
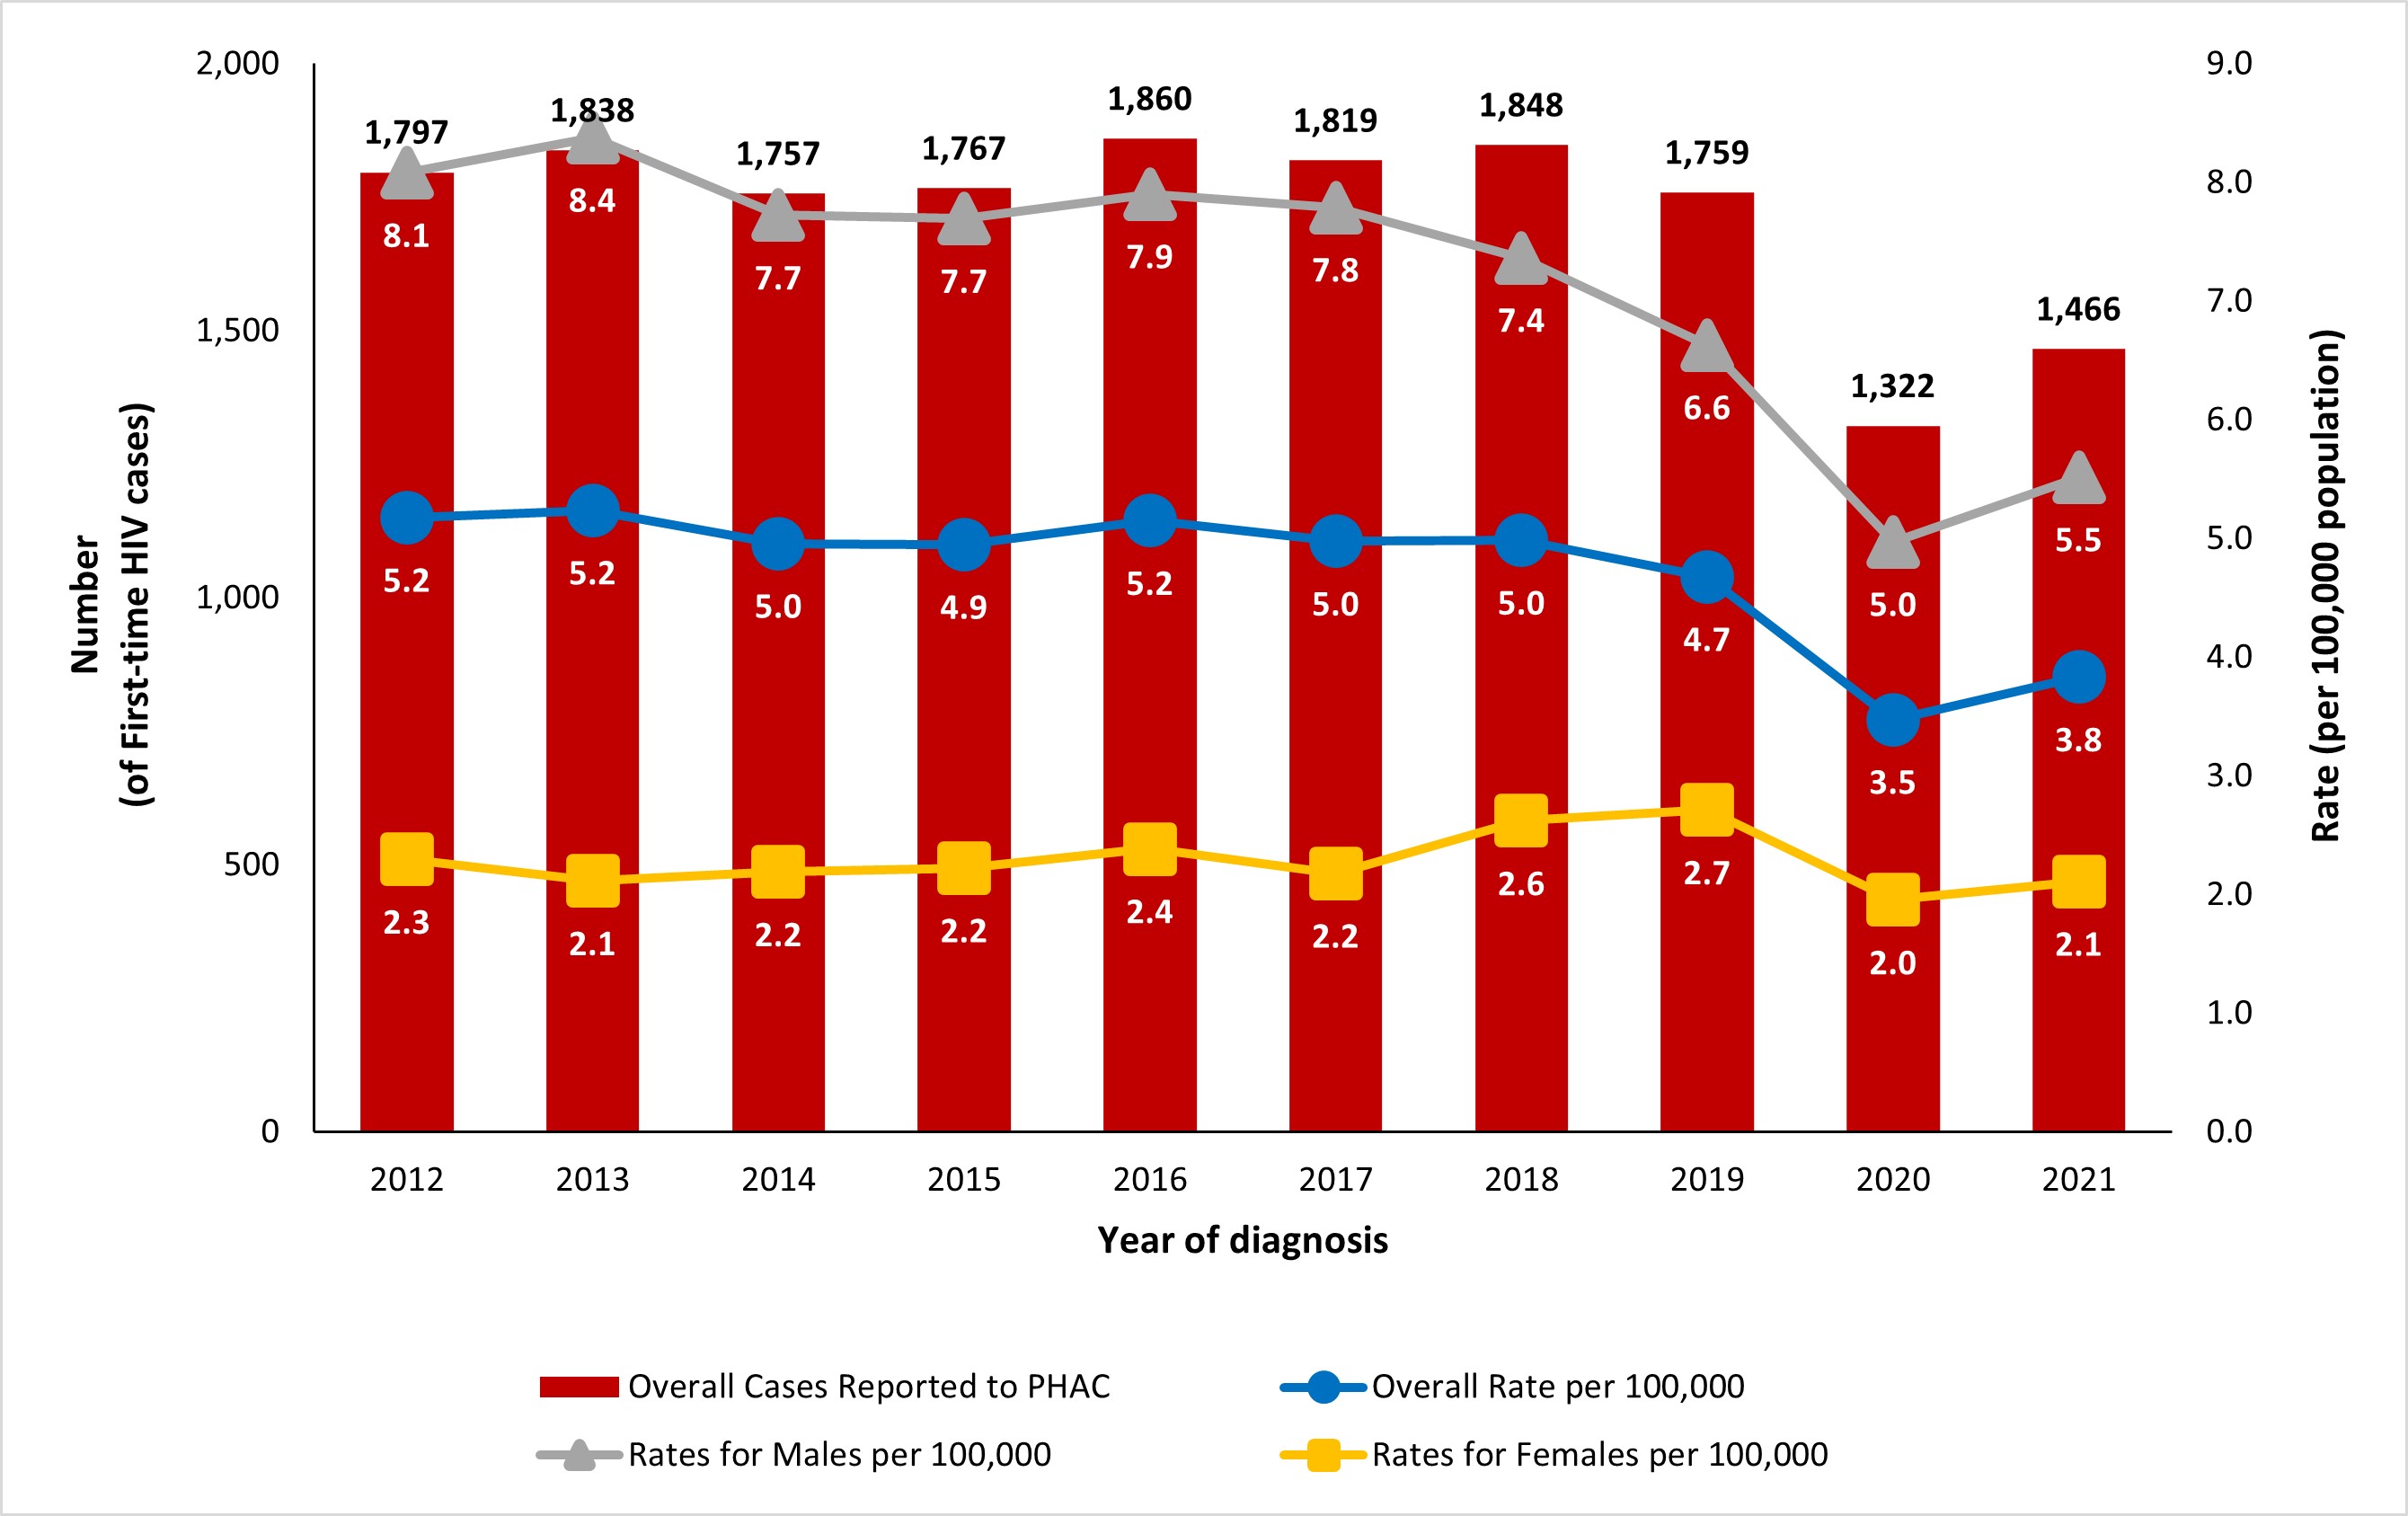
Figure 2: Text description
| Year of diagnosis | Overall first-time diagnoses | Overall rate per 100,000 | Males rate per 100,000 | Females rate per 100,000 |
|---|---|---|---|---|
| 2012 | 1,797 | 5.2 | 8.1 | 2.3 |
| 2013 | 1,838 | 5.2 | 8.4 | 2.1 |
| 2014 | 1,757 | 5.0 | 7.7 | 2.2 |
| 2015 | 1,767 | 4.9 | 7.7 | 2.2 |
| 2016 | 1,860 | 5.2 | 7.9 | 2.4 |
| 2017 | 1,819 | 5.0 | 7.8 | 2.2 |
| 2018 | 1,848 | 5.0 | 7.4 | 2.6 |
| 2019 | 1,759 | 4.7 | 6.6 | 2.7 |
| 2020 | 1,322 | 3.5 | 5.0 | 2.0 |
| 2021 | 1,466 | 3.8 | 5.5 | 2.1 |
- Figure 2 a
-
Rates and counts for Males and Females exclude cases where sex was reported as transgender, or cases where sex was not reported. For the Overall rates, transgender, or sex not reported cases are included.
- Figure 2 b
-
For the years 2020 and 2021, first-ever diagnoses are reported for all provinces/territories. Refer to the Technical Notes (Appendix 2) for the submission of first-ever diagnosis for historical data for each province/territory.
Geographic distribution
The first-time HIV diagnosis rates across Canada are shown in Figure 3. Rates for the Territories (Northwest Territories, Nunavut, and Yukon) and the Atlantic region (New Brunswick, Newfoundland and Labrador, Nova Scotia, and Prince Edward Island) are presented as regional averages (average of each provincial or territorial rate). Saskatchewan continues to have the highest rate; the Territories and the Atlantic region has the lowest rate. While the overall national rate increased from 2020 to 2021, this was not uniform across all provinces and territories (PTs). An increase in HIV diagnosis rate was observed in all PTs from 2020 to 2021 except for Ontario (which decreased from 3.5 to 3.3. per 100,000) and the Territories (decreased from 2.3 to 1.6 per 100,000). These rates remain below pre-pandemic levels in all PTs. (Figure 3, Data Table 2).
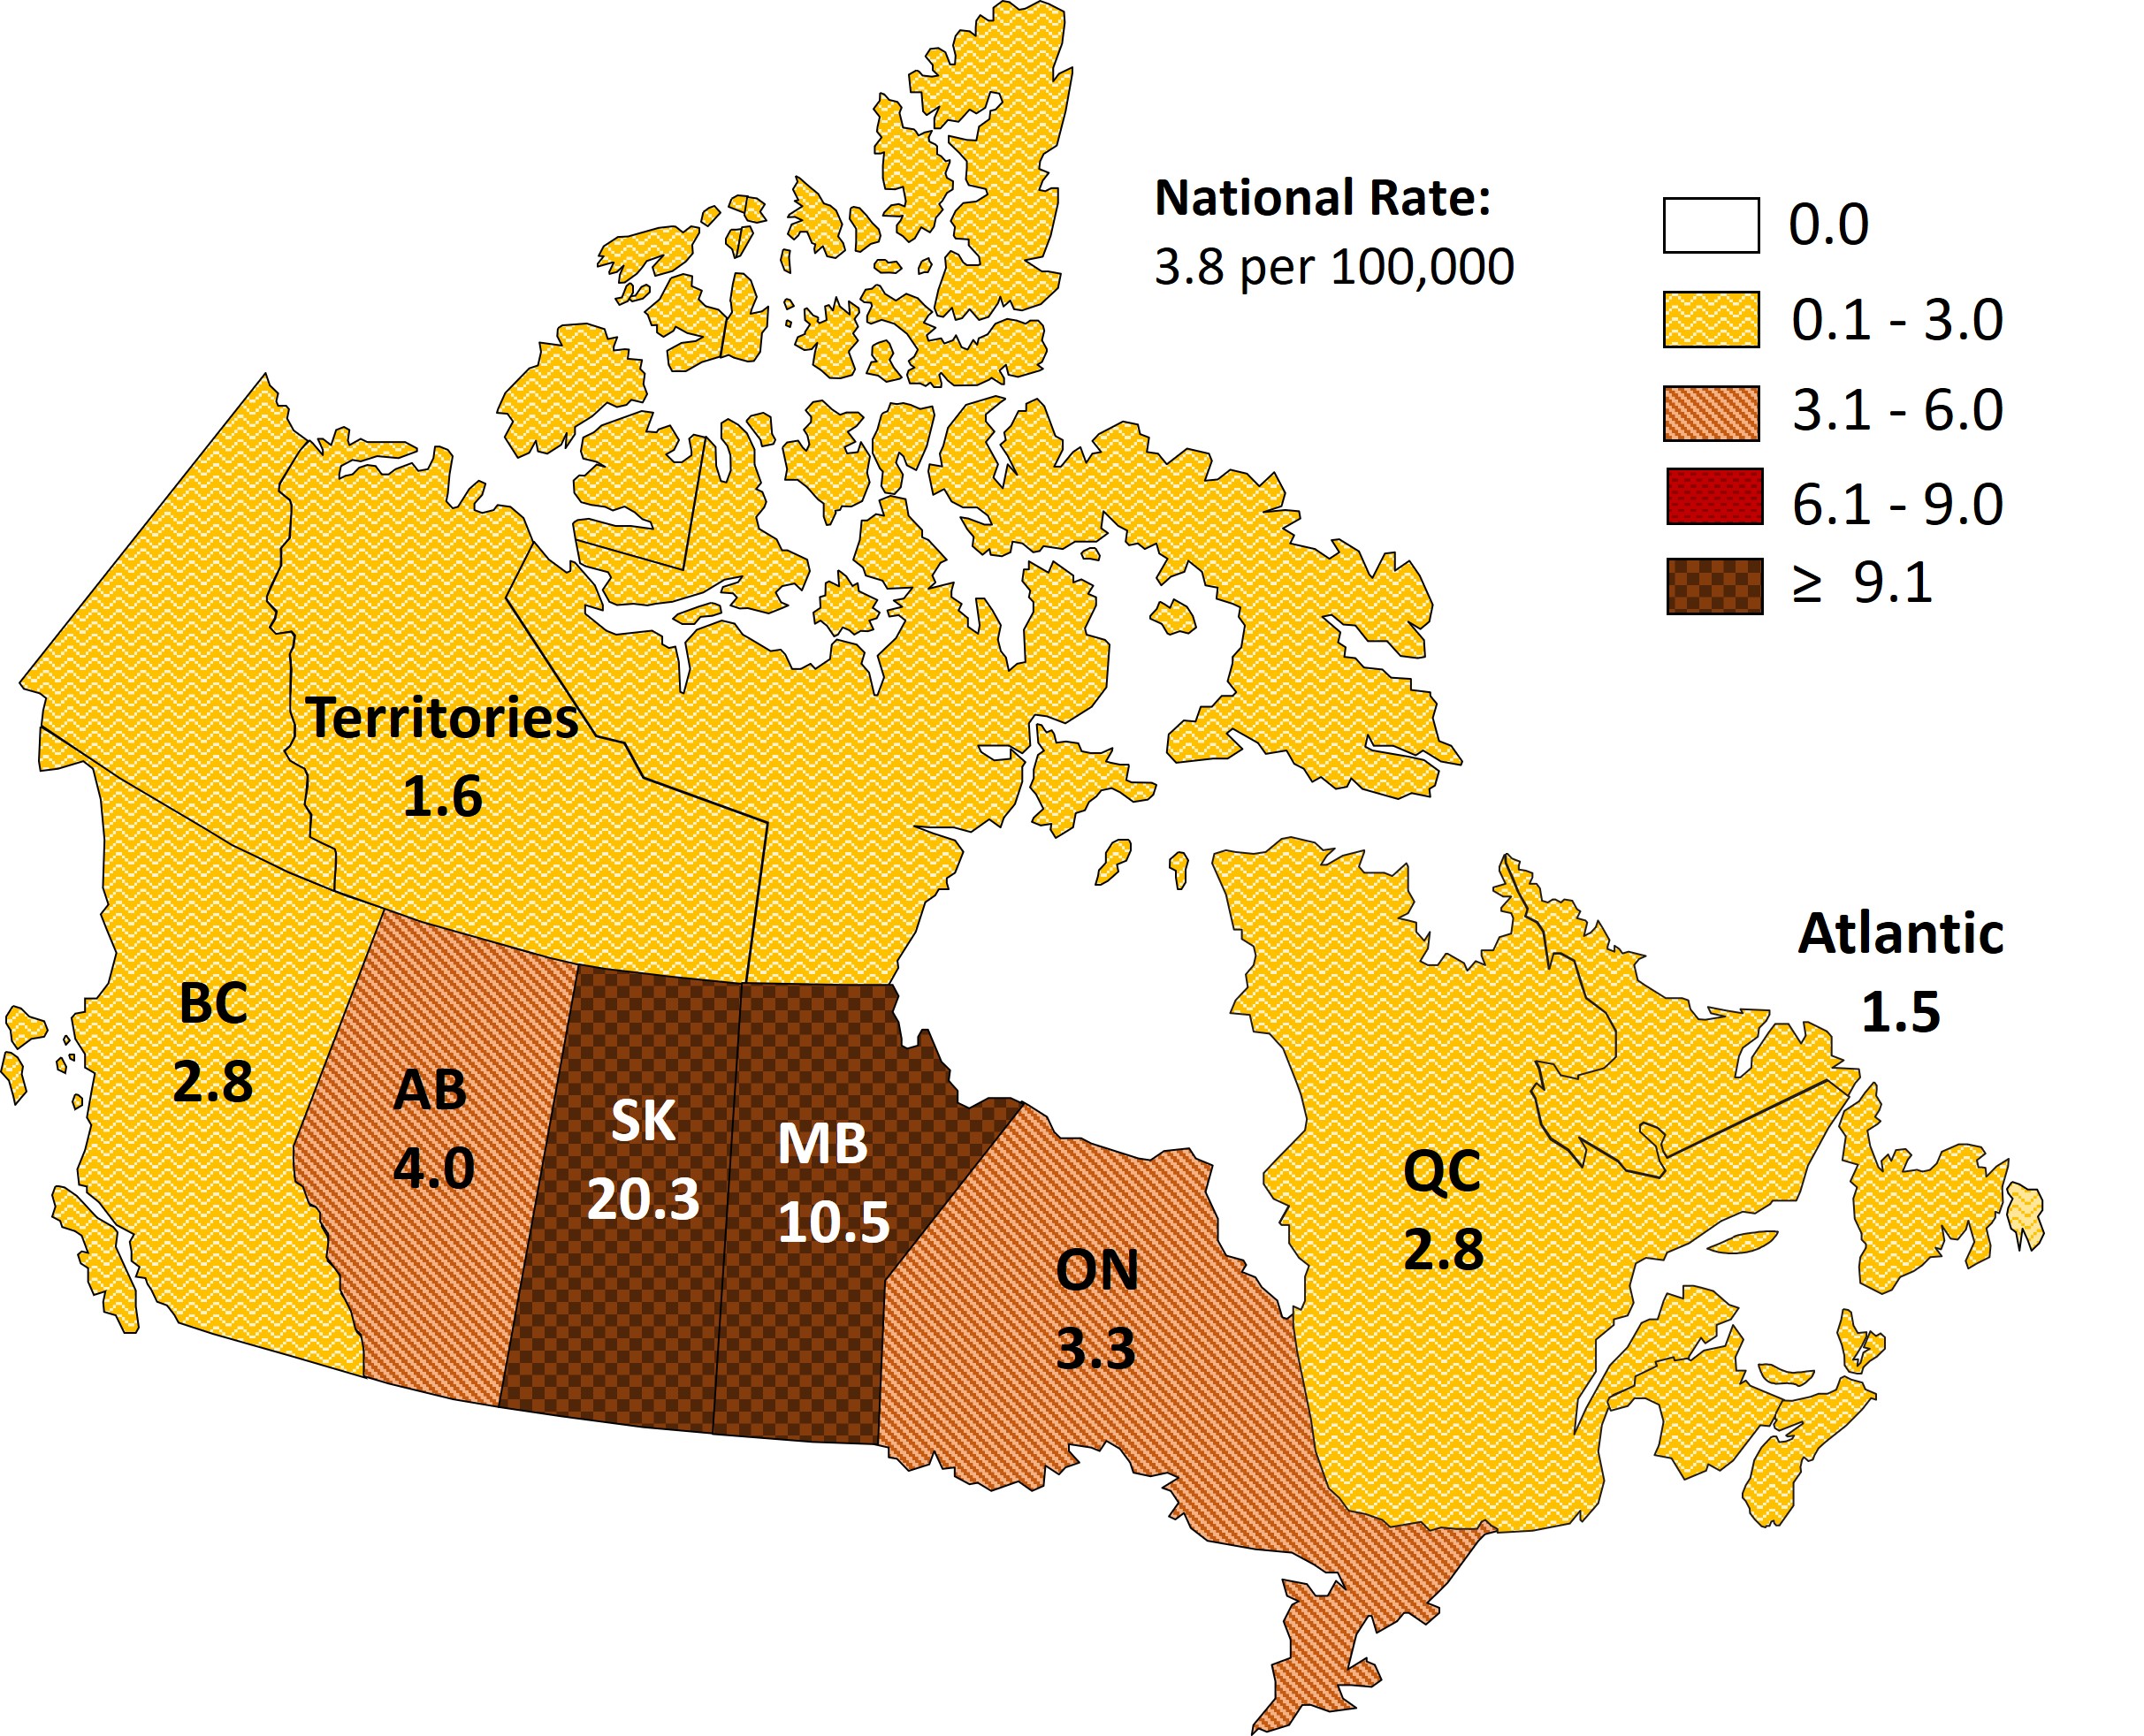
Figure 3: Text description
| Province | First-Time HIV Diagnosis Rate (per 100,000 population) |
|---|---|
| Alberta | 4.0 |
| Atlantic Region | 1.5 |
| British Columbia | 2.8 |
| Manitoba | 10.5 |
| Ontario | 3.3 |
| Quebec | 2.8 |
| Saskatchewan | 20.3 |
| Territories | 1.6 |
Abbreviations: BC, British Columbia; AB, Alberta; SK, Saskatchewan; MB, Manitoba; ON, Ontario; QC, Quebec; ≥, greater than or equal
- Figure 3 a
-
Note that for Alberta, national reporting excludes HIV cases where the location of first-ever positive has been identified as out-of-country or outside the reporting province; consequently, HIV case totals and rates in this report may differ from those reported by Alberta.
- Figure 3 b
-
Due to small case counts in certain provinces and territories, some regions are aggregated to ensure that individuals cannot be identified. For this reason, interprovincial or interterritorial comparisons cannot always be made.
Age group and sex distribution
In 2021, among the cases where sex was reported as male or female (n=1,455), males accounted for 72.1% of diagnoses (n=1,049), while females accounted for 27.9% (n=406). There were 11 cases where sex was either not reported, or reported as "transgender". First-time HIV diagnosis rates were also stratified based on age group and sex. The age-specific HIV diagnosis rate increased for all age groups in females from 2020 to 2021 except for the 15 to 19 year (1.5 per 100,000 in 2020 vs. 1.3 per 100,000 in 2021) and ≥50 year (constant at 0.9 per 100,000) age groups. In males, the age-specific HIV diagnosis rate increased in all age groups except for children <15 years (constant at 0.0 per 100,000). The highest observed HIV diagnosis rate was in the male 30 to 39 year age group, with a rate of 12.1 per 100,000 population. Similarly, the 30 to 39 year age group had the highest diagnosis rate among female cases at 5.0 per 100,000 population. In all age groups, HIV diagnosis rates were observed to be at least two times greater in males than in females, with the exceptions of the children <15 years and 15-to-19-year age group, in which females had a higher HIV diagnosis rate (Figure 4, Data Table 3).
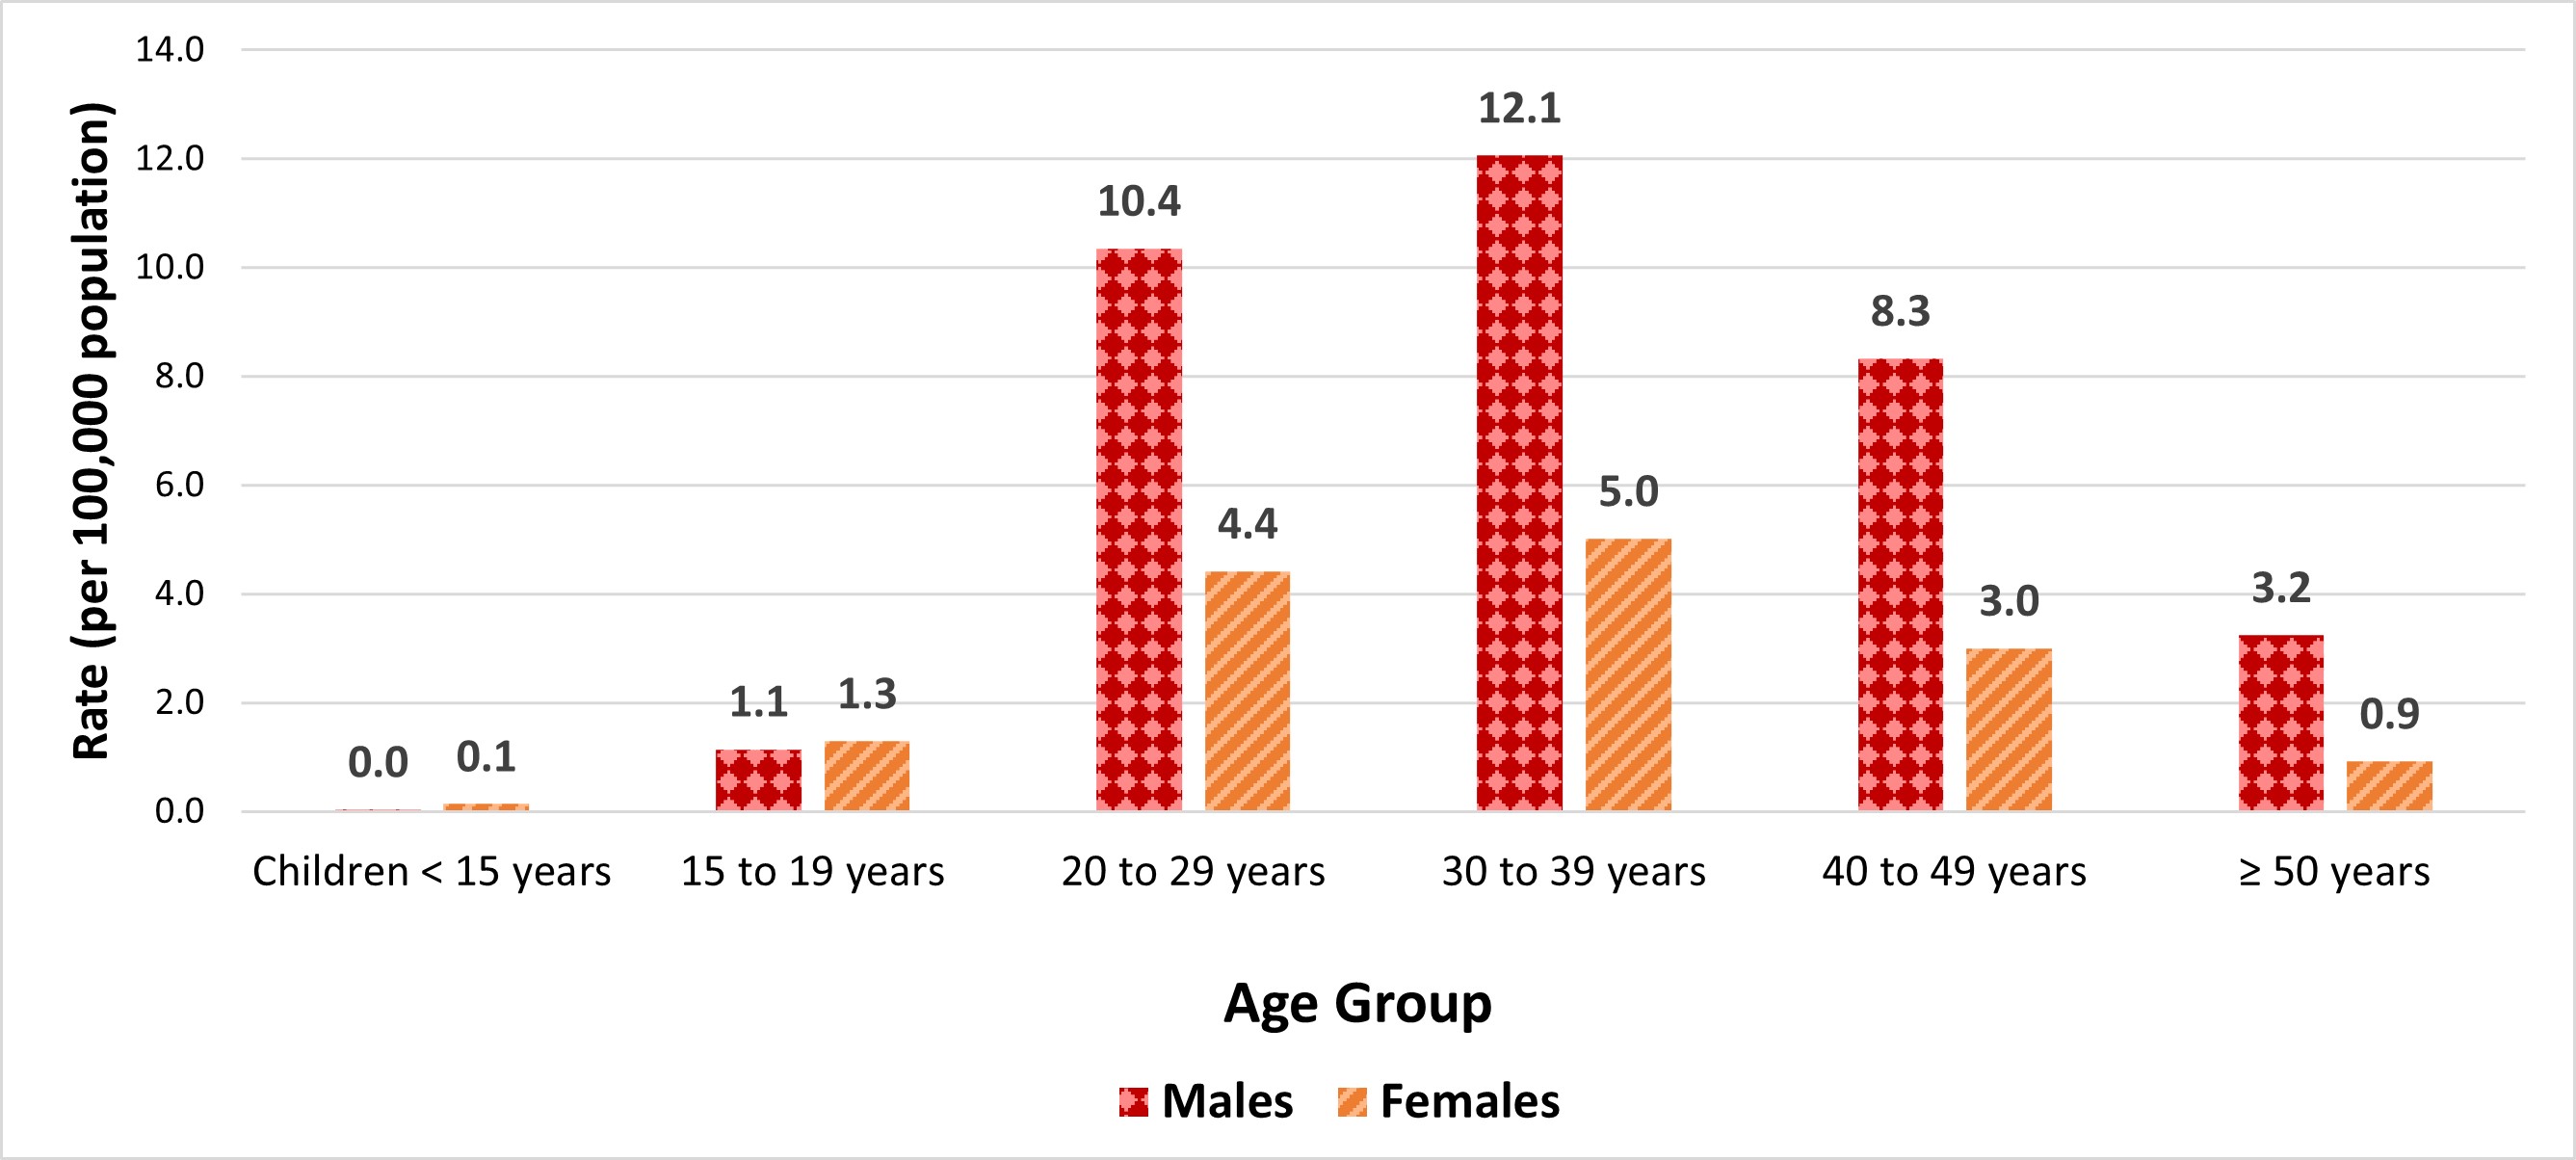
Figure 4: Text description
| Age group | Male rate per 100,000 | Female rate per 100,000 |
|---|---|---|
| Children <15 years | 0.03 | 0.1 |
| 15 to 19 years | 1.1 | 1.3 |
| 20 to 29 years | 10.4 | 4.4 |
| 30 to 39 years | 12.1 | 5.0 |
| 40 to 49 years | 8.3 | 3.0 |
| ≥50 years | 3.2 | 0.9 |
Abbreviations: < less than; ≥, greater than or equal
- Figure 4 a
-
Excludes cases where sex was reported as transgender or cases where sex was not reported. These data are excluded because there are not currently any estimates of transgender and gender-diverse population sizes by age and jurisdiction over time available from Statistics Canada. HASS is currently undergoing a renewal process and we are aiming to improve the inclusion of data representing transgender and gender-diverse populations in future years.
In recent years, HIV diagnosis rates have decreased in all age groups overall. The majority of HIV cases diagnosed in 2021 were between the ages of 20 and 49 years, which reflects trends observed in the previous ten years. As in previous years, in 2021 the highest diagnosis rate was observed in the 30 to 39 years old age group, with a rate of 8.6 per 100,000 population. The HIV diagnosis rate was 7.6 and 5.7 per 100,000 population in age groups 20 to 29 and 40 to 49, respectively. The lowest HIV diagnosis rate in adults was observed among those aged 15 to 19 years of age, with a diagnosis rate of 1.2 per 100,000 population. While the HIV diagnosis rate increased across age groups from 2020 to 2021, the age-specific HIV diagnosis rates in adults continued to be lower than diagnosis rates in the five-year period before the COVID-19 pandemic (Figure 5, Data Table 4).
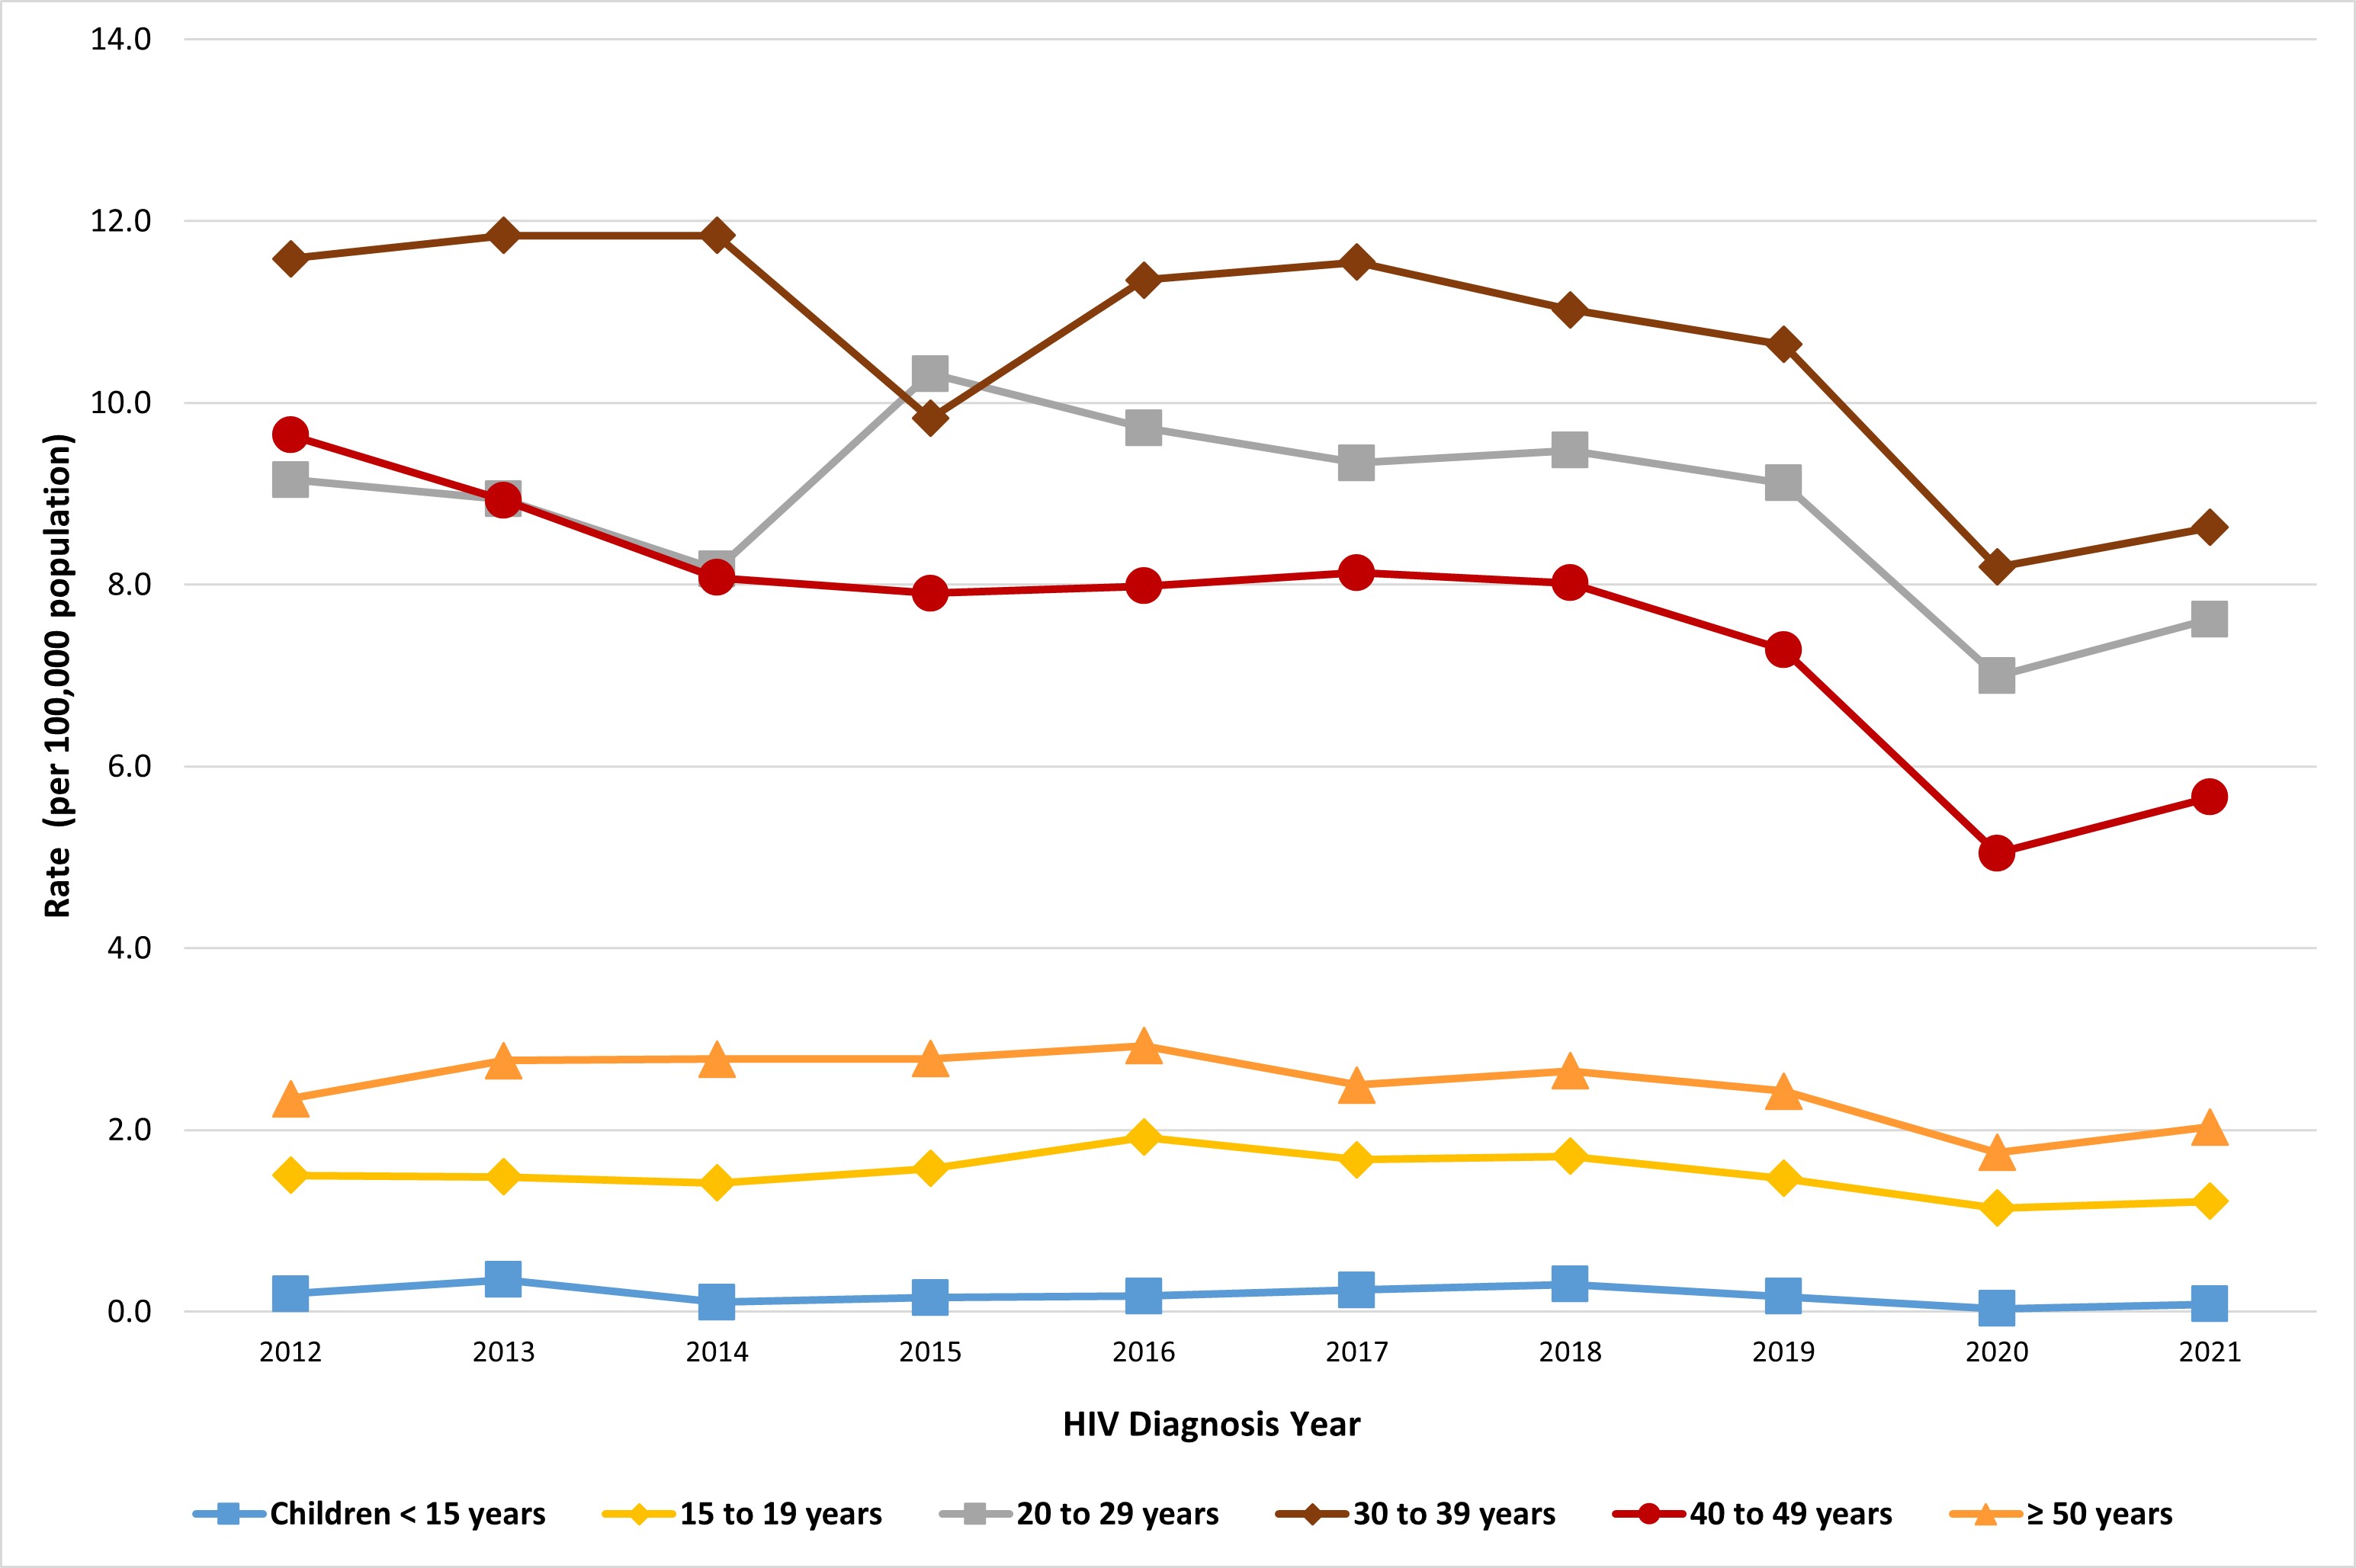
Figure 5: Text description
| First-time diagnosis rate per 100,00 population by year of diagnosis | ||||||||||
|---|---|---|---|---|---|---|---|---|---|---|
| Age Group | 2012 | 2013 | 2014 | 2015 | 2016 | 2017 | 2018 | 2019 | 2020 | 2021 |
| Children <15 years | 0.2 | 0.4 | 0.1 | 0.2 | 0.2 | 0.2 | 0.3 | 0.2 | 0.0 | 0.1 |
| 15 to 19 years | 1.5 | 1.5 | 1.4 | 1.6 | 1.9 | 1.7 | 1.7 | 1.5 | 1.1 | 1.2 |
| 20 to 29 years | 9.2 | 8.9 | 8.2 | 10.3 | 9.7 | 9.3 | 9.5 | 9.1 | 7.0 | 7.6 |
| 30 to 39 years | 11.6 | 11.8 | 11.8 | 9.8 | 11.3 | 11.5 | 11.0 | 10.6 | 8.2 | 8.6 |
| 40 to 49 years | 9.6 | 8.9 | 8.1 | 7.9 | 8.0 | 8.1 | 8.0 | 7.3 | 5.0 | 5.7 |
| ≥50 years | 2.3 | 2.8 | 2.8 | 2.8 | 2.9 | 2.5 | 2.6 | 2.4 | 1.8 | 2.0 |
Abbreviations: < less than; ≥, greater than or equal
- Figure 5 a
-
For the years 2020 and 2021, first-ever diagnoses are reported for all provinces/territories. Refer to the Technical Notes (Appendix 2) for the submission of first-ever diagnosis for historical data for each province/territory.
Exposure category distribution
As in previous years, the largest proportion of adult HIV diagnoses was attributed to male-to-male sexual contact (39.7%, n = 471); followed by heterosexual contact at 33.8% (n = 400) (Table 1). In 2021, the proportion of HIV diagnoses attributed to injection drug use (IDU) decreased to 21.9% (n = 259) from 22.2% (n = 239) in 2020. It should be noted that in past years, the 'Other' category included cases with exposures outside of Canada, which as noted previously, were removed from the dataset.
In males (≥ 15 years of age), in 2021, the majority of cases were attributed to male-to-male sexual contact (54.2%, n = 469), followed by heterosexual contact (24.0%, n = 208) and IDU (15.9%, n = 138). Among females (≥ 15 years of age), exposure through heterosexual contact accounted for the highest proportion at 60.4% (n = 191), followed by IDU (38.3%, n = 121) (Table 1).
| Exposure category | Male | Female | TotalTable 1 footnote a | |||
|---|---|---|---|---|---|---|
| n | %Table 1 footnote b | n | %Table 1 footnote b | n | %Table 1 footnote b | |
| Male-to-male sexual contact | 469 | 54.2 | n/a | n/a | 471 | 39.7 |
| Male-to-male sexual contact and IDU | 44 | 5.1 | n/a | n/a | 44 | 3.7 |
| IDU | 138 | 15.9 | 121 | 38.3 | 259 | 21.9 |
| Heterosexual contact | 208 | 24.0 | 191 | 60.4 | 400 | 33.8 |
| OtherTable 1 footnote c | 7 | 0.8 | 4 | 1.3 | 11 | 0.9 |
| Subtotal | 866 | 82.9 | 316 | 79.2 | 1,185 | 81.5 |
| No identified riskTable 1 footnote d | 27 | 2.6 | 13 | 3.3 | 42 | 2.9 |
| Exposure category unknown or not reported ("missing") | 152 | 14.5 | 70 | 17.5 | 227 | 15.6 |
| Total | 1,045 | n/a | 399 | n/a | 1,454 | n/a |
Abbreviations: n, number; n/a, not applicable; IDU, injection drug use Refer to Appendix 3 for details regarding exposure categories. |
||||||
The distributions for exposure categories in males and females for the last ten years are shown in Figure 6a and 6b. Among males, the distribution of diagnoses within the different exposure categories fluctuated slightly since 2012 but remained relatively stable overall (Figure 6a, Data Table 5b). For females, in the last ten years, the proportion of cases attributed to the IDU exposure category remained stable between 2012 and 2018, followed by increases from 2019 through 2020 and a subsequent decrease to 38.3% in 2021 from 40.2% in 2020 (Figure 6b, Data Table 5c).
Caution is advised when comparing the 2021 data with that of previous years. Beginning in 2020, cases considered OOC have been removed from the 'Other' exposure category (with the exception of some cases from Alberta), following the methodological change to reporting only first-time diagnoses. This results in an overall reduction in the number of cases - from all reported cases to first-time diagnoses only and may have influenced the proportions of the exposure categories.
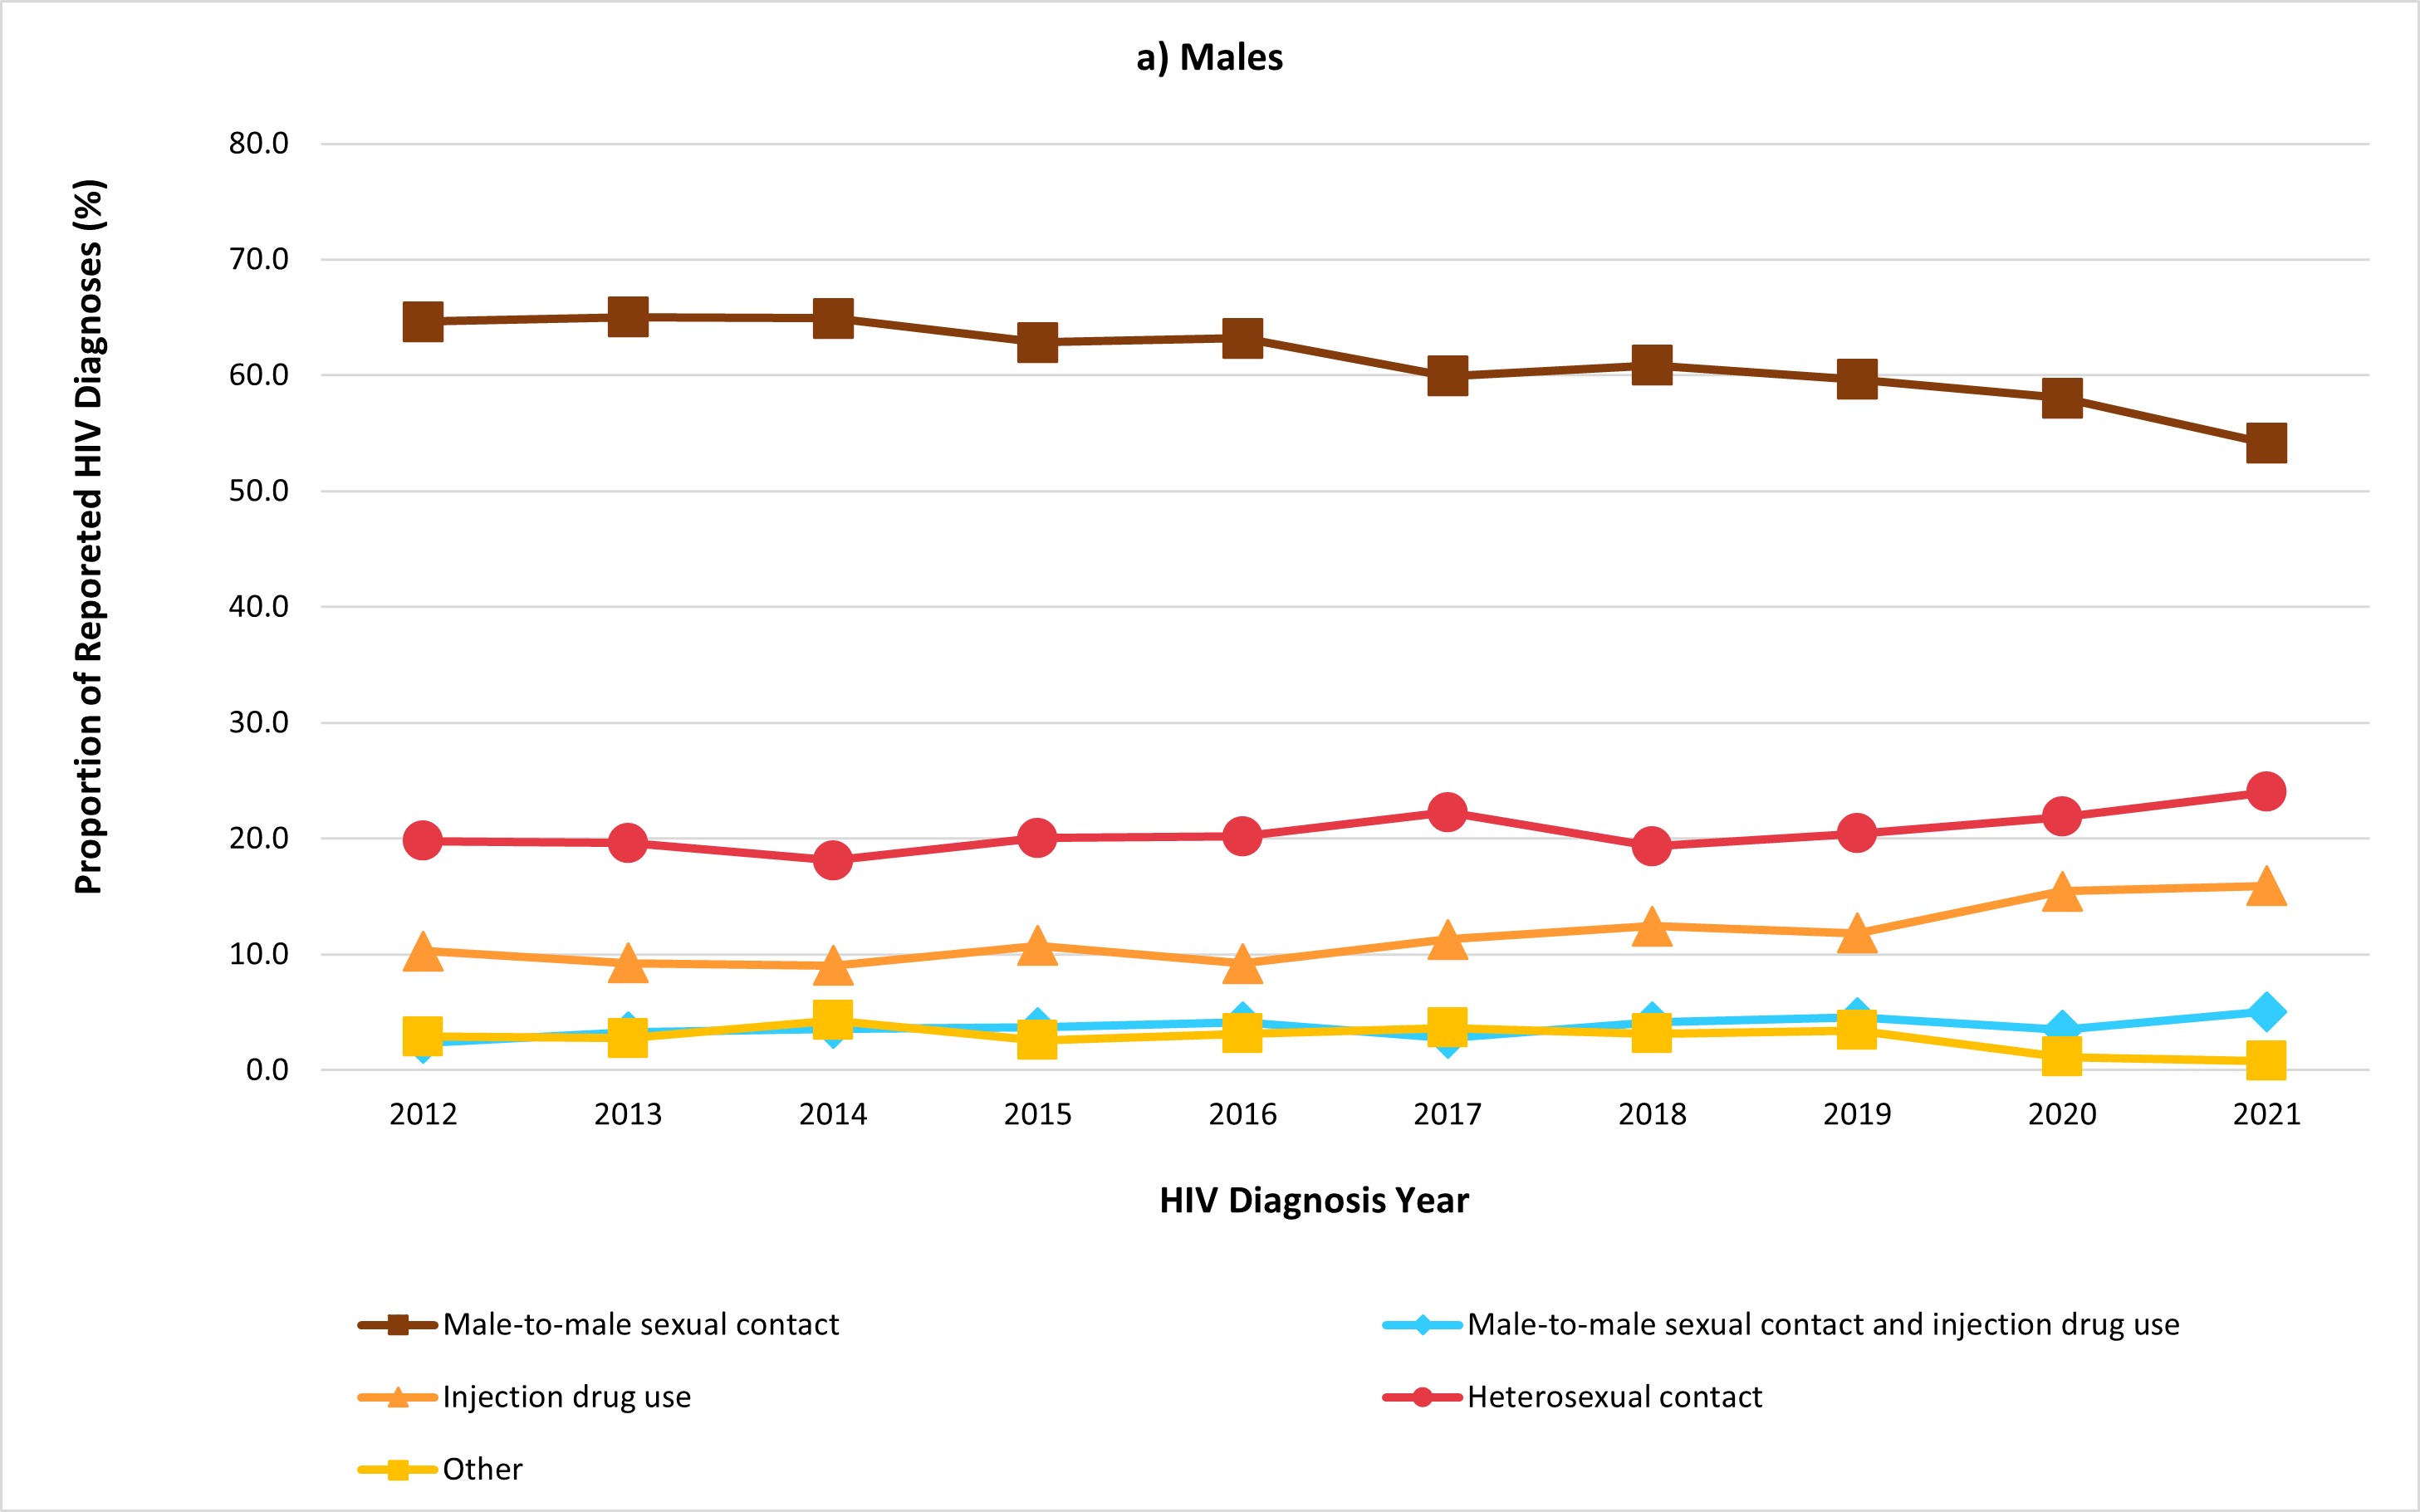
Figure 6a: Text description
| Exposure category | Percentage distribution of HIV cases among males (≥ 15 years old) by year | |||||||||
|---|---|---|---|---|---|---|---|---|---|---|
| 2012 | 2013 | 2014 | 2015 | 2016 | 2017 | 2018 | 2019 | 2020 | 2021 | |
| Male-to-male sexual contact | 64.7 | 65.0 | 64.9 | 62.9 | 63.2 | 60.0 | 60.9 | 59.7 | 58.0 | 54.2 |
| Male-to-male sexual contact and injection drug use | 2.4 | 3.3 | 3.6 | 3.7 | 4.2 | 2.8 | 4.2 | 4.6 | 3.5 | 5.1 |
| Injection drug use | 10.3 | 9.2 | 9.1 | 10.8 | 9.2 | 11.3 | 12.4 | 11.9 | 15.4 | 15.9 |
| Heterosexual contact | 19.8 | 19.6 | 18.1 | 20.1 | 20.2 | 22.3 | 19.4 | 20.4 | 21.9 | 24.0 |
| Other | 2.9 | 2.8 | 4.3 | 2.6 | 3.2 | 3.7 | 3.2 | 3.5 | 1.2 | 0.8 |
- Figure 6a a
-
Excludes cases with no identified risk, an unknown exposure category, or where the exposure category was not reported.
- Figure 6a b
-
For the years 2020 and 2021, first-ever diagnoses are reported for all provinces/territories. Refer to Technical Notes (Appendix 2) for the submission of first-ever diagnosis for historical data for each province/territory and for exposure category.
- Figure 6a c
-
Other includes blood/blood products, occupational exposure, cases from Alberta identified through Immigration Refugees and Citizenship Canada, and other exposure categories.
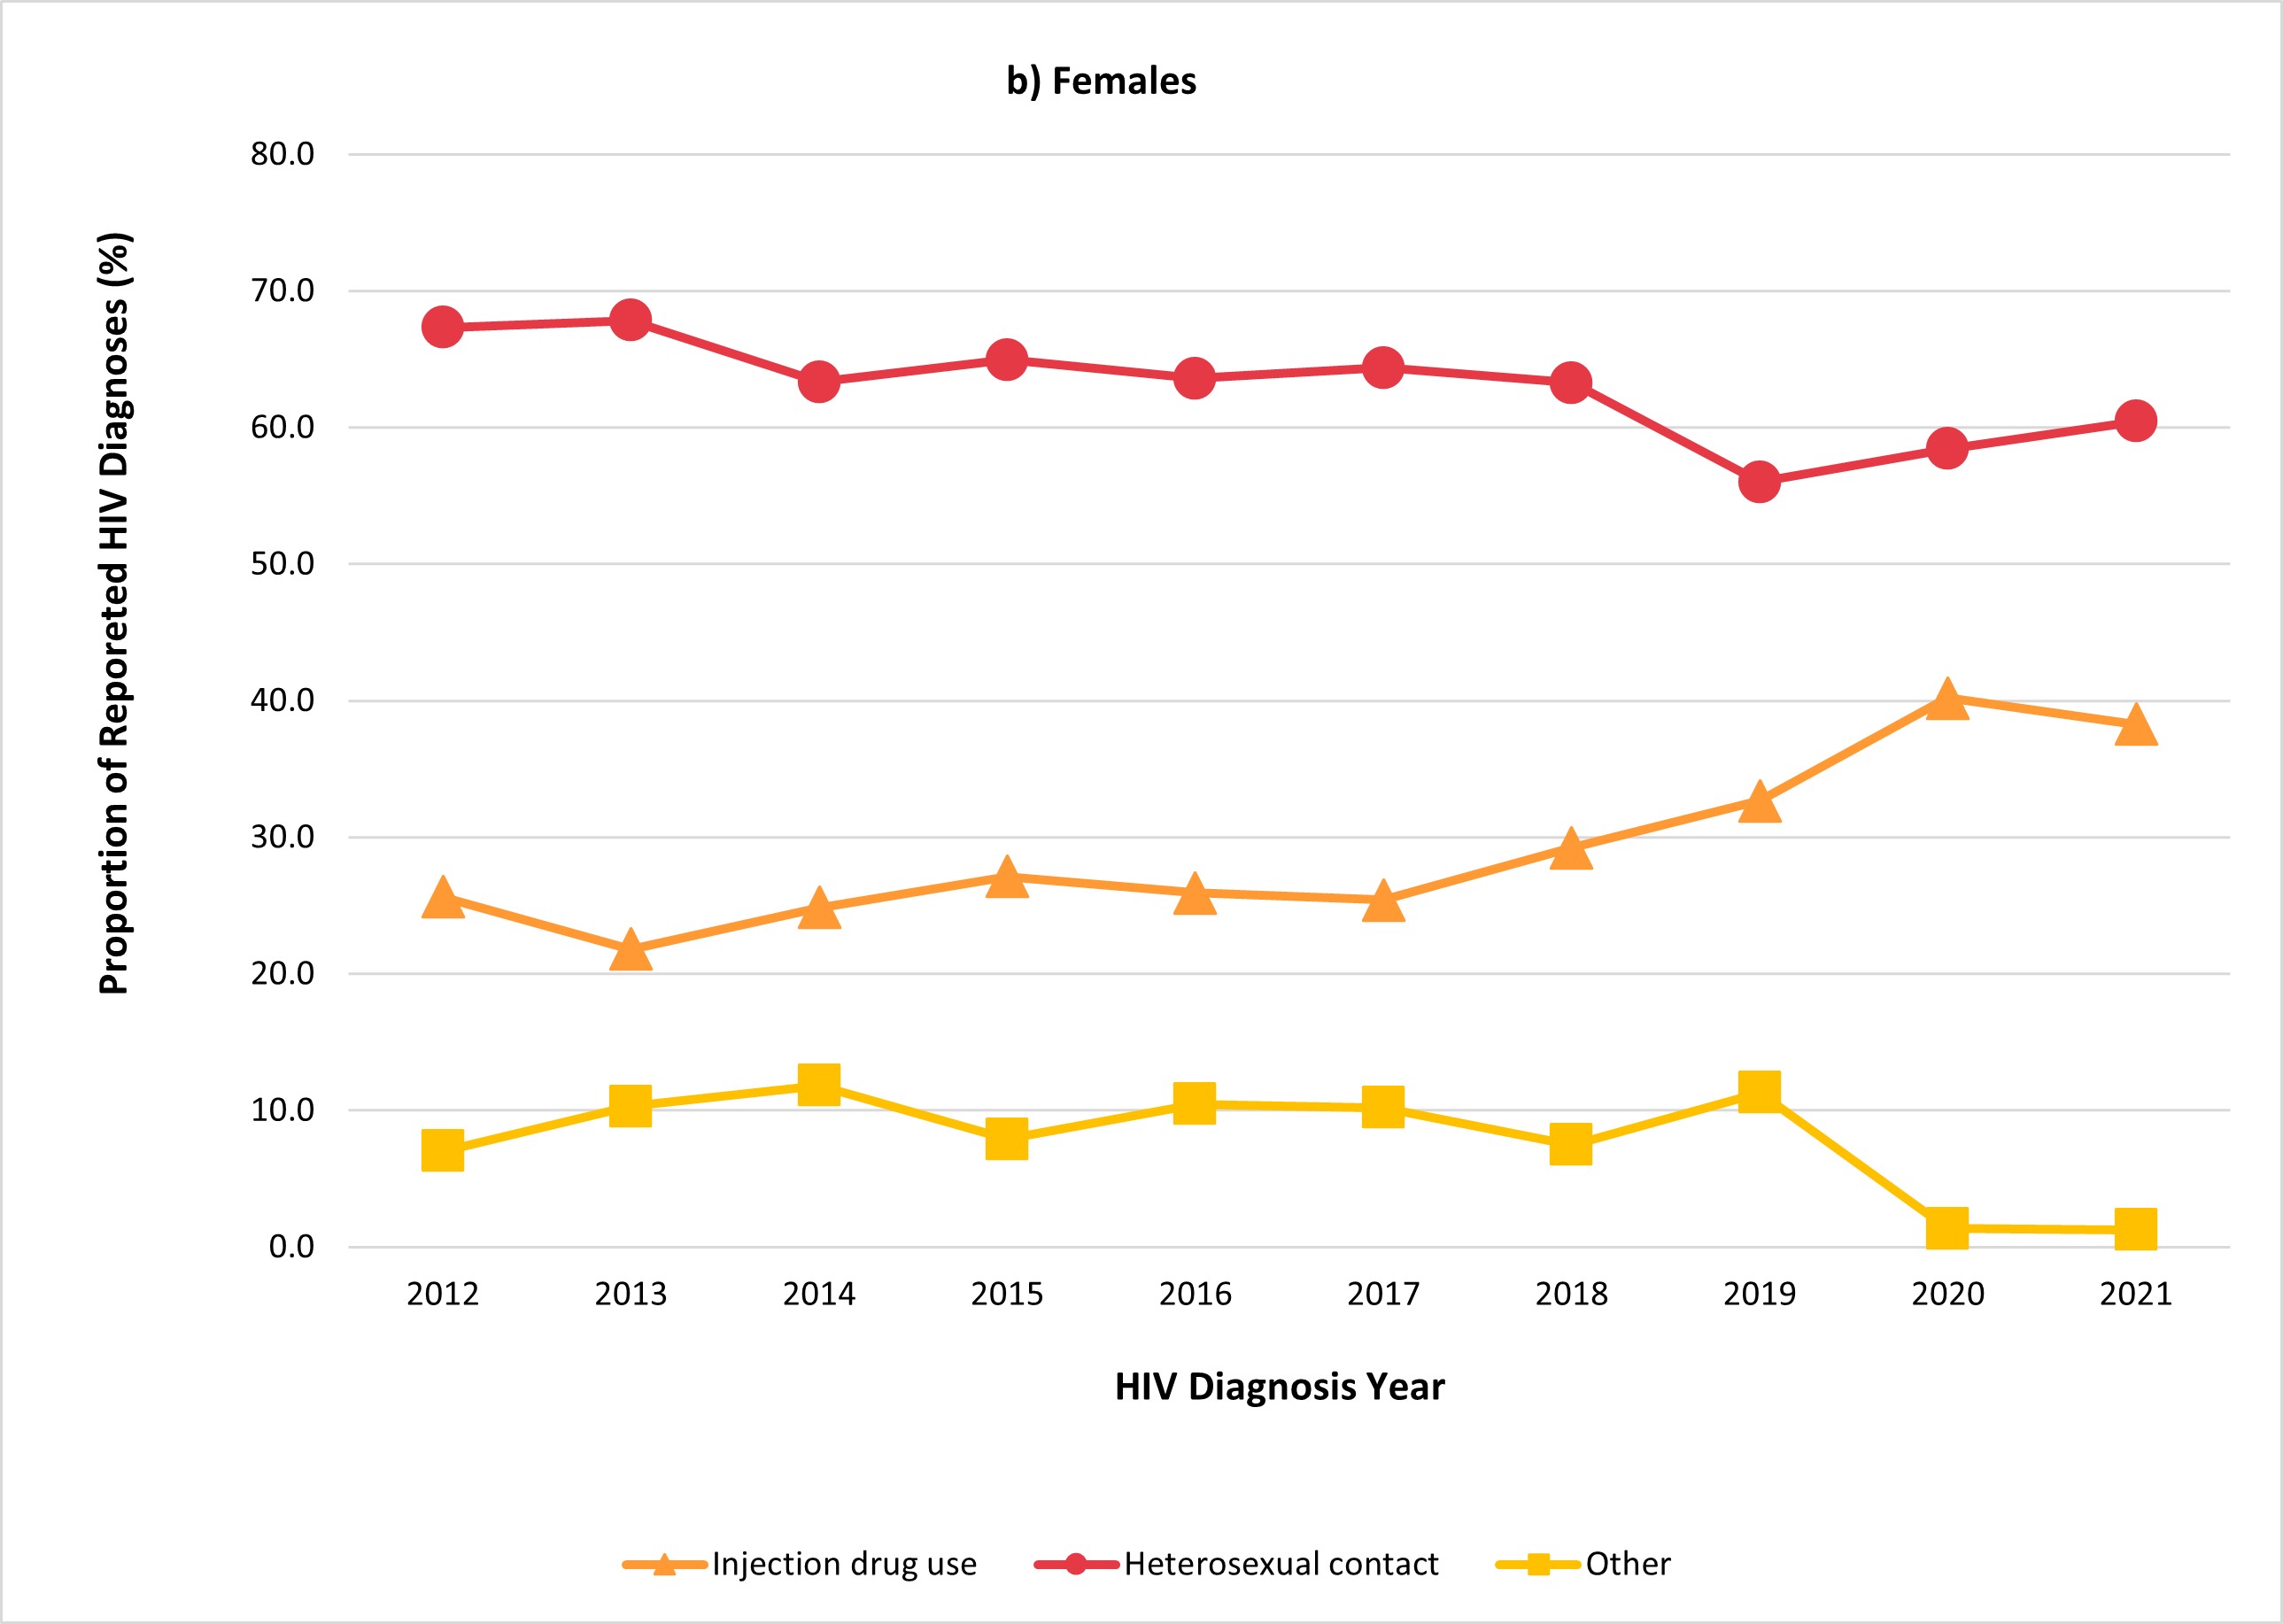
Figure 6b: Text description
| Exposure category | Percentage distribution of HIV cases among females (≥ 15 years old) by year | |||||||||
|---|---|---|---|---|---|---|---|---|---|---|
| 2012 | 2013 | 2014 | 2015 | 2016 | 2017 | 2018 | 2019 | 2020 | 2021 | |
| Injection drug use | 25.6 | 21.8 | 24.8 | 27.1 | 25.9 | 25.4 | 29.2 | 32.7 | 40.2 | 38.3 |
| Heterosexual contact | 67.3 | 67.8 | 63.3 | 65.0 | 63.6 | 64.4 | 63.3 | 56.0 | 58.4 | 60.4 |
| Other | 7.0 | 10.3 | 11.8 | 7.9 | 10.5 | 10.2 | 7.5 | 11.3 | 1.4 | 1.3 |
- Figure 6b a
-
Excludes cases with no identified risk, an unknown exposure category, or where the exposure category was not reported.
- Figure 6b b
-
For the years 2020 and 2021, first-ever diagnoses are reported for all provinces/territories. Refer to Technical Notes (Appendix 2) for the submission of first-ever diagnosis for historical data for each province/territory and for exposure category.
- Figure 6b c
-
Other includes blood/blood products, occupational exposure, cases from Alberta identified through Immigration Refugees and Citizenship Canada, and other exposure categories.
Exposure category and age group
Among the 20-29 and 30-39 year age groups, male-to-male sexual contact was the largest exposure category reported, 49.2% to 39.6% of cases respectively. In contrast, heterosexual contact accounted for 57.1%, 39.9%, and 44.5% of reported exposures in the 15 to 19 year, the 40 to 49 year, and the ≥50 year age groups, respectively. (Figure 7, Data Table 6).
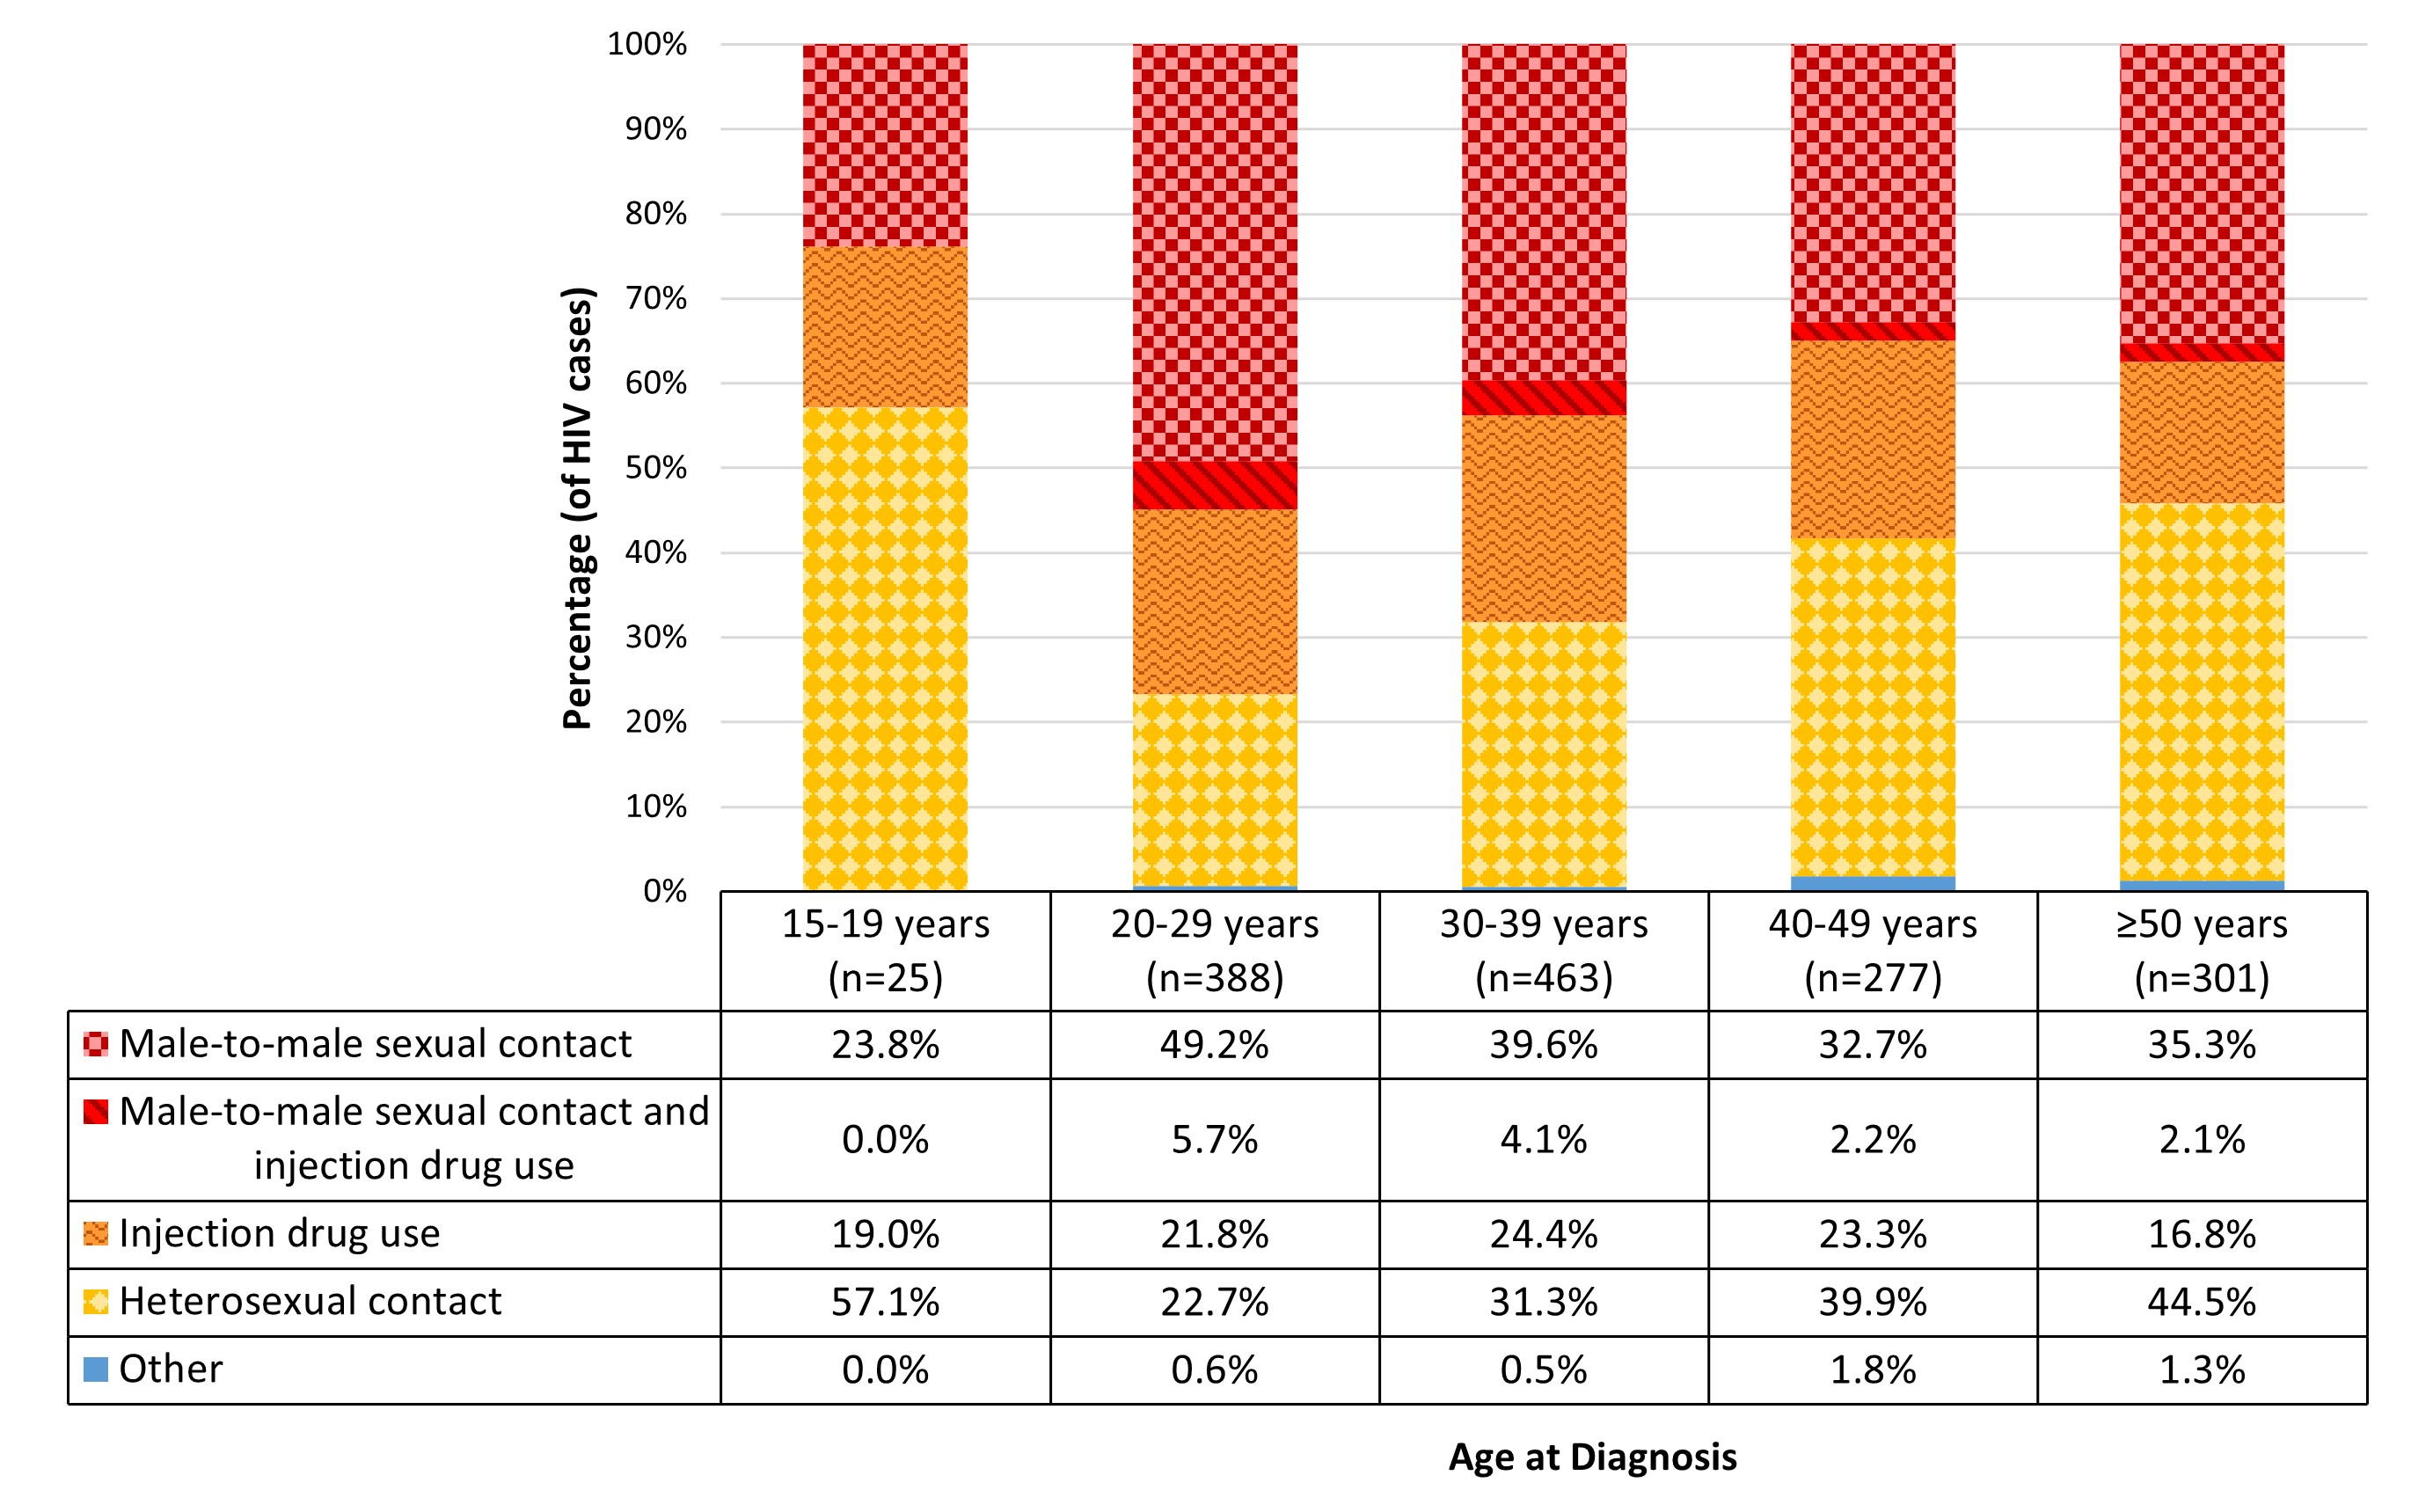
Figure 7: Text description
| Exposure category | Age group | ||||
|---|---|---|---|---|---|
| 15-19 years (n=25) | 20-29 years (n=388) | 30-39 years (n=463) | 40-49 years (n=277) | ≥50 years (n=301) | |
| Male-to-male sexual contact | 23.8% | 49.2% | 39.6% | 32.7% | 35.3% |
| Male-to-male sexual contact and injection drug use | 0.0% | 5.7% | 4.1% | 2.2% | 2.1% |
| Injection drug use | 19.0% | 21.8% | 24.4% | 23.3% | 16.8% |
| Heterosexual contact | 57.1% | 22.7% | 31.3% | 39.9% | 44.5% |
| Other | 0.0% | 0.6% | 0.5% | 1.8% | 1.3% |
Abbreviations: n, number; ≥, older than or equal
- Figure 7 a
-
Excludes cases with no identified risk, an unknown exposure category, or where the exposure category was not reported.
- Figure 7 b
-
"Other" includes blood/blood products, occupational exposure, cases from Alberta identified through Immigration Refugees and Citizenship Canada, and other exposure categories.
Race and/or ethnicity
Race and/or ethnicity information is important for monitoring the inequitable burden of disease experienced by equity seeking groups and for providing them with better care. However, the completeness of these data in HIV surveillance has historically been low, and currently quite low, with race and/or ethnicity information missing for more than half of cases in the past few years. The current review of the national HIV surveillance program, including the collection of race and/or ethnicity information, has been undertaken in an effort to modernize and strengthen surveillance to better meet the needs of data users. As part of these efforts, we are collaborating with data contributors, data users, and community-based partners to identify priorities and ensure data collection and dissemination are done safely and in ways that reduce harm to those populations most likely to be impacted.
Race is a social construct used to categorize people based on perceived physical differences (e.g., skin colour, facial features). While there is no scientifically accepted evidence of a biological basis for the identification and classification of discrete racial groups, ignoring race disregards the reality of injustices and social stratification within society. Disaggregating health indicators by race can therefore help us identify, monitor, and address inequalities that potentially stem from bias and racism — systemic, interpersonal, and internalized. Footnote 26 Race can be considered an important determinant of health that influences equity in health including the disproportionate burden of HIV in some communities, particularly Indigenous and Black communities.
Ethnicity is a multi-dimensional concept referring to cultural group membership; it may be connected to language, religious affiliation, or nationality, among other characteristics. Ethnicity data can be useful for tailoring culturally appropriate health services and understanding diversity. Footnote 26
Racialization is the process by which societies construct races as real, different, and unequal in ways that affect economic, political, and social life, and impose these constructions onto people. Footnote 27
Black, Indigenous and other racialized persons face unique challenges in accessing and receiving quality care, stemming from a history of colonialism, systemic and structural racism, and social inequities between white vs. non-white individuals, and Indigenous vs. non-Indigenous individuals in Canada. Stigma and discrimination, a lack of trust in health care professionals, and culturally inadequate or inappropriately tailored services are known barriers to accessing appropriate HIV care among these groups. Footnote 2 Footnote 28 Footnote 29 Footnote 30 Footnote 31 The collection of race and/or ethnicity-based information is a crucial element in recognizing and understanding these disparities. Footnote 26 Identifying the intersection of race with other social determinants of health, such as age, gender, and socioeconomic status, race-disaggregated data can help to provide a more fulsome picture of Canada's HIV landscape and barriers to care.
"Disaggregated data is a critical tool that helps make visible the ways in which structural racism, systemic white supremacy and social exclusion both harm Indigenous and racialized peoples and sustain unearned privilege for white settlers. By collecting race and Indigenous identifiers, and ensuring they are used in a good way in partnership with [Black, Indigenous, and other racialized persons], we can take collaborative actions towards our fully realized health and wellness through evidence-based and self-determined policies, programs, and services."
— Dr. Danièle Behn Smith, Deputy Provincial Health Officer, Indigenous Health, Ministry of Health, Government of British Columbia Footnote 26
The disproportionate, increased burden of HIV on racialized communities has been further demonstrated by reported impacts of the COVID-19 pandemic on access to health services. This was highlighted through surveys conducted by PHAC about the impacts of the COVID-19 pandemic on health service providers' ability to provide services and the impact of the pandemic on access to services for people from communities disproportionately impacted by HIV- Indigenous individuals, African, Caribbean and Black (ACB) individuals, and people who use drugs, including alcohol (PWUD).
Concerning access to support and treatment for people living with HIV (PLHIV): 20.6% of responding providers reported a strong decrease in their ability to provide services. More than half of these providers provided Indigenous health or healing practice services. Footnote 7 Among ACB individuals living with HIV in Canada, 38% of respondents reported experiencing challenges accessing an HIV care provider or clinic. Footnote 30 There was a noted increase experience, among ACB respondents, of in financial or food insecurity, domestic violence, substance use, and discrimination over the course of the COVID-19 pandemic, all of which have been linked to vulnerability to HIV infection. Footnote 30 This indicates that ACB communities are shouldering an even heavier HIV burden since the start of the COVID-19 pandemic.
Previously, race and/or ethnicity information were submitted by all provinces and territories (PTs) except Quebec and British Columbia. In 2021 Manitoba also excluded race and/or ethnicity information from their data submission. Completeness of the data submitted varies significantly across provinces and territories. In 2021, Quebec provided first-time diagnosis case information from 2012-2021, and as such, their case counts for 2012-2021 includes only first-time diagnoses instead of all cases as in previous years. Due to this update in historical data, the proportion of completeness reported in previous years has changed. In 2020, race and/or ethnicity information was available for only 44.6% of all cases submitted to PHAC, and in 2021 the proportion of complete data for race and/or ethnicity information was 45.3% (Table 2).
| HIV diagnosis year | Percent completeness (%) |
|---|---|
| 2012 | 55.8 |
| 2013 | 53.8 |
| 2014 | 53.6 |
| 2015 | 56.0 |
| 2016 | 56.1 |
| 2017 | 57.0 |
| 2018 | 54.2 |
| 2019 | 49.6 |
| 2020 | 44.6 |
| 2021 | 45.3 |
Refer to Appendix 2 for details on race/ethnicity categories reported by provinces and territories. |
|
Current reporting practices for race and/or ethnicity information, such as reporting categories, vary and are limited in some PTs. As such, findings should be interpreted with caution since a substantial portion of race and/or ethnicity information is missing or not reported. This missingness is not random, so the available data is likely not representative of the true national picture of race and/or ethnicity among HIV cases in Canada. Refer to Appendix 2 for additional details on the race and/or ethnicity categories reported by provinces and territories.
In 2021, of all cases (n = 1,466), 17.3% were reported as white, 10.8% were reported as Indigenous (First Nations, Inuit, Métis, or Indigenous-not otherwise specified), and 6.9% as Black. The distribution of cases across race and/or ethnicity categories varied based on sex. Among males, the highest proportion of cases was reported among white males (21.2%), followed by Indigenous males (7.6%). Comparatively, in females, the highest proportion of cases was reported among Indigenous females (19.5%), followed by Black females (8.6%) (Table 3 – All Cases, Figure 8a).
Among cases where race and/or ethnicity was reported (n = 664), the proportions need to be interpreted carefully as they represent only the cases where race and/or ethnicity was identified, for 2021. 38.3% of cases were reported as white, Indigenous (First Nations, Inuit, Métis, or Indigenous-not otherwise specified) people accounted for 23.9% of cases, and 15.4% were reported as Black. Among males, the highest proportion of cases was reported among white males (44.6%), followed by Indigenous males (16.1%). Comparatively, in females, the highest proportion of cases was reported among Indigenous females (47.9%), followed by Black females (21.2%) (Table 3 – Subset of Cases, Figure 8b).
Research and local public health surveillance data have revealed that racialized communities are disproportionately affected by HIV, yet low availability of race and/or ethnicity information collected through the HASS limits the ability to produce this evidence at the national level. From November 2022 to March 2023, a collaborative effort with community members led to the establishment of a Black Expert Working Group, which will provide advice to HASS and contribute to the co-development and implementation of strategies to improve the completeness of the race and/or ethnicity variable. The goals are to:
- help inform and support how PTs collect this data (depending on the needs of particular PTs);
- rebuild trust by demonstrating PHAC's commitment to pursuing the development of anti-racist and decolonial approaches, in partnership with PTs and community groups, leading to greater confidence among PTs that data they share with PHAC will be used appropriately;
- result in the availability of more complete, quality data, which will in turn inform the development of better research evidence and more appropriately tailored prevention programs. HASS is currently exploring an approach to similarly engage Indigenous organizations.
| All cases | Subset of cases with race and/or ethnicity reportedTable 3 footnote a | |||||||||||
|---|---|---|---|---|---|---|---|---|---|---|---|---|
| Race and/or ethnicity | Male | Female | TotalTable 3 footnote b | Male | Female | TotalTable 3 footnote b | ||||||
| n | % | n | % | n | % | n | % | n | % | n | % | |
| Indigenous | 80 | 7.6 | 79 | 19.5 | 159 | 10.8 | 80 | 16.1 | 79 | 47.9 | 159 | 23.9 |
| a) First Nations | 35 | 3.3 | 49 | 12.1 | 84 | 5.7 | 35 | 7.0 | 49 | 29.7 | 84 | 12.7 |
| b) Métis | 4 | 0.4 | 1 | 0.2 | 5 | 0.3 | 4 | 0.8 | 1 | 0.6 | 5 | 0.8 |
| c) Inuit | 1 | 0.1 | 0 | 0.0 | 1 | 0.1 | 1 | 0.2 | 0 | 0.0 | 1 | 0.2 |
| d) Indigenous, not otherwise specified | 40 | 3.8 | 29 | 7.1 | 69 | 4.7 | 40 | 8.0 | 29 | 17.6 | 69 | 10.4 |
| South Asian/West Asian/Arab | 30 | 2.9 | 7 | 1.7 | 37 | 2.5 | 30 | 6.0 | 7 | 4.2 | 37 | 5.6 |
| Asian | 46 | 4.4 | 3 | 0.7 | 49 | 3.3 | 46 | 9.2 | 3 | 1.8 | 49 | 7.4 |
| Black | 67 | 6.4 | 35 | 8.6 | 102 | 7.0 | 67 | 13.5 | 35 | 21.2 | 102 | 15.4 |
| Latin American | 42 | 4.0 | 5 | 1.2 | 48 | 3.3 | 42 | 8.4 | 5 | 3.0 | 48 | 7.2 |
| White | 222 | 21.2 | 32 | 7.9 | 254 | 17.3 | 222 | 44.6 | 32 | 19.4 | 254 | 38.3 |
| Another race and/or ethnicity | 11 | 1.0 | 4 | 1.0 | 15 | 1.0 | 11 | 2.2 | 4 | 2.4 | 15 | 2.3 |
| Subtotal | 498 | 47.5 | 165 | 40.6 | 664 | 45.3 | 498 | n/a | 165 | n/a | 664 | n/a |
| Not reported | 551 | 52.5 | 241 | 59.4 | 802 | 54.7 | 551 | n/a | 241 | n/a | 802 | n/a |
| Total | 1,049 | n/a | 406 | n/a | 1,466 | n/a | 1,049 | n/a | 406 | n/a | 1,466 | n/a |
Abbreviations: n, number; n/a, not applicable Refer to Appendix 2 for details on race/ethnicity categories reported by provinces and territories. |
||||||||||||
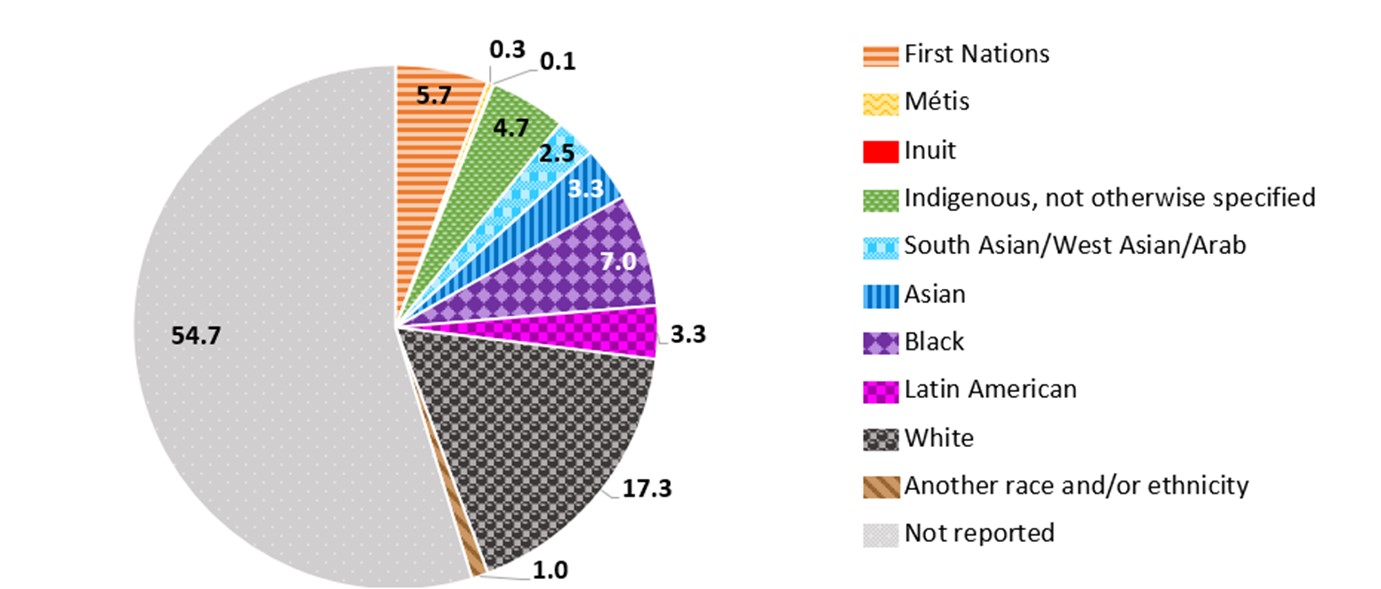
Figure 8a: Text description
| Race and/or ethnicity | Proportion (%) |
|---|---|
| First Nations | 5.7 |
| Métis | 0.3 |
| Inuit | 0.1 |
| Indigenous, not otherwise specified | 4.7 |
| South Asian/West Asian/Arab | 2.5 |
| Asian | 3.3 |
| Black | 7.0 |
| Latin American | 3.3 |
| White | 17.3 |
| Another race and/or ethnicity | 1.0 |
| Not reported | 54.7 |
Refer to Appendix 2 for details on race/ethnicity categories reported by provinces and territories.
- Figure 8 a
-
Race and/or ethnicity information is not submitted by Québec or Manitoba; for other jurisdictions, the race and/or ethnicity categories submitted and completion rate varied, interpret data with extreme caution.
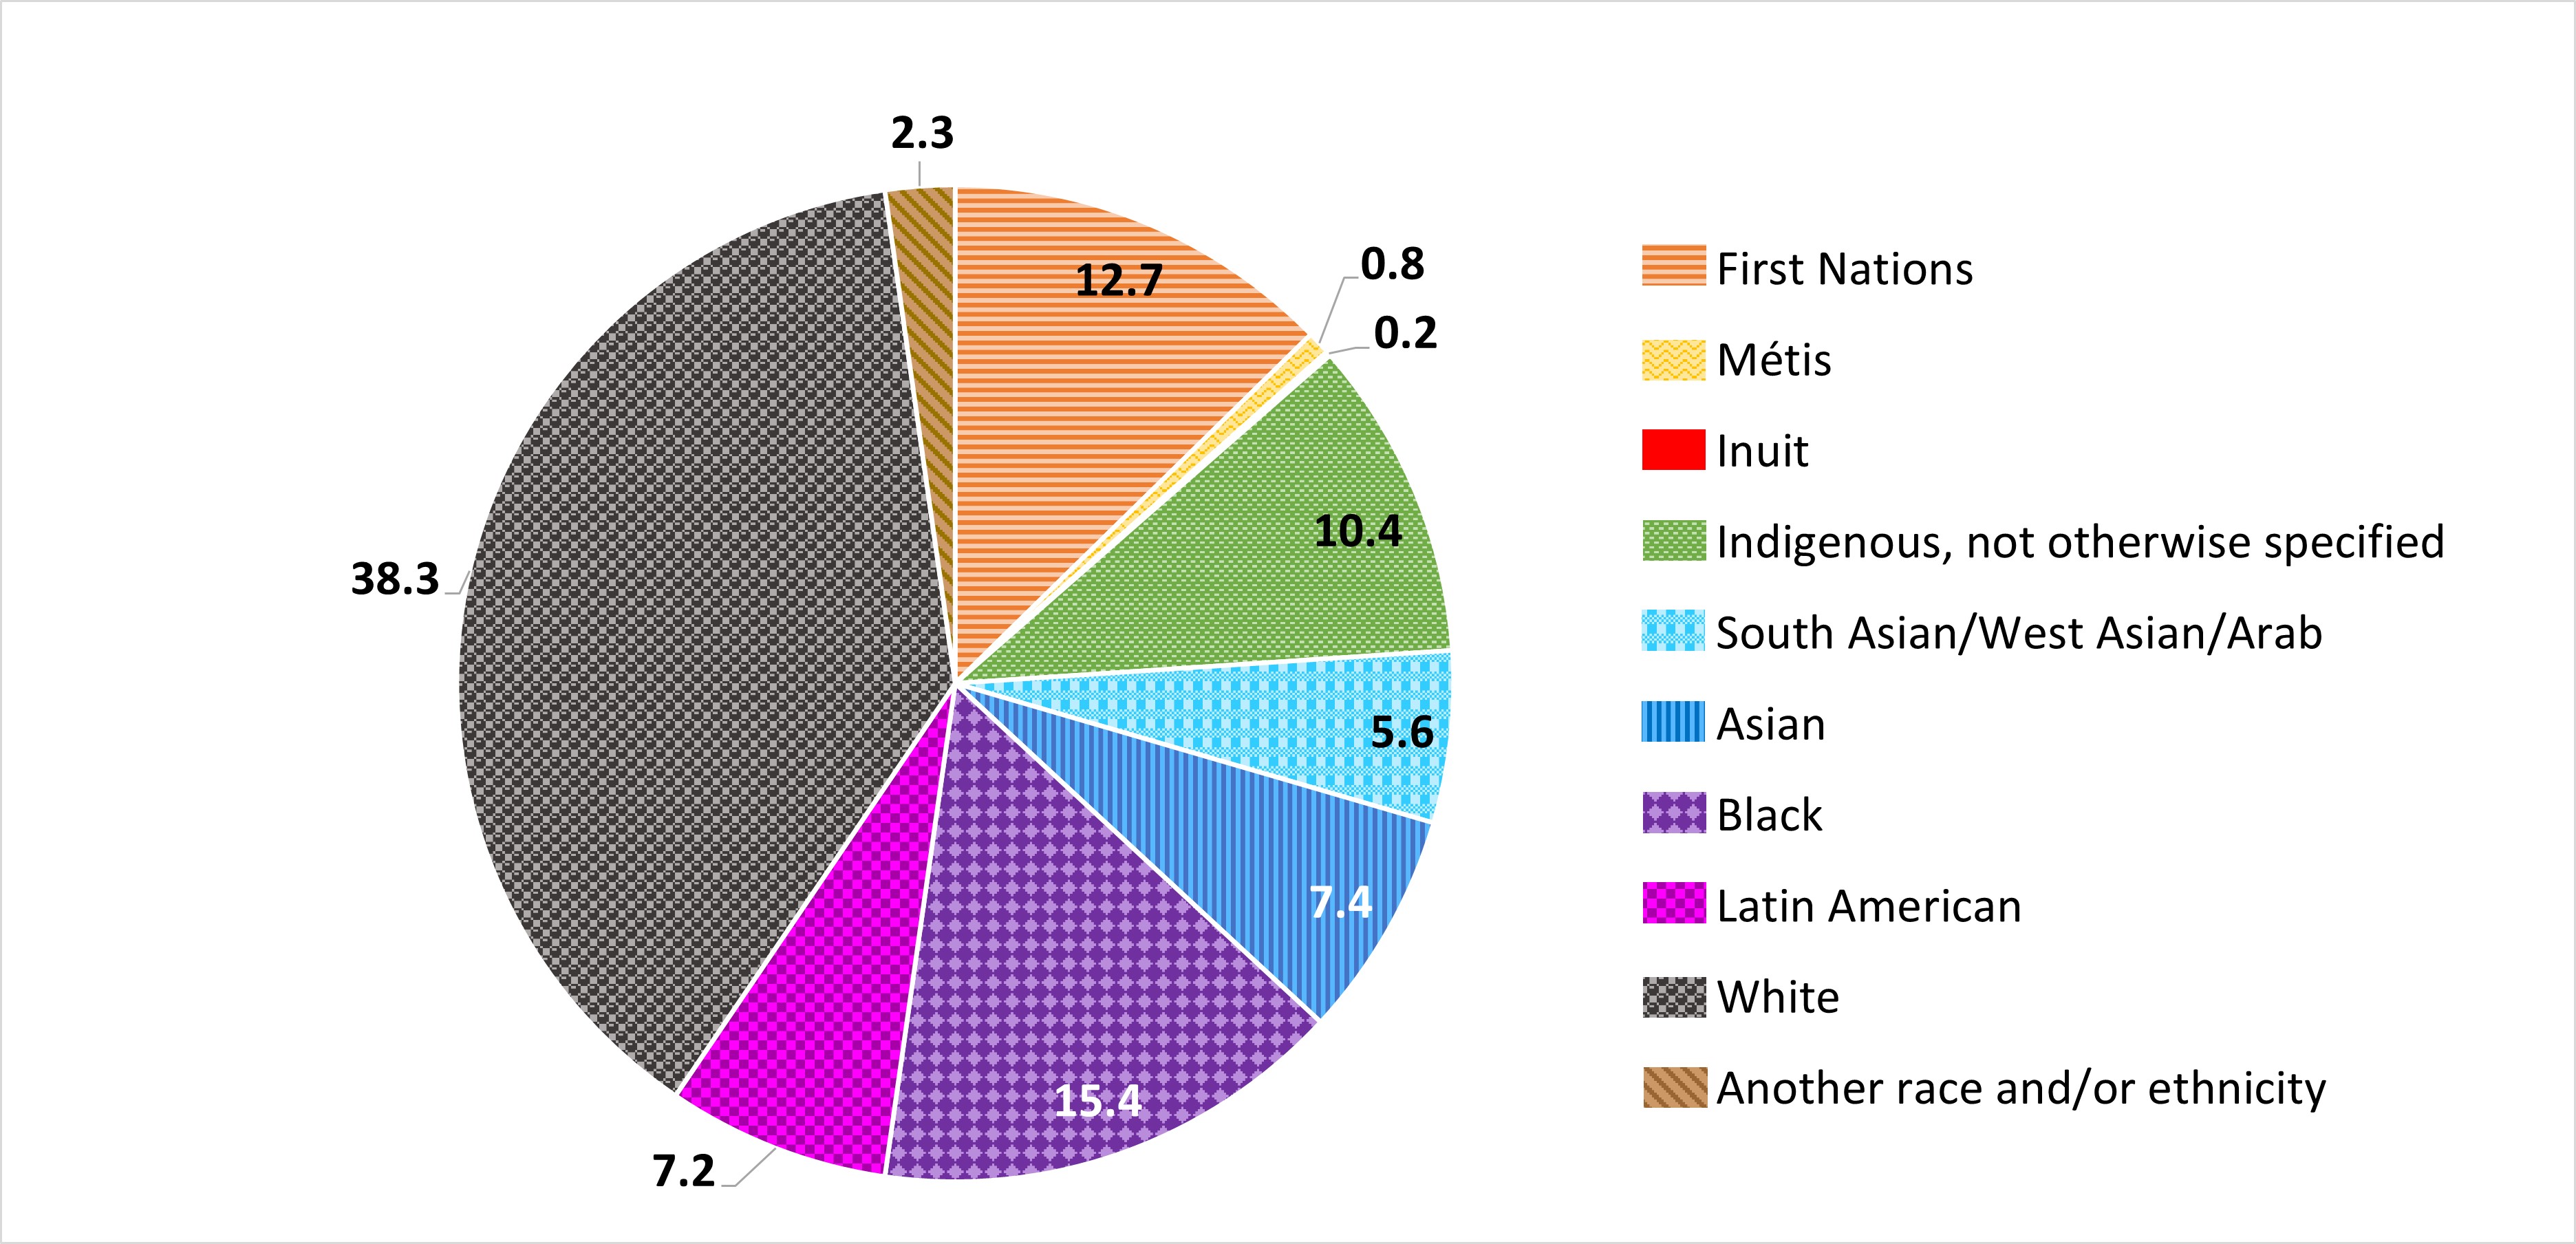
Figure 8b: Text description
| Race and/or ethnicity | Proportion (%) |
|---|---|
| First Nations | 12.7 |
| Métis | 0.8 |
| Inuit | 0.2 |
| Indigenous, not otherwise specified | 10.4 |
| South Asian/West Asian/Arab | 5.6 |
| Asian | 7.4 |
| Black | 15.4 |
| Latin American | 7.2 |
| White | 38.3 |
| Another race and/or ethnicity | 2.3 |
Refer to Appendix 2 for details on race/ethnicity categories reported by provinces and territories.
- Figure 8 b
-
Race and/or ethnicity information is not submitted by Québec or Manitoba; for other jurisdictions, the race and/or ethnicity categories submitted and completion rate varied, interpret data with extreme caution.
Additional surveillance data
Canadian Perinatal HIV Surveillance Program (CPHSP)
In 2021, there were 210 infants who were perinatally exposed to HIV and there were two new perinatal infections. Both infants were born to individuals who did not receive any antiretroviral therapy (ART). Since 2014, the number of perinatal exposures has ranged between 210 and 280 with an average of 254 perinatal exposures per year. Also, since 2014, the number of perinatal infections has ranged between 2 and 13 with an average of 5.6 infections per year. Although the number of perinatal exposures fluctuated yearly, there was a decrease from 253 exposures in 2014 to 210 in 2021 (Figure 9). The proportion of women and other pregnant people living with HIV who received any ART during pregnancy in 2021 was 98.1%, which was slightly higher than the average between 2014 and 2020 (95.5%; range 93.2% to 97.6%) (Figure 9). Additional results from CPHSP can be found in Data Table 7.
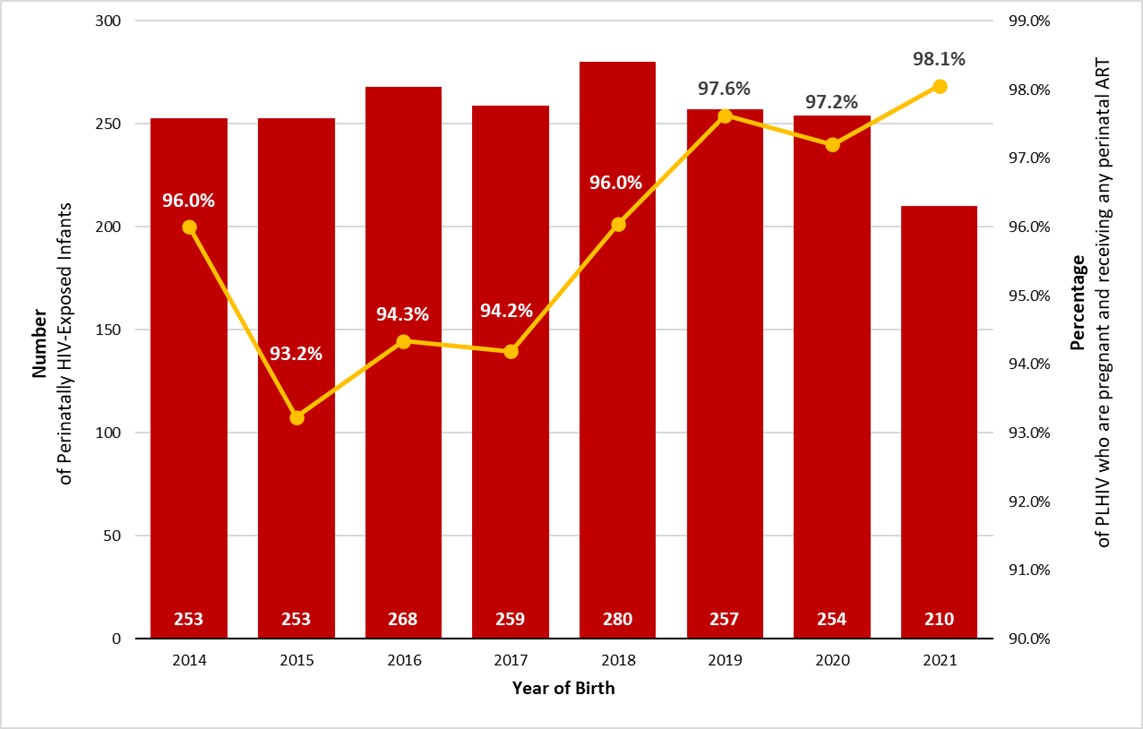
Figure 9: Text description
| Year of Birth | Number of Perinatally HIV-Exposed Infants | Percentage of PLHIV who are pregnant and receiving any perinatal ART (%) |
|---|---|---|
| 2014 | 253 | 96.0 |
| 2015 | 253 | 93.2 |
| 2016 | 268 | 94.3 |
| 2017 | 259 | 94.2 |
| 2018 | 280 | 96.0 |
| 2019 | 257 | 97.6 |
| 2020 | 254 | 97.2 |
| 2021 | 210 | 98.1 |
Source: CPHSP
Abbreviations: PLHIV, People living with HIV.
- Figure 9 a
-
The proportion of mothers or pregnant people receiving ART excludes pregnant people with an unknown perinatal ART status. Infants born to pregnant people with an unknown perinatal ART status are included in the total number of perinatally HIV-exposed infants.
HIV cases identified through immigration medical screening
In 2021, 865 migrant people tested positive for HIV during an immigration medical exam (IME) in Canada or abroad. This represents an increase of 16.4% from the 743 migrant people who tested positive in 2020. Out of all migrants who tested positive for HIV during the IME, the proportions of migrant people who tested positive (in 2021) prior to arrival in Canada (47.6%) and after arriving in Canada (52.4%) remained similar compared with the previous year, as there were 46.3% who tested positive outside of Canada and 53.7% who tested positive in Canada in 2020 (Data Table 8).
There was a total of 4,501 individuals who tested positive through an IME conducted in Canada in the last 10 years (2012-2021) with an average of 450 per year (range: 243 to 696) (Figure 10). Between 2012 and 2021, of the applicants who tested positive for HIV during an IME in Canada, males accounted for a higher proportion, at 58.9% (n = 2,650). Overall, for both sexes, migrants in the 30 to 39 years old age group accounted for the highest proportion of positive tests at 38.9% (n = 1,751). This is followed by the 40 to 49 years old age group at 25.7% (n = 1,158) and the 20 to 29 years old age group, 18.8% (n = 845) (Data Table 9).
Of the IMEs conducted in Canada between 2012 and 2021 where HIV was detected, 53.2% were completed in Ontario, followed by 25.7% conducted in Quebec, 9.2% in Alberta, and 8.5% in British Columbia. In 2021, IRCC public health notifications sent to the provinces or territories were most commonly sent to Ontario.
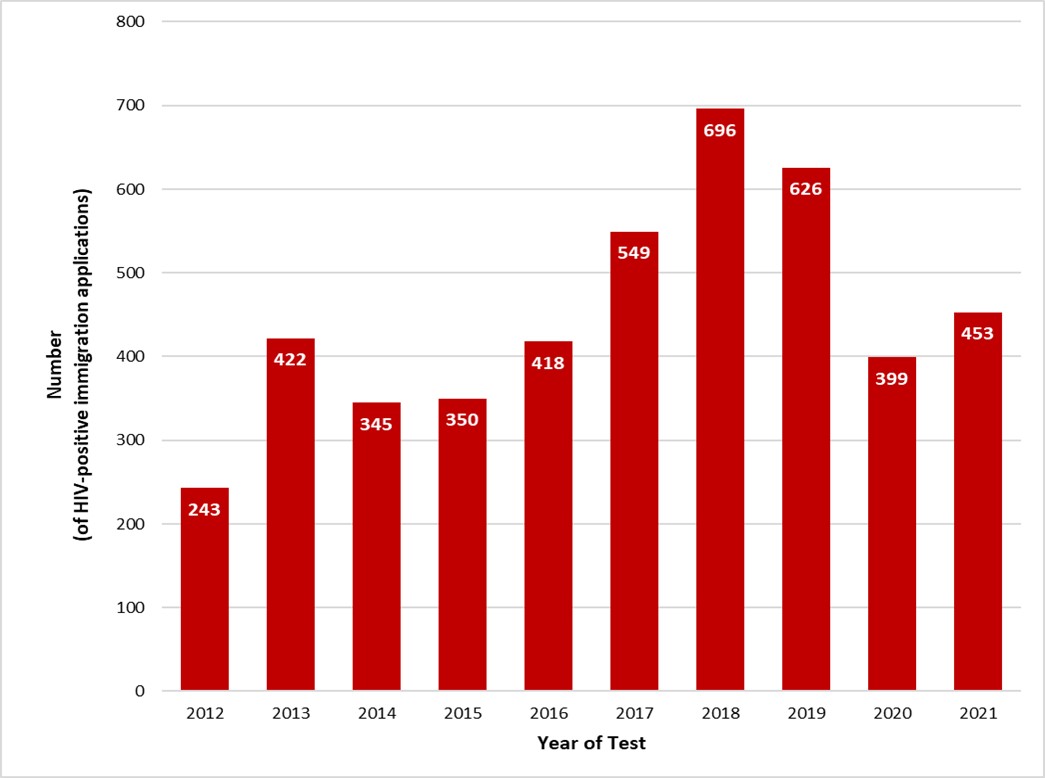
Figure 10: Text description
| Year | Number diagnosed with HIV |
|---|---|
| 2012 | 243 |
| 2013 | 422 |
| 2014 | 345 |
| 2015 | 350 |
| 2016 | 418 |
| 2017 | 549 |
| 2018 | 696 |
| 2019 | 626 |
| 2020 | 399 |
| 2021 | 453 |
Source: IRCC
- Figure 10 a
-
Immigration, Refugees, and Citizenship Canada, IRCC GCMS and IMS/FOSS as of July 2022. Reproduced and distributed with the permission of Immigration, Refugees, and Citizenship Canada.
- Figure 10 b
-
For applicants tested in Canada, the year refers to the year of the test. For applicants tested internationally, the year refers to the year the applicant landed in Canada.
AIDS cases
AIDS refers to the most advanced stage of disease caused by the HIV virus. A total of 64 AIDS cases were reported in 2021 (Table 4). Between 2012 and 2021, 1,768 AIDS cases were reported to PHAC. The number of AIDS diagnoses decreased in both males and females between 2012 and 2020 in the provinces that consistently report AIDS data to PHAC (British Columbia, New Brunswick, Nova Scotia, Ontario, and Saskatchewan). Additional AIDS data are available on the Notifiable Diseases website, Notifiable Diseases Online (canada.ca). Refer to Figure A3 (Appendix 2) for information on the current reporting of AIDS cases.
Over the years, AIDS reporting practices have changed and a noted decrease in AIDS reporting since 2012 may partially be due to reduced reporting by PT public health authorities. Recently, there has been a shift away from reporting AIDS as a separate diagnosis toward categorizing it as a stage of HIV infection. The stages of HIV infection are determined by CD4 count (an indicator of immune system health) and/or the presence of AIDS defining conditions, such as recurring pneumonia. This method of HIV surveillance has already been implemented in some provinces and territories, as well as in other jurisdictions internationally. For future reporting, HASS will consult with PTs on moving toward reporting HIV staging data rather than AIDS diagnoses exclusively.
| Year of diagnosis | Males | Females | Total |
|---|---|---|---|
| 2012 | 205 | 46 | 263 |
| 2013 | 184 | 63 | 263 |
| 2014 | 179 | 48 | 243 |
| 2015 | 162 | 49 | 212 |
| 2016 | 138 | 52 | 193 |
| 2017 | 119 | 38 | 158 |
| 2018 | 110 | 28 | 139 |
| 2019 | 84 | 23 | 107 |
| 2020 | 87 | 39 | 126 |
| 2021 | 52 | 12 | 64 |
| Total | 1320 | 398 | 1768 |
HIV mortality
Based on available Vital Statistics death data from Statistics Canada (SC), there were 1,469 deaths attributed to HIV in Canada between 2013 and 2021. While the number of HIV-attributed deaths has decreased from 241 in 2013 to 105 in 2019, it increased to 136 in 2020 and remained relatively at stable at 133 in 2021. Among those aged 15 years and older, 77.0% (n = 1,131) of the HIV-attributed deaths were in males. Although the number of deaths in both males and females decreased since 2013, the proportion of deaths in females compared with males decreased from 21.6% (n=52) in 2013 to 18.4% (n=25) in 2020 and then increased to 19.5% (n=26) in 2021. (Table 5 and Table 6). The proportion of deaths among those aged 50 years or older when compared with younger age groups has increased from 57.3% (n=138) in 2013 to 66.2% (n=90) in 2020, followed by a slight decrease to 61.7% (n=82) in 2021.
| Age group | Males | Females | Total | ||
|---|---|---|---|---|---|
| n | % | n | % | n | |
| Under 15 years | 0 | 0 | 1 | 100 | 1 |
| 15 years and older | 1,131 | 77.0 | 337 | 23.0 | 1,468 |
| Total | 1,131 | 77.0 | 338 | 23.0 | 1,469 |
Source: SC |
|||||
| Year of death | Males | Females | Total |
|---|---|---|---|
| 2013 | 189 | 52 | 241 |
| 2014 | 149 | 56 | 205 |
| 2015 | 131 | 59 | 190 |
| 2016 | 134 | 40 | 174 |
| 2017 | 117 | 25 | 142 |
| 2018 | 112 | 30 | 142 |
| 2019Table 6 footnote a | 81 | 24 | 105 |
| 2020Table 6 footnote a | 111 | 25 | 136 |
| 2021Table 6 footnote a | 107 | 26 | 133 |
| Total | 1,131 | 337 | 1,468 |
Source: SC
|
|||
| Age group | 2013 | 2014 | 2015 | 2016 | 2017 | 2018 | 2019 | 2020 | 2021 | |||||||||
|---|---|---|---|---|---|---|---|---|---|---|---|---|---|---|---|---|---|---|
| n | % | n | % | n | % | n | % | n | % | n | % | n | % | n | % | n | % | |
| < 15 years | 0 | 0 | 0 | 0 | 0 | 0 | 1 | 0.6 | 0 | 0 | 0 | 0 | 0 | 0 | 0 | 0 | 0 | 0 |
| 15 to 19 years | 0 | 0 | 0 | 0 | 0 | 0 | 0 | 0 | 0 | 0 | 0 | 0 | 0 | 0 | 0 | 0 | 0 | 0 |
| 20 to 29 years | 6 | 2.5 | 3 | 1.5 | 2 | 1.1 | 5 | 2.9 | 5 | 3.5 | 2 | 1.4 | 2 | 1.9 | 2 | 1.5 | 4 | 3.0 |
| 30 to 39 years | 27 | 11.2 | 27 | 13.2 | 18 | 9.5 | 23 | 13.1 | 11 | 7.7 | 19 | 13.4 | 11 | 10.5 | 15 | 11.0 | 13 | 9.8 |
| 40 to 49 years | 70 | 29.0 | 68 | 33.2 | 56 | 29.5 | 40 | 22.9 | 24 | 16.9 | 31 | 21.8 | 25 | 23.8 | 29 | 21.3 | 34 | 25.6 |
| ≥ 50 years | 138 | 57.3 | 107 | 52.2 | 114 | 60.0 | 106 | 60.6 | 102 | 71.8 | 90 | 63.4 | 67 | 64.4 | 90 | 66.2 | 82 | 61.7 |
| Total | 241 | n/a | 205 | n/a | 190 | n/a | 175 | n/a | 142 | n/a | 142 | n/a | 105 | n/a | 136 | n/a | 133 | n/a |
| Source: SC Abbreviations: n, number |
||||||||||||||||||
Discussion
In 2021, 1,466 first-time HIV diagnoses were reported in Canada. While there has been some fluctuation over the last decade, there was a notable decrease in the HIV diagnosis rate in 2020 compared with previous years (4.7 per 100,000 in 2019 vs. 3.5 per 100,000 in 2020). This was likely partly due to reduced access to testing services for sexually transmitted and blood-borne infections (STBBI) during the COVID-19 pandemic and a change in national HIV surveillance practices to focus solely on first-time diagnoses starting in 2020. In 2021, a slight "rebound" in the number of first-time HIV diagnoses and in the HIV diagnosis rate was observed (10.9% increase in first-time diagnoses compared with 2020), with the overall rate increasing to 3.8 per 100,000 population from 3.5 per 100,000 in 2020. There were increases for male and female rates, corresponding to the overall trend.
The challenge in accurately reporting and interpreting trends in HIV diagnoses when there is movement of people within a country or individuals diagnosed prior to migrating was previously identified in Canada and in other countries. Footnote 19 Footnote 32 In 2019, the Public Health Agency of Canada (PHAC) conducted an environmental scan examining how first-time diagnoses and previously diagnosed cases of HIV were reported to PHAC by the provinces and territories (PTs). Footnote 19 This was done in an effort to better understand a noted variation in HIV case reporting between PTs. The study included a re-analysis of HIV surveillance data using a common definition of previous HIV-positive test result. With the removal of these previously diagnosed cases, PHAC was able to identify that more than half of the documented increase in cases from 2007 to 2017 was explained by the inclusion of these previously diagnosed cases. As a result, in 2020, the national HIV/AIDS Surveillance System (HASS) moved to surveillance methodology focusing on first-time diagnoses to more accurately represent annual trends in HIV diagnoses in Canada. Footnote 19 Starting in 2021, HIV surveillance data from all PTs differentiate previously diagnosed cases from new HIV diagnoses. However, not all jurisdictions were able to consistently provide information on previously diagnosed cases for years prior to 2020 (Appendix 2), and as a result, some previously diagnosed cases may remain in the national dataset for years prior to 2020. These reported trends should be interpreted with caution.
To better understand the impact of the COVID-19 pandemic on access to or delivery of STBBI-related services, PHAC's Enhanced Surveillance of HIV and Hepatitis C program (also known as Tracks) conducted surveys among STBBI service providers; African, Caribbean, and Black people (ACB); and people who use drugs (PWUD). When asked about HIV testing services, 43.9% of service providers indicated that access to HIV testing services decreased at some point in time during the pandemic, and 30.8% stopped providing these services at some point in time during the pandemic. Footnote 7 This lack of available services while public health measures to prevent transmission of COVID-19 were in place impacted populations who already faced health inequities. Among ACB people and PWUD respondents who attempted to access HIV testing, 40.5% and 49.5% reported difficulties accessing the service, respectively. Footnote 30 Footnote 33 These populations also reported difficulties accessing other health services when they sought them, including mental health counselling, community services, STBBI information and education, interpreter and/or peer health service navigator, and pre-exposure prophylaxis (PrEP) and/or post-exposure prophylaxis (PEP). Footnote 30 Footnote 33 Respondents of the PWUD survey also specifically reported difficulties in accessing Indigenous health and healing services, and harm reduction services. Footnote 33 Both ACB and PWUD respondents reported increased experiences of stigma and discrimination during the pandemic, identifying these as barriers to accessing healthcare services. Footnote 30 Footnote 33 Those who indicated that they used drugs, inclusive of alcohol or cannabis, and experienced discrimination 'often' prior to the pandemic reported the greatest increase in experiences of stigma and discrimination following the start of the pandemic. Footnote 33 For ACB people, 66.4% of those who accessed care since the start of the pandemic reported experiencing discrimination based on race, ethnicity, or skin colour, and among those, 31.2% reported an increase in this experience since the start of the pandemic. Footnote 30 The findings of these surveys demonstrate some of the pandemic-related disruptions in access to STBBI prevention, testing, treatment, and care services. These health service disruptions that occurred in 2020, followed by gradually renewed access in 2021 as the pandemic progressed and as restrictions were lifted, may explain, in part, the decline in new HIV diagnoses in 2020 and the increase in 2021.
The observed decline in HIV diagnoses in 2020 and the subsequent increase in 2021 are consistent with the pattern observed in other countries. A similar pattern was reported in the United Kingdom (UK), with cases dropping from 4,017 in 2019 to 2,673 in 2020, followed by a slight increase to 2,692 in 2021. Footnote 34 The United States reported a 17% decrease in HIV diagnoses in 2020, with the overall rate dropping to 9.2 per 100,000 in 2020 from 11.1 per 100,000 in 2019. Footnote 35 It was noted that this decrease was likely due to disruptions in clinical care services, hesitancy in accessing these services, and shortages of HIV testing materials that resulted from the COVID-19 pandemic.
When compared with international counterparts with comparable HIV surveillance systems, Canada's HIV diagnosis rate of 3.8 per 100,000 was lower than the UK, at 4.4 per 100,000 Footnote 36, and France, at 5.2 per 100,000 Footnote 36 but continues to be higher than Australia (2.0 per 100,000) Footnote 37. All four countries report on first-time diagnoses, and all observed decreases in 2020. In 2021, Australia and France reported a continued decrease in new diagnoses Footnote 36 Footnote 37 and the UK rate remained constant Footnote 36, whereas Canada observed an increase in cases. The UK also reported an increased number of tests and people in care in 2021, after observing a decrease in 2020. Footnote 38 However, subsequent years of data are needed to examine trends throughout the later stages of the pandemic and beyond.
The use of HIV preventative measures was also affected by the COVID-19 pandemic, including PrEP use. In a synthesis review of studies reporting on pandemic-era engagement in the PrEP care continuum, a majority revealed declined or discontinued PrEP uptake during the pandemic. Footnote 39 Many of these studies reported that PrEP uptake had declined due to lower perceived likelihood of acquiring of HIV including reduced sexual behaviours and fewer sexual partners. Footnote 39 A study of attendees at one clinic in Toronto found that during the first six months of the pandemic, patients were more likely to discontinue using PrEP than they were prior to the pandemic, although by the second six-month period of the pandemic, patients were no more likely to discontinue PrEP use than they had been before the pandemic. Footnote 40 The study did not report whether the patients who stopped using PrEP during the initial pandemic period restarted taking the medication.
The reported barriers to accessing STBBI health services and the subsequent return to more typical access may explain variations in the number of HIV tests administered over time. For example, Manitoba Footnote 41, Ontario Footnote 42, and British Columbia Footnote 43 observed a decrease in HIV testing volumes in 2020 followed by an increase in 2021. Although the impacts of these changes on HIV transmission remains unclear, evidence of an effect is emerging. A modelling study from the United States simulated how the COVID-19 pandemic might affect HIV infections in 32 US metropolitan areas. Footnote 44 They estimated that prolonged barriers to care, resulting in reductions in HIV testing, PrEP use, and viral suppression would result in approximately 3089 additional HIV infections over a five-year period. These findings are consistent with a later Canadian study examining HIV transmission trends in key populations pre-public health measures, during, and post-public health measures. Footnote 45 The results of this study showed increased transmission associated with reduced access to health services among PWID during the initial period of COVID-19-related restrictions.
The collection of data on race and/or ethnicity and other social characteristics is a key component in recognizing disparities in access to healthcare, as well as understanding the disproportionate burden of HIV on particular populations. Footnote 26 Unfortunately, the proportion of cases in 2021 for which race and/or ethnicity data was available remained low at 45.3%. This low completeness is due to a variety of reasons across the provinces and territories, ranging from limited collection of this information to restrictions on the ability to submit this data to the national HIV surveillance program. In addition, there is variation in terms of how race and/or ethnicity information is collected across the provinces and territories. This critical data gap prevents users of HIV surveillance data from accurately identifying disparities in the burden of HIV in particular populations and understanding the magnitude of prevention and care needs for those populations. One of the objectives of the review and renewal work currently being conducted by the national HIV surveillance program is to improve the collection of race-based data through ongoing collaboration with provincial, territorial, and federal data providers and in collaboration with community members, organizations, and other data users. This includes ongoing consultations with the Black Expert Working Group and endeavouring to establish similar engagements with other communities.
The male-to-male sexual contact exposure category continued to account for over half (54.2%) of all diagnoses in males, which is similar to what was observed in previous years. Although the impact of changes, due to the COVID-19 pandemic, on HIV transmission remain unclear, evidence of an effect is emerging. A study of gay, bisexual, and other men who have sex with men (gbMSM) in Vancouver found increased interruption of PrEP use between September 2020 and April 2021 when compared with a similar period prior to the pandemic. Footnote 46 Other studies have indicated that a key barrier to PrEP access was the requirement for in-person services, such as bloodwork, which had disproportionate effects depending on location, age, and racialization. Footnote 47 Regarding other exposure categories, the proportion of cases in males attributable to heterosexual contact (24.0%) has increased from 2018 to 2021, and the proportion attributable to injection drug use (15.9%) has increased from 2016 to 2021. It should also be noted that the pandemic had a substantial impact on HIV prevention services, such as the 80.6% of individuals who use substances reporting difficulties in accessing harm reduction services. Footnote 48
Similar to previous years, heterosexual contact (60.4%) and injection drug use (38.3%) are the most common exposure categories in females. Increases in the proportions attributable to both exposure categories from 2019-2021 may be a statistical artifact due to the removal of those diagnosed out of country from the "Other" exposure category (part of the methodological change in 2020 to first-time diagnoses).
In 2021, migration increased and even surpassed pre-pandemic levels, with Canada welcoming 406,026 migrants, over twice the number who arrived in 2020. Footnote 49 Similar increases were also reported in the UK Footnote 50 and Australia Footnote 51. A corresponding increase was observed in the number of HIV cases identified by international IMEs in Canada, which increased from 344 in 2020 to 412 in 2021. Further supporting the idea that increasing volumes were a primary driver of the increase in HIV cases identified through IMEs, IRCC noted that for IMEs conducted in Canada, the proportion of IMEs that had an HIV diagnosis actually decreased in 2021 compared with 2019 and 2020.
Perinatal transmission of HIV in Canada continues to be low, with only two perinatal infections reported for 2021. Both individuals who birthed these infants had not received treatment with any available antiretroviral regimen. The COVID-19 pandemic also had an impact on perinatal transmission. Analyses conducted by CPHSP have indicated that there was an increase in perinatal transmission, from transmissions occurring among 1.3% of exposed infants in 2015-2019 compared to 3.2% in 2020. Footnote 52 People who were pregnant and who had acquired HIV through injection drug use (IDU) had the greatest likelihood of perinatal transmission because of sub-optimal treatment. Footnote 52
Despite advancements in prevention and treatment, HIV remains a significant health burden in Canada, with 1,469 deaths attributed to HIV between 2013 and 2021. This burden is carried disproportionately by communities experiencing other systemic barriers to equity, for example Black populations are at a significantly increased risk of death from HIV when compared with white populations – 5 times and 21 times greater among males and females respectively. Footnote 53 While estimates show that Canada has achieved two of the three UNAIDS 90-90-90 targets for reducing the burden of HIV in the overall population, there remain gaps that require further intervention. As a country, Canada has not yet achieved the second 90 target, with only an estimated 87% of those diagnosed with HIV receiving treatment. Footnote 6 Several provinces are also still working towards reaching the diagnosis, treatment, and viral suppression targets. Footnote 6 Nationally, the 90-90-90 targets are not yet being met for females and for several populations who are disproportionately impacted by HIV, including First Nations, Inuit, and Métis populations and people who inject drugs. Footnote 6 The availability of accurate surveillance data supports regions and communities who bear a larger burden of HIV in developing and implementing programs and policies for prevention and care that are tailored to their specific needs. Interventions that address the 90-90-90 targets, such as testing, antiretroviral therapy (ART) initiation, and retention to care, have been shown to achieve results. A study conducted in British Columbia estimated that a sustained combination of these interventions would result in a 12.8% reduction in cumulative HIV incidence and a 4.7% reduction in deaths among PLHIV in that province. Footnote 54 As the 2030 deadline for achievement of the updated UNAIDS 95-95-95 targets approaches, accurate and complete surveillance data will allow for resources to be allocated where they will have the greatest impact, as Canada moves towards ending its HIV epidemic. Footnote 14
Strengths
This report provides an epidemiological profile of new HIV diagnoses in Canada, including a detailed view of cases among migrants to Canada, perinatal transmission, and HIV mortality. It is also the first national surveillance report to present first-time diagnoses for all thirteen provinces and territories, presenting information on these diagnoses by age, sex, exposure category, and race and/or ethnicity. More provinces and territories also updated their historical data by further identifying and excluding previously diagnosed cases from 2012 through 2019. The change in recent years to focus on first-time diagnoses allows for a clearer picture of the domestic transmission of HIV in Canada as well as better international comparisons with countries such as the UK and Australia.
Limitations
Limitations of the surveillance report have been previously detailedFootnote 5 Footnote 21 Footnote 55 and they include low completeness of race and/or ethnicity information; an absence of information on, or inconsistent collection of, data elements such as gender identity; and variation in reporting previously diagnosed cases in historical data (prior to 2019).
Any interpretation and use of the race and/or ethnicity data presented in this report should be carefully considered given the low completeness of these data. The current race and/or ethnicity data is unlikely to provide an accurate representation of the national picture of race and/or ethnicity among people living with HIV, as these data are unavailable for nearly two-thirds of newly diagnosed cases.
Information on trans and non-binary identities is also very limited as the current data includes only binary sex categories (male or female) without data on gender identity. In its current state, the HIV surveillance system does not reflect our changing understanding of sex, gender identity, and sexual orientation. Footnote 56 HASS is actively working on improving our data collection and reporting to better represent gender-diverse communities.
For 2021, the COVID-19 pandemic may have continued to have impacts on surveillance data – increased workloads for public health organizations and delays in HIV testing, data collection, and reporting. More time and data are needed to fully assess the effects of the pandemic on the HIV epidemic.
Despite all PTs being able to report on first-time diagnosed HIV cases separately from previously diagnosed cases, some provinces and territories were unable to provide this information consistently from 2012 through 2019. For this reason, all trends prior to 2020 must be interpreted with caution. De-duplication and identification of first-time diagnoses is conducted at the PT level and due to the challenges of de-duplication and limitations in PT systems, it is possible that there may still be some duplicates or previous positive cases remaining in the data. It is expected that there will be a gradual improvement through the removal of previously diagnosed cases from the national dataset over time. This report only presents diagnosis data, which does not represent the true number of new HIV infections (incidence) or total number of people living with HIV (prevalence) in Canada in 2021. Data included in this surveillance report should also be considered provisional, as national surveillance data are updated annually. If discrepancies exist between data summarized in this report and provincial or territorial reports, the most recent provincial or territorial report should be utilized.
Conclusion
The number and rate of first-time HIV diagnoses in Canada increased in 2021 compared with 2020, but they have not returned to the rates observed prior to the COVID-19 pandemic. The increase observed in 2021 may be partially explained by renewed access to HIV testing. It remains unknown how the COVID-19 pandemic and its lasting effects will impact the epidemiology of HIV in future years. HIV surveillance data assists in monitoring progress against the pan-Canadian STBBI Framework and the associated Government of Canada Five-Year Action Plan on STBBI, along with Canada's progress towards the international elimination targets (the 95-95-95s). Trends in domestic diagnoses can be used to inform the provision of tailored prevention programs. PHAC will continue to collaborate with provinces, territories, and other surveillance partners to make improvements to better meet HIV surveillance evidence needs and make progress towards embedding community perspectives and producing more culturally appropriate and useful knowledge translation products.
Data tables
| Year of Diagnosis | Overall Diagnoses | Overall Rate per 100,000 | Male Diagnoses | Male Rate per 100,000 | Female Diagnoses | Female Rate per 100,000 |
|---|---|---|---|---|---|---|
| 2012 | 1,797 | 5.2 | 1,391 | 8.1 | 402 | 2.3 |
| 2013 | 1,838 | 5.2 | 1,458 | 8.4 | 374 | 2.1 |
| 2014 | 1,757 | 5.0 | 1,358 | 7.7 | 391 | 2.2 |
| 2015 | 1,767 | 4.9 | 1,363 | 7.7 | 400 | 2.2 |
| 2016 | 1,860 | 5.2 | 1,416 | 7.9 | 434 | 2.4 |
| 2017 | 1,819 | 5.0 | 1,413 | 7.8 | 401 | 2.2 |
| 2018 | 1,848 | 5.0 | 1,356 | 7.4 | 489 | 2.6 |
| 2019 | 1,759 | 4.7 | 1,239 | 6.6 | 513 | 2.7 |
| 2020 | 1,322 | 3.5 | 940 | 5.0 | 374 | 2.0 |
| 2021 | 1,466 | 3.8 | 1,049 | 5.5 | 406 | 2.1 |
|
||||||
| Province | Number of Diagnoses | HIV Diagnosis Rate (per 100,000 population) |
|---|---|---|
| Alberta | 179 | 4.0 |
| Atlantic region | 32 | 1.5 |
| British Columbia | 144 | 2.8 |
| Manitoba | 145 | 10.5 |
| Ontario | 485 | 3.3 |
| Quebec | 239 | 2.8 |
| Saskatchewan | 240 | 20.3 |
| Territories | 2 | 1.6 |
|
||
| Age group | Males | Females | ||
|---|---|---|---|---|
| Number of diagnoses | Rate per 100,000 | Number of diagnoses | Rate per 100,000 | |
| Children <15 years | 1 | 0.0 | 4 | 0.1 |
| 15 to 19 years | 12 | 1.1 | 13 | 1.3 |
| 20 to 29 years | 274 | 10.4 | 108 | 4.4 |
| 30 to 39 years | 327 | 12.1 | 133 | 5.0 |
| 40 to 49 years | 202 | 8.3 | 74 | 3.0 |
| ≥50 years | 230 | 3.2 | 71 | 0.9 |
Abbreviation: <, less than
|
||||
| Age group | Year of diagnosis | |||||||||||||||||||
|---|---|---|---|---|---|---|---|---|---|---|---|---|---|---|---|---|---|---|---|---|
| 2012 | 2013 | 2014 | 2015 | 2016 | 2017 | 2018 | 2019 | 2020 | 2021 | |||||||||||
| n | Rate | n | Rate | n | Rate | n | Rate | n | Rate | n | Rate | n | Rate | n | Rate | n | Rate | n | Rate | |
| Children <15 years | 11 | 0.2 | 20 | 0.4 | 6 | 0.1 | 9 | 0.2 | 10 | 0.2 | 14 | 0.2 | 18 | 0.3 | 10 | 0.2 | 2 | 0.0 | 5 | 0.1 |
| 15 to 19 years | 33 | 1.5 | 32 | 1.5 | 30 | 1.4 | 33 | 1.6 | 40 | 1.9 | 35 | 1.7 | 36 | 1.7 | 31 | 1.5 | 24 | 1.1 | 25 | 1.2 |
| 20 to 29 years | 437 | 9.2 | 430 | 8.9 | 395 | 8.2 | 498 | 10.3 | 472 | 9.7 | 459 | 9.3 | 475 | 9.5 | 465 | 9.1 | 359 | 7.0 | 388 | 7.6 |
| 30 to 39 years | 540 | 11.6 | 560 | 11.8 | 568 | 11.8 | 475 | 9.8 | 556 | 11.3 | 574 | 11.5 | 559 | 11.0 | 552 | 10.6 | 434 | 8.2 | 463 | 8.6 |
| 40 to 49 years | 486 | 9.6 | 442 | 8.9 | 393 | 8.1 | 379 | 7.9 | 381 | 8.0 | 388 | 8.1 | 384 | 8.0 | 351 | 7.3 | 245 | 5.0 | 277 | 5.7 |
| ≥50 years | 290 | 2.3 | 352 | 2.8 | 363 | 2.8 | 372 | 2.8 | 399 | 2.9 | 346 | 2.5 | 374 | 2.6 | 349 | 2.4 | 256 | 1.8 | 301 | 2.0 |
Abbreviations: n = number; <, less than; ≥, greater than or equal
|
||||||||||||||||||||
| Exposure category | Year of diagnosis | |||||||||||||||||||
|---|---|---|---|---|---|---|---|---|---|---|---|---|---|---|---|---|---|---|---|---|
| 2012 | 2013 | 2014 | 2015 | 2016 | 2017 | 2018 | 2019 | 2020 | 2021 | |||||||||||
| n | % | n | % | n | % | n | % | n | % | n | % | n | % | n | % | n | % | n | % | |
| Male-to-male sexual contact | 823 | 50.6 | 865 | 51.8 | 796 | 51.0 | 777 | 48.8 | 801 | 48.5 | 753 | 46.5 | 715 | 45.0 | 643 | 43.1 | 451 | 42.0 | 471 | 39.7 |
| Male-to-male sexual contact and injection drug use | 30 | 1.8 | 44 | 2.6 | 44 | 2.8 | 46 | 2.9 | 53 | 3.2 | 35 | 2.2 | 49 | 3.1 | 49 | 3.3 | 27 | 2.5 | 44 | 3.7 |
| Injection drug use | 222 | 13.6 | 198 | 11.8 | 195 | 12.5 | 229 | 14.4 | 216 | 13.1 | 235 | 14.5 | 267 | 16.8 | 263 | 17.6 | 239 | 22.2 | 259 | 21.9 |
| Heterosexual contact | 491 | 30.2 | 492 | 29.4 | 433 | 27.8 | 478 | 30.0 | 500 | 30.3 | 514 | 31.7 | 489 | 30.8 | 453 | 30.4 | 345 | 32.1 | 400 | 33.8 |
| OtherData Table 5a footnote c | 62 | 3.8 | 72 | 4.3 | 92 | 5.9 | 61 | 3.8 | 80 | 4.8 | 83 | 5.1 | 68 | 4.3 | 84 | 5.6 | 13 | 1.2 | 11 | 0.9 |
Abbreviations: n = number
|
||||||||||||||||||||
| Exposure category | Year of diagnosis | |||||||||||||||||||
|---|---|---|---|---|---|---|---|---|---|---|---|---|---|---|---|---|---|---|---|---|
| 2012 | 2013 | 2014 | 2015 | 2016 | 2017 | 2018 | 2019 | 2020 | 2021 | |||||||||||
| n | % | n | % | n | % | n | % | n | % | n | % | n | % | n | % | n | % | n | % | |
| Male-to-male sexual contact | 823 | 64.7 | 865 | 65.0 | 796 | 64.9 | 777 | 62.9 | 801 | 63.2 | 753 | 60.0 | 714 | 60.9 | 639 | 59.7 | 451 | 58.0 | 469 | 54.2 |
| Male-to-male sexual contact and injection drug use | 30 | 2.4 | 44 | 3.3 | 44 | 3.6 | 46 | 3.7 | 53 | 4.2 | 35 | 2.8 | 49 | 4.2 | 49 | 4.6 | 27 | 3.5 | 44 | 5.1 |
| Injection drug use | 131 | 10.3 | 123 | 9.2 | 111 | 9.1 | 133 | 10.8 | 117 | 9.2 | 142 | 11.3 | 146 | 12.4 | 127 | 11.9 | 120 | 15.4 | 138 | 15.9 |
| Heterosexual contact | 252 | 19.8 | 261 | 19.6 | 222 | 18.1 | 248 | 20.1 | 256 | 20.2 | 280 | 22.3 | 227 | 19.4 | 219 | 20.4 | 170 | 21.9 | 208 | 24.0 |
| OtherData Table 5b footnote d | 37 | 2.9 | 37 | 2.8 | 53 | 4.3 | 32 | 2.6 | 40 | 3.2 | 46 | 3.7 | 37 | 3.2 | 37 | 3.5 | 9 | 1.2 | 7 | 0.8 |
Abbreviations: n = number
|
||||||||||||||||||||
| Exposure category | Year of diagnosis | |||||||||||||||||||
|---|---|---|---|---|---|---|---|---|---|---|---|---|---|---|---|---|---|---|---|---|
| 2012 | 2013 | 2014 | 2015 | 2016 | 2017 | 2018 | 2019 | 2020 | 2021 | |||||||||||
| n | % | n | % | n | % | n | % | n | % | n | % | n | % | n | % | n | % | n | % | |
| Injection drug use | 91 | 25.6 | 74 | 21.8 | 82 | 24.8 | 96 | 27.1 | 99 | 25.9 | 92 | 25.4 | 121 | 29.2 | 136 | 32.7 | 119 | 40.2 | 121 | 38.3 |
| Heterosexual contact | 239 | 67.3 | 230 | 67.8 | 209 | 63.3 | 230 | 65.0 | 243 | 63.6 | 233 | 64.4 | 262 | 63.3 | 233 | 56.0 | 173 | 58.4 | 191 | 60.4 |
| OtherData Table 5c footnote d | 25 | 7.0 | 35 | 10.3 | 39 | 11.8 | 28 | 7.9 | 40 | 10.5 | 37 | 10.2 | 31 | 7.5 | 47 | 11.3 | 4 | 1.4 | 4 | 1.3 |
Abbreviations: n = number
|
||||||||||||||||||||
| Age group | Male-to male sexual contact | Male-to-male sexual contact and injection drug use | Injection drug use | Heterosexual contact | OtherData Table 6 footnote d | |||||
|---|---|---|---|---|---|---|---|---|---|---|
| n | % | n | % | n | % | n | % | n | % | |
| 15-19 years | 5 | 23.8 | 0 | 0.0 | 4 | 19.0 | 12 | 57.1 | 0 | 0.0 |
| 20-29 years | 156 | 49.2 | 18 | 5.7 | 69 | 21.8 | 72 | 22.7 | 2 | 0.6 |
| 30-39 years | 153 | 39.6 | 16 | 4.1 | 94 | 24.4 | 121 | 31.3 | 2 | 0.5 |
| 40-49 years | 73 | 32.7 | 5 | 2.2 | 52 | 23.3 | 89 | 39.9 | 4 | 1.8 |
| ≥50 years | 84 | 35.3 | 5 | 2.1 | 40 | 16.8 | 106 | 44.5 | 3 | 1.3 |
Abbreviations: n = number; ≥, greater than or equal
|
||||||||||
| Year of birth | ||||||||||
|---|---|---|---|---|---|---|---|---|---|---|
| 1984-2013 | 2014 | 2015 | 2016 | 2017 | 2018 | 2019 | 2020 | 2021 | Total | |
| No perinatal ART prophylaxis | ||||||||||
| Confirmed living with HIV | 663 | 5 | 11 | 5 | 5 | 5 | 2 | 2 | 2 | 700 |
| Asymptomatic | 58 | 3 | 5 | 3 | 2 | 3 | 2 | 1 | 1 | 78 |
| Symptomatic | 8 | 1 | 2 | 1 | 0 | 0 | 0 | 0 | 0 | 12 |
| Died of AIDS | 100 | 0 | 0 | 0 | 0 | 0 | 0 | 0 | 0 | 100 |
| Died of other | 10 | 0 | 0 | 0 | 0 | 0 | 0 | 0 | 0 | 10 |
| Lost to follow-upData Table 7 footnote a | 206 | 1 | 4 | 1 | 3 | 2 | 0 | 1 | 1 | 219 |
| Adult careData Table 7 footnote b | 281 | 0 | 0 | 0 | 0 | 0 | 0 | 0 | 0 | 281 |
| Confirmed not living with HIV | 508 | 5 | 6 | 10 | 10 | 6 | 4 | 4 | 2 | 555 |
| HIV status not confirmed | 26 | 0 | 0 | 0 | 0 | 0 | 0 | 1 | 0 | 27 |
| Indeterminate | 0 | 0 | 0 | 0 | 0 | 0 | 0 | 0 | 0 | 0 |
| Lost to follow-upData Table 7 footnote c | 26 | 0 | 0 | 0 | 0 | 0 | 0 | 1 | 0 | 27 |
| Subtotal | 1197 | 10 | 17 | 15 | 15 | 11 | 6 | 7 | 4 | 1282 |
| Any perinatal ART prophylaxis | ||||||||||
| Confirmed living with HIV | 29 | 1 | 2 | 0 | 1 | 2 | 0 | 2 | 0 | 37 |
| Asymptomatic | 8 | 0 | 1 | 0 | 0 | 0 | 0 | 0 | 0 | 9 |
| Symptomatic | 2 | 0 | 0 | 0 | 0 | 0 | 0 | 1 | 0 | 3 |
| Died of AIDS | 1 | 0 | 0 | 0 | 0 | 0 | 0 | 0 | 0 | 1 |
| Died of other | 1 | 0 | 0 | 0 | 0 | 0 | 0 | 0 | 0 | 1 |
| Lost to follow-upData Table 7 footnote a | 11 | 1 | 1 | 0 | 1 | 2 | 0 | 1 | 0 | 17 |
| Adult careData Table 7 footnote b | 6 | 0 | 0 | 0 | 0 | 0 | 0 | 0 | 0 | 6 |
| Confirmed not living with HIV | 2846 | 239 | 228 | 247 | 238 | 256 | 237 | 231 | 161 | 4683 |
| HIV status not confirmed | 26 | 0 | 4 | 3 | 4 | 9 | 10 | 10 | 41 | 107 |
| Indeterminate | 0 | 0 | 0 | 0 | 0 | 0 | 0 | 0 | 39 | 39 |
| Lost to follow-upData Table 7 footnote c | 26 | 0 | 4 | 3 | 4 | 9 | 10 | 10 | 2 | 68 |
| Subtotal | 2901 | 240 | 234 | 250 | 243 | 267 | 247 | 243 | 202 | 4827 |
| Perinatal ART prophylaxis exposure unknown | 47 | 3 | 2 | 3 | 1 | 2 | 4 | 4 | 4 | 70 |
| Total | 4145 | 253 | 253 | 268 | 259 | 280 | 257 | 254 | 210 | 6179 |
Data Source: CPHSP data received March 31, 2022 Abbreviations: AIDS, Acquired Immunodeficiency Syndrome; ART, Antiretroviral Therapy
|
||||||||||
| YearData Table 8 footnote a | Tested in CanadaData Table 8 footnote b | Tested Internationally | ||
|---|---|---|---|---|
| Number diagnosed with HIV | % | Number diagnosed with HIV | % | |
| 2012 | 243 | 63.4 | 140 | 36.6 |
| 2013 | 422 | 67.7 | 201 | 32.3 |
| 2014 | 345 | 67.9 | 163 | 32.1 |
| 2015 | 350 | 63.6 | 200 | 36.4 |
| 2016 | 418 | 55.7 | 333 | 44.3 |
| 2017 | 549 | 65.7 | 286 | 34.3 |
| 2018 | 696 | 67.8 | 330 | 32.2 |
| 2019 | 626 | 52.7 | 562 | 47.3 |
| 2020 | 399 | 53.7 | 344 | 46.3 |
| 2021 | 453 | 52.4 | 412 | 47.6 |
| Total | 4,501 | 60.2 | 2,971 | 39.8 |
Source: Immigration, Refugees, and Citizenship Canada, IRCC GCMS and IMS/FOSS as of July 2022.Reproduced and distributed with the permission of Immigration, Refugees, and Citizenship Canada.
|
||||
| Tested in CanadaData Table 9 footnote a 2012-2021 |
Tested Internationally 2012-2021 |
|||
|---|---|---|---|---|
| Number diagnosed with HIV | % | Number diagnosed with HIV | % | |
| SexData Table 9 footnote b | ||||
| Male | 2650 | 58.9% | 1562 | 55.3% |
| Female | 1848 | 41.1% | 1264 | 44.7% |
| Age groupData Table 9 footnote c | ||||
| <20 | 65 | 1.4% | 178 | 6.3% |
| 20-29 | 845 | 18.8% | 777 | 27.4% |
| 30-39 | 1751 | 38.9% | 996 | 35.2% |
| 40-49 | 1158 | 25.7% | 504 | 17.8% |
| 50+ | 682 | 15.2% | 376 | 13.3% |
| ProvinceData Table 9 footnote d Data Table 9 footnote e | ||||
| AB | 415 | 9.2% | 395 | 14.5% |
| BC | 384 | 8.5% | 308 | 11.3% |
| MB | 56 | 1.2% | 158 | 5.8% |
| ON | 2396 | 53.2% | 963 | 35.4% |
| QC | 1156 | 25.7% | 654 | 24.1% |
| SK | 54 | 1.2% | 92 | 3.4% |
| Atlantic provincesData Table 9 footnote f | 39 | 0.9% | 140 | 5.2% |
| TerritoriesData Table 9 footnote f | 1 | 0.0% | 8 | 0.3% |
|
||||
Supplementary tables
Copies of the supplementary tables are available upon request. Please e-mail the HIV Surveillance Section, PHAC staff at hass@phac-aspc.gc.ca.
List of supplementary tables
- Table 1: HIV diagnosis rate (per 100,000 population) by province/territory and year of diagnosis (all ages)
- Table 2: Number of HIV cases (all ages) by province/territory, sex and year of diagnosis, Canada, 1985 to 2021
- Table 3: Number of HIV cases by age group and province/territory, Canada, 2020 to 2021
- Table 4: Number of HIV cases among adults (≥ 15 years old) by year of diagnosis and sex, Canada, 1985 to 2021
- Table 5: Number of HIV cases and HIV diagnosis rate by age group, sex and year of diagnosis, Canada, 1985 to 2021
- Table 6: Number and percentage distribution of HIV cases among adults (≥ 15 years old) by exposure category and year of diagnosis, Canada, 1985 to 2021
- Table 7: Number and percentage distribution of HIV cases among adult males (≥ 15 years old) by exposure category and year of diagnosis, Canada, 1985 to 2021
- Table 8: Number and percentage distribution of HIV cases among adult females (≥ 15 years old) by exposure category and year of diagnosis, Canada, 1985 to 2021
- Table 9: Number and percentage distribution of HIV cases among adults (≥ 15 years old) by exposure category and age group, Canada, 2020 to 2021
- Table 10: Number and percentage distribution of HIV cases among children (<15 years old) by exposure category and year of diagnosis, Canada, 1985 to 2021
- Table 11: Number of HIV cases by exposure category and province/territory, Canada, 2020 to 2021
- Table 12: Number and percentage distribution of immigration applicants to Canada diagnosed with HIV as a result of an immigration medical exam (IME) by year, 2011 to 2021
- Table 13: Number and percentage distribution of immigration applicants to Canada diagnosed with HIV as a result of an immigration medical exam (IME) by sex, age group, and province, 2013 to 2021
- Table 14: Number of Canadian perinatally HIV-exposed infants by exposure category of the person who gave birth to them and year of infant birth, 1984 to 2021
- Table 15: Number of Canadian perinatally HIV-exposed infants by year of birth, current status and use of antiretroviral therapy (ART) for prophylaxis, 1984 to 2021
- Table 16: Number of Canadian perinatally HIV-exposed infants by geographic region and status at last report, 1984 to 2021
- Table 17: Number of Canadian perinatally HIV-exposed infants by ethnic status and HIV status, 1984 to 2021
- Table 18: Number of Canadian perinatally HIV-exposed infants by country of birth of the person who was pregnant and HIV status, 1984 to 2021
Appendix 1: Data contributors
Provincial and territorial
Alberta Health
23rd Floor ATB Place
10025 Jasper Avenue
Edmonton, AB T5J 1S5
BC Centre for Disease Control
655 West 12th Avenue
Vancouver, BC V5Z 4R4
Manitoba Health
4th Floor - 300 Carlton Street
Winnipeg, MB R3B 3M9
New Brunswick Department of Health
520 King Street, HSBC Place
P.O. Box 5100
Fredericton, NB E3B 6G3
Newfoundland and Labrador Department of Health and Community Services
West Block, Confederation Building
P.O. Box 8700
St. John's, NL A1B 4J6
Northwest Territories Health and Social Services
P.O. Box 1320
8th Floor, Centre Square Tower
5022-49th Street
Yellowknife, NWT X1A 2L9
Nova Scotia Department of Health and Wellness
Barrington Tower
1894 Barrington Street
PO Box 488
Halifax, NS B3J 2R8
Nunavut Department of Health
P.O. Box 1000, Station 1000
Iqaluit, NU X0A 0H0
Public Health Ontario Laboratory
661 University Avenue, Suite 1701
Toronto, ON M5G 1M1
Public Health Ontario
661 University Avenue
Toronto, ON M5G 1V2
Prince Edward Island Department of Health and Wellness
16 Fitzroy Street, 2nd floor
Charlottetown, PEI C1A 7N8
Laboratoire de santé publique du Québec INSPQ
20045 chemin Sainte-Marie
Sainte Anne de Bellevue, QC H9X 3R5
Saskatchewan Ministry of Health
3475 Albert Street, 1st floor
Regina, SK S4S 6X6
Yukon Department of Health and Social Services
4 Hospital Road
Whitehorse, YK Y1A 3H8
Additional data contributors
Immigration, Refugees and Citizenship Canada
300 Slater St.
Ottawa, ON K1P 6A6
Canadian Perinatal HIV Surveillance Program
CHU Sainte-Justine Research Centre
3175, Côte-Sainte-Catherine, Room 3713
Montréal, QC H3T 1C5
Appendix 2: Technical notes
All provinces, with the exception of Newfoundland and Labrador, submitted line-listed data. Newfoundland and Labrador, the Northwest Territories, Nunavut and Yukon submitted data using the National HIV/AIDS case report form. The national case definitions for both HIV and AIDS can be found on-line: Case definitions: Nationally notifiable diseases (canada.ca).
The data for HIV and AIDS are maintained in two unlinked databases. Different HIV and AIDS reporting requirements and practices exist across the country. Historically, there was also variation in reporting of first-time ever diagnoses of HIV and previous diagnoses, and all cases were referred to as 'newly reported' in previous reports. The ability to distinguish between first-time diagnoses and previously diagnosed cases varies by province and territory and by surveillance year. Please refer to 'Figure A1: Status of reporting on first-time diagnoses and previously diagnosed cases in all Canadian provinces and territories, 2012 to 2021' for more detail about the pattern of reporting among the provinces and territories on previous positive cases over the past ten years. Figure A2 presents the breakdown of all cases (first-time diagnoses versus previously diagnosed cases) in Canadian provinces and territories over the past 10 years.
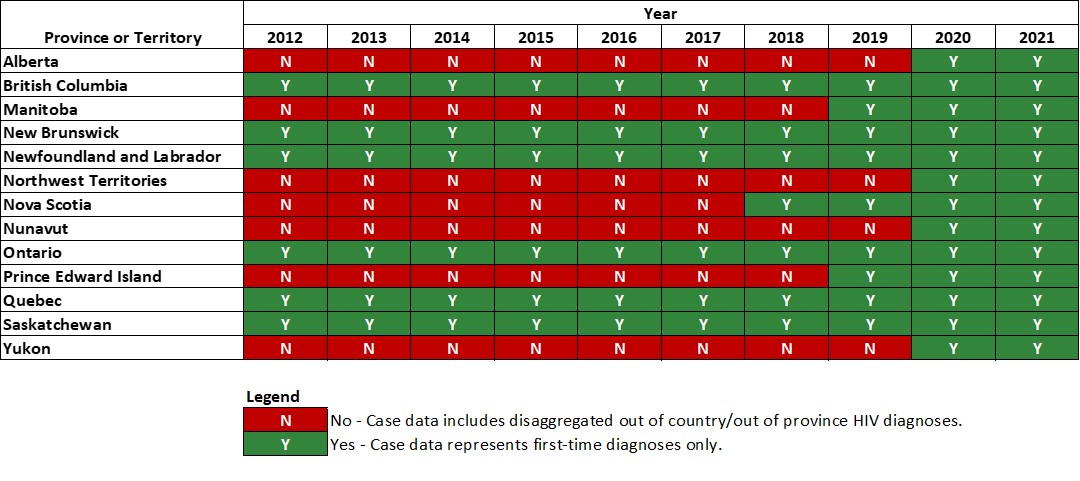
Figure A1: Text description
| Province or territory | Year | |||||||||
|---|---|---|---|---|---|---|---|---|---|---|
| 2012 | 2013 | 2014 | 2015 | 2016 | 2017 | 2018 | 2019 | 2020 | 2021 | |
| Alberta | N | N | N | N | N | N | N | N | Y | Y |
| British Columbia | Y | Y | Y | Y | Y | Y | Y | Y | Y | Y |
| Manitoba | N | N | N | N | N | N | N | Y | Y | Y |
| New Brunswick | Y | Y | Y | Y | Y | Y | Y | Y | Y | Y |
| Newfoundland and Labrador | Y | Y | Y | Y | Y | Y | Y | Y | Y | Y |
| Northwest Territories | N | N | N | N | N | N | N | N | Y | Y |
| Nova Scotia | N | N | N | N | N | N | Y | Y | Y | Y |
| Nunavut | N | N | N | N | N | N | N | N | Y | Y |
| Ontario | Y | Y | Y | Y | Y | Y | Y | Y | Y | Y |
| Prince Edward Island | N | N | N | N | N | N | N | Y | Y | Y |
| Quebec | Y | Y | Y | Y | Y | Y | Y | Y | Y | Y |
| Saskatchewan | Y | Y | Y | Y | Y | Y | Y | Y | Y | Y |
| Yukon | N | N | N | N | N | N | N | N | Y | Y |
Legend: Y = Yes – Case data represents first-time HIV diagnoses only; N = No – Case data includes disaggregated out of country/out of province HIV diagnoses. |
||||||||||
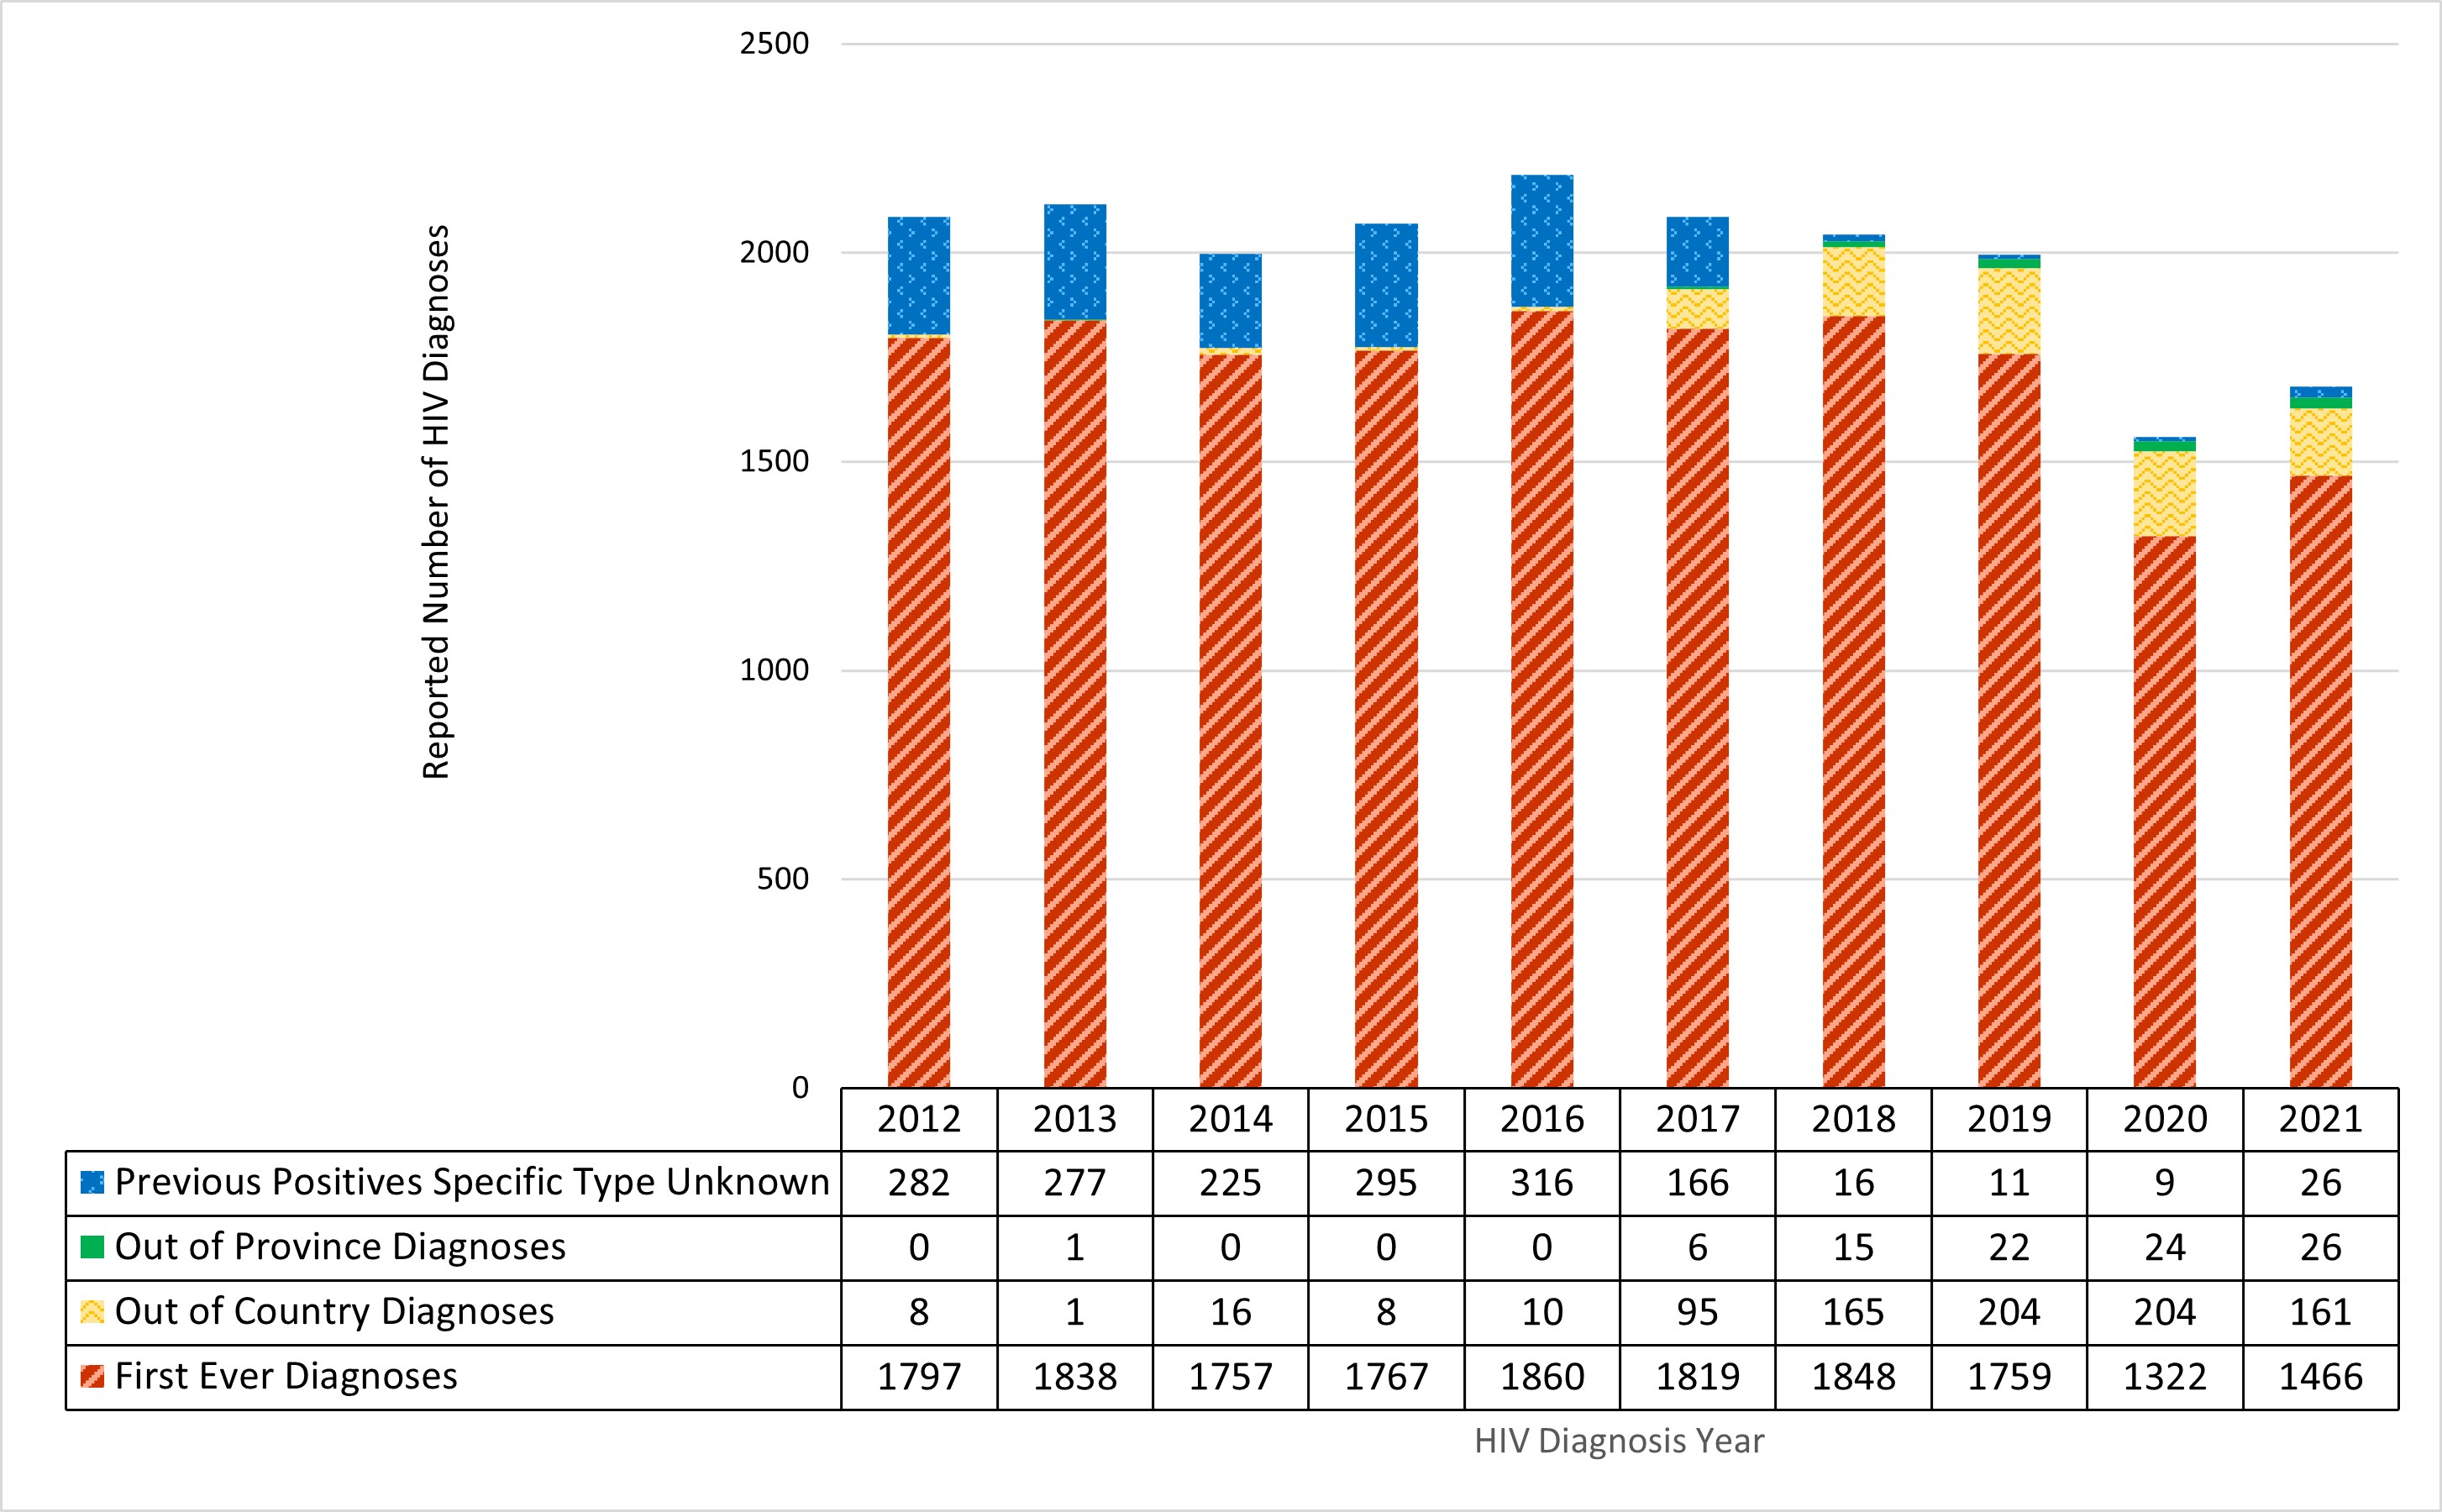
Figure A2: Text description
| Year of diagnosis | First-time diagnoses | Out of province diagnoses | Out of country diagnoses | Previous positives specific type unknown |
|---|---|---|---|---|
| 2012 | 1,797 | 0 | 8 | 282 |
| 2013 | 1,838 | 1 | 1 | 277 |
| 2014 | 1,757 | 0 | 16 | 225 |
| 2015 | 1,767 | 0 | 8 | 295 |
| 2016 | 1,860 | 0 | 10 | 316 |
| 2017 | 1,819 | 6 | 95 | 166 |
| 2018 | 1,848 | 15 | 165 | 16 |
| 2019 | 1,759 | 22 | 204 | 11 |
| 2020 | 1,322 | 24 | 204 | 9 |
| 2021 | 1,466 | 26 | 161 | 26 |
- Figure A2 a
-
Out of country and out of province cases were not included in datasets from British Columbia and Ontario.
- Figure A2 b
-
As of 2019, Saskatchewan reports only first-time diagnosed cases based on the year of testing, which is the reporting year for that HIV case. Previous positive cases referred from other jurisdictions outside Saskatchewan (including OOC) are captured in the SK HIV Public Health database (Panorama) but this data is not extracted or shared with PHAC.
- Figure A2 c
-
Includes data on HIV cases previously diagnosed within Quebec between 2012-2016 as Quebec reported first ever diagnoses between 2012-2021 but breakdown of type of previous positives was not reported between 2012-2016.
- Figure A2 d
-
The 'Previous Positives Specific Type Unknown' are previously diagnosed cases from Quebec between 2012-2016 and other provinces where the cases have been identified as previous positives, but insufficient information is available to attribute them to either OOC or OOP.
- Figure A2 e
-
Cases reported as 'Previously diagnosed in province' for Quebec (2017-2021) have been excluded to correspond to case reporting in the other Provinces and Territories.
HIV data
- Twelve of thirteen provinces and territories provided line-listed data on first-time diagnoses for 2021. Quebec provided line-listed data on all diagnoses within the province that did not separate first-time from previously diagnosed cases in 2021, however they also provided aggregate data tables for first-time diagnoses so that the data could be incorporated into the national analyses.
- Provincial and territorial public health authorities provided information on previously diagnosed cases in their data submission. These were defined as HIV cases that had evidence of a known previous HIV diagnosis in another country (Out of Country, OOC) or in another Canadian province or territory (Out of Province, OOP). The additional aggregate summary data from Quebec included previously diagnosed cases where there was insufficient information to determine if they were OOP or OOC. In this case they were classified as 'Previous Positives Specific Type Unknown' in Figure A2.
- Some Provinces and Territories were able to provide historical information on previous positive cases; however, given resource constraints faced throughout the COVID-19 pandemic, not all PTs were able to do this for this reporting cycle.
- Data within provincial and territorial public health authorities are continuously updated to remove duplicate cases and enhance the completeness of the data.
- For Alberta, in 2021, national reporting excludes HIV cases where the location of the first-time positive has been identified as out-of-country or outside the reporting province; consequently, HIV case totals from PHAC may differ from those reported by Alberta provincial reports. This is also noted within the report.
Race and/or ethnicity category
- Race and/or ethnicity information were submitted by all provinces and territories excluding Manitoba and Quebec. Additionally, reporting practices (such as race and/or ethnicity categories used) vary across provinces and territories and are limited in some PTs.
- New Brunswick submitted information about whether a case was First Nations or not First Nations but did not submit information about any other race and/or ethnicity category. Similarly, Saskatchewan submitted race and/or ethnicity in terms of whether a case self-declared as Indigenous or not, but does not collect information about any other race and/or ethnicity category. British Columbia submitted information about race and/or ethnicity in cases who are not Indigenous.
- Among the PTs, the completeness of this variable ranged from 25.0% to 100% in 2021 (45.3% overall) and therefore should be interpreted with caution given the large amount of missing data and may not be fully representative of the national picture of race and/or ethnicity information for HIV cases.
- Further detail about the categories used in this report are:
- Individuals reported in the South Asian/West Asian/Arab category include, for example, those of Pakistani, Sri Lankan, Bangladeshi, Armenian, Egyptian, Iranian, Lebanese, or Moroccan descent.
- Individuals reported in the Asian category include, for example, those of Chinese, Japanese, Vietnamese, Indonesian, Laotian, Korean or Filipino descent.
- Individuals reported in the Black category include, for example, those of Somali, Haitian or Jamaican descent.
- Individuals reported in the Latin American category include, for example, those of Mexican, Central American, or South American descent.
- Individuals reported in the 'Other' ethnicity category include those of mixed-race descent or any other racial and/or ethnic category.
Exposure category
- Exposure category data were submitted by all provinces and territories; while 12 of the 13 PT public health authorities submitted exposure category information as line-listed data, Quebec submitted exposure category data in aggregate table form.
- Among the PTs, the completeness of this variable ranged from 56.6% to 100% in 2021 (81.2% overall).
AIDS data
The AIDS surveillance database captures non-nominal data on people diagnosed with AIDS (as per the national case definition) and includes HIV diagnosis, the disease indicative of AIDS and the vital status for the AIDS case (e.g., death). Among the provinces and territories, the following changes to AIDS reporting have occurred over time, which affect the completeness of AIDS surveillance data (Figure A3).
From January 1, 1979, to December 31, 2021, there were 24,975 cases of AIDS reported to PHAC. Additional AIDS data is available on the Notifiable Diseases website, Notifiable Diseases Online (canada.ca).
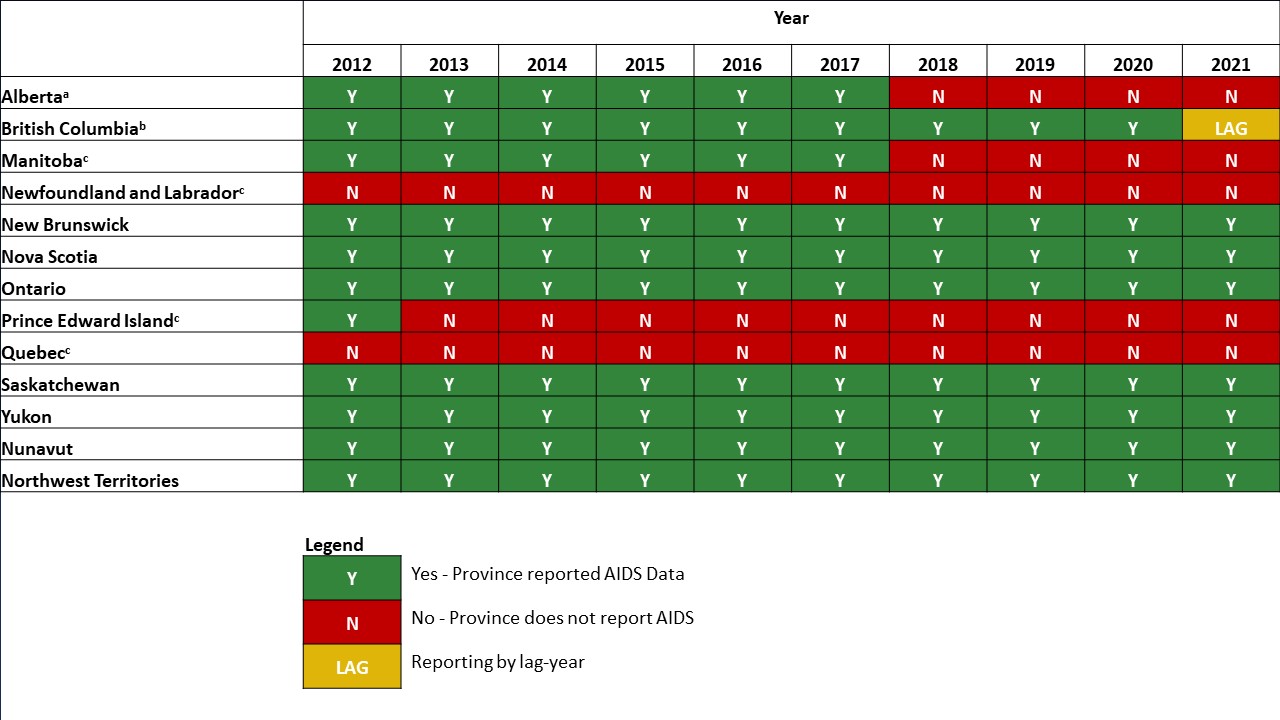
Figure A3: Text description
| Year | ||||||||||
|---|---|---|---|---|---|---|---|---|---|---|
| Province or territory | 2012 | 2013 | 2014 | 2015 | 2016 | 2017 | 2018 | 2019 | 2020 | 2021 |
| AlbertaFigure a3 footnote a | Y | Y | Y | Y | Y | Y | N | N | N | N |
| British ColumbiaFigure a3 footnote b | Y | Y | Y | Y | Y | Y | Y | Y | Y | LAG |
| ManitobaFigure a3 footnote c | Y | Y | Y | Y | Y | Y | N | N | N | N |
| Newfoundland and LabradorFigure a3 footnote c | N | N | N | N | N | N | N | N | N | N |
| New Brunswick | Y | Y | Y | Y | Y | Y | Y | Y | Y | Y |
| Nova Scotia | Y | Y | Y | Y | Y | Y | Y | Y | Y | Y |
| Ontario | Y | Y | Y | Y | Y | Y | Y | Y | Y | Y |
| Prince Edward IslandFigure a3 footnote c | Y | N | N | N | N | N | N | N | N | N |
| QuebecFigure a3 footnote c | N | N | N | N | N | N | N | N | N | N |
| Saskatchewan | Y | Y | Y | Y | Y | Y | Y | Y | Y | Y |
| Yukon | Y | Y | Y | Y | Y | Y | Y | Y | Y | Y |
| Nunavut | Y | Y | Y | Y | Y | Y | Y | Y | Y | Y |
| Northwest Territories | Y | Y | Y | Y | Y | Y | Y | Y | Y | Y |
Legend: Y = Yes - Province reported AIDS Data; N = No - Province does not report AIDS; LAG = Reporting by lag-year |
||||||||||
- Figure A3 a
-
Alberta did not report AIDS data due to under reporting in 2018 and 2019. AIDS is no longer reportable in Alberta as of 2020.
- Figure A3 b
-
There is a one-year lag associated with the submission of AIDS data in British Columbia (e.g. 2020 data was submitted in 2021).
- Figure A3 c
-
AIDS is no longer reportable in: Manitoba as of 2018, Newfoundland and Labrador as of 2009, Prince Edward Island as of 2012, and Quebec as of June 30, 2003.
Appendix 3: Exposure category hierarchy
Based on information submitted about behaviours, HIV/AIDS cases are assigned a single exposure category from the PHAC exposure category hierarchy corresponding to the exposure route with the highest likelihood of HIV transmission. For example, if an individual who uses injection drugs and reports heterosexual contact is diagnosed with HIV, this individual would be attributed to the 'injection drug use' exposure category as this category has a higher likelihood of HIV transmission than 'heterosexual contact'. Several limitations of using the exposure category hierarchy exists: the exposure category does not differentiate between specific behaviours and populations with an increased burden of HIV; assessment of the exposure category can vary based on both the individual's responses and the questions posed by the care provider; and the exposure category hierarchy may need to be revised considering more recent evidence regarding probabilities of HIV transmission with the assistance of surveillance partners and subject-matter experts.
The exposure hierarchy is as follows:
Male-to-male sexual contact: This category includes males who report sexual contact with other males. It is important to note that this is a broad category that doesn't consider that the likelihood of acquiring or transmitting HIV varies by type of sexual contact, with condomless anal sex having the greatest transmission risk. Footnote 57 Footnote 58
Male-to-male sexual contact and Injection Drug Use (IDU): This category includes males who report sexual contact with other males and who also report injecting drugs.
Injection Drug Use (IDU): This category includes people who report injecting drugs.
Blood/blood products:
Recipient of blood/clotting factor: Before 1998, it was not possible to separate this exposure category. However, where possible, it has been separated into subcategories a and b.
- Recipient of blood: Received transfusion of whole blood or blood components, such as packed red cells, plasma, platelets, or cryoprecipitate.
- Recipient of clotting factor: Received pooled concentrates of clotting factor VIII or IX for treatment of hemophilia/coagulation disorder.
Heterosexual contact: This exposure applies to a person who indicated heterosexual contact and where there is no indication of male-to-male sexual contact, use of injection drugs, or a recipient of blood or clotting factor before 1998.
Occupational exposure: Exposure to HIV-contaminated blood or body fluids, or concentrated virus, in an occupational setting. This applies only to reported AIDS cases and not to HIV cases where the occupational exposure category is captured under "Other".
Perinatal transmission: The transmission of HIV from a person living with HIV to their infant, either in utero, during childbirth, or through breastfeeding.
Other: Used to classify cases where the mode of HIV transmission is known but cannot be classified into any of the major exposure categories listed here; for example, a recipient of semen from an HIV-positive donor. The "Other" exposure category includes cases from Alberta identified through Immigration Refugees and Citizenship Canada (for years before 2020), and also blood/clotting, perinatal, occupational exposure and other exposure categories.
No identified risk (NIR): Used when the history of exposure to HIV through any of the other modes listed is unknown, or there is no reported history (e.g., because of death, or loss to follow-up).
Not reported: In certain provinces and territories, exposure categories are not reported to PHAC and are classified as "not reported".
References
- Footnote 1
-
Joint United Nations Programme on, HIV/AIDS (UNAIDS). (2023) Global HIV & AIDS statistics — Fact sheet 2023. Available from: https://www.unaids.org/sites/default/files/media_asset/UNAIDS_FactSheet_en.pdf
- Footnote 2
-
Laprise C and Bolster-Foucault C. (2021) Understanding barriers and facilitators to HIV testing in Canada from 2009-2019: A systematic mixed studies review. Can Commun Dis Rep. DOI: 10.14745/ccdr.v47i02a03.
- Footnote 3
-
Jones J, Sullivan PS and Curran JW. (2019) Progress in the HIV epidemic: Identifying goals and measuring success. PLoS Med. DOI: 10.1371/journal.pmed.1002729.
- Footnote 4
-
Jackson C and Tremblay G. (2019) Accelerating our response: Government of Canada five-year action plan on sexually transmitted and blood-borne infections. Canada communicable disease report. DOI: 10.14745/ccdr.v45i12a04.
- Footnote 5
-
Public Health Agency of Canada. (2023) HIV in Canada, Surveillance Report to December 31, 2020. Available from: https://www.canada.ca/en/public-health/services/publications/diseases-conditions/hiv-canada-surveillance-report-december-31-2020.html#introduction.
- Footnote 6
-
Public Health Agency of Canada. (2022) Estimates of HIV incidence, prevalence and Canada's progress on meeting the 90-90-90 HIV targets, 2020. Available from: https://www.canada.ca/en/public-health/services/publications/diseases-conditions/estimates-hiv-incidence-prevalence-canada-meeting-90-90-90-targets-2020.html.
- Footnote 7
-
Public Health Agency of Canada. (2022) National Report Findings from the Survey on the Impact of COVID-19 on the delivery of STBBI prevention, testing and treatment, including harm reduction services, in Canada. Available from: https://www.canada.ca/en/public-health/services/publications/diseases-conditions/survey-impact-covid-19-delivery-stbbi-prevention-testing-treatment.html.
- Footnote 8
-
Groseclose SL and Buckeridge DL. (2017) Public Health Surveillance Systems: Recent Advances in Their Use and Evaluation. Annu Rev Public Health. DOI: 10.1146/annurev-publhealth-031816-044348.
- Footnote 9
-
Lyon D. (2022) Surveillance. Internet policy review. DOI: 10.14763/2022.4.1673.
- Footnote 10
-
Fleming PJ, Lopez WD, Spolum M, et al. (2021) Policing Is a Public Health Issue: The Important Role of Health Educators. Health Educ Behav. DOI: 10.1177/10901981211001010.
- Footnote 11
-
Public Health Agency of Canada. (2018) Reducing the health impact of sexually transmitted and blood-borne infections in Canada by 2030: A pan-Canadian STBBI framework for action. Available from: https://www.canada.ca/en/public-health/services/infectious-diseases/sexual-health-sexually-transmitted-infections/reports-publications/sexually-transmitted-blood-borne-infections-action-framework.html.
- Footnote 12
-
Centre for Communicable Diseases and Infection Control. (2018) A summary of the Pan-Canadian framework on sexually-transmitted and blood-borne infections. Can Commun Dis Rep. DOI: 10.14745/ccdr.v44i78a05.
- Footnote 13
-
Joint United Nations Programme on, HIV/AIDS (UNAIDS). (2020) Prevailing against pandemics by putting people at the centre — World AIDS Day report 2020. Available from: https://aidstargets2025.unaids.org/assets/images/prevailing-against-pandemics_en.pdf.
- Footnote 14
-
Joint United Nations Programme on, HIV/AIDS (UNAIDS). (2014) Fast-Track: Ending the AIDS Epidemic by 2030. Available from: https://www.unaids.org/sites/default/files/media_asset/JC2686_WAD2014report_en.pdf.
- Footnote 15
-
Tarasuk J, Zhang J, Lemyre A, et al. (2020) National findings from the Tracks survey of people who inject drugs in Canada, Phase 4, 2017–2019. Canada communicable disease report. DOI: 10.14745/ccdr.v46i05a07.
- Footnote 16
-
Lydon-Hassen K, Jonah L, Mayotte L, et al. (2022) Summary findings from Tracks surveys implemented by First Nations in Saskatchewan and Alberta, Canada, 2018–2020. Canada communicable disease report. DOI: 10.14745/ccdr.v48i04a05.
- Footnote 17
-
A/C Study Research Team. (2020) A/C STUDY Community Report HIV among African, Caribbean, and Black People in Ontario. Available from: https://acstudy.ca/wp-content/uploads/2021/02/A_C_report2020.pdf.
- Footnote 18
-
WHO, CDC, UNAIDS, et al. (2017) Global HIV Strategic Information Working Group Biobehavioural Survey Guidelines For Populations At Risk For HIV. Available from: https://www.who.int/publications/i/item/978-92-4-151301-2.
- Footnote 19
-
Popovic N, Yang Q, Haddad N, et al. (2019) Improving national surveillance of new HIV diagnoses. Can Commun Dis Rep. DOI: 10.14745/ccdr.v45i12a02.
- Footnote 20
-
Public Health Agency of Canada. (2023) Case definitions: Nationally notifiable diseases. Available from: https://diseases.canada.ca/notifiable/diseases-list.
- Footnote 21
-
Public Health Agency of Canada. (2015) HIV and AIDS in Canada Surveillance Report to December 31, 2014. Available from: /content/dam/canada/health-canada/migration/healthy-canadians/publications/diseases-conditions-maladies-affections/hiv-aids-surveillance-2014-vih-sida/alt/hiv-aids-surveillance-2014-vih-sida-eng.pdf.
- Footnote 22
-
Forbes JC, Alimenti AM, Singer J, et al. (2012) A national review of vertical HIV transmission. AIDS. DOI: 10.1097/QAD.0b013e328350995c.
- Footnote 23
-
Immigration Refugees and Citizenship Canada. (2023) Canadian Panel Member Guide to Immigration Medical Examinations 2020. Available from: https://www.canada.ca/en/immigration-refugees-citizenship/corporate/publications-manuals/panel-members-guide.html.
- Footnote 24
-
Statistics Canada. (2020) Canadian Vital Statistics - Death Database (CVSD). Available from: https://www23.statcan.gc.ca/imdb/p2SV.pl?Function=getSurvey&SDDS=3233.
- Footnote 25
-
Statistics Canada. (2021) Death and age-specific mortality rates, by selected grouped causes, Table 13-10-0392-01. Available from: https://www150.statcan.gc.ca/t1/tbl1/en/tv.action?pid=1310039201.
- Footnote 26
-
Canadian Institute for Health Information. (2022) Guidance on the Use of Standards for Race-Based and Indigenous Identity Data Collection and Health Reporting in Canada. Available from: https://www.cihi.ca/sites/default/files/document/guidance-and-standards-for-race-based-and-indigenous-identity-data-en.pdf.
- Footnote 27
-
British Columbia's Office of the Human Rights Commissioner. (2020) Racialization. Available from: https://bchumanrights.ca/glossary/racialization/.
- Footnote 28
-
Loutfy MR, Logie CH, Zhang Y, et al. (2012) Gender and Ethnicity Differences in HIV-related Stigma Experienced by People Living with HIV in Ontario, Canada. PLOS ONE. DOI: 10.1371/journal.pone.0048168.
- Footnote 29
-
Woodgate RL, Zurba M, Tennent P, et al. (2017) "People try and label me as someone I'm not": The social ecology of Indigenous people living with HIV, stigma, and discrimination in Manitoba, Canada. Soc Sci Med. DOI: 10.1016/j.socscimed.2017.10.002.
- Footnote 30
-
Public Health Agency of Canada. (2022) National Report Findings from the Survey on the Impact of COVID-19 on access to STBBI-related services, including harm reduction services, for African, Caribbean and Black people in Canada. Available from: https://www.canada.ca/en/public-health/services/publications/diseases-conditions/survey-impact-covid-19-access-stbbi-harm-reduction-services-african-caribbean-black-people.html.
- Footnote 31
-
Antabe R, Konkor I, McIntosh M, et al. (2021) "I went in there, had a bit of an issue with those folks": everyday challenges of heterosexual African, Caribbean and black (ACB) men in accessing HIV/AIDS services in London, Ontario. BMC Public Health. DOI: 10.1186/s12889-021-10321-x.
- Footnote 32
-
Kirby Institute. (2018) HIV in Australia: annual surveillance short report 2018. Available from: https://www.kirby.unsw.edu.au/research/reports/asr2018.
- Footnote 33
-
Public Health Agency of Canada. (2023) National Report Findings from the Survey on the Impact of COVID19 on access to STBBI-related services, including harm reduction services, for people who use drugs or alcohol in Canada. Available from: https://www.canada.ca/en/public-health/services/publications/diseases-conditions/survey-impact-covid-19-access-stbbi-services-harm-reduction-people-who-use-drugs-alcohol.html.
- Footnote 34
-
UK Health Security Agency. (2022) National HIV surveillance data tables to end December 2021. Version 2. Available from: https://www.gov.uk/government/statistics/hiv-annual-data-tables.
- Footnote 35
-
Centers for Disease Control and Prevention. (2023) Diagnoses of HIV Infection in the United States and Dependent Areas, 2021. HIV Surveillance Report; 34. Available from: http://www.cdc.gov/hiv/library/reports/hiv-surveillance.html.
- Footnote 36
-
WHO Regional Office for Europe and European Centre for Disease Prevention and Control. (2022) HIV/AIDS surveillance in Europe 2022 - 2021 data. Available from: https://www.who.int/europe/publications/i/item/9789289058636.
- Footnote 37
-
King J, McManus H, Kwon A, et al. (2022) HIV, viral hepatitis and sexually transmissible infections in Australia: Annual surveillance report 2022. Available from: https://www.kirby.unsw.edu.au/sites/default/files/documents/Annual-Surveillance-Report-2022_HIV.pdf.
- Footnote 38
-
Lester J, Martin V, Shah A, et al. (2022) HIV testing, PrEP, new HIV diagnoses, and care outcomes for people accessing HIV services: 2022 report. The annual official statistics data release (data to end of December 2021). Available from: https://www.gov.uk/government/statistics/hiv-annual-data-tables/hiv-testing-prep-new-hiv-diagnoses-and-care-outcomes-for-people-accessing-hiv-services-2022-report#suggested-citation.
- Footnote 39
-
Hong C. (2023) Characterizing the Impact of the COVID-19 Pandemic on HIV PrEP care: A Review and Synthesis of the Literature. AIDS Behav. DOI: 10.1007/s10461-022-03941-w.
- Footnote 40
-
Bachari AK, McCully J, Tsergas N, et al. (2022) EPB258 Analysis of the impact of COVID-19 pandemic on PrEP uptake in Toronto: a retrospective 18-month single-site chart review. The 24th International AIDS Conference.
- Footnote 41
-
Government of Manitoba, Department of Health, Performance and Oversight Division, Epidemiology and Surveillance. (2022) 2021 Annual Surveillance Update: HIV in Manitoba. Available from: https://www.manitoba.ca/health/publichealth/surveillance/hivaids/docs/dec2021.pdf.
- Footnote 42
-
The Ontario HIV Epidemiology Surveillance Initiative (OHESI). (2023) Current Trends for HIV in Ontario. Available from: https://www.ohesi.ca/.
- Footnote 43
-
British Columbia Centre for Excellence in, HIV/AIDS and British Columbia Ministry of Health. (2022) HIV Monitoring Semi-Annual Report for British Columbia Second Quarter 2022. Available from: https://stophivaids.ca/qmr/2022-Q2/#/bc.
- Footnote 44
-
Fojo A, Wallengren E, Schnure M, et al. (2022) Potential Effects of the Coronavirus Disease 2019 (COVID-19) Pandemic on Human Immunodeficiency Virus (HIV) Transmission: A Modeling Study in 32 US Cities. Clin Infect Dis. DOI: 10.1093/cid/ciab1029.
- Footnote 45
-
Miller RL, McLaughlin A, Montoya V, et al. (2022) Impact of SARS-CoV-2 lockdown on expansion of HIV transmission clusters among key populations: A retrospective phylogenetic analysis. Lancet Reg Health Am. DOI: 10.1016/j.lana.2022.100369.
- Footnote 46
-
Sang J, Moore D, Wang L, et al. (2022) EPC 445 Examining the impacts of the COVID-19 pandemic on syndemic conditions and PrEP use among HIV among gay, bisexual and other men who have sex with men in Vancouver, Canada. The 24th International AIDS Conference.
- Footnote 47
-
Lazzam D, Clarke Q, Lachowksy N, et al. (2022) 227 PrEP Access in Canada During the COVID-19 Pandemic. The 31st Annual Canadian Conference on HIV / AIDS Research.
- Footnote 48
-
Cox J, Zhang J, Wong M, et al. (2022) PEMOD74 Impact of COVID-19 on access to sexually transmitted and blood-borne infections (STBBI) and harm reduction services for people who use drugs or alcohol in Canada. The 24th International AIDS Conference.
- Footnote 49
-
Statistics Canada. (2023) Table 17-10-0040-01 Estimates of the components of international migration, quarterly. Available from: https://www150.statcan.gc.ca/t1/tbl1/en/tv.action?pid=1710004001.
- Footnote 50
-
Office for National Statistics. (2022) Long-term international migration, provisional: year ending June 2022. Available from: https://www.ons.gov.uk/peoplepopulationandcommunity/populationandmigration/internationalmigration/bulletins/longterminternationalmigrationprovisional/yearendingjune2022.
- Footnote 51
-
Australian Bureau of Statistics. (2022) Overseas Migration (Financial Year 2021-22). Available from: https://www.abs.gov.au/statistics/people/population/overseas-migration/latest-release.
- Footnote 52
-
Singer J, Bitnun A, Kakkar F, et al. (2022) 43 Canadian Perinatal HIV Surveillance Program: Assessment of the effect of the COVID-19 pandemic on access to HIV Treatment and vertical transmission. The 31st Annual Canadian Conference on HIV / AIDS Research.
- Footnote 53
-
Tjepkema M, Christidis T, Olaniyan T, et al. (2023) Mortality inequalities of Black adults in Canada. Health Rep. DOI: 10.25318/82-003-x202300200001-eng.
- Footnote 54
-
Nosyk B, Min JE, Krebs E, et al. (2018) The Cost-Effectiveness of Human Immunodeficiency Virus Testing and Treatment Engagement Initiatives in British Columbia, Canada: 2011-2013. Clin Infect Dis. DOI: 10.1093/cid/cix832.
- Footnote 55
-
Haddad N, Weeks A, Robert A, et al. (2021) HIV in Canada-surveillance report, 2019. Can Commun Dis Rep. DOI: 10.14745/ccdr.v47i01a11.
- Footnote 56
-
Hurren K, Haque S, Kwag M, et al. (2023) SEEING US AS WE ARE: Gender, Sex, & Sexual Orientation Identification in Electronic Health Records. Available from: https://www.cbrc.net/seeing_us_as_we_are_gender_sex_sexual_orientation_identification_in_electronic_health_records.
- Footnote 57
-
Public Health Agency of Canada. (2012) HIV Transmission Risk: A Summary of the Evidence HIV. Available from: https://canadacommons.ca/marc/artifacts/1196206/hiv-transmission-risk/.
- Footnote 58
-
Loutfy M, Tyndall M, Baril J, et al. (2014) Canadian consensus statement on HIV and its transmission in the context of criminal law. Can J Infect Dis Med Microbiol. DOI: 10.1155/2014/498459.
Page details
- Date modified: