
Archived - Department of Finance Canada Quarterly Financial Report for the Quarter Ended September 30, 2013 (unaudited)
This quarterly financial report has been prepared by management as required by section 65.1 of the Financial Administration Act and in the form and manner prescribed by the Treasury Board Accounting Standard 1.3. This quarterly financial report should be read in conjunction with the Main Estimates, Supplementary Estimates as well as Canada’s Economic Action Plan 2012 (Budget 2012). The quarterly financial report has not been subject to an external audit or review.
The Department helps the Government of Canada develop and implement strong and sustainable economic, fiscal, tax, social, security, international and financial sector policies and programs. It plays an important central agency role, working with other departments to ensure that the government's agenda is carried out and that ministers are supported with high-quality analysis and advice.
The Department's responsibilities include the following:
- Preparing the federal Budget and the Update of Economic and Fiscal Projections;
- Preparing the Annual Financial Report of the Government of Canada and, in cooperation with the Treasury Board of Canada Secretariat and the Receiver General for Canada, the Public Accounts of Canada;
- Developing tax and tariff policy and legislation;
- Managing federal borrowing on financial markets;
- Designing and administering major transfers of federal funds to the provinces and territories;
- Developing financial sector policy and legislation; and,
- Representing Canada in various international financial institutions and organizations.
The Minister of Finance is accountable for ensuring that his responsibilities are fulfilled both within his portfolio and with respect to the authorities assigned through legislation. The Minister has direct responsibility for a number of acts and is assigned specific responsibilities in other acts that are under the responsibility of other ministers.
The description of the program activities for the Department of Finance Canada (the ‘Department’) can be found in Part II of the Main Estimates [PDF 1.71 MB] and the Report on Plans and Priorities.
This quarterly report has been prepared by management using an expenditure basis of accounting. The accompanying Statement of Authorities includes the Department’s spending authorities granted by Parliament and those used by the Department, consistent with the Main Estimates and Supplementary Estimates for both fiscal years as well as transfers from Treasury Board central votes that are approved by the end of the quarter. This quarterly financial report has been prepared using a special purpose financial reporting framework designed to meet financial information needs with respect to the use of spending authorities.
The authority of Parliament is required before monies can be spent by the Government. Approvals are given in the form of annually approved limits through appropriation acts or through legislation in the form of statutory spending authority for specific purposes.
As part of the Parliamentary business of supply, the Main Estimates must be tabled in Parliament on or before March 1 preceding the new fiscal year. Budget 2012 was tabled in Parliament on March 29, after the tabling of the Main Estimates on February 28, 2012. As a result the measures announced in Budget 2012 could not be reflected in the 2012–13 Main Estimates. Similarly, measures announced in Budget 2013 (March 21, 2013) could not be reflected in the 2013–14 Main Estimates.
In fiscal year 2012–2013, frozen allotments were established by Treasury Board authority in departmental votes to prohibit the spending of funds already identified as savings measures in Budget 2012. In 2013–2014, frozen allotments were not required as the changes to departmental authorities were reflected in the 2013–2014 Main Estimates tabled in Parliament.
The Department uses the full accrual method of accounting to prepare and present its annual departmental financial statements that are part of the departmental performance reporting process. However, the spending authorities voted by Parliament remain on an expenditure basis.
The Department has three major categories of expenditure authority. These categories are:
- Voted budgetary authorities: included in this category are the operational expenditures of the Department itself as well as authorized expenditures under grants and contribution programs. These expenditures must be specifically approved by Parliament through an appropriation act.
- Statutory budgetary authorities: included in this category are expenditure authorities that are granted through an existing Act of Parliament. Further parliamentary approval is not required for expenditures related to statutory amounts and it is within the normal course of business that statutory expenditures may in some cases exceed planned spending estimates. Departmental statutory payments include those made under the Federal-Provincial Fiscal Arrangements Act as well as interest incurred in connection with the public debt of Canada.
- Non-budgetary authorities: included in this category are disbursements made by the Department which do not have a direct budgetary impact to the Government. This includes the value of loans initially disbursed to Crown Corporations participating in the Crown Borrowing Framework.
This Departmental Quarterly Financial Report (QFR) reflects the results of the current fiscal period in relation to the Main Estimates and Supplementary Estimates A of 2012–13.
Sections 2.1 and 2.2 below highlight the significant items that contributed to the increase in the resources available for use from 2012–13 to 2013–14 and the increase in actual expenditures as at September 30, 2012 and September 30, 2013.
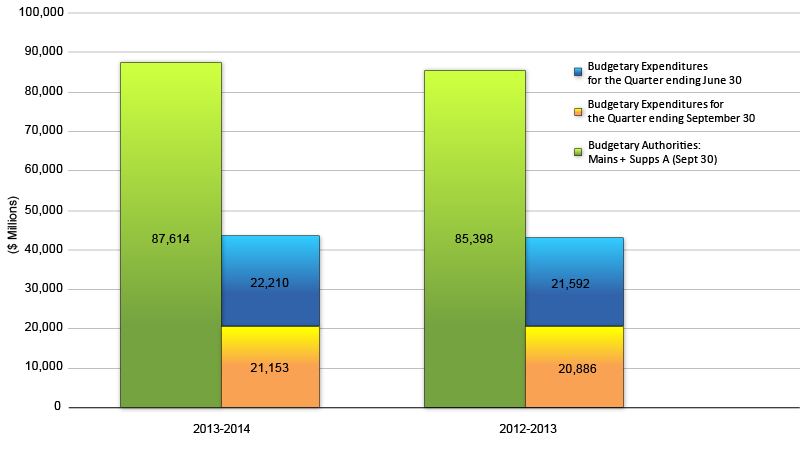
The following graph provides a comparison of budgetary authorities available for spending for the full fiscal year and budgetary expenditures for the first six months of 2012–13 and 2013–14.
Total authorities
The following table provides a comparison of cumulative authorities by vote for the current and previous fiscal years.
Comparison of Authorities Available for Spending for the Year as at September 30 of Fiscal Years 2012–13 and 2013–14
| Variance | ||||
|---|---|---|---|---|
|
|
||||
| Authorities Available (in millions) | 2013–14 | 2012–13 | $ | % |
| Budgetary | ||||
| Voted: | ||||
| Vote 1 - Operating Expenditures | 111.2 | 114.6 | (3.4) | -3.0% |
| Vote 5 - Grants and Contributions | 7.2 | 215.0 | (207.8) | -96.7% |
| Statutory: | ||||
| Federal-Provincial Fiscal Arrangements Act payments | 60,368.7 | 56,148.7 | 4,220.0 | 7.5% |
| Interest on Unmatured Debt and Interest on Other Liabilities | 27,134.0 | 28,862.0 | (1,728.0) | -6.0% |
| Other | (7.1) | 58.1 | (65.2) | -112.2% |
| Total statutory | 87,495.6 | 85,068.8 | 2,426.8 | 2.9% |
| Total Budgetary authorities | 87,614.0 | 85,398.4 | 2,215.6 | 2.6% |
| Non-Budgetary | - | 20.6 | (20.6) | -100.0% |
| Total authorities | 87,614.0 | 85,419.0 | 2,195.0 | 2.6% |
Authorities available for spending in fiscal year 2013–14 are $87,614.0 million at the end of the second quarter as compared to $85,419.0 million at the end of the second quarter of 2012–13, representing an increase of $2,195.0 million, or 2.6%.
Voted budgetary authorities
Total 2013–14 Vote 1 operating authorities available for use as at September 30, 2013 are $111.2 million as compared to $114.6 million at the same period in 2012–13, representing a decrease of $3.4 million which is mainly attributable to the net effect of the following factors:
- A decrease of $6.0 million for government advertising programs related to the Economic Action Plan;
- A decrease of $4.4 million in time-limited funding related to maintaining the strength of Canada’s financial sector, GST technical issues, G-20 framework working group, corporate finance and asset management, and personal income tax initiatives;
- A decrease of $4.2 million which reflects the saving identified as part of Budget 2012 Spending Review (see section 5. Budget 2012 Implementation);
- An increase of $10.0 million for the department’s relocation to 90 Elgin Street in 2014–15;
- An increase of $1.2 million in collective bargaining adjustments.
At the end of the second quarter in 2013–14, Vote 5 authorities available are $7.2 million compared to $215.0 million at the end of the second quarter of 2012–13, representing a decrease of $207.8 million. This decrease is largely due to the cessation of payments to Export Development Canada for debt relief via the Paris Club ($210.0 million) and an increase of $2.2 million related to the interim funding for the Canadian Securities Regulation Regime Transition Office (CSTO).
Statutory budgetary authorities
Statutory Authorities available for spending in fiscal year 2013–14 are $87,495.6 million at the end of the second quarter as compared to $85,068.8 million at the end of the same quarter of 2012–13, representing an increase of $2,426.8 million, or 2.9 %.
This increase of $2,426.8 million relates to 3 broad categories; increases of $4,220.0 million in payments pursuant to the Federal-Provincial Fiscal Arrangements Act, offset by decreases in Interest on Unmatured Debt and Interest on Other Liabilities ($1,302.0 million and $426.0 million respectively) and a decrease of $65.2 million in other statutory payments. Additional details are provided below.
Authorities for payments pursuant to the Federal Provincial Fiscal Arrangements Act payments as at September 30, 2013 are $60,368.7 million compared to $56,148.7 at the same period in 2012–13. The increase of $4,220.0 million is mainly due to the net effect of the following factors:
- Canada Health Transfer - increase of $1,714.1 million reflects the 6% annual increased funding commitment in the September 2004 10-Year Plan to Strengthen Health Care;
- Payments to Provinces Regarding Sales Tax Harmonization - The payment of $1,481.0 million in assistance provided for under the Comprehensive Integrated Tax Coordination Agreements with Québec and Prince Edward Island ($1,467.0 million and $14 million respectively);
- Fiscal Equalization - increase of $682.7 million reflects the increase due to the 4.4% Gross Domestic Product-based escalator applied to the 2012–13 level;
- Canada Social Transfer - increase of $355.8 million represents the annual 3% increase announced in Budget 2007;
- Territorial Financing - increase of $177.6 million is a result of new and updated data entering the formula for Territorial Formula Financing;
- Alternative Payments for Standing Programs – decrease of $111 million which is forecasted based on projected personal income tax;
- Additional Fiscal Equalization to Nova Scotia - decrease of $80.0 million due to higher growth of combined Equalization and 2005 Offshore Accord payments in the new formula compared to the formula which was in place prior to 2007;
Authorities for the Interest on Unmatured Debt and Interest on Other Liabilities as at September 30, 2013 are $27,134.0 million compared to $28,862.0 at the same period in 2012–13. The decrease of $1,728.0 million is mainly due to following factors:
- Interest on Unmatured Debt - decrease of $1,302.0 million to reflect the decrease in the average forecast of interest rates by private sector economists for 2013–14, consistent with the 2012 Update of Economic and Fiscal Projections;
- Interest on Other Liabilities - decrease of $426.0 million to reflect the decrease in the average long-term bond rate forecast for 2013–14, which is used to calculate interest on the public sector pension obligations pertaining to service before April 1, 2000.
Other Statutory Authorities at the end of the second quarter of fiscal year 2013–14 are ($7.1 million) as compared to $58.1 million at the same period in 2012–13, representing a decrease of $65.2 million. This decrease is primarily due to the net effect of the following factors:
- Additional Fiscal Equalization Offset Payment to Nova Scotia - decrease of $56.6 million is due to the decline in offshore revenues received by Nova Scotia;
- Youth Allowance Recovery – decrease of $24.1 million which is forecast based on personal income tax data;
- Agriculture Advance Market Commitment – increase of $10 million relates to a payment to the World Bank for an innovative financing mechanism;
- Purchase of domestic coinage - increase of $6.5 million reflects the savings identified as part of the Budget 2012 Spending Review offset by increased net redemption and administration costs estimates due to an accelerated profile of penny redemption rates. In addition, there are increased cost estimates for demand and metal prices reflective of recent growth projections for overall coinage.
Non-Budgetary Authorities
Non-budgetary authorities related to the value of loans disbursed to Crown Corporations participating in the Crown Borrowing Framework are not reflected in the Estimates. The gross borrowing requirements for Crown Corporations are driven by the need to match the term and structure of the borrowing requirements of corporations’ clients. These activities are influenced by current, and expectations of future, economic conditions and can vary greatly over a short period of time. For example, if clients of the Crown Corporation are seeking short-term, floating rate loans, the Crown Corporation will seek to match that with short-term borrowings from the government. This will result in the loan being refinanced several times through the year, with higher gross borrowings associated with a smaller net borrowing amount. This can change very quickly should market conditions suggest interest rates are going to rise and their clients seek to lock in their borrowing costs through longer term borrowings. As such, there can be very large and significant variances both inter-year and intra-year. Given the risk of forecast inaccuracy and that the gross advances to Crown Corporations are a non-budgetary item and do not impact on the net-debt of the government, the Department only reports on actual borrowings by the Crown Corporations.
There is a decrease of $20.6M in the authorities for the statutory vote Payments to International Bank for Reconstruction and Development from 2012–13 to 2013–14. No further payments are planned as the full amount was paid over the two year period of 2011-12 and 2012–13.
The following table provides a comparison of cumulative spending by vote for the current and previous fiscal years.
Comparison of Year to Date Expenditures for the Quarter Ended September 30 of Fiscal Years 2012–13 and 2013–14
| Variance | ||||
|---|---|---|---|---|
|
|
||||
| Year to date expenditures (in millions) | 2013–14 | 2012–13 | $ | % |
| Budgetary | ||||
| Voted: | ||||
| Vote 1 - Operating Expenditures | 45.9 | 45.8 | 0.2 | 0.4% |
| Vote 5 - Grants and Contributions | 6.7 | 2.5 | 4.2 | 167.9% |
| Statutory: | ||||
| Federal-Provincial Fiscal Arrangements Act payments | 29,678.7 | 28,888.5 | 790.2 | 2.7% |
| Interest on Unmatured Debt and Interest on Other Liabilities |
13,373.5 | 13,256.6 | 117.0 | 0.9% |
| Other | 257.5 | 284.4 | (26.9) | -9.5% |
| Sub Total Statutory | 43,309.7 | 42,429.4 | 880.2 | 2.1% |
| Total Budgetary expenditures | 43,362.3 | 42,477.7 | 884.6 | 2.1% |
| Non-Budgetary | 36,438.9 | 32,721.7 | 3,717.2 | 11.4% |
| Total year to date expenditures | 79,801.2 | 75,199.4 | 4,601.8 | 6.1% |
At the end of the second quarter of the 2013–14 fiscal year, total expenditures were $79,801.2 million compared to $75,199.4 million reported in the same period of 2012–13, representing an increase of $4,601.8 million or 6.1%.
Voted budgetary expenditures
Total 2013–14 Vote 1 operating expenditures at the end of the second quarter were $45.94 million as compared to $45.76 million at the same period of fiscal year 2012–13, representing an increase of $0.2 million or 0.4%.
Total 2013–14 Vote 5 grants and contribution expenditures at the end of the second quarter were $6.7 million as compared to $2.5 million at the same period of fiscal year 2012–13, representing an increase of $4.2 million. This increase is attributable to interim funding of $4.2 million to the Canadian Securities Regulation Regime Transition Office (CSTO).
Statutory budgetary expenditures
Total statutory expenditures at the end of the second quarter of 2013–14 are $43,309.69 million as compared to $42,429.45 at the end of the second quarter of 2012–13 representing an increase of $880.2 million, or 2.1%.
This increase is primarily attributable to an increase in transfer payments pursuant to the Federal-Provincial Fiscal Arrangements Act ($790.2 million), a net increase of $117.0 million in Interest on Unmatured Debt and Interest on Other Liabilities (increase of $347.45 million and decrease of $230.47 million respectively) and a decrease of $26.9 million in other statutory payments.
Expenditures for payments pursuant to the Federal Provincial Fiscal Arrangements Act as at September 30, 2013 are $29,678.7 million compared to $28,888.5 million at the same period in 2012–13 representing an increase of $790.2 million. This increase is mainly due to the net effect of the following factors:
- Canada Health Transfer - increases of $857.1 million;
- Fiscal Equalization – increase of $341.3 million;
- Canada Social Transfer – increase of $177.9 million,
- Territorial Financing – increase of $105.1 million;
- Payments to Provinces Regarding Sales Tax Harmonization – increase of $14.0 million;
- Incentives for Provinces to Eliminate Taxes on Capital – increase of $1.4 million;
- Additional Fiscal Equalization Payment – Total Transfer Protection - decrease of $623.9 million;
- Alternative Payments for Standing Programs – decrease of $82.8 million.
Explanations for all but two of the items listed above are consistent with the explanations found under the statutory budgetary authorities in Section 2.1. The increase of $1.4 million in the incentive for provinces to eliminate taxes on capital relates to a payment in 2013–14 that represent a final adjustment to a preliminary payment that has already been paid to a province. The decrease of $623.9 million in 2013–14 in Additional Fiscal Equalization Payment – Total Transfer Protection relates to payments to New Brunswick and Manitoba to prevent by-province declines in major transfers.
Expenditures for the Interest on Unmatured Debt and Interest on Other Liabilities as at September 30, 2013 are $13,373.5 million compared to $13,256.6 million at the same period in 2012–13 representing an increase of $117.0 million. The increase is mainly due to the net effect of the following factors:
- Interest on Unmatured Debt – increase of $347.45 million to reflect higher Consumer Price index adjustments on real return bonds.
- Interest on Other Liabilities – decrease of $230.45 million to reflect a decrease in the average long term bond rate, which is used to calculate interest on the public sector pensions obligations pertaining to service pre-April 1, 2000.
Other Statutory payments at the end of the second quarter of fiscal year 2013–14 are $257.5 million as compared to $284.4 million at the same period in 2012–13, representing a decrease of $26.9 million. This decrease is primarily due to the net effect of the following factors:
- Youth Allowance Recovery – increase in recoveries of $16.8 million which is forecast based on personal income tax data;
- Losses of foreign exchange – decrease of $15.2 million due to the revaluation of foreign denominated liabilities;
- Purchase of Domestic Coinage – increase of $3.0 million is attributable to normal variations in the demand for coinage from businesses and consumers and in the timing of costs incurred for coinage procurement throughout the year;
- Payment of Liabilities Previously Recorded as Revenue – increase of $2.7 million is largely attributable to Receiver General cheques that have been cashed by the payee subsequent to having been written off. Receiver General cheques are written off if they remain uncashed and issued after a period of 10 years.
Non-budgetary expenditures
Non-budgetary expenditures at the end of the second quarter of 2013–14 are $36,438.9 million compared to $32,721.7 million at the end of the same quarter in the prior year representing an increase of $3,717.2 million. This increase is in part due to an increase of $3,618.8 million related to the value of loans disbursed to Crown Corporations participating in the Crown Borrowing Framework. Gross borrowings by Crown Corporations are based on demand and the business requirements of the participating entities, and also depend on the terms of the Crown Corporation borrowings. As such, amounts can vary significantly from year to year. The increase is also explained by an increase of $97.4 million in payments to the International Monetary Fund New Arrangement to Borrow and an increase of $1.0 million in advances pursuant to section 13(1) of the Financial Consumer Agency of Canada Act.
Significant Changes on the Departmental budgetary expenditures by Standard Object table
Table 2, located at the end of this report, presents Budgetary Expenditures by Standard Object (SO). The main variance in expenditures between 2013–14 and 2012–13 by standard object are as follows:
- Transfer Payments (SO 10) – increase of $797.3 million of which the majority is related to the statutory expenditures pursuant to the Federal-Provincial Fiscal Arrangements Act;
- Public Debt Charges (SO 11) – increase of $117.0 million;
- Utilities, materials and supplies (SO 07) – increase of $2.9 million mostly attributable to increases in purchase of domestic coinage;
- Other subsidies and payments (SO 12) – decrease of $32.4 million primarily due to losses on foreign exchange.
The year over year variances are explained in detail in the preceding Section 2.2.
Quarterly Spending
Expenditures in the second quarter of fiscal 2013–14 were $40,845.7 million compared with $36,951.5 million for the second quarter of 2012–13, representing an increase of $3,894.2 million or 10.5% in quarterly spending.
Comparison of Quarterly Expenditures for the Second Quarter Ended September 30 of Fiscal Years 2012–13 and 2013–14
| Variance | ||||
|---|---|---|---|---|
|
|
||||
| Expenditures for the Second Quarter (in millions) |
2013–14 | 2012–13 | $ | % |
| Budgetary | ||||
| Voted: | ||||
| Vote 1 - Operating Expenditures | 24.6 | 22.2 | 2.5 | 11.1% |
| Vote 5 - Grants and Contributions | 4.7 | 0.5 | 4.2 | 842.0% |
| Statutory: | ||||
| Federal-Provincial Fiscal Arrangements Act payments | 14,558.4 | 14,497.9 | 60.5 | 0.4% |
| Interest on Unmatured Debt and Interest on Other Liabilities |
6,459.4 | 6,218.3 | 241.1 | 3.9% |
| Other | 105.6 | 146.8 | (41.2) | -28.1% |
| Sub Total Statutory | 21,123.4 | 20,863.0 | 260.4 | 1.2% |
| Total Budgetary expenditures | 21,152.7 | 20,885.6 | 267.1 | 1.3% |
| Non-Budgetary | 19,693.0 | 16,065.8 | 3,627.1 | 22.6% |
| Total year to date expenditures | 40,845.7 | 36,951.5 | 3,894.2 | 10.5% |
Variance explanations of the quarterly spending are in line with the year to date variance explanations provided in Section 2.2.
Private sector economists expect moderate growth in the Canadian economy, as growth in domestic demand is expected to be moderated by a fragile global recovery and the related near- to medium-term risks. In particular, uncertainty stems from ongoing concerns about the U.S. federal government's fiscal position, although the U.S. economy is showing signs of improvement, as well as the ongoing banking and sovereign debt sustainability issues in Europe. In addition, any potential slowdown in the major emerging market economies could affect the Canadian economy owing to weaker commodity prices and exports and slower global growth. Domestically, the key risk continues to be elevated household debt.
The Department of Finance Canada remains committed to ensuring a strong economy and sound public finances for Canadians. In meeting this commitment, the Department is exposed to a broad range of risks. Effective risk management is therefore critical to its ability to deliver results for Canadians, and the Department has put in place mechanisms to systematically identify and manage its corporate risks, notably policy, people and relationships, infrastructure and process risks.
In particular, the Department will continue to manage the economic volatility risks by ensuring it has in place the infrastructure, resources and authorities needed to respond to an evolving economic and financial sector environment. The Department will also manage the increased requirement for coordinated international decision making, to deal with uncertain world economic conditions and to support the soundness of the global financial system. At the same time, the Department will continue to ensure that responsible financial sector agencies take effective coordinated action to support the soundness, integrity and reputation of the Canadian financial system.
While implementing the 2012 expenditure review measures, the Department also recognizes that as a knowledge-based organization, its continued success depends on attracting, developing and retaining a highly skilled and adaptable workforce. The Department will continue to focus on strategic recruitment, cost-effective training and development initiatives, performance management and staff retention as a successful way of achieving desired outcomes.
The Department continues to work closely with Shared Services Canada to standardize and consolidate end user device hardware and software.
This section provides an overview of the savings measures announced in Budget 2012 that will be implemented in order to refocus government and programs; make it easier for Canadians and business to deal with their government; and, modernize and reduce the back office.
The Department of Finance will achieve Budget 2012 savings of $32.4 million by fiscal year 2014–15 by reconfiguring and modernizing the Department’s internal services and policy analysis functions. It is also taking further significant steps to reduce coinage costs including, for example, measures such as changing the metal composition of $1 and $2 coins from metal alloys to plated steel cores and eliminating the penny.
All savings measures are on track to meet their planned savings. Staff reductions were fully completed in 2012–13.
The statutory forecast for the Purchase of Domestic Coinage includes the savings identified as part of the Budget 2012 Spending Review.
Approved by:
Michael Horgan
Deputy Minister
Sherry Harrison
Chief Financial Officer
Ottawa, Canada
November 20, 2013
Department of Finance Canada Quarterly Financial Report
For the quarter ended September 30, 2013
Table 1 - Statement of Authorities (unaudited)
(in thousands of dollars)
| Fiscal year 2013-2014 | Fiscal year 2012-2013 | |||||
|---|---|---|---|---|---|---|
|
|
|
|||||
| Total available for use for the year ending March 31, 2014* |
Used during the quarter ended September 30, 2013 |
Year to date used at quarter-end |
Total available for use for the year ending March 31, 2013* ** |
Used during |
Year to date used at quarter-end |
|
| Budgetary Authorities | ||||||
| Voted authorities | ||||||
| Operating expenditures | 111,169 | 24,632 | 45,937 | 114,591 | 22,178 | 45,759 |
| Grants and contributions | 7,235 | 4,710 | 6,710 | 215,000 | 500 | 2,505 |
|
|
|
|||||
| Total voted authorities | 118,404 | 29,342 | 52,647 | 329,591 | 22,678 | 48,264 |
|
|
|
|||||
| Statutory authorities | ||||||
| Federal-Provincial Fiscal Arrangements Act payments |
||||||
| Fiscal Equalization (Part I — Federal-Provincial Fiscal Arrangements Act) |
16,105,194 | 4,026,298 | 8,052,597 | 15,422,503 | 3,855,625 | 7,711,251 |
| Canada Health Transfer (Part V.1 — Federal-Provincial Fiscal Arrangements Act) |
30,283,114 | 7,570,778 | 15,141,557 | 28,568,975 | 7,142,243 | 14,284,487 |
| Canada Social Transfer (Part V.1 — Federal-Provincial Fiscal Arrangements Act) |
12,215,271 | 3,053,818 | 6,107,636 | 11,859,486 | 2,964,871 | 5,929,743 |
| Territorial Financing (Part I.1 — Federal-Provincial Fiscal Arrangement Act) |
3,288,282 | 670,810 | 1,946,663 | 3,110,680 | 634,579 | 1,841,523 |
| Wait Times Reduction Transfer (Part V.1 — Federal-Provincial Fiscal Arrangements Act) |
250,000 | 62,500 | 125,000 | 250,000 | 62,500 | 125,000 |
| Alternative Payments for Standing Programs (Part VI — Federal-Provincial Fiscal Arrangements Act) |
(3,499,933) | (882,990) | (1,765,980) | (3,388,677) | (841,603) | (1,683,207) |
| Payments to Provinces Regarding Sales Tax Harmonization (Part III.1 — Federal-Provincial Fiscal Arrangements Act) |
1,481,000 | - | 14,000 | - | - | - |
Incentive for Provinces to Eliminate |
- | 1,405 | 1,405 | 15 | 15 | |
| Additional Fiscal Equalization Payment - Total Transfer Protection (Part 1 — Federal-Provincial Fiscal Arrangements Act) |
- | 55,806 | 55,806 | 679,660 | 679,660 | |
| Additional Fiscal Equalization to Nova Scotia (Part I — Federal-Provincial Fiscal Arrangements Act) |
245,785 | - | - | 325,779 | - | - |
|
|
|
|||||
| Total Federal-Provincial Fiscal Arrangements Act payments |
60,368,713 | 14,558,425 | 29,678,684 | 56,148,746 | 14,497,890 | 28,888,472 |
| Interest on Unmatured Debt and Interest on Other Liabilities |
||||||
| Interest on Unmatured Debt and Other Public Debt Costs |
18,401,000 | 4,307,483 | 9,054,759 | 19,703,000 | 3,947,106 | 8,707,314 |
| Interest on Other Liabilities | 8,733,000 | 2,151,896 | 4,318,786 | 9,159,000 | 2,271,170 | 4,549,253 |
|
|
|
|||||
| Total Interest on Unmatured Debt and Interest on Other Liabilities |
27,134,000 | 6,459,379 | 13,373,545 | 28,862,000 | 6,218,276 | 13,256,567 |
| Other | ||||||
| Addtional Fiscal Equalization Offset Payment to Nova Scotia (Nova Scotia and Newfoundland and Labrador Additional Fiscal Equalization Offset Payments Act) |
89,461 | - | - | 146,059 | - | - |
| Youth Allowances Recovery (Federal-Provincial Fiscal Revision Act, 1964) |
(770,280) | - | (388,371) | (746,180) | - | (371,616) |
| Canadian Millenium Scholarship Foundation (Budget Implementation Act, 1998) |
- | - | (11) | - | - | - |
| Payments to International Development Association |
441,610 | - | 441,610 | 441,620 | - | 441,620 |
| Debt payments on behalf of poor countries to International Organizations pursuant to section 18(1) of the Economic Recovery Act |
51,200 | - | - | 51,200 | - | - |
| Purchase of Domestic Coinage | 126,500 | 31,371 | 59,281 | 120,000 | 27,228 | 56,265 |
| Statutory Subsidies (Constitution Acts, 1867-1982, and Other Statutory Authorities) |
32,149 | 14,837 | 16,075 | 32,149 | 14,837 | 16,212 |
| Contributions to Employee Benefit Plans | 12,204 | 3,051 | 6,102 | 13,143 | 3,285 | 6,571 |
| Minister of Finance - Salary and motor car allowance |
79 | 19 | 38 | 78 | 20 | 39 |
| Minister of State – Motor car allowance | 2 | 1 | 2 | - | - | 1 |
| Payment to the International Bank for Reconstruction and Development for the Agriculture Advance Market Commitment (Bretton Woods and Related Agreements Act, section 8) |
10,000 | - | - | - | - | - |
| Losses on Foreign Exchange | - | 53,355 | 119,212 | - | 100,957 | 134,445 |
| Payment of Liabilities Previously Recorded as Revenue |
- | 2,939 | 3,527 | - | 466 | 871 |
|
|
|
|||||
| Total Other | (7,075) | 105,573 | 257,465 | 58,069 | 146,793 | 284,408 |
|
|
|
|||||
| Total statutory authorities | 87,495,638 | 21,123,377 | 43,309,694 | 85,068,815 | 20,862,959 | 42,429,447 |
|
|
|
|||||
| Total budgetary authorities | 87,614,042 | 21,152,719 | 43,362,341 | 85,398,406 | 20,885,637 | 42,477,711 |
|
|
|
|||||
| Non-budgetary authorities | ||||||
| Advances to Crown corporations (Gross) | - | 19,591,572 | 36,335,504 | - | 16,062,835 | 32,716,713 |
| Advances pursuant to section 13(1) of the Financial Consumer Agency of Canada Act (Gross) |
- | 4,000 | 6,000 | - | 3,000 | 5,000 |
| Payments to the International Monetary Fund New Arrangements to Borrow |
- | 97,387 | 97,387 | - | - | - |
| Payment to International Bank for Reconstruction and Development |
- | - | - | 20,611 | - | - |
|
|
|
|||||
| Total non-budgetary authorities | - | 19,692,959 | 36,438,891 | 20,611 | 16,065,835 | 32,721,713 |
|
|
|
|||||
| Total authorities | 87,614,042 | 40,845,678 | 79,801,232 | 85,419,017 | 36,951,472 | 75,199,424 |
| * Includes only Authorities available for use and granted by Parliament at quarter-end. ** Total available for use does not reflect measures announced in Budget 2012. |
||||||
Department of Finance Canada
Quarterly Financial Report
For the quarter ended September 30, 2013
Table 2 - Departmental budgetary expenditures by Standard Object (unaudited)
(in thousands of dollars)
| Fiscal year 2013-2014 | Fiscal year 2012-2013 | |||||
|---|---|---|---|---|---|---|
|
|
|
|||||
| Planned expenditures for the year ending March 31, 2014 |
Expended during the quarter ended September 30, 2013 |
Year to date used at quarter-end | Planned expenditures for the year ending March 31, 2013 * |
Expended during the quarter ended September 30, 2012 |
Year to date used at quarter-end |
|
| Expenditures: | ||||||
| Personnel | 82,420 | 21,299 | 42,757 | 87,898 | 19,183 | 42,856 |
| Transportation and communications | 4,000 | 693 | 1,206 | 4,500 | 332 | 893 |
| Information | 11,300 | 1,196 | 2,123 | 17,100 | 2,245 | 2,484 |
| Professional and special services | 15,400 | 3,690 | 4,283 | 14,800 | 3,674 | 4,836 |
| Rentals | 400 | 127 | 651 | 500 | 225 | 712 |
| Repair and maintenance | 500 | 655 | 667 | 500 | 8 | 11 |
| Utilities, materials and supplies | 127,500 | 31,474 | 59,461 | 120,900 | 27,346 | 56,599 |
| Acquisition of machinery and equipment | 8,834 | 57 | 101 | 2,013 | 95 | 144 |
| Transfer payments | 60,230,088 | 14,535,402 | 29,774,533 | 56,288,595 | 14,486,338 | 28,977,193 |
| Public debt charges | 27,134,000 | 6,459,379 | 13,373,545 | 28,862,000 | 6,218,276 | 13,256,567 |
| Other subsidies and payments | - | 98,767 | 103,034 | - | 127,939 | 135,470 |
|
|
|
|||||
| Total gross budgetary expenditures | 87,614,442 | 21,152,739 | 43,362,361 | 85,398,806 | 20,885,661 | 42,477,765 |
| Less Revenues netted against expenditures | 400 | 20 | 20 | 400 | 24 | 54 |
|
|
|
|||||
| Total net budgetary expenditures | 87,614,042 | 21,152,719 | 43,362,341 | 85,398,406 | 20,885,637 | 42,477,711 |
| * Planned expenditures do not reflect measures announced in Budget 2012 | ||||||