COVID-19 Recovery Plan – Draft For Discussion

Finance Canada
August 2020

* Title redacted *

* Chart redacted *

Restart & Rebound

Recuperation

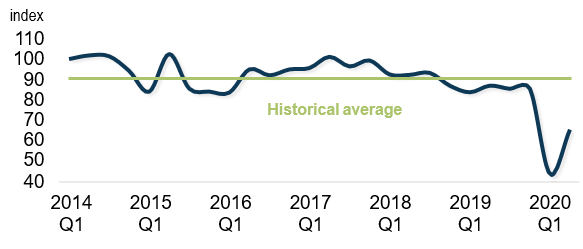
Encouragingly, easing of lockdowns has led to strong initial rebound in economic activity and consumer and business confidence

Visit to Select Destinations (Google Mobility)
per cent change relative to pre-COVID-19 baseline
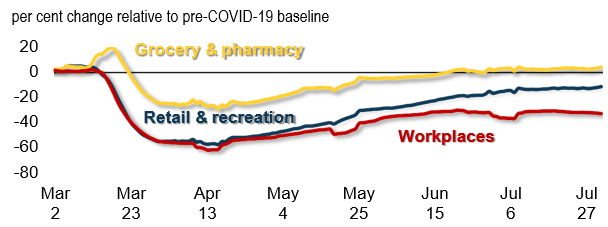
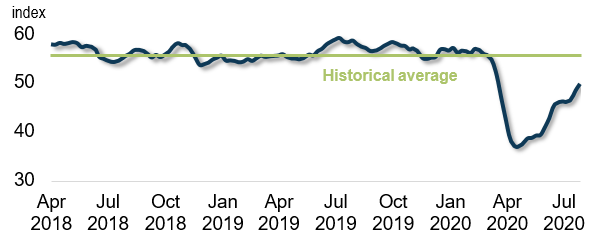
Visit to Select Destinations (Google Mobility)
Text version
7-day moving average
  Retail & recreation Grocery & pharmacy Workplaces
Feb
21
1.9 0.4 -7.7
Feb
22
2.4 0.9 -7.0
Feb
23
2.0 0.6 -6.3
Feb
24
4.1 3.0 1.6
Feb
25
4.6 3.1 2.1
Feb
26
4.1 3.3 2.3
Feb
27
2.1 1.4 1.4
Feb
28
1.7 1.7 1.9
Feb
29
1.6 2.0 2.0
Mar
1
1.6 2.4 2.0
Mar
2
1.6 2.6 1.4
Mar
3
1.9 2.7 1.0
Mar
4
2.9 3.0 0.7
Mar
5
5.0 5.0 1.1
Mar
6
5.3 4.7 1.0
Mar
7
5.1 4.4 0.9
Mar
8
5.0 4.1 0.7
Mar
9
5.1 4.3 1.1
Mar
10
4.4 3.6 1.3
Mar
11
4.1 4.0 1.7
Mar
12
4.1 7.1 2.3
Mar
13
3.3 12.3 1.6
Mar
14
0.9 14.3 0.6
Mar
15
-2.1 14.9 -0.7
Mar
16
-4.4 17.6 -4.9
Mar
17
-8.1 19.3 -10.0
Mar
18
-13.3 19.3 -16.0
Mar
19
-19.4 16.0 -22.4
Mar
20
-25.0 10.3 -28.0
Mar
21
-30.4 5.9 -32.4
Mar
22
-36.0 1.3 -36.7
Mar
23
-40.7 -3.9 -40.1
Mar
24
-43.9 -7.9 -43.0
Mar
25
-46.7 -11.9 -45.7
Mar
26
-49.3 -15.4 -48.0
Mar
27
-50.9 -17.7 -50.0
Mar
28
-52.3 -19.9 -51.7
Mar
29
-53.4 -21.9 -53.0
Mar
30
-54.7 -23.9 -54.3
Mar
31
-55.0 -24.4 -55.0
Apr
1
-54.9 -24.4 -55.3
Apr
2
-54.7 -24.7 -55.6
Apr
3
-54.7 -25.0 -55.7
Apr
4
-54.4 -24.7 -55.9
Apr
5
-55.0 -26.1 -56.1
Apr
6
-54.6 -25.3 -56.1
Apr
7
-54.7 -25.1 -56.3
Apr
8
-54.6 -24.6 -56.3
Apr
9
-53.3 -21.7 -56.4
Apr
10
-55.4 -24.6 -59.4
Apr
11
-55.0 -23.1 -59.7
Apr
12
-56.6 -25.6 -60.4
Apr
13
-57.1 -26.7 -61.7
Apr
14
-56.9 -26.4 -61.6
Apr
15
-56.7 -26.7 -61.4
Apr
16
-57.4 -28.9 -61.1
Apr
17
-55.0 -25.9 -58.0
Apr
18
-55.0 -27.1 -57.0
Apr
19
-53.0 -24.4 -55.7
Apr
20
-51.7 -23.0 -54.1
Apr
21
-51.7 -23.9 -53.9
Apr
22
-51.7 -24.3 -53.6
Apr
23
-51.7 -24.4 -53.3
Apr
24
-51.6 -24.4 -53.0
Apr
25
-51.1 -24.0 -52.9
Apr
26
-50.7 -23.4 -52.7
Apr
27
-50.6 -23.1 -52.4
Apr
28
-50.0 -22.3 -52.3
Apr
29
-49.4 -21.6 -52.1
Apr
30
-49.1 -21.3 -52.0
May
1
-48.4 -20.4 -51.7
May
2
-48.1 -20.0 -51.3
May
3
-47.3 -19.0 -50.4
May
4
-46.9 -18.6 -50.1
May
5
-46.3 -17.7 -49.7
May
6
-45.6 -16.9 -49.3
May
7
-44.9 -16.0 -48.9
May
8
-44.6 -15.3 -48.6
May
9
-43.9 -13.6 -48.0
May
10
-42.9 -12.4 -47.3
May
11
-42.7 -12.4 -47.0
May
12
-42.6 -12.6 -46.6
May
13
-42.1 -12.3 -46.1
May
14
-41.6 -12.1 -45.7
May
15
-41.0 -12.0 -45.6
May
16
-40.4 -12.4 -45.3
May
17
-40.0 -12.3 -45.1
May
18
-41.0 -14.1 -49.0
May
19
-39.6 -12.6 -48.7
May
20
-38.1 -11.1 -48.4
May
21
-37.0 -10.0 -48.1
May
22
-36.0 -9.3 -47.3
May
23
-35.0 -8.6 -46.0
May
24
-33.7 -7.3 -44.9
May
25
-30.6 -4.0 -40.4
May
26
-30.1 -4.4 -40.0
May
27
-29.9 -4.6 -39.6
May
28
-29.6 -4.7 -39.0
May
29
-29.3 -4.7 -38.7
May
30
-29.1 -4.9 -37.7
May
31
-28.9 -4.6 -36.6
Jun
1
-28.4 -4.3 -35.9
Jun
2
-28.3 -4.3 -35.4
Jun
3
-28.4 -4.7 -35.0
Jun
4
-28.0 -4.3 -34.7
Jun
5
-27.6 -4.0 -34.4
Jun
6
-27.1 -4.0 -34.3
Jun
7
-26.6 -3.6 -34.1
Jun
8
-26.3 -3.6 -34.0
Jun
9
-25.9 -3.4 -33.7
Jun
10
-25.1 -3.1 -33.6
Jun
11
-24.6 -3.1 -33.3
Jun
12
-24.0 -3.0 -33.0
Jun
13
-23.4 -2.7 -32.3
Jun
14
-22.9 -2.4 -31.6
Jun
15
-22.4 -2.1 -31.4
Jun
16
-21.6 -1.4 -31.3
Jun
17
-21.1 -1.0 -31.1
Jun
18
-20.6 -0.3 -31.0
Jun
19
-20.0 0.6 -31.0
Jun
20
-19.6 1.4 -30.7
Jun
21
-18.9 2.1 -30.0
Jun
22
-18.6 2.1 -30.1
Jun
23
-18.4 2.6 -30.4
Jun
24
-19.0 1.1 -31.6
Jun
25
-18.4 1.4 -31.6
Jun
26
-18.3 1.0 -31.4
Jun
27
-18.1 0.4 -31.7
Jun
28
-18.1 0.0 -32.0
Jun
29
-17.1 0.7 -32.0
Jun
30
-15.0 2.9 -31.9
Jul
1
-16.6 1.7 -34.4
Jul
2
-16.0 2.3 -35.0
Jul
3
-15.3 3.0 -36.1
Jul
4
-15.0 3.0 -36.1
Jul
5
-14.4 3.3 -36.4
Jul
6
-14.4 3.3 -36.4
Jul
7
-15.9 1.1 -36.6
Jul
8
-12.7 4.1 -32.9
Jul
9
-13.0 3.4 -32.3
Jul
10
-13.4 2.7 -31.3
Jul
11
-13.6 2.6 -31.1
Jul
12
-13.4 2.7 -31.0
Jul
13
-13.6 2.4 -31.0
Jul
14
-13.4 2.3 -30.9
Jul
15
-13.1 2.3 -30.7
Jul
16
-13.1 2.1 -30.7
Jul
17
-12.7 2.6 -30.7
Jul
18
-12.4 3.0 -30.6
Jul
19
-12.9 2.7 -30.9
Jul
20
-12.4 3.3 -31.0
Jul
21
-12.3 3.6 -31.3
Jul
22
-12.6 3.4 -31.6
Jul
23
-12.4 3.6 -31.7
Jul
24
-12.7 3.3 -31.9
Jul
25
-12.7 3.0 -31.9
Jul
26
-12.3 3.1 -31.7
Jul
27
-12.7 2.7 -32.0
Bloomberg Nanos Consumer Confidence
Text version
First Week – Proposed Outreach
  Nanos-Bloomberg Confidence Historical Average
4/6/2018 57.7862 55.70656
4/13/2018 57.7106 55.70656
4/20/2018 58.0741 55.70656
4/27/2018 57.8671 55.70656
5/4/2018 58.0371 55.70656
5/11/2018 58.2312 55.70656
5/18/2018 57.9992 55.70656
5/25/2018 57.2099 55.70656
6/1/2018 57.4687 55.70656
6/8/2018 57.3174 55.70656
6/15/2018 57.0543 55.70656
6/22/2018 55.2832 55.70656
6/29/2018 54.8724 55.70656
7/6/2018 54.4616 55.70656
7/13/2018 54.2113 55.70656
7/20/2018 54.3112 55.70656
7/27/2018 54.7333 55.70656
8/3/2018 55.3972 55.70656
8/10/2018 55.8709 55.70656
8/17/2018 56.5828 55.70656
8/24/2018 56.6591 55.70656
8/31/2018 56.5230 55.70656
9/7/2018 55.9448 55.70656
9/14/2018 55.1267 55.70656
9/21/2018 55.6541 55.70656
9/28/2018 55.1968 55.70656
10/5/2018 55.6860 55.70656
10/12/2018 56.2988 55.70656
10/19/2018 57.4283 55.70656
10/26/2018 58.0133 55.70656
11/2/2018 57.6448 55.70656
11/9/2018 57.5890 55.70656
11/16/2018 56.5849 55.70656
11/23/2018 55.0942 55.70656
11/30/2018 53.6154 55.70656
12/7/2018 53.7547 55.70656
12/14/2018 54.0694 55.70656
12/21/2018 54.7162 55.70656
12/28/2018 55.0893 55.70656
1/4/2019 55.5116 55.70656
1/11/2019 54.4970 55.70656
1/18/2019 54.5349 55.70656
1/25/2019 54.4269 55.70656
2/1/2019 54.1523 55.70656
2/8/2019 54.2947 55.70656
2/15/2019 54.7819 55.70656
2/22/2019 54.4314 55.70656
3/1/2019 54.9592 55.70656
3/8/2019 55.4837 55.70656
3/15/2019 55.2442 55.70656
3/22/2019 55.3591 55.70656
3/29/2019 55.4400 55.70656
4/5/2019 55.5253 55.70656
4/12/2019 55.7807 55.70656
4/19/2019 55.2071 55.70656
4/26/2019 54.9370 55.70656
5/3/2019 54.8867 55.70656
5/10/2019 54.7400 55.70656
5/17/2019 55.1081 55.70656
5/24/2019 55.7057 55.70656
5/31/2019 55.5337 55.70656
6/7/2019 56.3941 55.70656
6/14/2019 56.8997 55.70656
6/21/2019 57.7541 55.70656
6/28/2019 58.3018 55.70656
7/5/2019 58.7526 55.70656
7/12/2019 59.0639 55.70656
7/19/2019 58.3365 55.70656
7/26/2019 58.2265 55.70656
8/2/2019 58.5534 55.70656
Aug
2019
57.8260 55.70656
Aug
2019
57.3163 55.70656
Aug
2019
57.0300 55.70656
Aug
2019
56.4421 55.70656
Sep
2019
56.4730 55.70656
Sep
2019
56.7396 55.70656
Sep
2019
57.3780 55.70656
Sep
2019
57.8394 55.70656
Oct
2019
58.2407 55.70656
Oct
2019
57.9898 55.70656
Oct
2019
57.5397 55.70656
Oct
2019
57.4348 55.70656
Nov
2019
56.7430 55.70656
Nov
2019
57.0065 55.70656
Nov
2019
56.2251 55.70656
Nov
2019
55.0027 55.70656
Nov
2019
54.8379 55.70656
Dec
2019
55.0862 55.70656
Dec
2019
55.2653 55.70656
Dec
2019
56.6866 55.70656
Dec
2019
56.7989 55.70656
Jan
2020
56.5336 55.70656
Jan
2020
57.0627 55.70656
Jan
2020
56.0766 55.70656
Jan
2020
56.5074 55.70656
Jan
2020
56.3784 55.70656
Feb
2020
56.0102 55.70656
Feb
2020
56.8994 55.70656
Feb
2020
56.6173 55.70656
Feb
2020
55.8138 55.70656
Mar
2020
55.4964 55.70656
Mar
2020
54.2871 55.70656
Mar
2020
51.3400 55.70656
Mar
2020
46.9300 55.70656
Apr
2020
42.7000 55.70656
Apr
2020
38.7000 55.70656
Apr
2020
37.2000 55.70656
Apr
2020
37.0800 55.70656
May
2020
37.7300 55.70656
May
2020
38.7300 55.70656
May
2020
38.8600 55.70656
May
2020
39.3200 55.70656
May
2020
39.4600 55.70656
Jun
2020
41.0300 55.70656
Jun
2020
42.8600 55.70656
Jun
2020
45.3600 55.70656
Jun
2020
46.0100 55.70656
Jul
2020
46.2200 55.70656
Jul
2020
46.1100 55.70656
Jul
2020
46.6500 55.70656
Jul
2020
48.4200 55.70656
Jul
2020
49.7800 55.70656


*Chart redacted*


Business Confidence
Bloomberg Nanos Consumer Confidence
Text version

This chart shows quarterly business confidence index from the Conference Board of Canada. From 2014 to 2019 business confidence has ranged between 100 and 80, but generally cenetered on its historical average of 90. It was roughly near its historical average at the end of 2019 before plunging to almost 40 in the first two quarters of 2020. It has since rebounded, but remains depressed, at about 60 as of the third quarter of 2020.

Notes: For the Google mobility tracker, 7-day moving average change from baseline (median value of same weekday during Jan. 3 - Feb. 6, 2020 period). Last data points are July 17, 2020 for mobility, and August 5, 2020 for credit card spending. Sources: Google Community Mobility Reports; Visa, Bloomberg, Conference Board of Canada.

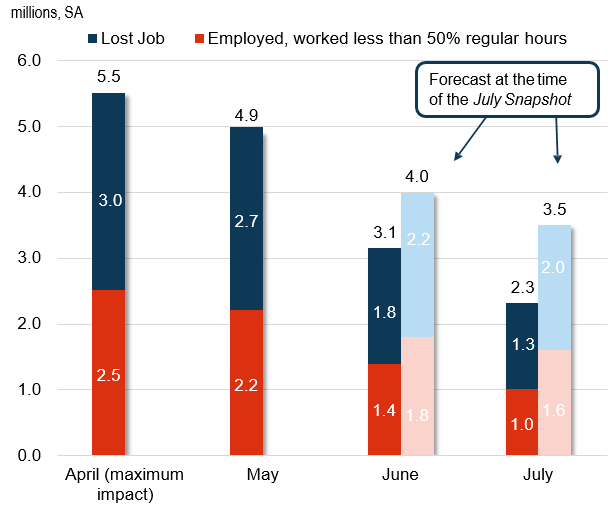
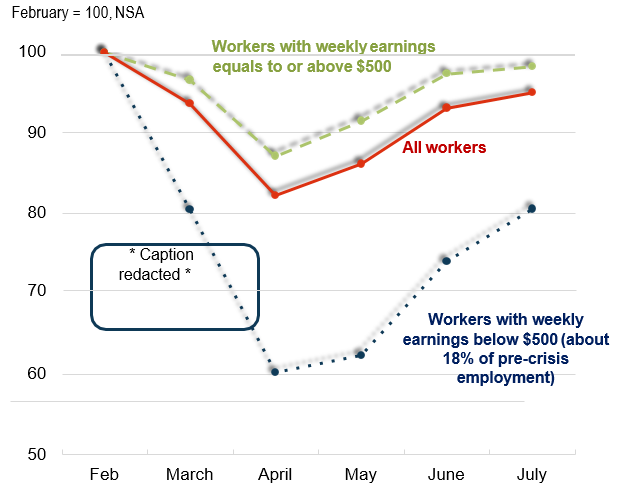
Initial labour market recovery stronger-than-expected – however, 2.3 million workers still affected, especially in lower-wage service sector jobs

Workers Substantially Affected by COVID-19
millions, SA
Workers Substantially Affected by COVID-19

Note: This includes occupations which may not have lost wages, e.g. teachers. Totals may not sum do to rounding.
Source: Statistics Canada Labour Force Survey, June 2020

Text version
First Week – Proposed Outreach
Actual Forecast at the time of the July Snapshot
millions, seasonally adjusted Total Impact Lost Job Employment, worked less than 50% regular hours Total Impact Lost Job Employment, worked less than 50% regular hours
April (maximum impact) 5.5 3.0 2.5
May 4.9 2.7 2.2
June 3.1 1.8 1.4 4.0 2.2 1.8
July 2.3 1.3 1.0 3.5 2.0 1.6


Employment Level by Weekly Earnings (2020)
February = 100, NSA

Employment Level by Weekly Earnings (2020)

Note: Lower-wage workers accounted for about 18% of employment in 2019. While most data reported tend to be seasonally-adjusted, unadjusted figures are important from a CERB-coverage perspective.
Source: Statistics Canada, Department of Finance Calculations.

Text version
First Week – Proposed Outreach
  Weekly earnings below $500 Weekly earning equal to or above $500 All workers
Feb 100 100 100
March 81.3376 97.00949 94.21124
April 60.99 87.21139 82.43292
May 63.0719 89.11566 84.36802
June 75.45403 93.41205 90.13899
July 82.06492 94.41862 92.16701

* Title redacted *

* Sentence redacted *

Canada Emergency Wage Subsidy
Text version

This figure illustrates the key elements of Canada's response to COVID-19. It groups these elements into three areas - safe restart, businesses, workers and Canada Emergency Wage Subsidy. Under safe restart - sub-elements include testing and contact tracing, personal protective equipment, public transit. For businesses, Canada emergency business account, Canada emergency commercial rent assistance and business credit availability program (it notes that the first two expire on August 31). For workers, employment insurance, COVID benefits including Recovery, Caregiver and Sickness. Canada Emergency Wage Subsidy stands alone in the middle of the graphic.

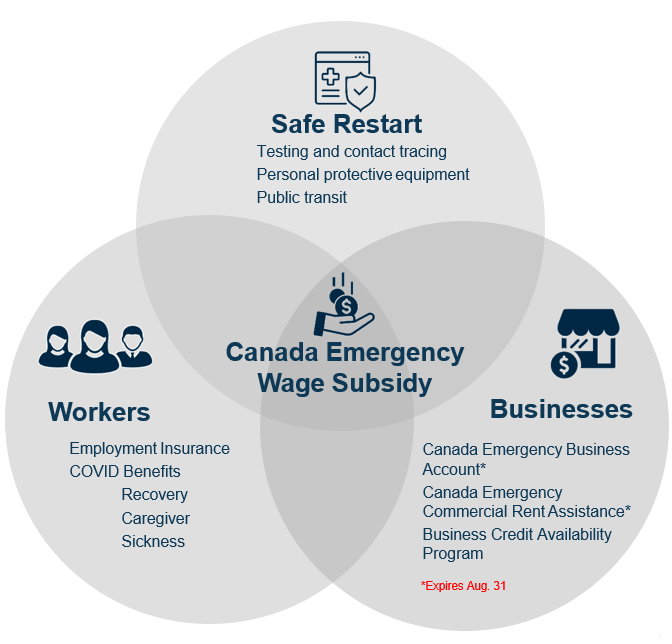
Key elements to a safe restart and building confidence for the resumption of economic activity through the fall

The road to full recovery will vary across sectors - * Part of title redacted *

* Chart redacted *

*Title redacted*

Projected Output Recovery, Selected Sectors (all figures in per cent)
Sector Share of GDP, 2019Q4 Share of Employment, 2019Q4 GDP Decline, Maximum Impact (Feb to April) * Portion of table redacted*
Accommodation and food services 2.3 6.3 -66  
Arts, entertainment and recreation 0.8 2.0 -56  
Transportation and Warehousing 4.5 5.5 -32  
Manufacturing 10.0 9.2 -29  
Retail 5.1 10.7 -28  
Construction 7.2 7.7 -27  
Wholesale 5.2 4.3 -22  

Note: The sub-industries include: Amusement and Recreation Industries; Performing Arts and Spectator Sports and Related Industries; Transit, Ground Passenger, Scenic and Sightseeing, Air Transportation; and Food Services and Drinking Places.
Source: Statistics Canada, Department of Finance calculations

What kind of support is most needed to help businesses pull through the recovery?

*Title redacted*

Total Hours Worked
chart

Note: Last data point is July 2020. Seasonally adjusted total hours includes hours worked at all jobs . Source: Statistics Canada, Department of Finance Calculations.

Text version
First Week – Proposed Outreach
  Total Hours Worked
2008Jan 573.5592
2008Feb 573.5375
2008Mar 570.535
2008Apr 572.4203
2008May 570.8647
2008Jun 572.1228
2008Jul 570.6116
2008Aug 572.0701
2008Sep 574.7911
2008Oct 574.2405
2008Nov 568.919
2008Dec 562.5552
2009Jan 559.6219
2009Feb 556.5282
2009Mar 553.761
2009Apr 550.9971
2009May 548.8089
2009Jun 550.0072
2009Jul 552.0171
2009Aug 548.2014
2009Sep 555.1411
2009Oct 554.1994
2009Nov 554.3464
2009Dec 558.0741
2010Jan 560.3106
2010Feb 564.1432
2010Mar 558.3028
2010Apr 564.3543
2010May 566.2099
2010Jun 565.2444
2010Jul 563.1269
2010Aug 563.7893
2010Sep 563.7377
2010Oct 566.8469
2010Nov 571.6981
2010Dec 568.8934
2011Jan 568.6755
2011Feb 567.8054
2011Mar 571.7833
2011Apr 571.3718
2011May 572.6994
2011Jun 571.4499
2011Jul 575.713
2011Aug 579.4962
2011Sep 575.9732
2011Oct 575.8916
2011Nov 577.7176
2011Dec 577.8636
2012Jan 577.3499
2012Feb 577.5844
2012Mar 580.1191
2012Apr 581.7781
2012May 582.1008
2012Jun 586.4551
2012Jul 584.6425
2012Aug 583.4503
2012Sep 585.5137
2012Oct 584.0785
2012Nov 584.8464
2012Dec 585.8828
2013Jan 586.466
2013Feb 588.8912
2013Mar 587.545
2013Apr 589.7799
2013May 589.2712
2013Jun 587.9618
2013Jul 589.9631
2013Aug 589.1935
2013Sep 589.9901
2013Oct 593.0933
2013Nov 591.6671
2013Dec 590.5546
2014Jan 591.6193
2014Feb 593.3307
2014Mar 593.0834
2014Apr 591.1336
2014May 589.9661
2014Jun 587.6045
2014Jul 591.5369
2014Aug 589.7418
2014Sep 591.9474
2014Oct 594.652
2014Nov 590.5851
2014Dec 593.954
2015Jan 594.4969
2015Feb 594.4477
2015Mar 592.8803
2015Apr 594.9497
2015May 596.8061
2015Jun 600.826
2015Jul 597.1436
2015Aug 602.3108
2015Sep 597.6613
2015Oct 598.9091
2015Nov 598.1234
2015Dec 599.6519
2016Jan 602.4468
2016Feb 600.7481
2016Mar 599.4489
2016Apr 599.2766
2016May 601.2019
2016Jun 599.5735
2016Jul 598.9734
2016Aug 597.6826
2016Sep 599.1031
2016Oct 598.4543
2016Nov 605.2938
2016Dec 598.1943
2017Jan 599.1218
2017Feb 600.3773
2017Mar 604.8368
2017Apr 606.5676
2017May 606.3375
2017Jun 608.455
2017Jul 611.5497
2017Aug 610.4212
2017Sep 614.7156
2017Oct 614.9773
2017Nov 609.2903
2017Dec 617.6412
2018Jan 615.6085
2018Feb 620.3259
2018Mar 617.7155
2018Apr 616.7303
2018May 618.4929
2018Jun 616.0274
2018Jul 620.3764
2018Aug 619.7802
2018Sep 618.1621
2018Oct 618.4476
2018Nov 624.1049
2018Dec 623.1426
2019Jan 621.884
2019Feb 618.4246
2019Mar 624.1115
2019Apr 625.9922
2019May 624.2401
2019Jun 627.8733
2019Jul 624.2018
2019Aug 627.8258
2019Sep 626.0771
2019Oct 626.6667
2019Nov 625.5568
2019Dec 625.4579
2020Jan 624.9264
2020Feb 632.3657
2020Mar 536.7101
2020Apr 456.9838
2020May 485.9512
2020Jun 533.4618
2020Jul 561.7059
Total Investment Intentions, Annual Growth
chart

Note: Last data point of actual data is 2019. Private and public investment. Source: Statistics Canada, Department of Finance Calculations.

Text version
First Week – Proposed Outreach
  February release August Update
2014 6.3  
2015 -7.6  
2016 -8.5  
2017 4.3  
2018 9.8  
2019 1.7  
2020
Intentions
2.8 -9.46

* Title redacted *

* Diagram redacted *


Example: Potential GDP Revisions, 2008,09 Recession
Pontential GDP Revisions, 2008,09 Recession
Text version
First Week – Proposed Outreach
  Potential GDP Extrapolated from Pre-Recession Trends (no lasting effects) Potential GDP Post-Recession (one-off hit and trend growth lower) Actual Real GDP
2003 100.0 100.0 100.0
2004 102.5 102.3 103.1
2005 105.3 104.8 106.4
2006 108.4 107.5 109.2
2007 111.6 110.0 111.5
2008 114.8 112.4 112.6
2009 117.8 114.2 109.3
2010 120.6 115.2 112.7
2011 123.2 116.9 116.2
2012 125.9 119.1 118.2
2013 128.7 121.7 121.0
2014 131.5 124.4 124.5

* Page redacted *

* Page redacted *

Annex

* Page redacted *

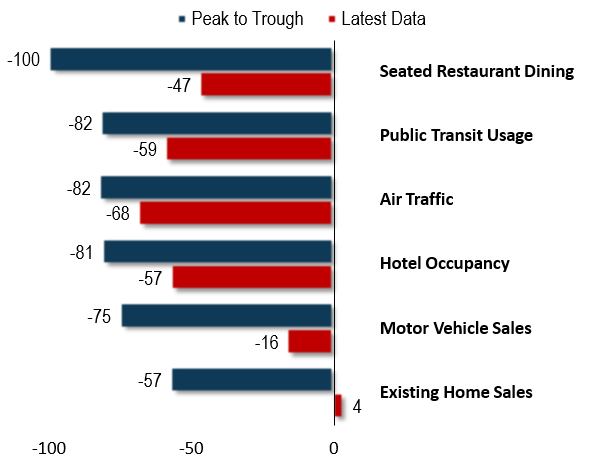
However, virus risks are the biggest brake on local economic activity – with activities that require close contact still depressed


Re-Opening at a Glance: Declines in High-Frequency Indicators
Chart #: Chart Title

Notes: Last data points are July 28 (restaurant diners and public transit), July 22 (air traffic), July 18 (hotel occupancy), July 24 (drilling activity), June 30 (auto sales and existing home sales). All declines in year-over-year terms, except air traffic. Air traffic is decline vs. March 5-11 due to data availability.
Sources: OpenTable, Transitapp.com; FlightRadar; Hotel News Resource, Baker Hughes; DesRosiers Automotive Consultants; Canadian Real Estate Association, Public Health Agency of Canada.

Text version
First Week – Proposed Outreach
  Peak to Trough Latest Data
Existing Home Sales -57 4
Motor Vehicle Sales -75 -16
Hotel Occupancy -81 -57
Air Traffic -83 -68
Public Transit Usage -84 -59
Seated Restaurant Dining -100 -47

Potential for the release of significant pent-up consumer demand over the next few months

* Chart redacted *

Page details

2020-12-16