Appendices of the screening assessment
Aromatic Azo and Benzidine-based Substance Grouping
Certain Azo Disperse Dyes
Environment Canada
Health Canada
March 2017
Table of contents
- Appendix A: summary of physical and chemical properties -- Part 1: water solubility and octanol-water partition coefficient
- Appendix B: physical and chemical properties of 73 Disperse Dyes and their structural analogues -- Part 2: additional information on other parameters
- Appendix C: experimental ecotoxicity data on aquatic species for Azo Disperse Dyes and their analogues
- Appendix D: Critical Body Burden (CBB) approach for Azo Disperse Dyes
- Appendix E: ecological exposure calculations for Azo Disperse Dyes
- Appendix F: Azo Disperse Dyes with effects of concern
- Appendix G: conservative exposure estimates to Azo Disperse Dyes via use of textiles and leather products
- Back to the screening assessment
Appendix A: summary of physical and chemical properties -- Part 1: water solubility and octanol-water partition coefficient
Seventy-three Azo Disperse Dyes and their structural analogues were sorted into seven structurally related groups, as indicated in Section 2 Identity of Substances. Water solubility (WS) and octanol-water partition coefficient (log KOW) identified are presented in Tables A1 to A7. If empirical data is not available for a substance, read-across is applied using the available information of a substance or an analogue in the same structurally related group or as specified in the table.
| C.I. generic name or CAS RN | Chemical structure | WS (mg/L) | log Kow |
|---|---|---|---|
| Disperse Yellow 23 |  |
NA | NA |
| Disperse Yellow 7 |  |
NA | NA |
| 6465-02-7 |  |
NA | NA |
| 6657-00-7 |  |
NA | NA |
| Disperse Orange 29 |  |
0.0037-0.027 (Baughman et al. 1996 and Balakrishnan 2013) |
4.58 (Brown 1992 and Study Submission 2008a) |
| Disperse Yellow 68 |  |
NA | NA |
| 27184-69-6 |  |
NA | NA |
| 93805-00-6 |  |
NA | NA |
| C.I. generic name or CAS RN | Chemical structure | WS (mg/L) | log Kow |
|---|---|---|---|
| Disperse Orange 13 | 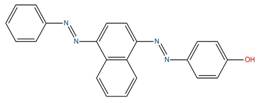 |
0.00022 - 0.345 (Kuroiwa and Ogasawara 1973, and Balakrishnan 2013) |
4.58 (read-across of Disperse Orange 29) |
| 58104-55-5 |  |
NA | NA |
| Disperse Red 151 | 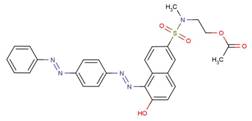 |
NA | NA |
| C.I. generic name or CAS RN | Chemical structure | WS (mg/L) | log Kow |
|---|---|---|---|
| Disperse Red 177* |  |
0.0079 - 0.79 (Yen et al. 1989, Sijm et al. 1999, and Baughman and Weber 1991) |
4.08 - 4.6 (Sijm et al. 1999 and Yen et al. 1989) |
| Disperse Red 179 |  |
NA | NA |
| 19745-44-9 | 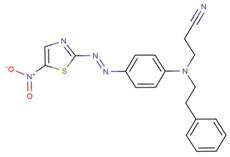 |
NA | NA |
| 25150-28-1 |  |
NA | NA |
| DAPEP |  |
NA | NA |
| 28824-41-1 |  |
NA | NA |
| 33979-43-0 |  |
NA | NA |
| 41362-82-7 |  |
NA | NA |
| Disperse Red 338 |  |
NA | NA |
| 67905-67-3 |  |
NA | NA |
| 127126-02-7 |  |
NA | NA |
Table A4. water solubility and octanol-water partition coefficients of Azo Disperse Dyes in Structurally Related Group 4, which includes 40 dyes and their structural analogues that have one azo bond and two aromatic rings with a variety of substituent groups in the chemical structures
To enhance structural similarity between substances to apply read-across, these 40 disperse dyes are further separated into 12 small groups.
| C.I. generic name or CAS RN | Chemical structure | WS (mg/L) | log Kow |
|---|---|---|---|
| Disperse Blue 165* | 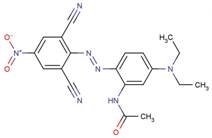 |
0.058 - 1.3 (Sijm et al. 1999) |
NA |
| 6657-33-6* | 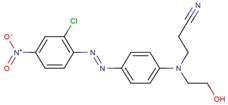 |
NA | 4 (Baughman and Weber 1991) |
| 2537-62-4 | 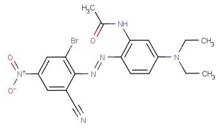 |
NA | NA |
| 52697-38-8 |  |
NA | NA |
| 55252-53-4 |  |
NA | NA |
| 56532-53-7 | 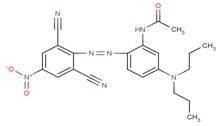 |
NA | NA |
| 68214-66-4 |  |
NA | NA |
| DADM | 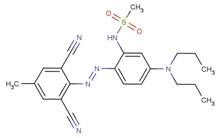 |
NA | NA |
| 83249-47-2 | 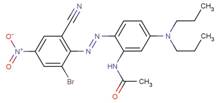 |
NA | NA |
| 83249-49-4 |  |
NA | NA |
| 83249-53-0 | 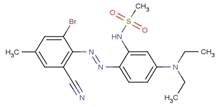 |
NA | NA |
| 83249-54-1 | 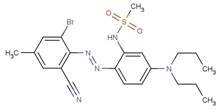 |
NA | NA |
| C.I. generic name or CAS RN | Chemical structure | WS (mg/L) | log Kow |
|---|---|---|---|
| Disperse Orange 30 |  |
0.07 (Brown 1992) |
4.21 (Brown 1992) |
| Disperse Orange 61 |  |
NA | NA |
| C.I. generic name or CAS RN | Chemical structure | WS (mg/L) | log Kow |
|---|---|---|---|
| Disperse Red13* |
 |
0.012 - 0.1 (OECD 2011, Baughman and Perenich 1988, and Bird 1954) |
4.21 (calculated) (Baughman and Perenich 1988) |
| Disperse Orange 5 |  |
NA | 4.34 (calculated) (Baughman and Perenich 1988) |
| C.I. generic name or CAS RN | Chemical structure | WS (mg/L) | log Kow |
|---|---|---|---|
| Disperse Orange 1* |  |
0.00955 (Baughman and Perenich 1988) |
5.07 (calculated) (Baughman and Perenich 1988) |
| 15958-27-7 | 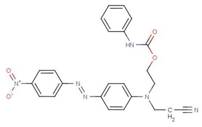 |
NA | NA |
| 24610-00-2 | 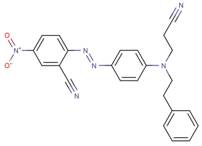 |
NA | NA |
| 31030-27-0 |  |
NA | NA |
| 72927-94-7 | 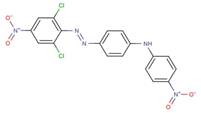 |
NA | NA |
| MATCB |  |
NA | NA |
| C.I. generic name or CAS RN | Chemical structure | WS (mg/L) | log Kow |
|---|---|---|---|
| Disperse Blue 79:1 | 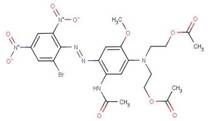 |
0.022 (Sijm et al. 1999) |
4.44 - 4.8 (Sijm et al. 1999 and Yen et al. 1989) |
| Disperse Blue 79 | 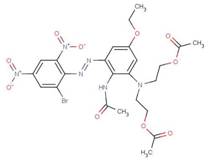 |
0.0003 - 0.0054 (Brown 1992, Baughman and Perenich 1988, Yen et al. 1989, Zhibo et al. 1984, and Clariant 1996) |
3.56 - 4.1 (Zhibo et al. 1984, Brown 1992, and Clariant 1996) |
| ANAM |  |
NA | NA |
| 16421-41-3 |  |
NA | NA |
| Disperse Red 167 |  |
NA | NA |
| BANAP |  |
NA | NA |
| 42852-92-6 | 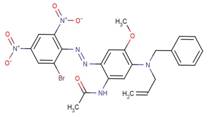 |
NA | NA |
| 53950-33-7 | 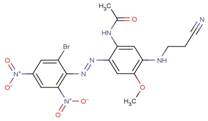 |
NA | NA |
| Disperse Blue 125 |  |
NA | NA |
| C.I. generic name or CAS RN | Chemical structure | WS (mg/L) | log Kow |
|---|---|---|---|
| 58528-60-2* |  |
0.454 (Bird 1954) |
4.12 - 4.98 (calculated) (Baughman and Perenich 1988 and ChemIDplus 1993- ) |
| Disperse Brown 1:1 | 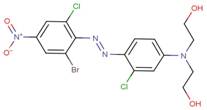 |
NA | NA |
| Disperse Brown 1 | 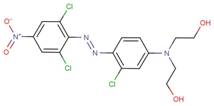 |
NA | NA |
| C.I. generic name or CAS RN | Chemical structure | WS (mg/L) | log Kow |
|---|---|---|---|
| Disperse Blue 94 | 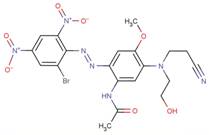 |
NA | NA |
| 68877-63-4 |  |
0.000 688 (Yen et al. 1989) |
5.4 (Yen et al. 1989) |
| 63133-84-6 | 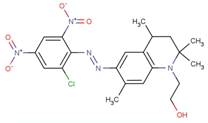 |
NA | NA |
| CAS RN | Chemical structure | WS (mg/L) | log Kow |
|---|---|---|---|
| 55619-18-6 |  |
NA | NA |
| ANMOM |  |
0.055 (calculated) (calculated value from the experimental log Kow) |
4.1 (Anliker and Moser 1987) |
| 73003-64-2 |  |
NA | NA |
| C.I. generic name or CAS RN | Chemical structure | WS (mg/L) | log Kow |
|---|---|---|---|
| Disperse Red 5* |  |
0.097 - 0.2 (Shibusawa et al. 1977 (cited in Baughman and Perenich 1988), Baughman and Weber 1991, Bird 1954 (cited in Baughman and Perenich 1988), and Bird 1954) |
4.3 (Baughman and Weber 1991, and Hou et al. 1991) |
| 68516-64-3 |  |
NA | NA |
| CAS RN | Chemical structure | WS (mg/L) | log Kow |
|---|---|---|---|
| 3025-52-3* |  |
0.000 011 9 (Biedermann and Datyner 1981) |
4.34 - 4.69 (calculated) (Biedermann and Datyner 1981, and Baughman and Perenich 1988) |
| 69472-19-1 |  |
NA | NA |
| C.I. generic name or CAS RN | Chemical structure | WS (mg/L) | log Kow |
|---|---|---|---|
| 72828-63-8 |  |
NA | NA |
| Disperse Blue 287 |  |
0.000 59 (Yen et al. 1989) |
5.5 (Yen et al. 1989) |
| C.I. generic name or CAS RN | Chemical structure | WS (mg/L) | log Kow |
|---|---|---|---|
| 71617-28-2* |  |
0.298 (calculated) (calculated based on the experimental log Kow) |
4.0 (Anliker and Moser 1987) |
| Disperse Red 349 |  |
NA | NA |
| C.I. generic name or CAS RN | Chemical structure | WS (mg/L) | log Kow |
|---|---|---|---|
| Disperse Yellow 211* | 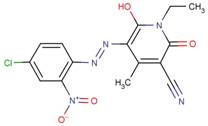 |
0.0739 (Baughman and Weber 1991, and Baughman et al. 1996) |
3.4 (Anliker and Moser 1987) |
| 55290-62-5 |  |
0.0019 (calculated based on the experimental log Kow) |
5.7 (Environment Canada 2014) |
| 51249-07-1 |  |
NA | NA |
| 61799-13-1 | 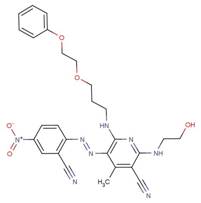 |
NA | NA |
| 63833-78-3 | 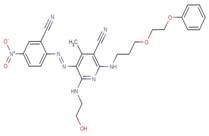 |
NA | NA |
| 68214-63-1 | 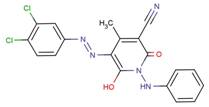 |
NA | NA |
| 68992-01-8 | 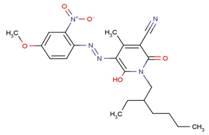 |
NA | NA |
| 90729-40-1 | 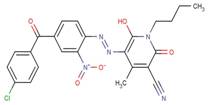 |
NA | NA |
| CAS RN | Chemical structures | WS (mg/L) | log Kow |
|---|---|---|---|
| 42357-98-2 |  |
0.345 (read-across of Disperse Orange 13) |
4.58 (read-across of Disperse Orange 29) |
| 42358-36-1 | 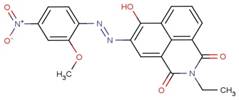 |
0.345 (read-across of Disperse Orange 13) |
4.58 (read-across of Disperse Orange 29) |
| C.I. generic name or CAS RN | Chemical structure | WS (mg/L) | log Kow |
|---|---|---|---|
| Disperse Brown 21 | 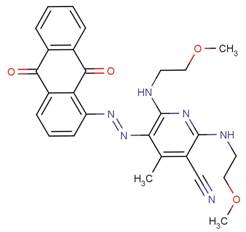 |
NA | 4.5 (read-across of CAS RN 51249-07-1) |
| Unknown analogue for Disperse Brown 21 |  |
0.000 001 (at 21°C) (Baughman et al. 1996) |
4.5 (read-across of CAS RN 51249-07-1) |
| 65122-05-6 | 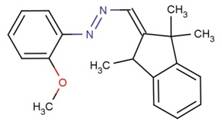 |
NA | 4.5 (read-across of CAS RN 51249-07-1) |
| 70660-55-8 | 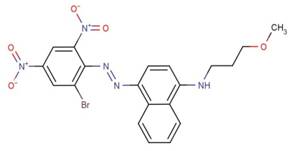 |
NA | 4.5 (read-across of CAS RN 51249-07-1) |
Appendix B: Physical and Chemical Properties of 73 Disperse Dyes and their structural analogues -- Part 2: additional information on Other Parameters
Empirical data on melting point, vapour pressure, density and n-octanol solubility are listed in Table B1 and used to characterize such properties for Azo Disperse Dyes.
| C.I. generic name, Abbreviation, or CAS RN | Melting point (°C) | Vapour pressure (Pa) | Density (g/cm3) | n-Octanol solubility (mg/L) |
|---|---|---|---|---|
| Disperse Red 1* | NA | 1.33 × 10⁻¹¹ (originally reported as 1 × 10-13 mmHg in Baughman and Perenich 1988) 5.32 × 10⁻¹² (originally reported as 4 × 10-14 mmHg in OECD 2011) |
1.34 (calculated) (Kojima and Iijima 1975) |
NA |
| 3025-52-3* | 152 (Baughman and Perenich 1988) |
1.06 × 10⁻⁸ (originally reported as 8 × 10-11 mmHg in Baughman and Perenich 1988) |
NA | NA |
| Disperse Red 13* | 133 (Baughman and Perenich 1988) |
NA | 1.37 (calculated) (Kojima and Iijima 1975) |
NA |
| Disperse Blue 79:1 | greater than or equal to 138 (Sandoz Chemicals 1989) 149-151 (CHRIP ©2008) 132 (OECD 2012) |
NA | NA | 14.1 (Sijm et al. 1999) |
| Disperse Orange 30 | NA | NA | 576 (ETAD 2005) |
NA |
| Disperse Orange 5 | NA | NA | 1.48 (calculated) (Kojima and Iijima 1975) |
NA |
| 6657-00-7 | NA | NA | 1.19 (Guidechem 2012) |
NA |
| 6657-33-6* | NA | 1.07 × 10⁻¹³ mmHg (estimated) (ChemIDplus 1993- ) |
NA | 2100 (20°C) (Anliker and Moser 1987) |
| Disperse Blue 79 | NA | 3.40 × 10⁻⁹ (IUCLID 2001) 4.53 × 10⁻⁷ (Clariant 1996) |
NA | NA |
| Disperse Orange 29 | NA | NA | NA | 5086 (ETAD 2005) |
| DAPEP | NA | NA | 1.39 (Guidechem 2012) |
|
| Disperse Red 167 | NA | NA | NA | 450 (water content 47.5% w/w) (ETAD 2005) |
| 30449-81-1* | NA | NA | NA | 800 (at 20°C) (experimental) (Anliker and Moser 1987) |
| 40690-89-9* | NA | NA | NA | 130 (water content 0.3% w/w) (ETAD 2005) |
| 51249-07-1 | NA | NA | NA | 2430 (experimental) (at 20°C) (Anliker and Moser 1987) |
| 52697-38-8 | NA | NA | 1.55 (ChemNet 2012; LookChem 2012) |
NA |
| 58528-60-2* | NA | 8.05 × 10⁻¹⁵ mmHg (estimated) (ChemIDplus 1993- ) |
NA | NA |
| ANMOM | NA | NA | NA | 1670 (20°C) (experimental) (Anliker and Moser 1987) |
| 65125-87-3* | NA | NA | 1.49 (Guidechem 2012) |
NA |
| Disperse Red 177* | NA | 1.55 × 10⁻¹³ mmHg (estimated) (PhysProp 2006) |
NA | 66 ± 6 (Sijm et al. 1999) |
| Disperse Yellow 163* | NA | NA | NA | 90 (water content 0.9% w/w) (ETAD 2005) |
| 68877-63-4 | NA | NA | 1.52 (Guidechem 2012) |
81 (20°C) (Anliker and Moser 1987) |
| Disperse Yellow 211 * | NA | NA | 1.49 (ChemBlink 2012) |
100 (at 20°C) (experimental) (Anliker and Moser 1987) |
| 71617-28-2* | NA | NA | NA | 950 (at 20°C) (experimental) (Anliker and Moser 1987) |
| Disperse Blue 287 | NA | NA | NA | 410 (at 20°C) (Anliker and Moser 1987) |
Appendix C: Experimental Ecotoxicity Data on aquatic species for Azo Disperse Dyes and their analogues
| C.I. generic name | Molecular weight (g/mol) | Deff (nm) | Organisms | Toxicity endpoint and value (mg/L) (reference) |
|---|---|---|---|---|
| Disperse Yellow 23 | 302 | 0.77 | Rainbow trout (Oncorhynchus mykiss) | 48 h LC50 greater than 1000 (Environment Canada 2008b) |
| Disperse Red 179 | 394 | 1.01 | Guppy (Poecilia reticulata) | 96 h LC50 = 10-100 96 h NOEC = 10 48 h LC100 = 100 (BMG 2003b) |
| Disperse Orange 29 | 377 | 0.99 | Zebra fish (Brachydanio rerio) | 96 h LC50 = 480 (Brown 1992) |
| DAPEP | 404 | 0.93 | Guppy (Poecilia reticulata) | 96 h NOEC greater than or equal to 100 (BMG 2000b) |
| DADM | 439 | 1.17 | Zebra fish (Brachydanio rerio) | 96 h LC0 greater than 1000 (Study Submission 2008b) |
| DADM | 439 | 1.17 | Rainbow trout (Oncorhyncus mykiss) | 96 h LC0 greater than 1000 (Study Submission 2008b) |
| Disperse Orange 30 | 450 | 1.04 | Rainbow trout (Oncorhynchus mykiss) | 48 h LC50 greater than 700 (Sandoz 1975) |
| Disperse Orange 30 | 450 | 1.04 | Zebra fish (Brachydanio rerio) | 96 h LC50 = 710 (Brown 1992) |
| Disperse Orange 30 | 450 | 1.04 | Rainbow trout (Oncorhynchus mykiss) | 96 h LC50 greater than 100 (SafePharm 1990a) |
| 52697-38-8 | 479 | 1.08 | Rainbow trout (Oncorhynchus mykiss) | 96 h LC50 greater than 100 (SafePharm 1990a) |
| MATCB | 493 | 1.03 | Carp (Cyprinus carpio) | 96 h LC50 greater than 100 (Kremer 2003) |
| Disperse Blue 79 | 639 | 1.29 | Zebra fish (Brachydanio rerio) | 96 h LC50 = 340 (Brown 1992) |
| Disperse Blue 79 | 639 | 1.29 | Rainbow trout (Oncorhynchus mykiss) | 96 h LC50 greater than 100 (SafePharm 1990a) |
| Disperse Blue 79 | 639 | 1.29 | Golden orfe (Leuciscus idus) | 96 h LC50 = 100-200 (BASF 1990) |
| Disperse Orange 29 | 377 | 0.99 | Crustacean (Daphnia magna ) | 48 h EC50 = 70 (Brown 1992) |
| Disperse Orange 30 | 450 | 1.04 | Crustacean (Daphnia magna ) | 48 h EC50 = 5.8 (Brown 1992) |
| Disperse Blue 79:1 | 625 | 1.23 | Crustacean (Daphnia magna ) | 24 h EC100 greater than 50 24 h EC50 = 16 24 h NOEC = 1.6 (acute immobilization) (Brown 1992) |
| Disperse Blue 79:1 | 625 | 1.23 | Crustacean (Daphnia magna) | 24 h EC50 = 10-100 (immobilization) (Study Submission 2012c) |
| Disperse Blue 79 | 639 | 1.29 | Crustacean (Daphnia magna ) | 48 h EC50 = 4.5 (Brown 1992) |
| Disperse Orange 29 | 377 | 0.99 | Bacteria (activated sludge) | 30 min EC50 greater than 100 (Brown 1992) |
| DAPEP | 404 | 0.93 | Activated sludge microorganisms | 3 h EC20, EC50, EC80 greater than 4000 (BMG 2000a) |
| Disperse Red 179 | 394 | 1.01 | Activated sludge microorganisms | 3 h EC20, EC50, EC80 greater than 1000 (BMG 2003b) |
| DADM | 439 | 1.17 | Bacteria (species not specified) | 3 h EC50 greater than 10 000 (Study Submission 2008b) |
| Disperse Orange 30 | 450 | 1.04 | Bacteria (species not specified) | IC50 greater than 100 (Brown 1992) |
| 52697-38-8 | 479 | 1.08 | E342 Bacteria toxicity (respiration inhibition) | 3 h IC50 greater than 10 (Study Submission 2005a) |
| MATCB | 493 | 1.03 | Bacteria (species not specified) | 96 h IC50 greater than 100 (Kremer 2003) |
| Disperse Blue 79:1 | 625 | 1.23 | Wastewater bacteria | IC50 greater than 100 (Study Submission 2012c) |
| Disperse Blue 79 | 639 | 1.29 | Bacteria (species not specified) | IC50 greater than 100 (Brown 1992) |
| Disperse Orange 1*a | 318 | 0.87 | Daphnia similis | 48 h NOEC = 0.1 (immobilization) 48 h LC25 = 10 (Ferraz et al. 2011a) |
| Disperse Red 1* | 314 | 0.86 | Daphnia similis | 48 h EC50 = 0.127 48 h NOEC = 0.01 (immobility) (Ferraz et al. 2011b) |
| Disperse Red 1* | 314 | 0.86 | Daphnia similis | 48 h EC50 = 0.13 (immobilization) (Vacchi et al. 2013) |
| Disperse Red 1* | 314 | 0.86 | Hydra attenuata | 48 h EC50 = 1.9 (immobilization) (Vacchi et al. 2013) |
| Disperse Red 17* | 344 | Daphnia magna | 48 h EC50 = 98 (Brown 1992) |
|
| Disperse Red 13* | 349 | 0.89 | Daphnia similis | 48 h EC50 = 0.019 48 h NOEC = 0.001 (immobility) (Ferraz et al. 2011b) |
| Disperse Red 73* | 348 | 0.95 | Daphnia magna | 48 h LC50 = 110 (Brown 1992) |
| 70198-17-3* | 403 | Daphnids | 96 h LC50 = 0.12 (Health, Safety, and Human Factors Laboratory 1978) |
|
| Disperse Yellow 7 | 316 | 0.86 | Fathead minnow (Pimephales promelas) | 14-day LC50 = 0.025 (Parrott et al. 2013) |
| Disperse Blue 79:1 | 625 | 1.23 | Rainbow trout (Oncorhynchus mykiss) |
122-day NOEC greater than or equal to 0.0048 (ABC 1991) |
| Disperse Yellow 7 | 316 | 0.86 | Crustacean (Hyalella azteca) |
14-day LC50 = 0.16 28-day LC50 = 0.12 28-day EC50 greater than 0.2 (Bartlett 2013) |
| Disperse Orange 13 | 352 | 1.02 | Crustacean (Hyalella azteca) |
14-day LC50 = 1.41 28-day LC50 = 0.61 28-day EC50 = 1.17 (Bartlett 2013) |
| Disperse Orange 29 | 377 | 0.99 | Alga (Scenedesmus subspicatus) | 72 h EC50 = 6 (biomass) 72 h EC50 = 86 (growth) (Brown 1992) |
| Disperse Orange 30 | 450 | 1.04 | Alga (Scenedesmus subspicatus) | 72 h EC50 = 3.4 (biomass) 72 h EC50 = 6.7 (growth) (Brown 1992) |
| Disperse Blue 79:1 | 625 | 1.23 | Alga (Scenedesmus subspicatus) | 72 h EC50 = 15 (biomass) 72 h EC50 = 9.5 (growth rate) (Brown 1992) |
| Disperse Blue 79 | 639 | 1.29 | Alga (Scenedesmus subspicatus) | 72 h EC50 = 7 (growth) (Brown 1992) |
| Disperse Blue 79 | 639 | 1.29 | Alga (Scenedesmus subspicatus) | 72 h EC50 = 15 (biomass) 72 h EC50 = 9.5 (growth) (Brown 1992) |
Appendix D: Critical Body Burden (CBB) approach for Azo Disperse Dyes
In terms of aquatic toxicity, the critical body burden (CBB) concept shows that an aquatic organism that takes up a chemical from water may accumulate this chemical until a certain critical body burden has been attained, which then causes the mortality of the organism. McCarty (1986, 1987a, b, 1990), McCarty and Mackay (1993), McCarty et al. (1985, 1991) and Van Hoogen and Opperhuizen (1988) have indeed shown that internal concentrations of halogenated organic chemicals in fish causing death are fairly constant: about 2-8 mmol/kg.
Sijm and Hermens (2000) indicated that McCarty (1987a, b) and McCarty et al. (1991) have mathematically explained this as follows. The fairly constant internal effect concentration or lethal body burden (LBB, which is the critical body burden associated with a lethal effect) is the result of the bioconcentration factor (BCF), which increases with octanol-water partition coefficient (Kow), and the external effect concentration (median lethal concentration, or LC50), which decreases with Kow:
LBB = LC50 × BCF
Therefore:
log LBB ≈ log (LC50) + log (BCF) ≈ (-log Kow + b1) + (log Kow + b2)
≈ b1 + b2 ≈ constant
where b1 and b2 are constants.
Having analyzed the literature data, Sijm and Hermens (2000) emphasized that for narcotic (e.g., polychlorinated benzenes and biphenyls) and polar-narcotic compounds (e.g., chlorinated phenols and anilines), sufficient information is available to study this assumption. The authors came to the conclusion that for different organisms, the lethal body burdens for polar narcotics vary by approximately two orders of magnitude, and thus again show a significant reduction in the variation of the ecotoxicological effect concentrations, compared with the more than five orders of magnitude differences that are found in external effect concentrations for this type of mechanism of action.
While applying a CBB approach for Azo Disperse Dyes, the following assumptions have been made: 1) these substances are not reactive or specifically acting reactive chemicals, i.e., they provoke toxicity only through non-specific mechanisms (i.e., narcotic mode of action); 2) there are no dye-dispersant (or dye-solvent) interactions; 3) the purity of these substances is very high; 4) for lethal effects, once the aquatic organism has reached the lethal body burden (LBB), it dies; and 5) the average acute LBB threshold for a lethal effect is 5 mmol/kg.
Lethal Body Burden (LBB) and External Effect Concentration (EEC) calculations
As indicated above, LBB = LC50 × BCF. Therefore, the expected external acute effect concentration (LC50) can be back-calculated as:
LC50 (mmol/L) = [LBB (mmol/kg) / BCF (L/kg)] × [CBB (mmol/kg) / BCF (L/kg)]
Using Disperse Orange 30 as an example, the experimental whole-body BCF is 8.43 L/kg (Shen and Hu 2008), calculated by averaging the measured values at three sampling times.
At the same time, the BCF in fish is usually normalized for the 5% lipid content of the organism:
BCFL = [BCFwb-ww / Lf] × 5%
where BCFL is the lipid-normalized bioconcentration factor, BCFwb ww is the whole-body BCF (wet weight basis), Lf is the lipid content (fraction) in the organism and 5% is the generally accepted lipid level for lipid-normalized BCF.
The lipid content (Lf) in fish in the bioaccumulation study on Disperse Orange 30 is 0.83% (Shen and Hu 2008). Therefore, the lipid-normalized BCF is:
BCFL = [8.43 (L/kg) / 0.0083] × 0.05 ≈ 50.78 L/kg
Therefore, considering the average acute CBB threshold of 5 mmol/kg, the external effect concentration can be calculated as:
Acute LC50 = [LBB (mmol / kg) / BCF (L/kg)] = [5 (mmol / kg) / 50.78 (L/kg)] = 0.098 mmol/L
Using the molecular weight of Disperse Orange 30 (~450 g/mol or 450 mg/mmol), the external acute effect concentration for this substance, expressed in mg/L, is:
0.098 mmol/L × 450 mg/mmol = 44 mg/L
Applying the same approach, external acute effect concentrations have been calculated for a few other Azo Disperse Dyes in this subgroup and analogues, based on the available information. The results are presented in Table 13.
Appendix E: Ecological Exposure Calculations for Azo Disperse Dyes
The ecological exposure to Azo Disperse Dyes was estimated based on their use patterns. Azo Disperse Dyes were used in two types of industrial operations, textile chemicals formulation and textile dyeing. The aquatic exposure was estimated based on estimated quantities released from industrial facilities to receiving waters via wastewater treatment systems. The exposure in sediment was then derived from the aquatic exposure results using an equilibrium approach. Finally, the exposure in soil was calculated based on the land application of wastewater biosolids. These exposure estimates are summarized statistically in Table 6-7.
Predicted Environmental Concentrations (PECs) in water for textile chemicals formulation
The aquatic PECs for textile chemicals formulation were estimated based on the daily quantities of Azo Disperse Dyes used. Other parameters considered included emission factor to wastewater, wastewater treatment removal, wastewater flow and receiving water dilution. It was found that the formulation took place at fewer than 4 facilities and involved only one Azo Disperse Dye (Disperse Yellow 3). As a result, the aquatic exposure was estimated based on this specific dye under the conditions of these specific facilities. The approach used in the calculations was to determine the concentration of Disperse Yellow 3 in receiving water near the wastewater treatment system's effluent discharge point based on the wastewater flow and receiving water dilution.
The daily quantity of Disperse Yellow 3 used for the formulation of textile chemicals was determined by companies involved (2013 communications between companies and Environment Canada; unreferenced). Although it varied, the maximum was up to 440 kg/day. This maximum was used to derive the aquatic PEC:
Daily use quantity of Disperse Yellow 3 = 440 kg/d
The emission factor to wastewater for the formulation of textile chemicals was provided by the company involved (2013 telephone communications between company and Environment Canada; unreferenced). It varied between 0.7% and 1.1%. The higher-end value (1.1%) was used.
Emission factor to wastewater = 1.1%
The daily release quantity of Disperse Yellow 3 to wastewater was estimated by multiplying the daily use quantity by the emission factor to wastewater.
Daily release quantity of Disperse Yellow 3 to wastewater
= Daily use quantity of Disperse Yellow 3 × Emission factor to wastewater
= 440 kg/day × 1.1%
= 4.84 kg/day
For the given formulation facilities, the on-site wastewater treatment consisted of pH adjustment, solids settling and aeration (2013 telephone communications between companies and Environment Canada; unreferenced). This treatment was equivalent to a secondary wastewater treatment system at best.
The removal efficiency of a secondary wastewater treatment system was estimated by the model ASTreat (2006). The estimate was based on the physical and chemical properties of Disperse Yellow 3. This dye was non-volatile and was assumed not to biodegrade through wastewater treatment, due to a lack of biodegradation data. The removal efficiency estimated was 26.2% as a result of sludge sorption only.
On-site wastewater treatment removal = 26.2%
The daily release quantity of Disperse Yellow 3 to the sewer system was then estimated from the daily release quantity to wastewater and the on-site wastewater treatment removal.
Daily release quantity of Disperse Yellow 3 to sewer system
= Daily release quantity of Disperse Yellow 3 to wastewater × (1 - On-site wastewater treatment removal)
= 4.84 kg/day × (1 - 0.262)
= 3.57 kg/day
The off-site wastewater treatment system receiving the treated wastewater from the formulation facility was a secondary system and had a flow of 24 375 000 L/day. The concentration of Disperse Yellow 3 in the off-site wastewater treatment influent was then estimated:
Concentration of Disperse Yellow 3 in off-site wastewater treatment influent
= Daily release quantity of Disperse Yellow 3 to sewer system / Flow of off-site wastewater treatment system
= 3.57 kg/day / 24 375 000 L/day = 1.46 × 10⁻⁷ kg/L = 146 μg/L
The removal of the off-site wastewater treatment system was estimated by ASTreat (2006) and the result was the same as the removal (26.2%) of the on-site wastewater treatment of the formulation facilities.
The concentration of Disperse Yellow 3 in the off-site wastewater treatment effluent was estimated from the concentration in the influent and the removal of the off-site wastewater treatment system.
Concentration of Disperse Yellow 3 in off-site wastewater treatment effluent
= Concentration of Disperse Yellow 3 in off-site wastewater treatment influent × (1 - Off-site wastewater treatment removal)
= 146 μg/L × (1 - 0.262) = 108 μg/L
The aquatic PEC was estimated by dividing the effluent concentration by the dilution factor of the receiving water. Since the aquatic PEC is determined near the discharge point, the receiving water dilution selected should be applicable to this requirement. The full dilution potential of a river is considered appropriate if it is between 1 and 10. Otherwise, the 10-fold dilution is used for both large rivers and still waters. The receiving water for the off-site wastewater treatment system is a large river. Thus, the 10-fold dilution was used in the calculation of the aquatic PEC.
Aquatic PEC
= Concentration of Disperse Yellow 3 in off-site wastewater treatment effluent / Receiving water dilution factor
= 108 μg/L / 10 = 10.8 μg/L = 0.011 mg/L
Predicted Environmental Concentrations (PECs) in water for textile dyeing
The aquatic for textile dyeing was estimated near the discharge points of wastewater treatment effluents. The PECs were derived from estimated releases from individual textile dyeing facilities, wastewater treatment removal for AzoDisperse Dyes, wastewater treatment flows and receiving water dilution capacities.
Thirty-nine textile dyeing facilities were identified as using Azo Disperse Dyes from recent CEPA 1999 section 71 surveys (Canada 2006, 2008a, 2008b, 2008c, 2009a, 2009b, and 2011). These facilities were the major customers of the importers of this class of dyes. They therefore represented the major sources of environmental releases and exposure for the textile dyeing sector. One textile dyeing facility confirmed with Environment Canada that it no longer used any of Azo Disperse Dyes in its operations after initial purchases (2013 email from textile mill to Environment Canada; unreferenced). Therefore, 38 textile dyeing facilities were selected to evaluate the exposure from the textile dyeing scenario. These 38 facilities were located in three provinces (Ontario, Quebec and Nova Scotia).
The daily use quantity of Azo Disperse Dyes at each facility was unknown except for one facility in Ontario and was therefore estimated from literature data. According to US EPA (1994), a typical dyelot consisted of 454 kg of textile and was completed within 6 hours from batch dyeing or 8 hours from continuous dyeing. When a facility operated three shifts daily or 24 hours/day, the maximum number of dyelots completed per day would be four, and the quantity of textile dyed would be 1816 kg/day (454 kg/dyelot × 4 dyelots/day), as determined for batch dyeing. For a typical dye use rate of 0.02 kg of dyes per kilogram of textile (Cai et al. 1999), the daily use quantity of Azo Disperse Dyes used at one facility was estimated:
Daily use quantity of disperse dyes used at one facility
= Daily quantity of textile dyed × Dye use rate
= 1816 kg × 0.02 kg/kg = 36 kg/day
The daily use quantity of Azo Disperse Dyes for one facility in Ontario was provided by the facility to be less than 15 kg (2013 email from textile dyeing facility to Environment Canada; unreferenced). The daily use quantity of 15 kg was used in the derivation of the aquatic PEC associated with this facility.
The daily release quantity of Azo Disperse Dyes to the sewer system was estimated based on their emission factors to wastewater. The emission factors for disperse dyes were in the range of 1-12% (OECD 2004). The highest value in this range, 12%, was used to calculate a conservative daily release quantity of Azo Disperse Dyes to the sewer system:
Daily release quantity of disperse dyes to sewer system from one facility
= Daily use quantity of disperse dyes at one facility × Emission factor to wastewater
= 36 kg/day × 12% = 4.32 kg/day
Many textile dyeing facilities were known to have on-site wastewater treatment, but the type of treatment was unknown for each of the facilities evaluated. As a conservative approximation, it was assumed that Azo Disperse Dyes were released to the sewer system without being removed by on-site wastewater treatment. This assumption resulted in a conservative estimate for the daily release quantity to the sewer system, which was equal to the daily release quantity to wastewater.
The concentration of Azo Disperse Dyes in wastewater influent was calculated by dividing the daily release quantity by the wastewater flow (L/day) of an off-site wastewater treatment system. For example, the flow of one off-site wastewater treatment system in Quebec was 53 829 647 L/day. The concentration of Azo Disperse Dyes in the influent was then calculated accordingly:
Concentration of disperse dyes in wastewater influent
= Daily release quantity of disperse dyes to sewer from one facility / Flow of the off-site wastewater treatment system
= 4.32 kg/day / 53 829 647 L/day = 80.3 × 10⁻⁹ kg/L = 80.3 μg/L
Two computer models were used to estimate removal efficiencies of the off-site wastewater treatment systems for Azo Disperse Dyes. One model was ASTreat (2006) for primary or secondary wastewater treatment systems. The other model was STP-EX (2008) for lagoons. In the estimation, it was assumed that Azo Disperse Dyes did not biodegrade through wastewater treatment. Considering this assumption and the non-volatile nature of Azo Disperse Dyes, the removal derived from the models was driven by sludge sorption only. The principal model input parameter influencing the sludge sorption was the octanol-water partition coefficient (Kow) or the solids-water partition coefficient. For Azo Disperse Dyes (14 in total) found in Canadian commerce, the logarithm of Kowvaried from 3.6 to 5.1. Hence, the removal estimated was in the range of 21.7-47.1 % by ASTreat for primary treatment systems, 26.2-61.1 % also by ASTreat for secondary treatment systems and 8.3-67.3 % by STP-EX for lagoons. The lower value in each range was used to derive conservative aquatic PECs.
Primary wastewater treatment removal for disperse dyes = 21.7 %
Secondary wastewater treatment removal for disperse dyes = 26.2 %
Lagoon treatment removal for disperse dyes = 8.3 %
The off-site wastewater treatment system in Quebec, which was used as an example, was a secondary system. Thus, the concentration of Azo Disperse Dyes in wastewater effluent was estimated by applying the secondary wastewater treatment removal (26.2 %):
Concentration of disperse dyes in wastewater effluent
= Concentration of disperse dyes in wastewater influent × (1 - Wastewater treatment removal)
= 80.3 μg/L × (1 - 0.26) = 59.3 μg/L
The aquatic PEC was estimated by dividing the effluent concentration by an appropriate dilution factor for the receiving water. Since the aquatic PEC was assessed near the discharge point, the receiving water dilution selected should be applicable to this requirement. The full dilution potential of a river is considered appropriate if it is between 1 and 10. Otherwise, the dilution is kept at 10 for both large rivers and still waters. The receiving water for the off-site wastewater treatment system in Quebec used as an example is a large river (St-François River). Thus, a 10-fold dilution factor was used in the calculation for the aquatic PEC:
Aquatic PEC
= Concentration of disperse dyes in wastewater effluent / Dilution factor of receiving water
= 59.3 μg/L / 10 = 5.9 μg/L
The aquatic PECs for all other facilities were estimated according to the above method.
Predicted Environmental Concentrations (PECs) in sediment
An equilibrium sediment-water partition approach described by the European Chemicals Agency (ECHA 2010) was used to estimate the concentration of Azo Disperse Dyes in sediment. This approach assumes that the concentration in bottom sediment is in equilibrium with the concentration in the overlying water. At equilibrium, the PEC in bottom sediment can linearly correlate with the concentration in the aqueous phase of the overlying water as follows.
Sediment PEC = KswCw
where:
- K sw:
- sediment-water partition coefficient (L/kg)
- C w:
- chemical concentration in aqueous phase (mg/L)
The sediment-water partition coefficient (Ksw, L/kg) can be estimated from the organic carbon (OC) fraction of sediment (Foc, kg OC/kg), the sorptive capacity of sediment's OC (Aoc, L/kg OC) and a substances octanol-water partition coefficient (Kow, unitless) (Gobas 2010):
Ksw = FocAocKow
The sediment PEC can then be calculated from the equation:
Sediment PEC = FocAocKowCw
The concentration in the aqueous phase (Cw, mg/L) can be estimated from the aquatic PEC (mg/L). There are three distinctive phases in the water column: aqueous, particulate suspended sediment and dissolved suspended sediment (Gobas 2007). Accordingly, the total concentration in the water column or the aquatic PEC (mg/L) can be expressed as a sum of the concentrations in the aqueous phase (Cw, mg/L), particulate suspended sediment (Cps, mg/L) and dissolved suspended sediment (Cds, mg/L):
Aquatic PEC = Cw + Cps + Cds
When the OC phase in particulate or dissolved suspended sediment is the phase of sorption for a substance, the above equation can be converted to an expression for estimating the ratio of the aquatic PEC (mg/L) to the concentration in the aqueous phase (Cw, mg/L) (Gobas 2007):
Aquatic PEC/Cw = 1 + (XdsFpocApoc + XdsFpocAdoc)Kow
where:
- X ds:
- content of particulate suspended sediment in water column (kg/L)
- F poc:
- OC fraction of particulate suspended sediment (kg OC/kg)
- A poc:
- sorptive capacity of particulate OC relative to octanol (L/kg OC)
- X ds:
- content of dissolved suspended sediment in water column (kg/L)
- F doc:
- OC fraction of dissolved suspended sediment (kg OC/kg)
- A doc:
- sorptive capacity of dissolved OC relative to octanol (L/kg OC)
- K ow:
- octanol-water partition coefficient (unitless)
In Canada, the middle level for the content of particulate suspended sediment in the water column (Xps) was 47 mg/L. This value was used in the derivation of the sediment PECs at the sites evaluated.
Xds = 47 mg/L = 4.7 × 10⁻⁵ kg/L
According to Gobas (2010), the OC fraction of particulate suspended sediment varied from 0.1 to 0.2 kg OC/kg sediment. The lower end of this range was used in order to be conservative for the sediment PECs derived.
Fpoc = 0.1 kg OC/kg
Karickhoff (1981) proposed a value of 0.41 L/kg OC for the sorptive capacity of sediment's OC based on a set of 17 sediment and soil samples and various hydrophobic non-polar organic compounds. This value was used for the sorptive capacity of particulate OC (Apoc).
Apoc = 0.41 L/kg OC
In Canada, the dissolved OC content in the water column averaged 2.7 mg OC/L This value was used in the derivation of the sediment PECs at the sites evaluated. Note that this OC content equals the product of the content of dissolved suspended sediment Xds (mg/L) and the OC fraction of dissolved suspended sediment Fdoc (kg OC/kg).
XdsFdoc = 2.7 mg OC/L = 2.7 × 10⁻⁶ kg OC/L
Gobas (2007) provided an estimate of 0.08 L/kg OC for the sorptive capacity of dissolved OC. This estimate was used.
Adoc = 0.08 L/kg OC
The dependence of the sediment PEC on the octanol-water partition coefficient (Kow) was derived by combining the equation for the sediment PEC with the expression for the ratio of the aquatic PEC to the concentration in the aqueous phase (Aquatic PEC/Cw).
Sediment PEC = [FocAoc] / [(1/Kow) + (XpsFpocApoc) + (XdsFdocAdoc)] × Aquatic PEC
This dependence indicates that the sediment PEC approaches zero for water soluble substances with low Kow and approaches a maximum for highly hydrophobic substances with high Kow.
The logarithm of Kow for Azo Disperse Dyes (14 in total) found in Canadian commerce was in the range of 3.6-5.1. The higher end (log Kow = 5.1) of this range was used to derive protective estimates for the sediment PEC.
log Kow = 5.1, or Kow = 125 893
The ratio of the aquatic PEC to the concentration in the aqueous phase (Cw) was calculated:
Aquatic PEC/Cw = 1 + (XpsFdocApoc + XdsFdocAdoc)Kow
= 1 + [(4.7 × 10⁻⁵ kg/L × 0.1 kg OC/kg × 0.41 L/kg OC) + (2.7 × 10⁻⁶ kg OC/L × 0.08 L/kg OC) × 125 893]
= 1 + 0.27 = 1.27
As an example, the aquatic PEC associated with one facility in Quebec was estimated as 5.6 μg/L. The concentration in the aqueous phase (Cw) was then calculated from the ratio of the aquatic PEC to Cw:
Cw = Aquatic PEC/1.27 = 5.6 μg/L / 1.27 = 4.41 μg/L
Gobas (2010) suggested a default value of 0.01-0.03 kg OC/kg for the OC fraction of bottom sediment in rivers. The higher end of this range was selected as a standard for the sediment PECs derived.
Foc = 0.03 kg OC/kg
As for particulate suspended sediment, the sorptive capacity of bottom sediment's OC was taken as 0.41 L/kg OC, based on the work from Karickhoff (1981).
Aoc = 0.41 L/kg OC
The sediment PEC for the facility in Quebec used as an example was then estimated from the above values:
Sediment PEC = FocAocKowCw
= 0.03 kg OC/kg × 0.41 L/kg OC × 125 893 × 4.41 μg/L
= 1548 L/kg × 4.41 μg/L
= 6867 μg/kg
= 6.9 mg/kg
The sediment PECs for all other facilities were estimated according to the above method.
Predicted Environmental Concentrations (PECs) in soil
An approach described by the European Chemicals Agency (ECHA 2010) was used to estimate PECs in soil resulting from the land application of wastewater biosolids. This approach employed the quantity of biosolids accumulated within the top 20 cm layer (ploughing depth) of soil over 10 consecutive years as the basis for soil PECs. One underlying assumption of the approach was that substances were subject to no loss due to degradation, volatilization, leaching, or soil runoff upon their entry into soil via biosolids land application. This assumption therefore yielded conservative soil PECs.
When the above conservative approach was applied to Azo Disperse Dyes, their concentrations of the disperse dyes in biosolids was first estimated at each site. The data required for this estimate included the daily quantity of Azo Disperse Dyes released to the sewer system from a facility, the sludge removal efficiency of the related wastewater treatment system, the per capita sludge production rate and the population served by the wastewater treatment system.
The daily quantity of Azo Disperse Dyes released to the sewer system from a facility was estimated previously in the aquatic PEC calculations. This quantity was 3.57 kg/day for the formulation of textile chemicals and 4.32 kg/day for textile dyeing facilities excluding one in Ontario, which had a lower daily release quantity of 1.8 kg/day (15 kg/day × 12%).
Daily release quantity of disperse dyes to sewer system from a textile chemicals formulation facility = 3.57 kg/day
Daily release quantity of disperse dyes to sewer system from a textile dyeing facility = 4.32 kg/day (excluding one which released 1.8 kg/day)
Two computer models were used to estimate sludge removal efficiencies of wastewater treatment systems for Azo Disperse Dyes. One model was ASTreat (2006) for primary or secondary wastewater treatment systems. The other model was STP-EX (2008) for lagoons.
The principal model input parameter influencing the sludge removal was the octanol-water partition coefficient (Kow) or the solids-water partition coefficient. For the 14 disperse dyes found in Canadian commerce, the logarithm of Kow varied from 3.6 to 5.1. Hence, the removal estimated was in the range of 21.7-47.1% by ASTreat for primary treatment systems, 26.2-61.1% also by ASTreat for secondary treatment systems and 8.3-67.3% by STP-EX for lagoons. The higher value in each range was used to derive conservative soil PECs.
Primary wastewater treatment sludge removal for disperse dyes = 47.1%
Secondary wastewater treatment sludge removal for disperse dyes = 61.1%
Lagoon treatment sludge removal for disperse dyes = 67.3%
As an example, the wastewater treatment system for one facility in Quebec was a secondary system, so its sludge removal was 61.1 %.
The daily quantity of Azo Disperse Dyes sorbed to sludge was estimated by multiplying the daily release quantity by the sludge removal. For the facility used as an example,
Daily quantity of disperse dyes sorbed to sludge
= Daily release quantity of disperse dyes to sewer system from a facility × Wastewater treatment sludge removal
= 4.32 kg/day (textile dyeing facility) × 61.1 %
= 2.64 kg/day
The per capita sludge production rate depends upon the type of the off-site wastewater treatment. This rate was reported to be 0.080 kg/day per person for primary sludge and 0.115 kg/day per person for secondary sludge (Droste 1997). In other words, the per capita sludge production rate was 0.080 kg/day per person from primary systems and 0.195 kg/day per person from secondary systems (primary sludge rate at 0.080 kg/day per person + secondary sludge rate at 0.115 kg/day per person). The higher rate from secondary systems was mainly attributed to the biomass production during biological treatment. No data were found for lagoons, but large settling pond lagoons were expected to have similar solids removal to primary clarifiers. The sludge production rate from lagoons was therefore approximated as the rate from primary systems.
Per capita sludge production rate from primary systems = 0.080 kg/day per person
Per capita sludge production rate from secondary systems = 0.195 kg/day per person
Per capita sludge production rate from lagoons = 0.080 kg/day per person
As an approximation, the daily quantity of biosolids produced from an off-site wastewater treatment system was assumed to equal the daily quantity of sludge produced. This daily quantity was calculated by multiplying the sludge production rate by the population served by the off-site wastewater treatment system. For example, the off-site wastewater treatment system for the facility used as an example was a secondary system and served a population of 53 900 persons. The daily quantity of biosolids produced is estimated below:
Daily quantity of biosolids produced from a secondary system
= Per capita sludge production rate from a secondary system × Population served by the system
= 0.195 kg/day per person × 53 900 persons
= 10 511 kg/day
The concentration of Azo Disperse Dyes in biosolids was obtained by dividing the daily quantity of Azo Disperse Dyes sorbed to sludge by the daily quantity of biosolids produced from a wastewater treatment system.
Concentration of disperse dyes in biosolids
= Daily quantity of disperse dyes sorbed to sludge ÷ Daily quantity of biosolids produced
= 2.64 kg/day ÷ 10 511 kg/day
= 0.000 25 kg/kg
= 0.25 g/kg
The annual quantity Azo Disperse Dyes entering soil via biosolids land application is a function of not only the concentration of Azo Disperse Dyes in biosolids, but also the biosolids application rate. In Canada, the use of biosolids is regulated by the provinces and territories. The rate at which biosolids are land applied can therefore vary between different provinces and territories. Summarized in E1 are biosolids application rates found for four provinces.
| Province | Application rate (t/ha) | Application period (years) | Annual application rate (t/ha per year) | Reference |
|---|---|---|---|---|
| Ontario | 8 | 5 | 1.6 | MOE and OMAFRA 1996 |
| Quebec | 22 | 5 | 4.4 | MENV 2004 |
| British Columbia | 17 | 5 | 3.4 | McDougall and Van Ham 2002 |
| Alberta | 25 | 3 | 8.3 | Alberta Environment 2009 |
The annual quantity of the disperse dyes entering soil via biosolids land application was calculated by multiplying the concentration of the disperse dyes in biosolids by the annual application rate of the province/territory where the biosolids were generated. The underlying assumption in this calculation was that biosolids were used in nearby areas at their maximum allowed quantity. For locations such as those in Nova Scotia, where application rates were not available, the maximum rate given in Table E1, i.e., 8.3 t/ha per year in Alberta, was used as a conservative estimate. For the facility in Quebec used as an example, the applicable rate was 4.4 t/ha per year, and the annual quantity of Azo Disperse Dyes entering soil from the biosolids produced at this site was calculated:
Annual quantity of disperse dyes entering soil
= Concentration of disperse dyes in biosolids × Applicable biosolids annual application rate
= 0.25 g/kg × 4.4 t/ha per year
= 0.25 g/kg × 0.44 kg/m2 per year
= 0.11 g/m2 per year
According to the approach described by the European Chemicals Agency (ECHA 2010), a period of 10 consecutive years was used to determine the quantity of Azo Disperse Dyes accumulated over this period.
Quantity of disperse dyes accumulated in soil over 10 years
= Annual quantity of disperse dyes entering soil × 10 years
= 0.11 g/m2 per year × 10 years
= 1.1 g/m2
To derive the concentration of the disperse dyes in soil, the quantity of soil within the top 20 cm or 0.20 m layer as per the European Chemicals Agency (ECHA 2010) was estimated from a dry soil density of 1200 kg/m3 (Williams 1999):
Quantity of soil = Soil depth × Soil density
= 0.20 m × 1200 kg/m3
= 240 kg/m2
The soil PEC associated with a facility was then estimated by dividing the quantity of Azo Disperse Dyes accumulated in soil over 10 years by the quantity of soil. For Site 19:
Soil PEC of disperse dyes
= Quantity of disperse dyes accumulated in soil over 10 years / Quantity of soil
= 1.1 g/m2 / 240 kg/m2
= 0.0046 g/kg
= 4.6 mg/kg
The soil PECs for all other facillities were estimated according to the above method.
Appendix F: Azo Disperse Dyes with effects of concern
Ecological Effects of Concern
Based on the available empirical toxicity data, it is considered that aquatic organisms are sensitive to azo disperse dyes with a molecular weight less than 360 g/mol that may demonstrate effects in aquatic organisms at or below their water solubiltity limits. Among 73 Azo Disperse Dyes in this subgroup, there are 8 substances having molecular weights below 360 g/mol. None of them have been identified in commerce in Canada and hence cause no environmental exposure. However these eight substances, along with other azo disperse dyes on the DSL with a molecular weight less than 360 g/mol are considered to be associated with effects of concern, based on their hazard properties. These substances are likely to cause ecological harm if used in Canada.
| CAS RN | C.I. name | Molecular weight (g/mol) |
|---|---|---|
| 6250-23-3 | Disperse Yellow 23 | 302 |
| 65122-05-6 | NA | 306 |
| 6300-37-4 | Disperse Yellow 7 | 316 |
| 21811-64-3 | Disperse Yellow 68 | 318 |
| 27184-69-6 | NA | 346 |
| 6657-00-7 | NA | 346 |
| 69472-19-1 | Disperse Orange 33 | 351 |
| 6253-10-7 | Disperse Orange 13 | 352 |
Human health effects of concern
Some of the Azo Disperse Dyes in this assessment are suspected of having human health effects of concern based on potential carcinogenicity. The details for supporting the potential carcinogenicity for these substances are outlined in section 7.2.1 Health Effects Assessment (see specific sub-sections), and generally based on one or more of the following lines of evidence:
- Classifications by national or international agencies for carcinogenicity (may be a group classification).
- Evidence of carcinogenicity in animal studies and/or human epidemiology based on the specific substance.
- Potential to release one or more of the EU22 aromatic amines by azo bond cleavage.
- Read-across to related substances for which one or more of the above lines of evidence apply.
| Substance Names and CAS RN | Classification for carcinogenicityFootnoteTable F2[b] | Evidence of carcinogenicity from animal studies and/or human epidemiology | Release of EU22 aromatic amine by azo bond cleavageFootnote[a]Table F2[a] | Read-across |
|---|---|---|---|---|
| 58104-55-5a | - | - | p-Aminoazobenzene | - |
| 65122-05-6a | - | - | o-Anisidine | - |
| Disperse Red 151 70210-08-1a |
- | - | p-Aminoazobenzene | - |
Appendix G: Conservative Exposure Estimates to Azo Disperse Dyes via use of textiles and leather products
Dermal Exposure from Textiles: Personal Apparel Worn by Adults and Baby Sleeper
A conservative exposure estimate to Azo Disperse Dyes is based on full body coverage from wearing clothing, assuming to account for exposures from multiple pieces of apparel that cover the entire surface area of the body.
Estimated Daily Exposure via Dermal Route from Textile Apparel & Baby Sleeper
= (SA × AW × SCF × C × M × F × P × DA) / BW
Oral Exposure from Mouthing of Textile Objects by Infants
Oral exposure to Azo Disperse Dyes is estimated based on a scenario assuming that the infant is mouthing a textile object (e.g., blanket, textile toy) that may release Azo Disperse Dyes. Conservatism is built in exposure factors described below.
Estimated Daily Exposure via Oral Route from Mouthing Textile Object
= (SA × AW × C × M × F × P) / BW
Exposure factors
SA: Total surface area (dermal) = 18 200 cm2 (adult), 3020 cm2 (infant) (Health Canada 1995)
Total surface area (oral: textile object mouthed) = 20 cm2 (Zeilmaker et al. 1999)
AW: Area weight of textile = 20 mg/cm2 (US EPA 2012a)
The area weight of textiles can vary greatly depending on the type of material. An area weight of 20 mg/cm2 for cotton textiles is recommended by the US EPA in "Standard Operating Procedures for Residential Pesticide Exposure Assessment" (US EPA 2012a).
SCF: Skin contact factor = 1
Based on a conservative estimate that the 100% of the full body coverage of clothing being in direct contact with the skin (i.e., SCF = 1).
C: Concentration in textile = 0.01 (unitless) (BfR 2007)
Based on the default model developed by the "Textiles" Working Group established at the German Federal Institute for Risk Assessment (BfR 2007), assuming that a standard textile garment of 100 g/m2 is dyed with 1% active dye ingredient.
M: Migration fraction = 0.0005 (BfR 2007)
The migration of azo dyes from textiles varies considerably depending on the type of fibre, the type of dye used, the dye load, dyeing technology and colour intensity and after treatment. The dermal exposure from textiles is partly dictated by the amount of dye that migrates from textile material onto human skin (ETAD 1983b). The "Textiles" Working Group (BfR 2007) uses a peak initial migration of 0.5% to estimate exposure to dyes from newly bought unwashed garments. The migration rate after 28 hours of simulated wash and wear cycles was observed to be less than one-tenth of the value measured for the first migration. The migration fraction of 0.0005 which is one-tenth of the peak initial migration (0.5%) is used to reflect exposure after the intial washes. It is assumed that the sweat migration rate is similar to the salivary migration rate; this is consistent with observations of leaching behaviours of dyes from textiles reported by Zeilmaker et al. (1999).
F: Exposure frequency = 1×/day
P: Probability that an Azo Disperse Dye is present in textiles = 10%.
In the RIVM risk assessment of azo dyes and aromatic amines from garments and footwear (Zeilmaker et al. 1999), the authors derived a chance of 8% for the appearance of carcinogenic azo dyes and aromatic amines in garments based on four European studies. Presumably, there would be a higher prevalence in the use of non-EU22 amines and their dyes, compared to EU22 amines and related dyes, since the former are not prohibited. Disperse Blue 79:1, Disperse Orange 30, Disperse Blue 79, ANAM, Disperse Brown 1:1, Disperse Brown 1, Disperse Red 167, BANAP, CAS RN 52697-38-8, Disperse Orange 61, CAS RN 63833-78-3 and ANMOM do not derive from EU22 amines; the prevalence of these dyes is not clear because there is relatively limited product testing and monitoring on non-EU22 amines and associated dyes. Based on data available (Danish EPA 1998; Kawakami 2012; Health Canada 2013), the prevalence of certain non-EU22 amines was found to range from 0% to 23.7% (aniline). Since several dyes can derive from a given aromatic amine, the prevalence of an associated dye would be lower. Given the conservatism used in other parameters in this exposure scenario (e.g. full body coverage), the probability that a given dye is present in a textile is assumed to be 10% in this Screening Assessment based on professional judgement. This is considered reasonable since the chances of an individual's outfit containing the same dye every day are low.
DA: Dermal Absorption Uptake Fraction = 0.02 to 0.27
Using BfR's recommended dermal absorption percentage of 2% in areas of high perspiration (BfR 2007) and the relatively higher reported dermal absorption of 26.4% for Disperse Yellow 97 (Collier et al. 1993), a reasonable range of 2 to 27% was used to estimate dermal exposure in this Screening Assessment.
BW: Body weight = 70.9 kg for adult, 7.5 kg for infant (Health Canada 1998)
Estimated Daily Exposures to Azo Disperse Dyes from textiles via the dermal route
Baby Sleeper: 4.0 × 10⁻² mg/kg-bw per day
Personal Apparel: 2.6 × 10⁻² mg/kg-bw per day
Estimated Daily Exposure to Azo Disperse Dyes via oral route for infants
2.7 × 10⁻⁴ mg/kg-bw per day