
Draft screening assessment - Dicyclopentadiene
Official title: Draft screening assessment 4,7-Methano-1H-indene, 3a,4,7,7a-tetrahydro- (Dicyclopentadiene)
Chemical Abstracts Service Registry Number 77-73-6
Environment and Climate Change Canada
Health Canada
December 2019

Synopsis
Pursuant to section 74 of the Canadian Environmental Protection Act, 1999 (CEPA), the Minister of the Environment and the Minister of Health have conducted a screening assessment of 4,7-methano-1H-indene, 3a,4,7,7a-tetrahydro-, hereinafter referred to as dicyclopentadiene (DCPD). The Chemical Abstracts Service Registry Number (CAS RNFootnote 1) for DCPD is 77-73-6. This substance was identified as a priority for assessment as it met categorization criteria under subsection 73(1) of CEPA.
DCPD does not naturally occur in the environment. According to information submitted in a survey issued pursuant to section 71 of CEPA, the total manufactured quantity reported in Canada in 2011 was over 10 000 000 kg and the total import quantity was in the range of 1 000 000 to 10 000 000 kg.
DCPD is primarily used in industrial applications such as the manufacture of petroleum feedstock, and paints and coatings, and is used as an intermediate in the manufacturing of building or construction materials. It is also identified as a minor constituent in products available to consumers such as automotive engine oil enhancers and gasoline. DCPD may be used in food packaging materials.
The ecological risk of DCPD was characterized using the ecological risk classification of organic substances (ERC), which is a risk-based approach that employs multiple metrics for both hazard and exposure, with weighted consideration of multiple lines of evidence for determining risk classification. Hazard profiles are based principally on metrics regarding mode of toxic action, chemical reactivity, food web-derived internal toxicity thresholds, bioavailability, and chemical and biological activity. Metrics considered in the exposure profiles include potential emission rate, overall persistence, and long-range transport potential. A risk matrix is used to assign a low, moderate or high level of potential concern for substances on the basis of their hazard and exposure profiles. Based on the outcome of ERC analysis, DCPD is considered unlikely to be causing ecological harm.
Considering all available lines of evidence presented in this draft screening assessment, there is low risk of harm to the environment from DCPD. It proposed to conclude that DCPD does not meet the criteria under paragraphs 64(a) or (b) of CEPA as it is not entering the environment in a quantity or concentration or under conditions that have or may have an immediate or long-term harmful effect on the environment or its biological diversity or that constitute or may constitute a danger to the environment on which life depends.
Modelled data suggest that the potential for exposure to DCPD via environmental media and food is negligible for the general population of Canada. There is no potential for direct food contact associated with its use in food packaging materials. The predominant sources of DCPD exposure to the general public are from use of automotive engine oil enhancers, refuelling with gasoline, and from evaporative emissions in the vicinity of gasoline service stations and gasoline bulk storage facilities.
DCPD has been reviewed internationally through the Cooperative Chemicals Assessment Programme of the Organisation for Economic Cooperation and Development and the National Center for Environmental Assessment of the United States Environmental Protection Agency, and existing reviews were used to inform the assessment of potential health effects of DCPD. In laboratory studies, potential health effects of DCPD include effects on kidneys and adrenal glands.
Margins between estimated exposure to DCPD from the use of automotive engine oil enhancers, refuelling with gasoline, and from evaporative emissions in the vicinity of gasoline service stations and gasoline bulk storage facilities, and levels at which critical health effects were observed, are considered adequate to address uncertainties in the health effects and exposure databases.
On the basis of the information presented in this draft screening assessment, it is proposed to conclude that DCPD does not meet the criteria under paragraph 64(c) of CEPA as it is not entering the environment in a quantity or concentration or under conditions that constitute or may constitute a danger in Canada to human life or health.
It is therefore proposed to conclude that DCPD does not meet any of the criteria set out in section 64 of CEPA.
1. Introduction
Pursuant to section 74 of the Canadian Environmental Protection Act, 1999 (CEPA) (Canada 1999), the Minister of the Environment and the Minister of Health have conducted a screening assessment of 4,7-methano-1H-indene, 3a,4,7,7a-tetrahydro-, hereinafter referred to as dicyclopentadiene (DCPD), to determine whether the substance presents or may present a risk to the environment or to human health. This substance was identified as a priority for assessment as it met categorization criteria under subsection 73(1) of CEPA (ECCC, HC [modified 2017]).
The ecological risk of DCPD was characterized using the ecological risk classification of organic substances (ERC) approach (ECCC 2016a). The ERC describes the hazard of a substance using key metrics including mode of toxic action, chemical reactivity, food web-derived internal toxicity thresholds, bioavailability, and chemical and biological activity and considers the possible exposure of organisms in the aquatic and terrestrial environments on the basis of such factors as potential emission rates, overall persistence and long-range transport potential in air. The various lines of evidence are combined to identify substances as warranting further evaluation of their potential to cause harm to the environment or as having a low likelihood of causing harm to the environment.
DCPD has been reviewed internationally through the Organisation for Economic Co-operation and Development (OECD) Cooperative Chemicals Assessment Programme, and a Screening Information Data Set (SIDS) and Initial Assessment Report (SIAR) are available (OECD 1998, OECD 2002). These assessments undergo rigorous review (including peer-review) and endorsement by international governmental authorities. Health Canada and Environment and Climate Change Canada are active participants in these processes and consider these assessments to be reliable. In addition, the health effects of DCPD have been reviewed by the National Center for Environmental Assessment of the United States Environmental Protection Agency (US EPA 2014). These OECD and US EPA assessments were used to inform the health effects characterization in this screening assessment.
This draft screening assessment includes consideration of information on chemical properties, environmental fate, hazards, uses and exposures, including additional information submitted by stakeholders. Relevant data for DCPD were identified up to December 2018. Empirical data from key studies as well as results from models were used to reach proposed conclusions. When available and relevant, information presented in assessments from other jurisdictions was considered.
This draft screening assessment was prepared by staff in the CEPA Risk Assessment Program at Health Canada and Environment and Climate Change Canada and incorporates input from other programs within these departments. The ecological portion of this assessment is based on the ERC document (published July 30, 2016), which was subject to an external review as well as a 60-day public comment period. While external comments were taken into consideration, the final content and outcome of this draft screening assessment remain the responsibility of Health Canada and Environment and Climate Change Canada.
This draft screening assessment focuses on information critical to determining whether the substance meets the criteria as set out in section 64 of CEPA by examining scientific information and incorporating a weight of evidence approach and precaution.Footnote 2 This draft screening assessment presents the critical information and considerations on which the proposed conclusion is based.
2. Substance identity
The Chemical Abstracts Service Registry Number (CAS RNFootnote 3), Domestic Substance List (DSL) name, common name and abbreviation for DCPD are presented in Table 2-1.
| CAS RN | DSL name (common name; abbreviation) | Chemical structure and molecular formula | Molecular weight (g/mol) |
|---|---|---|---|
| 77-73-6 | 4,7-Methano-1H-indene, 3a,4,7,7a-tetrahydro- (dicyclopentadiene; DCPD) | 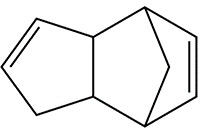 C10H12 C10H12 |
132.21 |
3. Physical and chemical properties
A summary of physical and chemical property data for DCPD are presented in Table 3-1. Additional physical and chemical properties are reported in ECCC (2016b).
| Property | Range | Key reference(s) |
|---|---|---|
| Physical state | Crystalline solid (liquid above 32.22°C) | PubChem 2004- |
| Melting point (°C) | 32.9 | PubChem 2004- |
| Boiling point (°C) | 172 | PubChem 2004- |
| Vapour pressure (Pa at 20°C) | 180 | PubChem 2004- |
| Henry’s law constant (Pa·m3/mol) | 830 | OECD 2002a |
| Water solubility (mg/L 25°C) | 20 | PubChem 2004- |
| Log Kow (dimensionless) | 2.78 | PubChem 2004- |
Abbreviations: Kow, octanol-water partition coefficient
4. Sources and uses
DCPD does not occur naturally in the environment.
DCPD has been included in a survey issued pursuant to a CEPA section 71 notice (Canada 2012). According to information submitted in the survey, the total manufactured quantity reported in Canada in 2011 was over 10 000 000 kg and the total import quantity was in the range of 1 000 000 to 10 000 000 kg. In Canada, DCPD is primarily used in industrial applications such as the manufacture of petroleum feedstockFootnote 4, and paints and coatings, and is used as an intermediate in the manufacturing of building or construction materials (Environment Canada 2013). While DCPD is mainly used in industrial applications, it has been identified as a minor constituent in a few products available to consumers in Canada such as gasoline (Olivella et al 2002, Pavlova 2004) and automotive engine oil enhancers (MSDS 2012). DCPD may also be used in the manufacture of a resin that may be used as an adhesive in the production of food packaging materials [personal communication, e-mails from Food Directorate (FD), HC, to Existing Substances Risk Assessment Bureau (ESRAB), HC, dated July 16 and Nov 28, 2018; unreferenced].
DCPD has been reported under Canada’s National Pollutant Release Inventory (NPRI) since 1999, with the highest total on-site release quantity of 20 000 kg per year in 2002 and the lowest release quantity of 950 kg per year in 2013. Overall, the on-site release quantity has decreased from 1999 to 2017 (Figure 4‑1). The majority (97%) of the DCPD releases were reported from the petrochemical manufacturing, petroleum refineries, resin and synthetic rubber manufacturing, and other basic organic chemical manufacturing sectors. Table 4‑1 summarizes the various types of on-site releases of DCPD from 2013 to 2017 (NPRI 2018).

Figure 4‑1. Changes over time of total on-site releases of DCPD in Canada from 1999 to 2017 (NPRI 2018)
The figure shows the changes of total on-site release quantity (tonne/year) of DCPD over time, with the overall decreasing trend from 1999 to 2017.
| Reporting year | On-site releases to aira (kg/year) | On-site releases to water | On-site releases to land | Total on-site releases (kg/year) |
|---|---|---|---|---|
| 2017 | 7 | NR | NR | 1121 |
| 2016 | NR | NR | NR | 1001 |
| 2015 | 1448 | NR | NR | 2148 |
| 2014 | 632 | NR | NR | 2422 |
| 2013 | 867 | NR | NR | 950 |
Abbreviation: NR, Not Reported.
a Some facilities specified the quantity of DCPD released to each environmental media; however, only the total releases may be reported when total releases were less than one tonne. What is presented in this table is the sum of quantities reported under the NPRI for each environmental medium.
5. Potential to cause ecological harm
5.1 Characterization of ecological risk
The ecological risk of DCPD was characterized using the ecological risk classification of organic substances (ERC) approach (ECCC 2016a). The ERC is a risk-based approach that considers multiple metrics for both hazard and exposure on the basis of weighted consideration of multiple lines of evidence for determining risk classification. The various lines of evidence are combined to discriminate between substances of lower or higher potency and lower or higher potential for exposure in various media. This approach reduces the overall uncertainty with risk characterization compared to an approach that relies on a single metric in a single medium (e.g., median lethal concentration [LC50]) for characterization. The following summarizes the approach, which is described in detail in ECCC (2016a).
Data on physical-chemical properties, fate (chemical half-lives in various media and biota, partition coefficients, and fish bioconcentration), acute fish ecotoxicity, and chemical import or manufacture volume in Canada were collected from the scientific literature, available empirical databases (e.g., OECD QSAR Toolbox 2016), and from responses to surveys conducted under section 71 of CEPA, or they were generated using selected (quantitative) structure-activity relationship ([Q]SAR) or mass-balance fate and bioaccumulation models. These data were used as inputs to other mass-balance models or to complete the substance hazard and exposure profiles.
Hazard profiles were based principally on metrics regarding mode of toxic action, chemical reactivity, food web-derived internal toxicity thresholds, bioavailability, and chemical and biological activity. Exposure profiles were also based on multiple metrics, including potential emission rate, overall persistence, and long-range transport potential. Hazard and exposure profiles were compared to decision criteria in order to classify the hazard and exposure potentials for each organic substance as low, moderate, or high. Additional rules were applied (e.g., classification consistency, margin of exposure) to refine the preliminary classifications of hazard or exposure.
A risk matrix was used to assign a low, moderate or high classification of potential risk for each substance on the basis of its hazard and exposure classifications. ERC classifications of potential risk were verified using a two-step approach. The first step adjusted the risk classification outcomes from moderate or high to low for substances that had a low estimated rate of emission to water after wastewater treatment, representing a low potential for exposure. The second step reviewed low risk potential classification outcomes using relatively conservative, local-scale (i.e., in the area immediately surrounding a point-source of discharge) risk scenarios, designed to be protective of the environment, to determine whether the classification of potential risk should be increased.
ERC uses a weighted approach to minimize the potential for both over and under classification of hazard and exposure and subsequent risk. The balanced approaches for dealing with uncertainties are described in greater detail in ECCC (2016a). The following describes two of the more substantial areas of uncertainty. Error with empirical or modeled acute toxicity values could result in changes in classification of hazard, particularly metrics relying on tissue residue values (i.e., mode of toxic action), many of which are predicted values from (Q)SAR models (OECD QSAR Toolbox 2016). However, the impact of this error is mitigated by the fact that overestimation of median lethality will result in a conservative (protective) tissue residue value used for critical body residue (CBR) analysis. Error with underestimation of acute toxicity will be mitigated through the use of other hazard metrics such as structural profiling of mode of action, reactivity and/or estrogen binding affinity. Changes or errors in chemical quantity could result in differences in classification of exposure as the exposure and risk classifications are highly sensitive to emission rate and use quantity. The ERC classifications thus reflect exposure and risk in Canada on the basis of what is calculated to be the current use quantity, and may not reflect future trends.
Critical data and considerations used to develop the substance-specific profiles for DCPD, and the hazard, exposure and risk classification results, are presented in ECCC (2016b).
On the basis of low hazard and low exposure classifications according to information considered under ERC, DCPD was classified as having a low potential for ecological risk. It is unlikely that this substance is resulting in concerns for the environment in Canada.
6. Potential to cause harm to human health
6.1 Exposure assessment
Exposure of the general population to DCPD can result from the use of automotive engine oil enhancers, refuelling with gasoline, evaporative emissions in the vicinity of a gasoline service station and a gasoline bulk storage facility, and its release to the environment during production, use or disposal of the substance or products containing it.
6.1.1 Environmental media and food
No measured concentrations of DCPD in air, drinking water, soil, or dust were identified in Canada. However, industrial releases of DCPD were reported under the NPRI from 1999 to 2017. Thus, concentrations in environmental media were estimated using ChemCAN (2003) based on the highest industrial release quantity of DCPD reported in the years of 2013 to 2017 under the NPRI, which was 2 422 kg/year in 2014 (NPRI 2018). The potential environmental distribution of DCPD was obtained from a Mackay level III fugacity model assuming 100% release to water as per OECD approach (OECD 2002a). The predicted environmental concentrations (PECs) of DCPD are 1.77 x 10⁻⁶ µg/m3 in air, 6.32 x 10⁻⁵ µg/L in surface water, and 1.22 x 10⁻¹⁰ µg/kg in both soil and dust. Total daily intakes of DCPD via environmental media were derived using these PECs, which resulted in negligible exposures.
Internationally, DCPD has been measured in wastewater treatment plant effluent, surface water, and groundwater in the US and Europe in the early 1990s (HSDB 1983- , Ventura et al. 1997). However, these values are not expected to reflect current Canadian conditions or use and may be more reflective of potential contamination of a specific water source. Thus modelled environmental media values were derived based on the NPRI data (2018).
Given no Canadian monitoring data for DCPD in fish was identified, estimates were derived (2.43 x 10⁻⁵ µg/g) based on the PEC of DCPD in surface water and the highest bioconcentration factor (BCF) of 384 L/kg measured in carp (OECD 2002a). Total daily intake of DCPD via fish was derived using this concentration, which resulted in negligible exposure.
DCPD may be used as a raw material in the manufacture of a resin, which may be used as an adhesive in the production of food packaging materials; however, the residual level of the raw material in the finished resin is negligible (personal communication, e-mails from FD, HC to ESRAB, HC, dated July 16 and Nov 28, 2018; unreferenced). Additionally, the adhesive is not intended to be used in packaging with direct food contact, and thus exposure to DCPD from its use in food packaging materials is not expected (personal communication, e-mails from FD, HC to ESRAB, HC, dated July 16 and Nov 28, 2018; unreferenced).
6.1.2 Products available to consumers
Although DCPD has many industrial applications, it is only used as a chemical intermediate in these applications and is believed to be fully consumed in the production process and therefore is not expected to be present in the final product (HSDB 1983- , OECD 2002a).
While DCPD is not reported to be used in products available to consumers in Canada (Environment Canada 2013), it has been identified as a minor constituent in gasoline (Olivella et al. 2002, Pavlova 2004) and automotive engine oil enhancers (MSDS 2012), which are expected to be available to Canadian consumers. These two products were selected to estimate the potential for exposure to DCPD. The scenarios that were considered are the exposures from the use of automotive engine oil enhancers, refuelling with gasoline, and from evaporative emissions in the vicinity of a gasoline service station and a gasoline bulk storage facility.
It was assumed that dermal and inhalation exposure could occur from the use of automotive engine oil enhancers when applied to a car engine (Table 6-1). A thin film approach (US EPA 1986a,b) and ConsExpo Web (2018) were used to estimate dermal and inhalation exposure to this product, respectively.
Vehicle refuelling is considered to be the predominant source of potential exposure of the general population to DCPD in gasoline. Refuelling may result in dermal exposure to DCPD in gasoline, since there is the potential for accidental contact through fuel splashes/spills or pump nozzle drips (Table 6-1). Refuelling may also result in short-term inhalation exposures to DCPD in gasoline vapours during each refuelling event, and intermittent exposures from periodic refuelling over the long term (Table 6-1).
| Duration and route of exposure | Scenario | DCPD concentration in product | Dermal (mg/kg bw) or inhalation (mg/m3) exposure estimates |
|---|---|---|---|
| Per event dermal exposure | Automotive engine oil enhancer | 0.0833% | 1.89E-03 mg/kg bw |
| Per event dermal exposure | Refuelling with gasoline (fuel splashes/spills or pump nozzle drips) | 0.03136% w/v (0.0003136 kg/L) | 3.65E-04 mg/kg bw |
| Intermittent inhalation exposure | Refuelling with gasoline | 0.03136% w/v (0.0003136 kg/L) | 2.46E-06b mg/m3 |
| Per event inhalation exposure | Refuelling with gasoline | 0.03136% w/v (0.0003136 kg/L) | 2.48E-03c mg/m3 |
| Per event inhalation exposure | Automotive engine oil enhancer | 0.0833% | 0.0999d mg/m3 |
a It was assumed that these scenarios are relevant to adults only.
b This concentration is representative of intermittent exposure (i.e., once a week) to DCPD in gasoline from periodic refuelling amortized over one year, and is derived as follows: intermittent inhalation exposure = [2.48E-03 mg/m3 × 1 day/24 hours × 0.167 hours/event × 1 event/7 days]. More details on parameters are provided in Appendix A.
c This is the maximum concentration of DCPD over 1 hour, at a distance of 1 m from the center of a gasoline service station (shortest distance for the modelled results), based on the results of modelling gasoline evaporative emissions with SCREEN3 (Table A-3).
d This concentration represents an exposure amortized over a 6-hour period (multiply by ‘exposure duration/6-hour) to align durations of treatment per day in the toxicity study and duration of exposure to DCPD during use engine oil enhancer.
In addition to exposure during refuelling, daily inhalation of DCPD from exposure to evaporative emissions of gasoline containing DCPD is considered in this assessment; this would be for individuals residing in the vicinity of a gasoline service station or a gasoline bulk storage facility (Table 6-2). Both average and upper-bound DCPD evaporative emission scenarios were characterized for individuals residing near a service station. The average evaporative emission scenario in the vicinity of a gasoline service station was developed by assuming an evaporative loss of 0.25% of the overall gasoline throughput in a service station (Joyce and Stoneburner 1973), an average gasoline throughput of 3.6 million L/year in Canada (Statistics Canada 2012), and a maximum DCPD concentration of 0.03136% w/v (0.0003136 kg/L) in gasoline (Olivella et al. 2002). This results in a DCPD emission rate of 8.95E-05 g/second. The upper-bound evaporative emission scenario was developed by assuming an evaporative loss of 0.5% of the overall gasoline throughput (Statistics Canada 2012, Tiberi 2000), a gasoline throughput upper range volume of 7.0 million L/year in urban Toronto (MJ Ervin & Associates 2008), and a maximum DCPD concentration of 0.03136% w/v (0.0003136 kg/L) in gasoline (Olivella et al. 2002), resulting in a DCPD emission rate of 3.48E-04 g/second. The exposure scenario was developed for individuals living in the vicinity of a gasoline service station. The parameters used to model the dispersion of DCPD releases from service stations are given in Table A-2 (Appendix A).
A conservative approach was used to estimate exposure to DCPD emissions of individuals residing near a gasoline bulk storage facility. An emission range for benzene (0.02 to 0.10 kg/hr per tank) from gasoline storage tanks with floating roof (Spectrasyne 2011) was used as a surrogate for a DCPD emission rate. This was considered appropriate since benzene has a higher vapour pressure (10,000 Pa at 20°C) and a lower boiling point (80°C) compared to DCPD (PubChem 2004- ). The exposure scenario was developed for individuals living in the vicinity of a gasoline bulk storage facility with two floating roof storage tanks. The input parameters used to model the releases are given in Table A-4 (Appendix A).
Dermal exposure to DCPD during vehicle refuelling was estimated using a thin film approach (US EPA 2011). Inhalation exposures to DCPD from refuelling and evaporative emissions of gasoline were estimated using the in-house algorithmFootnote 5 and SCREEN3 (SCREEN3 2011), respectively.
| Duration and route of exposure | Scenario | Distance from release sourceb (m) | Maximum daily concentrationc (mg/m3) |
|---|---|---|---|
| Daily inhalation exposure | Average evaporative emission in the vicinity of a gasoline service stationd | 100 | 6.02E-05 |
| Daily inhalation exposure | Upper-bound evaporative emission in the vicinity of a gasoline service statione | 100 | 2.34E-04 |
| Daily inhalation exposure | Lower emission in the vicinity of a gasoline bulk storage facilityf | 300 | 8.23E-04 |
| Daily inhalation exposure | Higher emission in the vicinity of a gasoline bulk storage facilityg | 300 | 4.61E-03 |
a It was assumed that these scenarios are relevant to adults only. A maximum DCPD concentration of 0.03136% w/v (0.0003136 kg/L) in gasoline was used for all scenarios (Olivella et al. 2002).
b Values chosen based on the photomap analysis of where residences may be located relative to a gasoline service station and a gasoline bulk storage facility (professional judgement).
c Yearly amortized concentration, based on the maximum 1-hour concentration determined by SCREEN3 air dispersion modelling (US EPA 1992; SCREEN3 2011). SCREEN3 gives the maximum concentrations of a substance at chosen receptor heights and at various distances from a release source one hour after a given release event (i.e., maximum 1 hour concentration). Amortization was done by multiplying the maximum 1-hour concentration by a factor of 0.2.
d Gasoline volume throughput: 3.6E6 L/year; loss rate via evaporative emissions: 0.25%; DCPD in gasoline: 0.03136% w/v (0.0003136 kg/L); average DCPD emission rate: 8.95E-05 g/s; receptor at 1.74 m above ground.
e Gasoline volume throughput: 7E6 L/year; loss rate via evaporative emissions: 0.5%; DCPD in gasoline: 0.03136% w/v (0.0003136 kg/L); upper-bound DCPD emission rate: 3.48E-04 g/s; receptor at 1.74 m above ground.
f Estimated from SCREEN3 air dispersion modelling based on lower benzene emissions rate of 0.02 kg/hour per tank.
g Estimated from SCREEN3 air dispersion modelling based on higher benzene emissions rate of 0.10 kg/hour per tank.
6.2 Health effects assessment
OECD characterized the health effects for DCPD (OECD 1998, 2002a). The US EPA also reviewed the health effects literature for DCPD to derive provisional peer-reviewed toxicity values (US EPA 2014). The OECD and US EPA reports were used to inform the health effects characterization in this screening assessment. The European Chemicals Agency (ECHA) also has a registration dossier available for DCPD (ECHA c2007-2019). A literature search was conducted from the year prior to the OECD SIDS Initial Assessment Meeting (March 1997) to December 2018.
Available toxicokinetics data on DCPD from rats, mice and dogs indicate that DCPD is rapidly absorbed, metabolized and eliminated with terminal half-lives in plasma of 18 to 27 hours, and the majority excreted in urine (Litton Bionetics 1976 in ECHA c2007-2019).
The US EPA (2014) reported that in 13-week dietary studies no adverse effects were observed in Swiss albino mice, Sprague-Dawley (SD) rats (Hart 1976 in US EPA 2014) and Beagle dogs (Hart 1980 in US EPA 2014, also cited as Litton Bionetics 1980 in ECHA c2007-2019) up to the highest doses tested, approximately 50/68, 57/68, and 28/29 mg/kg bw/day in mice, rats, and dogs, respectively.
A combined repeated-dose and reproductive/developmental toxicity screening test was conducted in SD rats (MHW 1997 in OECD 2002a). Test animals were administered 0, 4, 20, or 100 mg/kg bw/day DCPD in olive oil (10/sex/dose) by gavage for 44 days in males and from 14 days prior to mating to day 4 of lactation (approximately 38 days) for females. At 4 mg/kg bw/day and above, an increase in hyaline droplets in the tubular epithelium of the kidney was observed in all males (MHW 1997). At 20 mg/kg bw/day and above there were other kidney effects (basophilic change of the tubular epithelium, increased absolute and relative kidney weights) and adrenal gland effects (an increase of fatty droplets in the fascicular zone) in males. At 100 mg/kg bw/day, there were also liver effects in males (single cell necrosis, increased absolute and relative liver weights, clinical chemistry changes) and effects in the adrenal glands (increase of fatty droplets in the fascicular zone) in a female. In addition, two females in the 100 mg/kg bw/day group died prior to pregnancy (necropsy indicated lung congestion, adrenal gland enlargement, thymic bleeding and gastric mucosal surface bleeding). At 100 mg/kg bw/day, two dams lost all neonates within two days (OECD 2002a). It was unclear whether this was due to a lack of nursing and/or matricide (MHW 1997, OECD 2002a, ECHA c2007-2019). This resulted in a decreased pup viability index on postnatal day (PND) 4 at 100 mg/kg bw/day. Pups in the 100 mg/kg bw/day group also had lower body weights (PNDs 0 and 4) and body weight gains (PND 0 to 4) relative to control pups (MHW 1997, ECHA c2007-2019). The OECD (2002a) reported no observed effect levels (NOELs) for males/females of 4/20 mg/kg bw/day [repeated-dose toxicity], 100/20 mg/kg bw/day [reproductive toxicity], and 100 mg/kg bw/day [offspring toxicity]. In this assessment the parental no observed adverse effect level (NOAEL) for males was considered to be 4 mg/kg bw/day based on the kidney and adrenal gland effects in males at the lowest adverse effect level (LOAEL) of 20 mg/kg bw/day.
Dietary doses of DCPD in SD rats did not result in adverse effects (e.g., parental, reproductive, or developmental) in a three-generation reproductive toxicity study [up to 750 ppm or approximately 34/48 mg/kg bw/day (males/females)] or in a developmental toxicity study (up to 750 ppm or 63 mg/kg bw/day) (Hart 1980 in US EPA 2014 and OECD 2002a, cited as Litton Bionetics 1978 in ECHA c2007-2019). In a one-generation (12 month) reproductive dietary study in minks, no reproductive effects were observed with up to approximately 170 mg/kg bw/day DCPD (Aulerich et al. 1979 in US EPA 2014). The US EPA (2014) selected a NOAEL of approximately 24 mg/kg bw/day based on reduced absolute body weight in kits observed at 4 weeks at 42 mg/kg bw/day.
In a 13-week inhalation study in B6C3F1 mice (Exxon 1980, Dodd et al. 1982 in US EPA 2014 and also published as Kransler 2014), the US EPA (2014) considered 27.5 mg/m3 as the no observed adverse effect concentration (NOAEC) based on mortality (mainly attributed to pulmonary congestion in both sexes, or renal failure in two males) at the highest dose of 270 mg/m3 (50.1 ppm) DCPD beginning at weeks 2 or 3.
Fischer 344 rats (51/sex/group) were exposed in a 13-week inhalation study to 0, 1.0, 5.1 or 51 ppm DCPD (equivalent to 0, 5.4, 27.5 and 275 mg/m3; 6 hours/day, 5 days/week) (Dodd et al. 1982 in OECD 2002a and as Exxon 1980, Dodd et al. 1982 and Bevan et al. 1992 in US EPA 2014). Nine animals/sex/group were sacrificed after 2, 6 and 13 weeks of exposure and after 4 and 13 weeks recovery post-exposure. While no adverse effects were observed in females at any concentration, there were effects in the proximal tubules of the kidneys in males at 27.5 mg/m3 and above [increased hyaline droplets beginning at 2 weeks, regenerative epithelium (tubular hyperplasia) beginning at 6 weeks] and urinary effects. At 275 mg/m3, males also had sporadically increased urine output and increased urinary excretion rate of potassium, slightly increased relative kidney and liver weights, and tubular proteinosis. Many of these effects were observed at the earliest sacrifice time of 2 weeks and observed either sporadically or consistently at the other time points.
After 4 and/or 13 weeks of recovery, kidney effects (increased kidney weights, epithelial cells in urine, urinary excretion of sodium and potassium, hyaline droplets) reversed in many males. Other effects decreased but persisted over the recovery period (specific gravity and osmolality of urine, tubular proteinosis, tubular hyperplasia), whereas other kidney effects increased (interstitial nephritis and glomerular basement membrane thickening).
The OECD (2002a) dismissed all male kidney toxicity as male rat-specific effects based on the assumption that it was caused by an accumulation of alpha-2-microglobulin, and identified a NOAEC of 275 mg/m3 in this 13-week rat inhalation study (Dodd et al.1982 in OECD 2002a). The US EPA considered a 2006 retrospective study which used immunohistochemical staining to show an association between alpha-2-microglobulin accumulation and hyaline droplet formation in response to DCPD exposure in rats (Hammamura 2006 in US EPA 2014). Despite that study, the US EPA concluded that human relevance could not be discounted in the inhalation study (Exxon 1980, Dodd et al. 1982 and Bevan et al. 1992 in US EPA 2014) and identified the increased formation of hyaline droplets in the kidney of male rats as a critical effect, with a lowest observed adverse effect concentration (LOAEC) of 27.5 mg/m3 and NOAEC of 5.4 mg/m3 for males (reported in US EPA 2014 as human equivalent concentrations of 4.9 and 0.97 mg/m3 respectively), and a NOAEC of 275 mg/m3 for females. In alignment with the US EPA, in this assessment the NOAEC is conservatively considered to be 5.4 mg/m3 based on the histopathological and functional kidney effects at the LOAEC of 27.5 mg/m3.
There were also 13-week inhalation studies with DCPD conducted in Harlan-Wistar rats and dogs (Kinkead et al. 1971 in US EPA 2014; the dog study is also cited in OECD 2002a). In rats, the NOAEC was 19.7 ppm (107 mg/m3) based on histological lesions in the kidneys in both sexes at 35.2 and 73.8 ppm (190 and 399 mg/m3). In dogs, a NOAEC of 8.9 ppm (48 mg/m3) was identified based on increased absolute kidney weights at 23.5 ppm (127 mg/m3). These results lend support to the US EPA 2014 conclusion that DCPD effects on kidneys are not specific to male rats.
No chronic or carcinogenicity study with DCPD was identified.
Available data indicate that DCPD is not genotoxic in vitro (including bacterial gene mutation, chromosomal aberration, and micronucleus tests) (OECD 2002a, US EPA 2014, ECHA c2007-2019). In vivo genotoxicity tests were not available for DCPD alone, but there is a negative in vivo mouse micronucleus test in mice with a DCPD/codimer concentrate containing approximately 29% DCPD (DuPont 2004 in ECHA c2007-2019).
7. Characterization of risk to human health
Table 7-1 provides all relevant exposure and hazard values for DCPD, as well as resultant margins of exposure (MOEs), for determination of risk.
A NOAEL from an oral study was used to characterize the risk for per event dermal exposure to DCPD, as there was no dermal toxicity study. There are 13-week inhalation studies with DCPD available, which are considered a more appropriate route of exposure for comparison with inhalation exposure scenarios. In addition, the oral study was not used for the per event inhalation scenarios because effects in the kidneys (hyaline droplets, basophilic change of the tubular epithelium, increased absolute and relative kidney weights) and adrenal gland effects (an increase of fatty droplets in the fascicular zone) observed after 44 days exposure with 20 mg/kg bw/day DCPD by gavage (equivalent to 64.5 mg/m3Footnote 6) in male rats (MHW 1997) were either not observed (adrenal effects, some of the kidney effects) at the 2-week interim sacrifice in the 13-week inhalation study in rats or were reversible (hyaline droplet formation) at higher doses (up to 275 mg/m3) in the 13-week inhalation study in rats (Dodd et al. 1982 in OECD 2002a). As such, use of this oral study is considered overly conservative for comparison to the inhalation exposure scenario.
For daily inhalation exposure the NOAEC of 5.4 mg/m3, based on increased hyaline droplets in proximal tubule of kidneys and kidney functional changes at 27.5 mg/ m3, was converted to a time-weighted average of 3.9 mg/m3. For per event inhalation exposure in this assessment, the NOAEC is considered to be 275 mg/m3 given that effects in the kidneys and increased relative liver weights observed at the earliest sacrifice time of 2 weeks exposure were fully or mostly reversible over the recovery period, thus were not considered relevant to a per event exposure scenario.
| Exposure scenario | Systemic exposure | Critical effect level | Critical health effect endpoint | MOE |
|---|---|---|---|---|
| Per event dermal exposure to automotive engine oil enhancer (adult) | 0.00189 mg/kg bwa | Oral NOAEL = 4 mg/kg bw/day based on a combined repeated dose and reproductive/developmental toxicity screening test in rats | Kidney and adrenal gland effects in males at 20 mg/kg bw/dayb | 2 120 |
| Per event dermal exposure from refuelling with gasoline | 0.000365 mg/kg bw | Oral NOAEL = 4 mg/kg bw/day based on a combined repeated dose and reproductive/developmental toxicity screening test in rats | Kidney and adrenal gland effects in males at 20 mg/kg bw/dayb | 11 000 |
| Daily inhalation exposure to evaporative emissions in the vicinity of a gasoline bulk storage facility (adult) | 0.00461 mg/m3 | Inhalation NOAEC = 3.9 mg/m3 based on amortization of the NOAEC of 5.4 mg/m3 from the 13-week inhalation study in Fischer 344 ratsc | Kidney effects in males at 27.5 mg/m3 d | 846 |
| Per event inhalation exposure to automotive engine oil enhancer (adult) | 0.0999 mg/m3 | Inhalation NOAEC = 275 mg/m3 based on 13-week inhalation study in Fischer 344 rats | No adverse effects relevant to the per event exposure duration up to the highest dose testede | 2 750 |
| Per event inhalation exposure from refuelling with gasoline | 0.00248 mg/m3 | Inhalation NOAEC = 275 mg/m3 based on 13-week inhalation study in Fischer 344 rats | No adverse effects relevant to the per event exposure duration up to the highest dose testede | 111 000 |
Abbreviations: MOE, Margin of Exposure
a 100 % dermal absorption was assumed.
b Kidney effects were increased hyaline droplets, basophilic change of the tubular epithelium, and increased absolute and relative kidney weights; adrenal gland effects were an increase of fatty droplets in the fascicular zone.
c The NOAEC of 5.4 mg/m3 from the 13-week Fischer 344 rat study was converted to 3.9 mg/m3 to be representative of continuous exposure (5.4 mg/m3 x 5 days/7 days).
d Increased hyaline droplets in proximal tubule of kidneys and kidney functional changes.
e The kidney effects and increased relative liver weights observed at the earliest sacrifice time of 2 weeks exposure were mostly reversible over the recovery period (except for specific gravity and osmolality of urine), so were not considered relevant to a per event exposure scenario.
Per event inhalation exposures are compared to the NOAEC of 275 mg/m3 in a 13-week inhalation study, with no effects at the highest tested dose (including histopathological analyses of kidneys and adrenal glands) relevant to the per event exposure duration. As such, it was considered more appropriate for use than the parental NOAEL of 4 mg/kg bw/day day in the oral combined repeated-dose and reproductive/developmental toxicity screening test, based on potential kidney and adrenal effects in parental males at the LOAEL of 20 mg/kg bw/day. With respect to dermal and inhalation exposure, comparison of critical effect levels and estimates of exposure from the use of automotive engine oil enhancers, refuelling with gasoline, and from evaporative emissions in the vicinity of a gasoline bulk storage facility resulted in MOEs that are considered adequate to account for uncertainties in the health effects and exposure databases.
7.1 Uncertainties in evaluation of risk to human health
The key sources of uncertainty are presented in table 7-2 below.
| Key source of uncertainty | Impact |
|---|---|
| No Canadian monitoring data for DCPD levels in air, drinking water, soil, dust, or food were available. | +/- |
| No DCPD emission rate from gasoline storage tanks was available. An emission range for benzene (0.02 to 0.10 kg/hr per tank) from gasoline floating roof storage tanks was used as a surrogate for a DCPD emission rate based on its higher vapour pressure and lower boiling point compared to DCPD, which is a conservative assumption. | + |
| Lack of pharmacokinetic, chronic or carcinogenicity studies by any route of exposure, nor dermal studies for DCPD. | +/- |
| No dermal absorption data for DCPD were available. | + |
+ = uncertainty with potential to cause over-estimation of risk; +/- = unknown potential to cause over or under estimation of risk.
8. Conclusion
Considering all available lines of evidence presented in this draft screening assessment, there is low risk of harm to the environment from DCPD. It proposed to conclude that DCPD does not meet the criteria under paragraphs 64(a) or (b) of CEPA as it is not entering the environment in a quantity or concentration or under conditions that have or may have an immediate or long-term harmful effect on the environment or its biological diversity or that constitute or may constitute a danger to the environment on which life depends.
On the basis of the information presented in this draft screening assessment, it is proposed to conclude that DCPD does not meet the criteria under paragraph 64(c) of CEPA as it is not entering the environment in a quantity or concentration or under conditions that constitute or may constitute a danger in Canada to human life or health.
It is therefore proposed to conclude that DCPD does not meet any of the criteria set out in section 64 of CEPA.
References
Canada. 1999. Canadian Environmental Protection Act, 1999. S.C. 1999, c.33. Canada Gazette Part III, vol. 22, no. 3.
Canada, Dept. of the Environment. 2012. Canadian Environmental Protection Act, 1999: Notice with respect to certain substances on the Domestic Substances List [PDF]. Canada Gazette, Part I, vol. 146, no. 48, Supplement.
Chambers AK, Strosher M, Wootton T, Moncrieff J, McCready P. 2008. Direct measurement of fugitive emissions of hydrocarbons from a refinery. J Air Waste Manag Assoc. 58(8):1047-1056.
ChemCAN [level III fugacity model of 24 regions of Canada]. 2003. Version 6.00. Peterborough (ON): Trent University, Canadian Centre for Environmental Modelling and Chemistry.
[ConsExpo Web] Consumer Exposure Web Model. 2018. Bilthoven (NL): Rijksinstituut voor Volksgezondheid en Milieu [National Institute for Public Health and the Environment].
Curry P, Kramer G, Newhook R, Sitwell J, Somers D, Tracy B, Oostdam JV. 1993. Reference values for Canadian populations. Ottawa (ON): Health Canada, Environmental Health Directorate Working Group on Reference Values.
[ECCC] Environment and Climate Change Canada. 2016a. Science approach document: ecological risk classification of organic substances. Ottawa (ON): Government of Canada.
[ECCC] Environment and Climate Change Canada. 2016b. Supporting documentation: data used to create substance-specific hazard and exposure profiles and assign risk classifications. Gatineau (QC): ECCC. Information in support of the science approach document: ecological risk classification of organic substances. Available from: substances@ec.gc.ca.
[ECCC, HC] Environment and Climate Change Canada, Health Canada. [modified 2017 Mar 12]. Categorization. Ottawa (ON): Government of Canada. [Accessed 2018 Dec 24].
[ECHA] European Chemicals Agency.c2007-2019. Registered substances database; search results for CAS RN 77-73-6. Helsinki (FI): ECHA. [updated 2018 12 17; accessed 2019 01 22].
Environment Canada. 2013. DSL Inventory Update data collected under the Canadian Environmental Protection Act, 1999, section 71: Notice with respect to certain substances on the Domestic Substances List. Data prepared by: Environment Canada, Health Canada; Existing Substances Program.
Health Canada. 1994. Human health risk assessment for priority substances. Ottawa (ON): Minister of Supply and Services Canada [PDF]. Cat. No.: En40-215/41E.
Health Canada. 2015. Food Consumption Table derived from Statistics Canada, Canadian Community Health Survey, Cycle 2.2, Nutrition (2004), Share file. Ottawa.
Health Canada. 2018. Draft backgrounder document on updated default body surface areas. Unpublished report. Ottawa (ON): Government of Canada.
[HSDB] Hazardous Substances Data Bank [database]. 1983- . Search results for CAS RN 77-73-6. Bethesda (MD): National Library of Medicine (US). [updated 2016 Oct 25; accessed 2018 Sept 20].
Joyce RS, Stoneburner GR. 1973. Adsorbing evaporative emission during fuelling of automotive vehicles. US Patent 3 748 829.
Kransler, KM. 2014. Results of a 90-day inhalation study of dicylopentadiene in B6C3F1 mice. Toxicology and Industrial Health 30(5): 459-466
[MHW] Ministry of Health and Welfare (Japan) 1997. Repeated dose sub-chronic inhalation toxicity testing in male and female rats. (majority of the content is in Japanese).
MJ Ervin & Associates. National retail petroleum site census. 2008. Calgary (AB): MJ Ervin & Associates.
[MSDS] Material Safety Data Sheet. 2012. Throttle Muscle Synthetic Converter 12 Fl. Oz [PDF]. Santa Maria, CA (US): Rev Your Cause LLC. [accessed 2018 Dec 18].
[NPRI] National Pollutant Release Inventory. 2018. NPRI Datasets: Facility Search Results. Ottawa (ON): Government of Canada. Search results for Dicyclopentadiene (77-73-6). [modified 2018 Sept 13; accessed 2018 Dec 14].
[OECD] Organisation for Economic Co-operation and Development. 2002a. SIDS initial assessment report for: Dicyclopentadiene; CAS RN 77-73-6 [PDF]. SIDS Initial Assessment Meeting 7: 1998 March 25-27: Australia [accessed 2018-12-20].
[OECD] Organisation for Economic Co-operation and Development. 2002b. Energy Statistics of OECD Countries: 1999-2000, International Energy Agency, Paris, Part 2 – Notes on Energy Sources.
[OECD] Organisation for Economic Co-operation and Development. 1998. SIDS Initial Assessment Profile (SIAP): Dicyclopentadiene: CAS No. 77-73-6. SIAM [SIDS Initial Assessment Meeting] 7; 1998 March 25-27: Australia. [accessed 2018-12-21].
OECD QSAR Toolbox. 2016. Paris (FR): Organisation for Economic Co-operation and Development, Laboratory of Mathematical Chemistry.
Olivella L, Figueras M, Fraile J, Vilanova M, Ginebreda A, Barceló D. 2002. Fate of MTBE and DCPD compounds relative to BTEX in gasoline-contaminated aquifers. Scientific World Journal. 2:1108-1114.
Pavlova A. 2004. Sensitive method for determination of dicyclopentadiene in gasoline by gas chromatography-mass spectrometry. Oxidation Communications. 27(2):292-297.
PubChem [database]. 2004- . Bethesda (MD): US National Library of Medicine, National Center for Biotechnology Information. [accessed 2018 Dec 18].
SCREEN3 [computer model]. 2011. Ver. 3.5.0. Research Triangle Park (NC): US Environmental Protection Agency, Office of Air Quality Planning and Standards, Emissions, Monitoring, and Analysis Division.
[Spectrasyne] Spectrasyne Ltd. 2011. Some examples of DIAL product tank emissions ranges. Bowerhill (UK): Spectrasyne Ltd.
Statistics Canada. 2012. Gasoline evaporative losses from gasoline retail outlets across Canada, 2009. Ottawa (ON): Statistics Canada, Environment Accounts and Statistics Division. Catalogue No.: 16-001-M, no. 15. [accessed 2018 September 4]
Tiberi, T. 2000. Vapor recovery around the world. In: Petroleum equipment & technology archive. Villingen-Schwenningen (DE): PetrolPlaza, com-a-tec GmbH. [accessed 2018 September 4]
[US EPA 1986a] US Environmental Protection Agency. Standard Scenarios for Estimating Exposure to Chemical Substances during Use of Consumer Products, Volume I; U.S. Environmental Protection Agency, Office of Toxic Substances: Washington, DC, USA.
[US EPA 1986b] US Environmental Protection Agency. Standard Scenarios for Estimating Exposure to Chemical Substances during Use of Consumer Products, Volume II; U.S. Environmental Protection Agency, Office of Toxic Substances: Washington, DC, USA.
[US EPA] US Environmental Protection Agency. 1992. Screening procedures for estimating the air quality impact of stationary sources, revised. Washington (DC): US EPA. Report No.: EPA-454/R-92-019. [PDF] [accessed 2018 September 4]
[US EPA] US Environmental Protection Agency. 2006. International workshop pn VOC fugitive losses: new monitors, emission losses and potential policy gaps; 2006 Oct 25-27; Washington, DC. Washington (DC): US EPA. [PDF] [accessed 2018 September 4]
[US EPA] United States Environmental Protection Agency. 2011. Exposure factors handbook 2011National Center for Environmental Assessment. Office of Research and Development. Washington (DC): US EPA.
[US EPA] United States Environmental Protection Agency. 2014. Provisional Peer-Reviewed Toxicity Values for Dicyclopentadiene [PDF]. U.S. Environmental Protection Agency, Washington, DC, EPA/690/R-14/004F, 2014.
Ventura F, Romero J, Parés J. 1997. Determination of dicyclopentadiene and its derivatives as compounds causing odors in groundwater supplies. Environ. Sci. Technol. 31(8): 2368-2374.
Yerushalmi L and Rastan S. 2014. Evaporative losses from retail gasoline outlets and their potential impact on ambient and indoor air quality. In: Li A, Zhu Y, Li Y, editors. Proceedings of the 8th International Symposium on Heating, Ventilation, and Air Conditioning; 2013 Oct 19-21; Xi’an, China. Berlin (DE): Springer-Verlag. p. 13-21. (Lecture Notes in Electrical Engineering 261).
Appendix A. Parameters used to estimate human exposures to DCPD in products available to consumers
Dermal exposures from the use of products available to consumers (automotive engine oil enhancers and gasoline during vehicle refuelling) were estimated using a thin film approach (US EPA 1986a,b, 2011). Inhalation exposure from the use of automotive engine oil enhancers was estimated using ConsExpo Web (2018). Inhalation exposures to DCPD from refuelling and evaporative emissions of gasoline were estimated using the in-house algorithm and SCREEN3 (SCREEN3 2011), respectively. Dermal exposure estimates were calculated based on default body weights of 74 kg for adults (19 years and older) (Health Canada 2015). Dermal absorption of 100% was assumed in the absence of dermal absorption data. The parameters used in the estimation of exposure from the uses of automotive engine oil enhancers and gasoline during refuelling are described in Table A-1. Variable inputs to SCREEN3 for evaporative emissions of DCPD from a service station and bulk gasoline storage sites and results of modelling are described in Table A-2 to A-5.
To characterize the DCPD evaporative emission scenario for individuals living in the vicinity (100 m) of a gasoline service station, the service station refuelling bay was considered the area emission source. The variations in DCPD concentration with changes in distance from the centre of the service station are given in Table A-3. The highest daily ambient air concentration of DCPD was found at 20 m from the centre of the service station. However, photomap analysis indicates that residences may be located as close as 100 metres from such service stations, and thus values estimated at this distance are selected as DCPD exposure estimates for the general population.
Bulk storage facilities have previously been identified as a source of evaporative emissions in Canada by the Alberta Research Council (Chambers et al. 2008; US EPA 2006). Within a specific Canadian facility, Spectrasyne Environmental Surveying determined an emission range for benzene from gasoline storage tanks with floating roof to be 0.02 to 0.10 kg/hr per tank (Spectrasyne 2011). A scenario of DCPD evaporative emissions from a facility with two floating roof gasoline storage tanks was considered. Using SCREEN3 modelling, the air concentrations of DCPD were determined at various distances from the storage facility (Table A-5). The highest daily ambient air concentration of DCPD was found at 150 m from the centre of the storage facility. However, photomap analysis indicates that residences may be located as close as 300 m from such storage facilities, and thus values estimated at this distance are selected as DCPD exposure estimates for the general population.
SCREEN3 is a screening-level Gaussian air dispersion model based on the Industrial Source Complex (ISC) model (for assessing pollutant concentrations from various sources in an industry complex) (SCREEN3 2011). The driver for air dispersion in the SCREEN3 model is wind. The maximum calculated exposure concentration is selected based on a built-in meteorological data matrix of different combinations of meteorological conditions, including wind speed, turbulence and humidity. This model directly predicts concentrations resulting from point, area and volume source releases. SCREEN3 gives the maximum concentrations of a substance at chosen receptor heights and at various distances from a release source in the direction downwind from the prevalent wind one hour after a given release event. During a 24-hour period, for point emission sources, the maximum 1-hour exposure (as assessed by the ISC Version 3) is multiplied by a factor of 0.4 to account for variable wind direction. This gives an estimate of the air concentration over a 24-hour exposure (US EPA 1992; SCREEN3 2011). Similarly, for exposure events happening over the span of a year, it can be expected that the direction of the prevalent winds will be more variable and uncorrelated to the wind direction for a single event; thus, the maximum amortized exposure concentration for one year is determined by multiplying the maximum 1-hour exposure by a factor of 0.08 (US EPA 1992; SCREEN3 2011). Such scaling factors are not used for non-point source emissions. However, to prevent overestimation of the exposures originating from area sources, a scaling factor of 0.2 was used to obtain the yearly amortized concentration from the value of the maximum 1-hour exposure concentration determined by SCREEN3 (SCREEN3 2011).
| Product scenario | Model parameters and assumptionsa |
|---|---|
| Automotive engine oil enhancer | Dermal : Motor oil; lubricants scenario (US EPA 1986a,b)b Thin-film thickness estimation with the following default values: Intake = (concentration × SA × film thickness × density)/BW Concentration of DCPD: 0.0833% (MSDS 2012) Surface area (SA) of 2 fingers and 2 thumbs: 12 cm2 Thickness of oil film on hand: 0.0159 cm Density of motor oil: 0.88 g/cm3 BW = body weight (kg) of adults (74 kg) (Health Canada 2015) Inhalation: exposure to vapour, instantaneous release model (ConsExpo Web 2018) Frequency of use: 4 per year (product description) Exposure duration: 5 minutes (professional judgement) Product amount: 312 g (volume of full bottle) Weight fraction of DCPD: 0.0833% (MSDS 2012) Room volume: 34 m3 (garage) Ventilation rate: 1.5 change per hour (garage) Inhalation rate: 15.1 m3/day for adults (US EPA 2011) Limit concentration to saturated air concentration: yes Application temperature: 15 degree Celcius (garage) |
| Gasoline (vehicle refuelling scenario) | Dermal: A thin-film approach as outlined in the EPA-Versar document was used, which characterizes the dermal deposition from a mineral oil substance following a partial wipe of the hands to remove excess material. A thickness of 0.002 cm was estimated to remain after wiping (US EPA 2011).c Intake = (concentration × SA × film thickness × density)/BW Concentration of DCPD: 0.03136% (Olivella et al. 2002) Surface area (SA) of exposed skin: 57 cm2 [25% of the anterior part of one hand; derived from 910 cm2 (SA of both hands) ÷ 4 × 25%] (Health Canada 2018) Thickness of oil film on hand: 0.002 cm (US EPA 2011) Density of gasoline: 0.755 g/cm3 [average from the range of gasoline densities, 0.72–0.79 g/mL (CONCAWE 1992)] BW = body weight (kg) of adults (74 kg) (Health Canada 2015) Inhalation: Amortized inhalation concentration over one year, as resulting from intermittent exposure (i.e., once a week) to DCPD in gasoline during refuelling is derived by using the following parameters and formula: Maximum 1 hour concentration of DCPD is calculated using SCREEN3 based on upper-bound gasoline evaporative emission scenario at a distance of 1m from the center of a gasoline service station (Table A-3). Frequency of refuelling: once a week (i.e., 52 times a year) (CONCAWE 2014) Duration of total refuelling process: 10 minutes (including refuelling, washing of the vehicle’s windows and completing payment)(professional judgement) Intermittent inhalation exposure = [maximum 1 hour conc. of DCPD (mg/m3) × 1 day/24 hours × duration of refuelling/event × frequency of refuelling] =[2.48E-03 mg/m3 × 1 day/24 hours × 0.167 hours/event × 1 event/7 days] = 2.46E-06 mg/m3 Per event inhalation concentration is directly obtained from the results of modelling gasoline evaporative emissions with SCREEN3 (Table A-3). The value selected is the maximum concentration of DCPD over 1 hour at a distance of 1 m from the center of a gasoline service station (shortest distance for the modelled results) in Table A-3. |
a It was assumed that these scenarios are relevant to adults only.
b Exposure factors taken from the US EPA’s Versar Manual and based on a thin film approach (US EPA 1986a,b).
c A thin-film approach as outlined in the EPA-Versar document was used (US EPA 2011).
| Variables | Input variables |
|---|---|
| Source type | Area |
| Effective emission areaa | 21 × 20 m2 |
| Emission rate of DCPD - average emission scenariob | 8.95E-05 g/s |
| Emission rate of DCPD - upper-bound evaporative emissionc | 3.48E-04 g/s |
| Receptor heightd | 1.74 m (average adult height) |
| Source release heighta | 1 m |
| Adjustment factore | 0.4 (variable wind direction during 24-hour period); 0.2 (average wind direction during 1- year period) |
| Urban–rural option | Urban |
| Meteorologyf | 1 (full meteorology) |
| Minimum and maximum distance | 0–1900 m |
a Professional judgement based on the photomap analysis.
b Average emission rate of DCPD is derived using gasoline volume throughput: 3.6x10⁶ L/yr; loss rate via evaporative emissions: 0.25%; and DCPD in gasoline: 0.0003136 kg/L (from 0.032% v/v, density of DCPD: 0.98 kg/L), which results in DCPD emission rate of 2.8224 kg/year. This value is converted to g/s by using the following formula: [2.8224 kg/year *(1000g/1kg) * 1 year/365 days * 1 day/24 hr * 1 hr/3600s].
c Upper-bound emission rate of DCPD is derived using gasoline volume throughput: 7x10⁶ L/yr; loss rate via evaporative emissions: 0.5%; and DCPD in gasoline: 0.0003136 kg/L (from 0.032% v/v, density of DCPD: 0.98 kg/L), which results in DCPD emission rate of 10.976 kg/year. This value is converted to g/s by using the following formula: [10.976 kg/year *(1000g/1kg) * 1 year/365 days * 1 day/24 hr * 1 hr/3600s].
d Curry et al. (1993).
e US EPA (1992).
f Default value in SCREEN3.
| Distance (m) | Average gasoline evaporative emission scenarioa | Average gasoline evaporative emission scenarioa | Upper-bound gasoline evaporative emission scenariob | Upper-bound gasoline evaporative emission scenariob |
|---|---|---|---|---|
| - | Maximum 1 hour conc. of DCPD (μg/m3) | Maximum daily exposure conc. of DCPD (μg/m3) | Maximum 1 hour conc. of DCPD (μg/m3) | Maximum daily exposure conc. of DCPD (μg/m3) |
| 1c | 0.6372 | 0.12744 | 2.478 | 0.4956 |
| 20 | 1.563 | 0.3126 | 6.078 | 1.2156 |
| 30 | 1.28 | 0.256 | 4.978 | 0.9956 |
| 40 | 1.021 | 0.2042 | 3.969 | 0.7938 |
| 50 | 0.8069 | 0.16138 | 3.138 | 0.6276 |
| 60 | 0.6436 | 0.12872 | 2.502 | 0.5004 |
| 70 | 0.5206 | 0.10412 | 2.024 | 0.4048 |
| 80 | 4.28E-01 | 0.08552 | 1.663 | 0.3326 |
| 90 | 3.56E-01 | 0.07128 | 1.386 | 0.2772 |
| 100c | 3.01E-01 | 0.0602 | 1.171 | 0.2342 |
| 200 | 9.17E-02 | 0.018334 | 3.56E-01 | 0.07128 |
| 300 | 4.49E-02 | 0.00897 | 1.74E-01 | 0.03488 |
| 400 | 2.72E-02 | 0.00544 | 1.06E-01 | 0.02116 |
| 500 | 1.86E-02 | 0.003722 | 7.24E-02 | 0.014476 |
| 600 | 1.37E-02 | 0.002742 | 5.33E-02 | 0.010662 |
| 700 | 1.06E-02 | 0.002128 | 4.14E-02 | 0.008276 |
| 800 | 8.58E-03 | 0.0017156 | 3.34E-02 | 0.00667 |
| 900 | 7.12E-03 | 0.001423 | 2.77E-02 | 0.005532 |
| 1000 | 6.04E-03 | 0.001207 | 2.35E-02 | 0.004694 |
| 1100 | 5.21E-03 | 0.0010422 | 2.03E-02 | 0.004052 |
| 1200 | 4.56E-03 | 0.0009126 | 1.77E-02 | 0.003548 |
| 1300 | 4.05E-03 | 0.000809 | 1.57E-02 | 0.003146 |
| 1400 | 3.62E-03 | 0.0007244 | 1.41E-02 | 0.002816 |
| 1500 | 3.27E-03 | 0.0006544 | 1.27E-02 | 0.002544 |
| 1600 | 2.98E-03 | 0.0005956 | 1.16E-02 | 0.002316 |
| 1700 | 2.73E-03 | 0.0005456 | 1.06E-02 | 0.002122 |
| 1800 | 2.51E-03 | 0.0005028 | 9.78E-03 | 0.001955 |
| 1900 | 2.33E-03 | 0.0004656 | 9.05E-03 | 0.0018104 |
a Gasoline volume throughput: 3.6x10⁶ L/yr; loss rate via evaporative emissions: 0.25%; DCPD in gasoline: 0.0003136 kg/L; DCPD emission rate: 8.95E-05 g/s; receptor at 1.74 m above ground.
b Gasoline volume throughput: 7x10⁶ L/yr; loss rate via evaporative emissions: 0.5%; DCPD in gasoline: 0.0003136 kg/L; DCPD emission rate: 3.48E-04 g/s; receptor at 1.74 m above ground.
c This distance is representative of the likely location of a residence relative to a service station according to the photomap analysis Values indicated in bold were selected for exposure characterization.
| Variables | Input variables |
|---|---|
| Source type | Area |
| Effective emission areaa | 50 × 100 m2 |
| Emission rate of DCPD based on benzene emission rateb | 0.01 to 0.056 g/s |
| Receptor heightc | 1.74 m (average adult height) |
| Source release heighta | 10 m |
| Adjustment factord | 0.4 (variable wind direction during 24-hr period); 0.2 (average wind direction during 1-yr period) |
| Urban–rural option | Urban |
| Meteorologye | 1 (full meteorology) |
| Minimum and maximum distance | 0–1900 m |
a Gasoline volume throughput: 3.6x10⁶ L/yr; loss rate via evaporative emissions: 0.25%; DCPD in gasoline: 0.0003136 kg/L; DCPD emission rate: 8.95E-05 g/s; receptor at 1.74 m above ground.
b Gasoline volume throughput: 7x10⁶ L/yr; loss rate via evaporative emissions: 0.5%; DCPD in gasoline: 0.0003136 kg/L; DCPD emission rate: 3.48E-04 g/s; receptor at 1.74 m above ground.
c This distance is representative of the likely location of a residence relative to a service station according to the photomap analysis Values indicated in bold were selected for exposure characterization.
| Variables | Input variables |
|---|---|
| Source type | Area |
| Effective emission areaa | 50 × 100 m2 |
| Emission rate of DCPD based on benzene emission rateb | 0.01 to 0.056 g/s |
| Receptor heightc | 1.74 m (average adult height) |
| Source release heighta | 10 m |
| Adjustment factord | 0.4 (variable wind direction during 24-hr period); |
| 0.2 (average wind direction during 1-yr period) | |
| Urban–rural option | Urban |
| Meteorologye | 1 (full meteorology) |
| Minimum and maximum distance | 0–1900 m |
a Professional judgement based on the photomap analysis.
b Converted 0.02 to 0.1 kg/hr per tank emission rate for benzene from gasoline floating roof storage tanks to g/s assuming 2 tanks [0.02 kg/hr-tank * 2 tanks * 1hr/3600s = 0.01 g/s for two tanks; and 0.1 kg/hr-tank * 2 tanks * 1 hr/3600s = 0.056 g/s for two tanks].
c Curry et al. (1993).
d US EPA (1992).
e Default value in SCREEN3.
| Distance (m) | Maximum 1 hour conc. (μg/m3) | Maximum daily exposure conc. (μg/m3) | Maximum 1 hour conc. (μg/m3) | Maximum daily exposure conc. (μg/m3) |
|---|---|---|---|---|
| - | 2 × 0.02 kg/hr | 2 × 0.02 kg/hr | 2 × 0.1 kg/hr | 2 × 0.1 kg/hr |
| 1 | 2.778 | 0.5556 | 15.55 | 3.11 |
| 20 | 4.129 | 0.8258 | 23.12 | 4.624 |
| 30 | 4.872 | 0.9744 | 27.28 | 5.456 |
| 40 | 5.522 | 1.1044 | 30.92 | 6.184 |
| 50 | 6.089 | 1.2178 | 34.1 | 6.82 |
| 60 | 6.471 | 1.2942 | 36.24 | 7.248 |
| 70 | 7.184 | 1.4368 | 40.23 | 8.046 |
| 80 | 7.741 | 1.5482 | 43.35 | 8.67 |
| 90 | 7.855 | 1.571 | 43.99 | 8.798 |
| 100 | 7.624 | 1.5248 | 42.7 | 8.54 |
| 150 | 8.234 | 1.6468 | 46.11 | 9.222 |
| 200 | 6.743 | 1.3486 | 37.76 | 7.552 |
| 250 | 5.245 | 1.049 | 29.37 | 5.874 |
| 300a | 4.113 | 0.8226 | 23.03 | 4.606 |
| 350 | 3.294 | 0.6588 | 18.45 | 3.69 |
| 400 | 2.698 | 0.5396 | 15.11 | 3.022 |
| 450 | 2.253 | 0.4506 | 12.62 | 2.524 |
| 500 | 1.915 | 0.383 | 10.72 | 2.144 |
| 600 | 1.442 | 0.2884 | 8.073 | 1.6146 |
| 700 | 1.134 | 0.2268 | 6.35 | 1.27 |
| 800 | 0.9221 | 0.18442 | 5.164 | 1.0328 |
| 900 | 0.7701 | 0.15402 | 4.312 | 0.8624 |
| 1000 | 0.6558 | 0.13116 | 3.673 | 0.7346 |
| 1100 | 0.5681 | 0.11362 | 3.181 | 0.6362 |
| 1200 | 0.4992 | 0.09984 | 2.795 | 0.559 |
| 1300 | 0.4437 | 0.08874 | 2.485 | 0.497 |
| 1400 | 0.3984 | 0.07968 | 2.231 | 0.4462 |
| 1500 | 0.3605 | 0.0721 | 2.019 | 0.4038 |
| 1600 | 0.3284 | 0.06568 | 1.839 | 0.3678 |
| 1700 | 0.3011 | 0.06022 | 1.686 | 0.3372 |
| 1800 | 0.2777 | 0.05554 | 1.555 | 0.311 |
| 1900 | 0.2574 | 0.05148 | 1.441 | 0.2882 |
a This distance is representative of the likely location of a residence relative to a gasoline bulk storage facility according to the photomap analysis. Values indicated in bold were selected for exposure characterization.