
Bird Conservation Strategy for region 7 in Newfoundland and Labrador and marine unit 10
- Abridged Version -
January 2014

The abridged version of the strategy available here contains a summary of the results, but does not include an analysis of conservation needs by habitat, a discussion of widespread conservation issues, or the identification of research and monitoring needs.
Table of contents
- Preface
- Acknowledgements
- Bird Conservation Strategy for Bird Conservation Region 7 and Marine Biogeographic Unit 10 in Newfoundland and Labrador - Taiga Shield and Hudson Plains and Newfoundland-Labrador Shelves
- Executive summary
- Introduction: Bird Conservation Strategies
- Section 1: Summary of results - All Birds, All Habitats
- References
Preface
Environment and Climate Change Canada led the development of all-bird conservation strategies in each of Canada's Bird Conservation Regions (BCRs) by drafting new strategies and integrating new and existing strategies into an all-bird framework. These integrated all-bird conservation strategies will serve as a basis for implementing bird conservation across Canada, and will also guide Canadian support for conservation work in other countries important to Canada's migrant birds. Input to the strategies from Environment and Climate Change Canada's conservation partners is as essential as their collaboration in implementing their recommendations.
Environment and Climate Change Canada has developed national standards for strategies to ensure consistency of approach across BCRs. Bird Conservation Strategies will provide the context from which specific implementation plans can be developed for each BCR, building on the programs currently in place through Joint Ventures or other partnerships. Landowners including Aboriginal peoples will be consulted prior to implementation.
Conservation objectives and recommended actions from the conservation strategies will be used as the biological basis to develop guidelines and beneficial management practices that support compliance with regulations under the Migratory Birds Convention Act, 1994.
Acknowledgements
This document follows templates developed by Alaine Camfield, Judith Kennedy and Elsie Krebs with the help of the BCR planners in each of the Canadian Wildlife Service regions throughout Canada. However, work of this scope cannot be accomplished without the contribution of other colleagues who provided or validated technical information, commented on earlier draft versions of the strategy, and supported the planning process. We would like to extend a sincere thanks to the following people: Karyne Bellehumeur, Doug Bliss, Andrew Boyne, Paul Chamberland, Kevin Davidson, Michael Elliott, Carina Gjerdrum, Alan Hanson, Christie MacDonald, Paul MacDonald, Bryan Martin, Bruce Pollard, Martin Raillard, Isabelle Robichaud, Dane Stuckel, Peter Thomas, Kyle Wellband, Becky Whittam and other reviewers.
Bird Conservation Strategy for Bird Conservation Region 7 and Marine Biogeographic Unit 10 in Newfoundland and Labrador - Taiga Shield and Hudson Plains and Newfoundland-Labrador Shelves
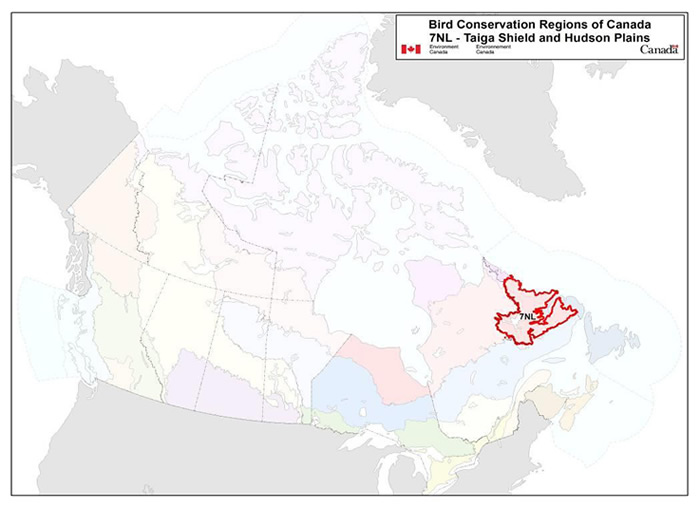
Long Description for the Map
Map of the Bird Conservation Regions (BCRs) of Canada with BCR 7 NL: Taiga Shield and Hudson Plains highlighted. The extent of the map includes Canada, with Alaska, Greenland and the northern portion of the U.S. also appearing. The map is divided by BCR (12 Canadian BCRs in total), with various colours, and their exact locations and sizes are indistinguishable, aside from BCR 7NL.
The highlighted BCR 7NL covers most of Labrador south of the Hebron Fiord area (north of Nain), with the exception of the area around Lake Melville, Sandwich Bay south toward the Straight of Belle Isle, and small areas along the Quebec border.
Legend: Bird Conservation Regions of Canada. 7NL - Taiga Shield and Hudson Plains; Environment and Climate Change Canada logo, and Government of Canada logo.
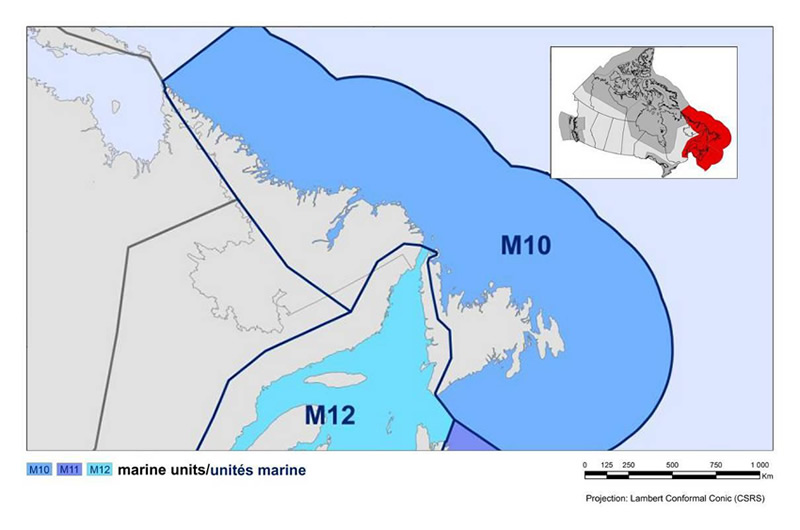
Long Description for the Map
Map of the Marine Biogeographical Unit M10 in Newfoundland and Labrador: Newfoundland-Labrador Shelves. MBU 10 covers all marine waters from the northern tip of Labrador, down the east coast of Newfoundland and along the south coast to its southwestern tip. Most of MBU 12, which covers the Gulf of St. Lawrence and the west coast of Newfoundland, is also shown. There is a scale and an inset map of Canada highlighting the Atlantic region.
Executive summary
This strategy compiles the best available information from the literature on bird conservation in Newfoundland and Labrador. It identifies priority species for conservation, the key threats affecting them and the major conservation actions required to protect them. Its goal is to become a useful tool for future conservation planning, where important information on bird conservation is conveniently pulled together and displayed. It builds on existing bird conservation strategies and complements those created for the other Bird Conservation Regions (BCRs) across Canada using the best available information extracted from a national database. Collectively, the strategies will serve as a framework for implementing bird conservation nationally, and also identify international conservation issues for Canada's priority birds. Strategies are not prescriptive, but rather are intended to guide future implementation efforts undertaken by various partners and stakeholders. Below is an outline of the priority species groups and the main threats and conservation actions identified.
The entire BCR 7 (Taiga Shield and Hudson Plains) encompasses eastern Northwest Territories, southern Nunavut, northern Manitoba and Ontario, as well as north-central Quebec and Labrador. The Newfoundland and Labrador portion of BCR 7 (BCR 7 NL) is entirely contained within Labrador and covers 77% of its surface area. The region is a combination of transitional forests, covering over 40% of the land mass, and approximately equal amounts of tundra to the north and coniferous forests to the south. Numerous lakes and wetlands can also be found within glacially carved depressions.
Though wetlands are not as common on the landscape as coniferous forests or herbaceous habitats, wetlands are used by the greatest number of priority bird species (19 species). Coastal habitat (above high tide) and coniferous forests are also important, as they are used by 15 and 14 priority species, respectively. In the Newfoundland-Labrador Shelves marine unit (MBU 10 NL), both intertidal coast and marine waters are important to priority species.
There are 36 priority bird species in BCR 7 NL, including 18 landbirds, 6 shorebirds, 3 waterbirds and 9 waterfowl species. In MBU 10 NL, 39 priority species have been identified, including 1 landbird, 8 shorebirds, 18 waterbirds and 12 waterfowl species. There are 6 (17%) priority species in BCR 7 NL and 5 (13%) in MBU 10 NL that are formally protected under the Government of Canada's Species at Risk Act (SARA).
The majority of the population objectives (50%) assigned to priority species in BCR 7 NL are to “assess/maintain”, which indicates insufficient data to reliably assess a trend and the need for additional monitoring for these species. Maintaining current population size was the objective attributed to 42% of priority species, indicating that these populations or species are relatively stable. Population declines were identified for 8% of species, and these were assigned population increases of either 50% or 100%. In MBU 10 NL, there are insufficient data to reliably assess a trend for the majority of priority species (74%), therefore their population objectives are to “assess/maintain”. Fifteen percent (15%) of priority species have a population objective of “maintain current”, while 10% have identified population declines and were given population objectives to either recover or increase population size by 50% or 100%. The Piping Plover (melodus) and Ivory Gull have specific recovery objectives described in their respective SARA Recovery Strategies.
There are a variety of current and potential threats to the region's avifauna. The most frequently identified threat to priority species in BCR 7 NL was a lack of information on the distribution, abundance and trends of species, reflecting the need for further research and monitoring. Habitat degradation and increased mortality from climate change were also significant threats to species. Other threats include mortality from collisions, habitat degradation from forestry practices and development, and mortality from hunting and incidental take. For species in MBU 10 NL, the most significant threat by far was from contamination from industrial and military sources, including mercury and PCBs. A lack of information on priority species was also a significant issue for species in this planning unit.
Conservation objectives and associated actions were identified to address the key threats to priority species. There are a variety of objectives and recommended actions; however, the most frequently identified conservation objectives in BCR 7 NL and MBU 10 NL are improving our understanding of priority bird species, ensuring adequate habitat, and reducing mortality or increasing the productivity of species. A combination of beneficial management practices, restoration of natural habitats, site protection and management, public education, and changes in legislation could help alleviate many of the identified threats to priority species in these planning units.
We hope that the information in this strategy provides a useful tool to guide future conservation action, especially habitat conservation, as it presents relevant information on priority species, threats and conservation actions in a summary format.
Introduction: Bird Conservation Strategies
Context
This document is one of a suite of Bird Conservation Region strategies (BCR strategies) that have been drafted by Environment and Climate Change Canada for all regions of Canada. These strategies respond to Environment and Climate Change Canada's need for integrated and clearly articulated bird conservation priorities to support the implementation of Canada's migratory birds program, both domestically and internationally. This suite of strategies builds on existing conservation plans for the four “bird groups” (waterfowl,Footnote1 waterbirds,Footnote2 shorebirdsFootnote3 and landbirdsFootnote4) in most regions of Canada, as well as on national and continental plans, and includes birds under provincial/territorial jurisdiction. These new strategies also establish standard conservation planning methods across Canada and fill gaps, as previous regional plans do not cover all areas of Canada or all bird groups.
These strategies present a compendium of required actions based on the general philosophy of achieving scientifically based desired population levels as promoted by the four pillar initiatives of bird conservation. Desired population levels are not necessarily the same as minimum viable or sustainable populations, but represent the state of the habitat/landscape at a time prior to recent dramatic population declines in many species from threats known and unknown. The threats identified in these strategies were compiled using currently available scientific information and expert opinion. The corresponding conservation objectives and actions will contribute to stabilizing populations at desired levels.
The BCR strategies are not highly prescriptive. In most cases, practitioners will need to consult additional information sources at local scales to provide sufficient detail to implement the recommendations of the strategies. Tools such as beneficial management practices will also be helpful in guiding implementation. Partners interested in participating in the implementation of these strategies, such as those involved in the habitat Joint Ventures established under the North American Waterfowl Management Plan (NAWMP), are familiar with the type of detailed implementation planning required to coordinate and undertake on-the-ground activities.
Strategy structure
This strategy includes two distinct Canadian planning units: Bird Conservation Region 7 in Newfoundland and Labrador (BCR 7 NL), as well as Marine Biogeographic Unit 10 along the entire coast of Labrador and the eastern and southern coasts of the island of Newfoundland (MBU 10 NL). These units have distinct lists of priority bird species. The MBU has only two of the Land Cover Classification System habitat classes: waterbodies, snow and ice and coastal. To distinguish them from the equivalent habitat classes in BCR 7 NL, they are referred to as marine waters and coastal (intertidal) in the MBU, but as inland waterbodies and coastal (above high tide) in BCR 7 NL.
While the French islands of St. Pierre and Miquelon are in MBU 10 NL, threats to priority birds in the French Exclusive Economic Zone are covered under Section 3: Threats Outside Canada, in the full version of this strategy. None of the conservation actions that address threats to priority birds of MBU 10 NL are proposed for French territory or France's Exclusive Economic Zone. All maps should also be understood to exclude French territory and Exclusive Economic Zone.
Section 1 of this strategy, published here, presents general information about the BCR/MBU and the subregion, with an overview of the six elementsFootnote5 that provide a summary of the state of bird conservation at the subregional level. Section 2, included in the full version of the strategy, provides more detail on the threats, objectives and actions for priority species grouped by each of the broad habitat types in the subregion. Section 3, also in the full version of the strategy, presents additional widespread conservation issues that are not specific to a particular habitat or were not captured by the threat assessment for individual species, as well as research and monitoring needs, and threats to migratory birds while they are outside Canada. The approach and methodology are summarized in the appendices of the full strategy, but details are available in a separate document (Kennedy et al. 2012). A national database houses all the underlying information summarized in this strategy and is available from Environment and Climate Change Canada.
Characteristics of Bird Conservation Region 7: Taiga Shield and Hudson Plains in Newfoundland and Labrador
The entire BCR 7 (Taiga Shield and Hudson Plains) covers an area greater than 1 725 000 km2 extended over the Canadian Shield, which encompasses eastern Northwest Territories, southern Nunavut, northern Manitoba and Ontario, as well as north-central Quebec and Labrador (Environment and Climate Change Canada 2011). This general region is mostly comprised of upland and riverine sites that are covered by open, mixed forests. Thousands of lakes and wetlands occur in glacially carved depressions, and peat-covered lowlands are commonly waterlogged or wet for prolonged periods due to discontinuous but widespread permafrost. The Hudson Plains in the centre of the BCR is one of the most extensive area of wetlands in the world. Dense sedge-moss-lichen associations cover poorly drained sites while open spruce and tamarack woodlands occur in better-drained sites. Coastal marshes and extensive tidal flats are also present along the coastline (North American Bird Conservation Initiative 2013).
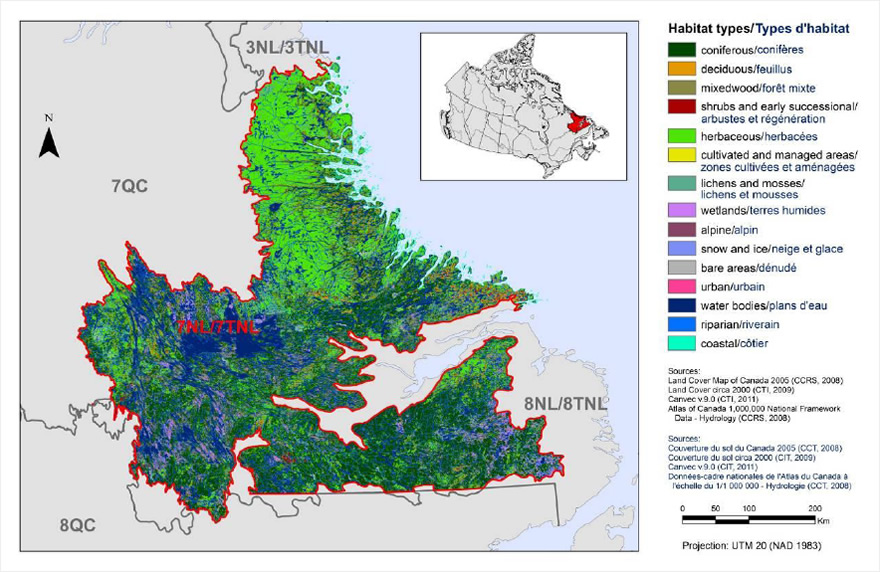
The Newfoundland and Labrador portion of BCR 7 is entirely contained within Labrador and covers 77% of its surface area (approx. 220 000 km2), including western, central and some northern regions of Labrador. This specific region reflects the combination of transitional forests, covering over 40% of the land area, between approximately equal amounts of tundra to the north and coniferous forest to the south (Figure 1). Numerous lakes and wetlands can also be found within glacially carved depressions. Vegetation varies from open forests of black (Picea mariana) and white spruce (Picea glauca), and balsam fir (Abies balsamea) to shrublands and meadows. The forest stands have associated lichens and transition into areas of open arctic tundra. The treeline occurs along the northern edge of this ecozone. In the central portion of the zone, there are undersized black spruce and jack pine (Pinus banksiana), along with tamarack (Larix laricina), mountain alder (Alnus incana) and willow (Salix spp.), which are found in fens and bogs. Riverbanks, streams and upland sites support tree species such as white spruce (Picea glauca), trembling aspen (Populus tremuloides), balsam poplar (Populus balsamifera) and white birch (Betula papyrifera; North American Bird Conservation Initiative 2013). The tundra landscape is characterized by bare soil, rocky outcrops, lichens and very little vegetation (Figure 1).
Figure 1. Land cover in BCR 7 NL.
Note: The red line delineates the geographic boundaries established by the North American Bird Conservation Initiative for the BCRs. In this document, the boundaries of BCR 7 NL do not extend below the high-tide line.
Long Description for Figure 1
Map of the landcover in BCR 7 NL Region: Taiga Shield and Hudson Plains. The map's extent includes eastern Quebec, all of Labrador save its northern tip, and part of Newfoundland's Northern Peninsula; the borders of adjoining BCRs are delineated.
BCR 7NL covers most of Labrador south of the Hebron Fiord area (north of Nain), with the exception of the area around Lake Melville, Sandwich Bay south toward the Straight of Belle Isle, and small areas along the Quebec border.
The various habitat types that exist in the BCR are shown on the map, and are explained in the following bilingual legend (appearing to the right of the map):
- Coniferous/conifères
- Deciduous/feuillus
- Mixedwood/forêt mixte
- Shrubs and early successional/arbustes et régénération
- Herbaceous/herbacées
- Cultivated and managed areas/zone cultivées et aménagées
- Lichens and mosses/lichens et mousses
- Wetlands/terres humides
- Alpine/alpin
- Snow and ice/neige et glace
- Bare areas/denude
- Urban/urbain
- Water bodies /plans d'eau
- Riparian/riverain
- Coastal/côtier
The remaining text in the legend provides the data sources for the map (i.e. Land Cover Map of Canada 2005 (CCRS, 2008), the projection of the map (i.e. UTM 9 (NAD 1983)) and there is a visual representation of the scale of the map.
In BCR 7NL, the most common habitat types are coniferous forests and herbaceous areas, followed by waterbodies and wetlands.
The population of Newfoundland and Labrador is estimated at 512 659; however, only 30 760 (6%) reside in Labrador (NL Statistics Agency 2013). The largest urban centres in BCR 7 NL are the towns of Labrador City (7 367 residents), Wabush (1 861 residents) and Churchill Falls (650 residents), which are also the communities farthest inland in Atlantic Canada (NL Statistics Agency 2012; Vasseur and Catto 2008).
The regions included in BCR 7 NL are exposed to a subarctic climate characterized by relatively short and cool summers (mean temperatures of 6°C to 11°C) with prolonged periods of daylight, while winters are typically long, dry and cold (mean temperatures of -24.5°C to -11°C; North American Bird Conservation Initiative 2013). In addition, the Labrador Current transports cold water southward, and diminishes the moderating effect of the Atlantic Ocean. Annual precipitation ranges from 500 to 800 mm in western regions but can exceed 1000 mm in some areas along the coast (North American Bird Conservation Initiative 2013).
Hydroelectric power generation is one of the two main economic activities in BCR 7 NL. The Churchill Falls Generating Station located on the Churchill River provides hydroelectric resources to Labrador and Quebec as the second largest underground hydroelectric plant in North America with a generating capacity of 5 428 MW; it is also one of the largest underground powerhouses in the world (Nalcor Energy 2013a). In addition, the Lower Churchill Project is currently developing the remaining potential of Muskrat Falls and Gull Island in order to supply an additional 3 000 MW of electricity to provincial consumers (Nalcor Energy 2013b).
The other main economic activity in BCR 7 NL is mineral exploitation. Mining is one of the largest and oldest industries in the province and a major contributor to the economy, as it accounted for 10.4% or $3.3 billion of the Gross Domestic Product (GDP) in 2011 (NL Department of Finance 2012). The metal operations in BCR 7 NL are located in Voisey's Bay for nickel, copper and cobalt; and in Labrador City/Wabush for iron ore and dolomite. The only non-metal operation is Labrador Iron Mines Holdings in Schefferville, also for iron ore. In addition, there are a number of exploration properties for nickel, rare earths, iron, uranium, vanadium, copper and gold throughout the region (NL Department of Natural Resources 2012a).
The Aboriginal peoples of Labrador include the Northern Inuit of Nunatsiavut, the Southern Inuit-Métis of NunatuKavut and the Innu (Aboriginal Affairs and Northern Development Canada 2009). The Inuit of Labrador are found in several regions on the north coast (i.e., Rigolet, Makkovik, Postville, administrative capitals of both Hopedale and Nain) and are direct descendants of the prehistoric Thule, hunters who spread from Alaska across the circumpolar regions of Canada and Greenland. In 2005, the Nunatsiavut Government was established as a regional government within the province of Newfoundland and Labrador (Nunatsiavut Government 2009). The Labrador Inuit-Metis are found in a number of communities on the central and southern coasts of Labrador (i.e., Happy Valley-Goose Bay, Mud Lake, North West River, Cartwright, Paradise River, Black Tickle, Norman Bay, Charlottetown, Pinsent's Arm, Williams Harbour, Port Hope Simpson, St. Lewis, Mary's Harbour and Lodge Bay), where a significant part of the population are derived from European white-Inuit intermarriage (NunatuKavut 2012). Nowadays, Inuit-Metis traditional fishing, hunting and trapping methods still resonate with a number of community members (Pastore, 1997). The Labrador Innu peoples occupy two settlements: Sheshatshiu, near Lake Melville, and Natuashish, along the northern coast. Many have retained their original languages and a portion of their nomadic ancient cultures (Innu Nation 2013).
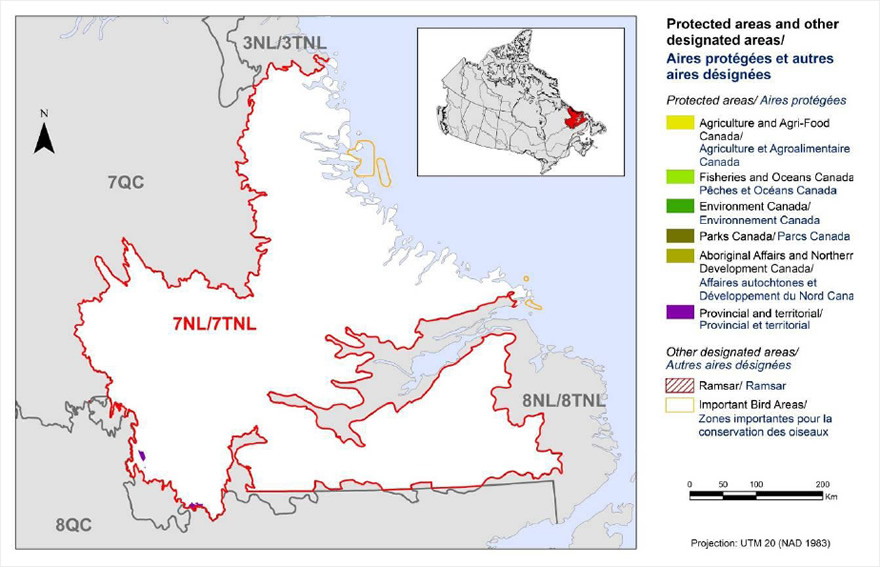
Nearly 3.5% of Labrador's surface area (terrestrial: 9 893 km2, marine: 83 km2) is protected either provincially or federally (Canadian Council on Ecological Areas 2011; Figure 2). There are no National Wildlife Areas or Migratory Bird Sanctuaries in BCR 7 NL. In 2008, Canada and the Government of Newfoundland and Labrador announced a commitment to establish a 10 700 km2 national park reserve in the wilderness area of the Mealy Mountains in Labrador. Correspondingly, the province has also indicated its commitment to protect lands adjacent to this national park reserve with the creation of a waterway provincial park that will protect the Eagle River. Once agreements are reached with the province and Aboriginal groups, this national park reserve and adjacent waterway provincial park will form the largest protected area in Atlantic Canada (Parks Canada 2011).
Figure 2. Map of protected and designated areas in BCR 7 NL.
Long Description for Figure 2
Map of protected and other designated areas in BCR 7 NL Region: Taiga Shield and Hudson Plains. The map's extent includes eastern Quebec, all of Labrador save its northern tip, and part of Newfoundland's Northern Peninsula; the borders of adjoining BCRs are delineated. BCR 7NL covers most of Labrador south of the Hebron Fiord area (north of Nain), with the exception of the area around Lake Melville, Sandwich Bay south toward the Straight of Belle Isle, and small areas along the Quebec border.
The various types of protected areas that exist in the BCR are shown on the map, and are explained in the following bilingual legend (appearing to the right of the map):
Protected areas/Aires protégées
- Agriculture and Agri-Food Canada/Agriculture et Agroalimentaire Canada
- Fisheries and Oceans Canada/Pêches et Océans Canada
- Environment and Climate Change Canada/Environnement et Changement climatique Canada
- Parks Canada/Parcs Canada
- Aboriginal Affairs and Northern Development Canada/Affaires autochtones et Développement du Nord Canada
- Provincial/Provincial
Other designated areas/autres aires désignées
- Important Bird Areas/ Aires d'importance pour les oiseaux
- Ramsar/Ramsar
There is also a visual representation of scale for the map in the legend and the projection of the map (i.e. UTM 9 (NAD 1983)).
The only visible protected area is the Redfir Lake - Kapitagas Channel provincial Ecological Reserve. There are also several Important Bird Areas along the coast.
The total land area of Newfoundland and Labrador is 404 517 km2, of which 94% is owned by the Provincial Crown. As such, the majority of protected areas (in both numbers and total surface area) are provincially managed, including three terrestrial areas (193 km2) and one marine area (24 km2) in Labrador. There is also the Redfir Lake-Kapitagas Channel Ecological Reserve (82 km2), divided into two parcels and located in southwestern Labrador (NL Department of Environment and Conservation 2013a). The Nature Conservancy of Canada is a non-governmental organization (NGO) engaged in securing and managing lands for conservation and is currently working in BCR 7 NL on a habitat conservation plan with communities, other environmental NGOs, universities, and the Nunatsiavut Government, the Innu Nation and NunatuKavut Community Council, along with federal and provincial governments. In addition, designations that recognize ecological uniqueness (but do not formally protect habitat) have elevated public awareness and promoted the conservation of ecologically significant habitats in BCR 7 NL. These include four Important Bird Areas (IBA Canada 2012): Northeast Groswater Bay (174 km2), Nain coastline (1 428.66 km2), offshore islands southeast of Nain (532 km2) and Quaker Hat Island (33 km2).
Characteristics of Marine Biogeographic Unit 10: Newfoundland-Labrador Shelves
The Newfoundland-Labrador Shelves (MBU 10, corresponding to M10 in Figure 3) extend off the eastern coast of Canada into the Atlantic Ocean and encompass one of the largest areas of continental shelf in the world (Department of Fisheries and Oceans 2010). Extending from the northern tip of Labrador southwards to the Grand Banks off the island of Newfoundland, and bordered by the Canadian Exclusive Economic Zone, the total area of MBU 10 NL is greater than 2.5 million km2 (Department of Fisheries and Oceans 2010). The Newfoundland-Labrador Shelves exhibit significant variation in seabed structure and are represented by extensive coastal forms, offshore banks, slopes and canyons (Department of Fisheries and Oceans 2010). The coastlines are continually modified by exposure to wave action, sea ice and fluctuating sea levels, with various elevation ranges from areas of low relief to steep cliffs, and consistent tidal ranges from 0.8 to 1.6 m (Templeman 2010). The continental shelf region is typically divided into three zones: (1) an inner shelf, a narrow zone parallel with the coast up to 20 km wide; (2) an inner-central shelf, consisting of a broad, fairly flat area, averaging 50-150 km in width, and ranging from 50-200m in depth; and (3) an outer shelf. The continental slope region lies beyond this continental shelf break, rapidly reaching depths of more than 3 000 m (Templeman 2010).
The waters off the Newfoundland-Labrador Shelves are mainly influenced by the Labrador Current that flows southward into inshore and offshore branches. The offshore branch originates from the West Greenland Current and borders the continental shelf and the Grand Banks. It transports 10 times more water than the inshore branch, in addition to being saltier and warmer (Rose 2007). The colder, fresher inshore branch originates in the Canadian High Arctic, receives freshwater input from rivers along its route, and hugs the northeast coast of Newfoundland and Labrador along the Avalon Channel, then turns west along the south coast of the island, penetrating Placentia Bay before entering the Gulf of St. Lawrence (Rose 2007). A small area of MBU 10 NL is covered in sea ice 7 to 10 months of the year. Icebergs are abundant and occur year-round. Most of these icebergs are produced by glaciers on the Greenland coast that are detached and transported northward in a counter-clockwise direction around Baffin Bay, then southward through the Davis Strait by the Labrador Current (Templeman 2010). The mixing of the Labrador Current with the warmer Gulf Stream, along with the shape of the ocean floor in MBU 10 NL, lifts nutrients to the surface, making these waters some of the most productive in the world (Department of Fisheries and Oceans 2010). The Newfoundland-Labrador Shelves support an impressive diversity of marine life given their temperate nature, including various species of cold-water corals, plankton, fish, mammals, amphibians and seabirds. In addition to the effects on nutrients, the mixing of the cold and warm currents often causes frequent and dense fog in the area, which is most common over the Grand Banks and along the southern and southeastern coasts of Newfoundland (Encyclopedia Britannica Online 2013). The waters of the Newfoundland-Labrador Shelves are also among the stormiest in North America (Templeman 2010).
Figure 3. Map of protected and designated areas in MBU 10 NL (M10).
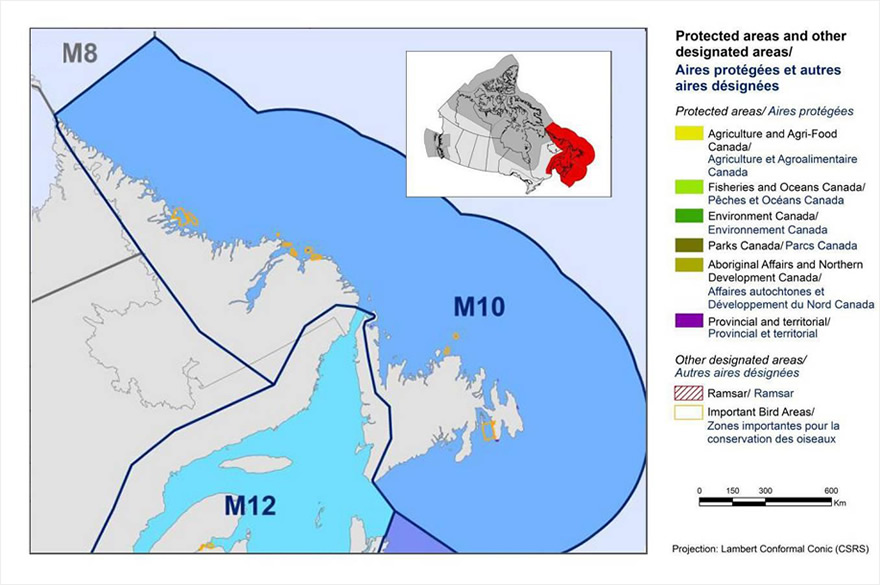
Long Description for Figure 3
Map of the protected and other designated areas in M10 NL: Newfoundland-Labrador Shelves. MBU 10 covers all marine waters from the northern tip of Labrador, down the east coast of Newfoundland and along the south coast to its southwestern tip. Most of MBU 12, which covers the Gulf of St. Lawrence and the west coast of Newfoundland, is also shown.
The various types of protected areas that exist in the BCR are shown on the map, and are explained in the following bilingual legend (appearing to the right of the map):
Protected areas/Aires protégées
- Agriculture and Agri-Food Canada/Agriculture et Agroalimentaire Canada
- Fisheries and Oceans Canada/Pêches et Océans Canada
- Environment and Climate Change Canada/Environnement et Changement climatique Canada
- Parks Canada/Parcs Canada
- Aboriginal Affairs and Northern Development Canada/Affaires autochtones et Développement du Nord Canada
- Provincial/Provincial
Other designated areas/autres aires désignées
- Important Bird Areas/ Aires d'importance pour les oiseaux
- Ramsar/Ramsar
There is also a visual representation of scale for the map in the legend and the projection of the map (i.e. UTM 9 (NAD 1983)).
The most common protected areas are Important Bird Areas, along the coasts. There is a scale and an inset map of Canada highlighting the Atlantic region.
In MBU 10 NL, extensive offshore oil and gas exploration/extraction is proceeding in the Grand Banks region, and this industry accounted for approximately 33% ($10 350 billion) of the provincial GDP in 2011 (NL Department of Finance 2012). The province currently has three major oil fields: Hibernia, Terra Nova and White Rose. The Hebron field will be Newfoundland and Labrador's fourth stand-alone offshore oil project; development activities have been ongoing since 2008 and the first oil is expected in 2017 (NL Department of Finance 2012; NL Department of Natural Resources 2013c).
Grand Banks is also one of the richest fishing grounds in the world; therefore, the fishing industry remains an important part of the provincial economy. This industry, combined with hunting and trapping, contributes over $215 million to the GDP annually (NL Department of Finance 2012) with the combined harvest of both fish (such as cod, haddock, halibut and herring) and shellfish (such as crab, shrimp and clams; NL Department of Natural Resources 2013d). Aquaculture is also an important industry in the province, and all sites within MBU 10 NL are situated around the island of Newfoundland and very near the coastline, with the largest concentration located in the Bay d'Espoir region (Templeman 2010). The industry is focusing development efforts on Steelhead Trout, Atlantic Salmon, blue mussels and Atlantic Cod. Other species such as scallops and Arctic Char are also being investigated (Department of Fisheries and Oceans 2010; Newfoundland Aquaculture IndustryAssociation 2011).
Marine transportation is an important component of the economy, as the major industries in MBU 10 NL are ocean-based (fisheries, oil and gas). The strategic location of this region on the Great Circle Route between eastern North America and Europe is important for domestic and international shipping, while the Cabot Strait links trans-Atlantic shipping routes to the St. Lawrence Seaway and the Great Lakes (Templeman 2010). On the island of Newfoundland, the major port that handles very large volumes of cargo (used mainly for the movement of oil) is Come By Chance in Placentia Bay. Other ports include Whiffen Head, Hibernia and Holyrood (Templeman 2010) The port of St. John's is also a major commercial port for shipments of consumer and industrial goods, while in Labrador, Happy Valley-Goose Bay is the central hub (Transport Canada 2012). In addition to large cargo vessels, the marine transportation sector includes ferries, tugs/barges, recreational boating, and cruise ship traffic. Several smaller ferries connect numerous other coastal towns and offshore island communities around the island of Newfoundland and up the Labrador coast. Inter-provincial ferry services operate auto-passenger ferries from North Sydney (NS) to the towns of Port aux Basques and Argentia on the southern coast of the island of Newfoundland (NL Department of Transportation and Works 2012). Tug and barge activities and recreational boating are also common, and tend to be restricted to coastal, inland and harbour waters (Cruiseship Authority of Newfoundland and Labrador 2013).
MBU 10 NL contains two important Marine Protected Areas representing 0.44% of the total area (Figure 3). The Department of Fisheries and Oceans is responsible for the Eastport Marine Protected Area (3 km2) in Bonavista Bay on the island of Newfoundland. In addition, the Laurentian Channel between the provinces of Nova Scotia and Newfoundland and Labrador is considered a potential future Marine Protected Area (Department of Fisheries and Oceans 2012). There is one important Marine Protected Area in Labrador: Gilbert Bay Marine Protected Area (59 km2), managed by the Department of Fisheries and Oceans. There are also numerous ecological reserves in MBU 10 NL including the Gannet Islands Ecological Reserve (24 km2), which is managed provincially and protects the largest and most diverse seabird colonies (Razorbills, Atlantic Puffins, Common and Thick-billed Murres, Black-legged Kittiwakes, Great Black-backed Gulls and Northern Fulmars) in North America. Other important seabird ecological reserves in MBU 10 NL include Baccalieu Island, Cape St-Mary's, Funk Island, Witless Bay, Hare Bay Islands and Lawn Islands Archipelago Provisional (NL Department of Environment and Conservation 2013a).
Section 1: Summary of results - All Birds, All Habitats
Element 1: Priority species assessment
These Bird Conservation Strategies identify “priority species” from all regularly occurring bird species in each BCR subregion. Species that are vulnerable due to population size, distribution, population trend, abundance and threats are included because of their “conservation concern”. Some widely distributed and abundant “stewardship” species are also included. Stewardship species are included because they typify the national or regional avifauna and/or because they have a large proportion of their range and/or continental population in the subregion; many of these species have some conservation concern, while others may not require specific conservation effort at this time. Species of management concern are also included as priority species when they are at (or above) their desired population objectives but require ongoing management because of their socio-economic importance as game species or because of their impacts on other species or habitats.
The purpose of the prioritization exercise is to focus implementation efforts on the issues of greatest significance for Canadian avifauna. Table 1 provides a full list of all priority species and their reason for inclusion in BCR 7 NL and MBU 10 NL. Tables 2 and 3 summarize the number of priority species in BCR 7 NL and MBU 10 NL by bird group and by the reason for priority status.
In BCR 7 NL, there are 36 priority species (Table 2), most of which are landbirds (18 species). There are also 6 shorebirds, 3 waterbirds and 9 waterfowl species. Overall, 45% of waterfowl and 30% of shorebirds are priority bird species, compared with 27% of waterbirds and 25% of landbirds (Table 2). There are 6 (17%) priority species that are formally protected under the Government of Canada's Species at Risk Act (Species at Risk Public Registry 2012); all are landbirds (Table 3).
In MBU 10 NL, there are 39 priority species (Table 2): 1 landbird, 8 shorebirds, 18 waterbirds and 12 waterfowl species. Overall, 50% of waterfowl and 41% of waterbirds are priority bird species compared with 31% of shorebirds and 25% of landbirds. There are 5 (13%) priority species that are formally protected under the Government of Canada's Species at Risk Act (Species at Risk Public Registry 2012): 2 shorebirds, 1 waterbird, and 2 waterfowl (Table 3).
In both BCR 7 and MBU 10 NL, priority status was most frequently attributed to landbirds due to regional concern or due to their status as stewardship species, whereas shorebirds and waterbirds tended to obtain priority status due to national or continental-level concern (Table 3). This is primarily due to a lack of information at the regional level for many of the shorebird and waterbird species. The primary reason for the priority status of waterfowl in this strategy was a ranking of moderately high, high or highest under the North American Waterfowl Management Plan (NAWMP Plan Committee 2004; Table 3).
Table 1. Priority bird species in BCR 7 NL and MBU 10 NL, population objective, and the reason for priority status.
Accessible version of Table 1
Table 2. Summary of priority species, by bird group, in BCR 7 NL and MBU 10 NL.
| Bird Group | Total Species (% of avifauna) |
Total Priority Species | Percent Listed as Priority |
Percent of Priority List |
|---|---|---|---|---|
| Landbirds | 73 (59%) | 18 | 25% | 50% |
| Shorebirds | 20 (16%) | 6 | 30% | 17% |
| Waterbirds | 11 (9%) | 3 | 27% | 8% |
| Waterfowl | 20 (16%) | 9 | 45% | 25% |
| Total | 124 | 36 | 29% | 100% |
| Bird Group | Total Species (% of avifauna) |
Total Priority Species | Percent Listed as Priority |
Percent of Priority List |
|---|---|---|---|---|
| Landbirds | 4 (4%) | 1 | 25% | 3% |
| Shorebirds | 26 (27%) | 8 | 31% | 20% |
| Waterbirds | 44 (45%) | 18 | 41% | 46% |
| Waterfowl | 24 (24%) | 12 | 50% | 31% |
| Total | 98 | 39 | 40% | 100% |
| Reasons for Priority Listinga | Landbirds | Shorebirds | Waterbirds | Waterfowl |
|---|---|---|---|---|
| BCR 7 NL Total | 18 | 6 | 3 | 9 |
| COSEWICb | 5 | 0 | 0 | 1 |
| Federal SARA-listedc | 5 | 0 | 0 | 1 |
| Provincial SAR-listedd | 6 | 0 | 0 | 1 |
| NAWMPe | - | - | - | 9 |
| National/Continental Concern | 7 | 5 | 3 | 7 |
| Regional/Subregional Concern | 0 | 0 | 0 | - |
| National/Continental Stewardship | 10 | - | - | - |
| Regional/Subregional Stewardship | 12 | 4 | 1 | 5 |
| Added during expert reviewsf | 0 | 0 | 0 | 0 |
| Reasons for Priority Listinga | Landbirds | Shorebirds | Waterbirds | Waterfowl |
|---|---|---|---|---|
| MBU 10 NL Total | 1 | 8 | 18 | 12 |
| COSEWICb | 0 | 2 | 1 | 2 |
| Federal SARA-listedc | 0 | 2 | 1 | 2 |
| Provincially listedd | 0 | 2 | 1 | 2 |
| NAWMPe | - | - | - | 12 |
| National/Continental Concern | 0 | 7 | 13 | 10 |
| Regional/Subregional Concern | 0 | - | 4 | - |
| National/Continental Stewardship | 1 | - | 2 | - |
| Regional/Subregional Stewardship | 0 | 0 | 3 | 2 |
| Added during expert reviewsf | 0 | 1 | 2 | 0 |
a A single species can be on the priority list for more than one reason. Note that not all reasons for inclusion apply to every bird group (indicated by “-”).
b COSEWIC indicates species assessed by the Committee on the Status of Endangered Wildlife in Canada as Endangered, Threatened or Special Concern (COSEWIC 2012).
c Species listed on Schedule 1 of the Species at Risk Act as Endangered, Threatened or Special Concern (Species at Risk Public Registry 2012).
d Species listed under Newfoundland and Labrador's Endangered Species Act as Endangered, Threatened or Vulnerable (NL Department of Environment and Conservation 2013b).
e Waterfowl identified as “key species” for Newfoundland and Labrador in the Eastern Habitat Joint Venture Implementation Plan (EHJV 2008), and/or scored as “Moderately-High”, “High” or “Highest” in either breeding or non-breeding conservation and/or monitoring needs for waterfowl conservation region 7 (analogous to BCR 7) of the North American Waterfowl Management Plan (NAWMP Plan Committee 2004).
f Species added by the NL Technical Working Group.
Element 2: Habitats Important to Priority Species
Identifying the broad habitat requirements for each priority species within the BCR and the MBU allowed species to be grouped by shared habitat-based conservation issues and actions. If many priority species associated with the same habitat face similar conservation issues, then conservation action in that habitat may support populations of several priority species. BCR strategies use a modified version of the standard land-cover classes developed by the United Nations (Food and Agriculture Organization 2000) to categorize habitats, and species were often assigned to more than one habitat class.
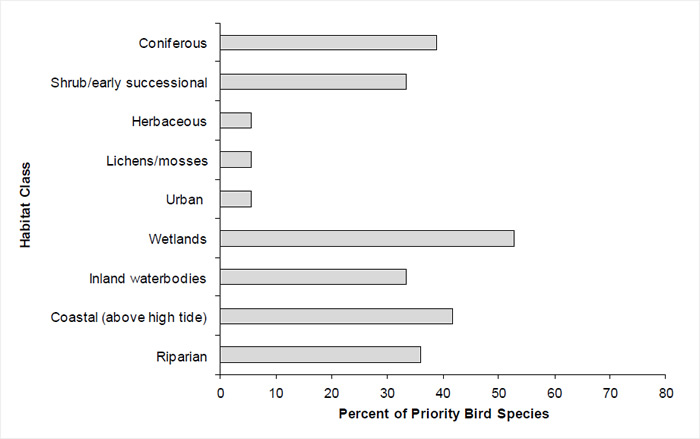
The assignment of habitat associations for priority bird species was done through literature review and expert consultation. For each priority species in BCR 7 NL and MBU 10 NL, all of their known habitat associations were considered, not just the primary habitat associations. Because of variability in the quantity and availability of information related to species-habitat associations, quantifying the relative importance of any given habitat was not possible. In this document, statements regarding the importance of habitat types for priority bird species are related to the number of priority birds associated with each habitat and may not reflect the overall importance of the habitat to all bird species in the planning unit. For instance, herbaceous habitat is a dominating landscape feature in BCR 7 NL (Figure 1); however, there are only two priority bird species (5%) associated with this habitat (Figure 4).
Though wetlands are not as common on the landscape as some other habitat classes in BCR 7 NL, wetlands are used by the greatest number of priority bird species (19 species; Figure 4). Coastal habitat (above high tide) and coniferous forests are also important habitats as they are used by 15 and 14 priority species, respectively. Herbaceous, lichens/mosses and urban habitats are used by the fewest number of priority bird species (two species each; Figure 4).
Figure 4. Percent of priority species that are associated with each habitat class in BCR 7 NL.
Note: The total exceeds 100% because each species may be assigned to more than one habitat.
Long Description for Figure 4
| Habitat Class | Percent |
|---|---|
| Coniferous | 38.89 |
| Shrub/early successional | 33.33 |
| Herbaceous | 5.56 |
| Lichens/mosses | 5.56 |
| Urban | 5.56 |
| Wetlands | 52.78 |
| Inland waterbodies | 33.33 |
| Coastal (above high tide) | 41.67 |
| Riparian | 36.11 |
Note: The total exceeds 100% because each species may be assigned to more than one habitat.
There are only two habitat classes in MBU 10 NL: coastal (intertidal) and marine waters (which include nearshore waters and continental shelf). In MBU 10 NL, there are 28 priority bird species associated with the intertidal coast, while 30 priority bird species are found in marine waters (Figure 5).
Figure 5. Percent of priority species that are associated with each habitat class in MBU 10 NL.
Note: The total exceeds 100% because each species may be assigned to more than one habitat.
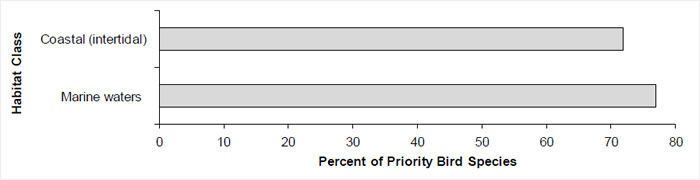
Long Description for Figure 5
| Habitat Class | Percent |
|---|---|
| Coastal (intertidal) | 71.79 |
| Marine waters | 76.92 |
Note: The total exceeds 100% because each species may be assigned to more than one habitat.
Element 3: Population objectives
Population objectives allow us to measure and evaluate conservation success. The objectives in this strategy are assigned to categories and are based on a quantitative or qualitative assessment of species' population trends. If the population trend of a species is unknown, the objective is set as “assess and maintain”, and a monitoring objective is given. For any species listed under the Species at Risk Act (SARA) or under provincial/territorial endangered species legislation, Bird Conservation Strategies defer to population objectives in available recovery documents. The ultimate measure of conservation success will be the extent to which population objectives have been reached over the next 40 years. Population objectives do not currently factor in feasibility of achievement, but are held as a standard against which to measure progress.
In BCR 7 NL, the population objective for 15 priority bird species (42%) is to maintain current levels, an indication that population trends for these species are stable (Figure 6). They are, however, still considered priorities due to factors such as national/continental and regional/sub-regional concern or stewardship status (Table 1). Eighteen priority bird species (50%) have a population objective of “assess/maintain”, which indicates that there is insufficient data to reliably assess a trend; therefore, additional monitoring is required for these species (Figure 6). There are three priority bird species (8%) with identified population declines and for which the objective is to increase population size by 50% or 100% (Figure 6). The Canada Goose (North Atlantic) and Green-winged Teal both have a population objective to increase by 50%, while the Ring-necked Duck has an Eastern Habitat Joint Venture (EHJV) objective to increase by 100% (Figure 6; Table 1). Recovery documents for the six SARA-listed species in BCR 7 NL have not yet been completed, therefore interim objectives for those species are included in this strategy, with the understanding that these will be replaced once the recovery and management objectives have been finalized.
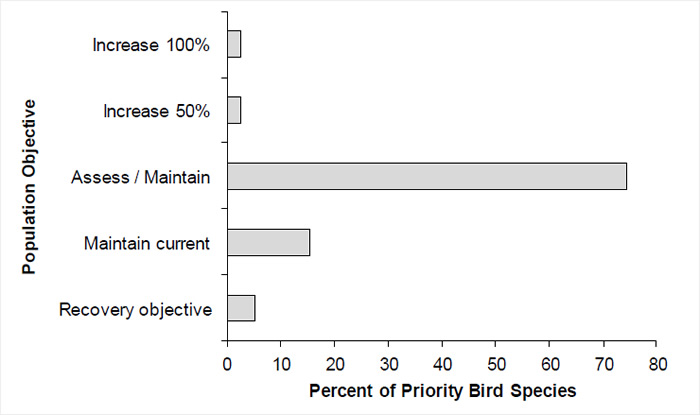
In MBU 10 NL, there are insufficient data to reliably assess a trend for the majority of priority species (29 species, 74%); therefore their population objectives are to “assess/maintain” (Figure 7). Six priority species (15%) have a population objective of “maintain current”, while four priority species (10%) have identified population declines and were given population objectives to either recover or increase population size by 50% or 100%. The Piping Plover (melodus) and Ivory Gull have specific recovery objectives described in their respective SARA Recovery Strategies (Table 1). The Canada Goose (North Atlantic) has a population objective to increase by 50% while the Common Eider has an EHJV objective to increase by 100% (Figure 7).
Figure 6. Percent of priority species that are associated with each population objective category in BCR 7 NL.
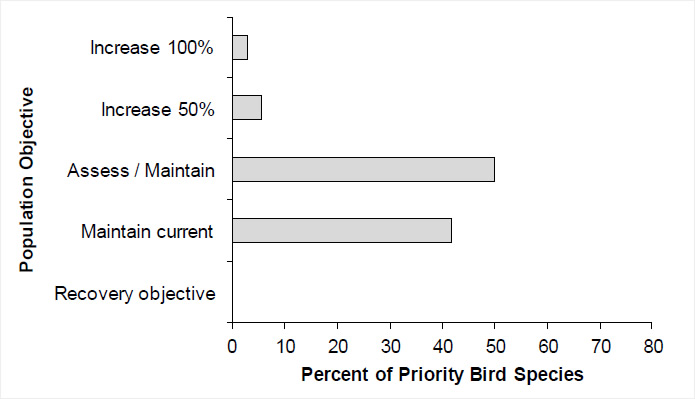
Long Description for Figure 6
| Population objective | Percent |
|---|---|
| Increase 100% | 2.78 |
| Increase 50% | 5.56 |
| Assess / Maintain | 50 |
| Maintain current | 41.67 |
| Recovery objective | 0 |
Figure 7. Percent of priority species that are associated with each population objective category in MBU 10 NL.
Long Description for Figure 7
| Population Objective | Percent |
|---|---|
| Increase 100% | 2.56 |
| Increase 50% | 2.56 |
| Assess / Maintain | 74.36 |
| Maintain current | 15.38 |
| Recovery objective | 5.13 |
Element 4: Threat assessment for priority species
The threats assessment process identifies threats believed to have a population-level effect on individual priority species. These threats are assigned a relative magnitude (Low, Medium, High, Very High), based on their scope (the proportion of the species' range within the affected subregion) and severity (the relative impact on the priority species' population). This allows us to target conservation actions towards threats with the greatest effects on suites of species or in broad habitat classes. Some well-known conservation issues (such as predation by domestic cats or climate change) may not be identified in the literature as significant threats to populations of an individual priority species and therefore may not be captured in the threat assessment. However, they merit attention in conservation strategies because of the large numbers of individual birds affected in many regions of Canada. We have incorporated them in a separate section in the full version of the strategy on Widespread Issues, but unlike other threats, they are not ranked. In BCR 7 NL and MBU 10 NL, a category was added to the threats classification scheme to allow for the inclusion of inadequate monitoring or research information (category 12 “Other direct threats” and sub-category 12.1 “Information lacking”). The following discussion focuses mainly on the highest-ranked threats and notes a few medium- and low-ranked threats where appropriate.
Some of the threats identified are not unique to a particular planning unit or a type of habitat (for example, mortality due to collisions with moving vehicles) while others are specific (for example, habitat loss due to tourism and recreational housing development in coastal habitats). These threats are categorized according to Salafsky et al. (2008).
Once individually ranked threats to priority species were rolled up for each habitat class in both planning units, the overall threat magnitude was found to be “high” for the shrub/early successional, wetland and coastal (above high tide) habitats in BCR 7 NL, as well as the intertidal coastal and marine waters of MBU 10 NL. The remaining habitat classes have an overall threat magnitude of “medium”, except for the herbaceous and urban habitats in BCR 7 NL, which have a threat magnitude of “low” (Table 4).
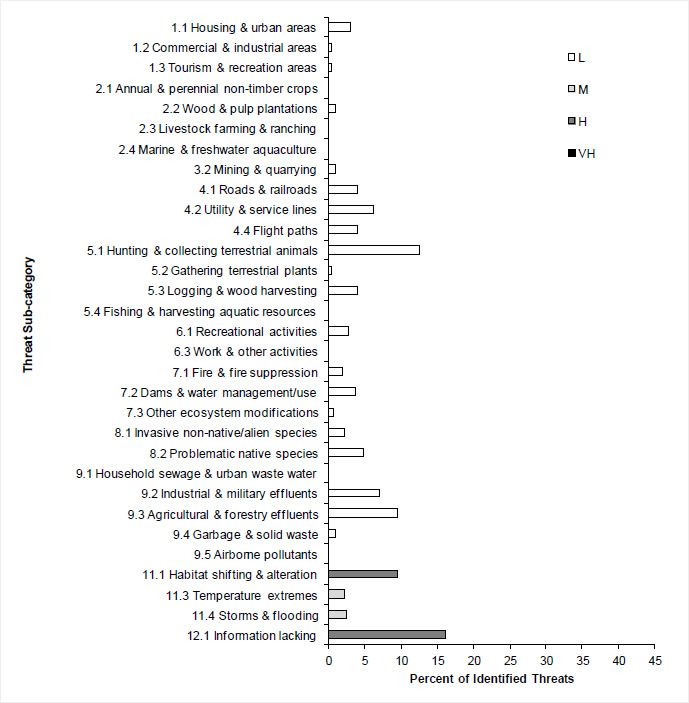
In BCR 7 NL, several high-ranked threats were identified, including habitat loss or degradation from changes in habitat structure (e.g., drying, thawing of tundra) or food webs, shifts in species' ranges, and altered timing of seasonal cues (e.g., egg laying, migration) due to climate change (11.1 Habitat shifting and alteration), in all habitats except herbaceous (Figure 8). Gaps in knowledge of priority bird species' distribution, abundance and trends (12.1 Information lacking) were found in all habitats except urban. Medium-ranked threats also related to climate change, including mortality due to thermal stress or temperature extremes (11.3. Temperature extremes), were found in all habitats except lichens/mosses, herbaceous and inland waterbodies. Habitat degradation or mortality due to increased frequency and severity of storms (11.4 Storms and flooding) was found in coniferous forest, urban, wetland, coastal (above high tide) and riparian habitats. Another threat that was frequently identified but ranked as having “low” overall magnitude was mortality due to legal hunting or poaching and incidental take (5.1 Hunting and collecting of terrestrial animals; Figure 8) in all habitats but herbaceous. While mining and resource extraction is considered an important and currently expanding economic activity, at the time of threat assessment there was little information found regarding the direct effects of prospecting and staking properties, or other direct threats to priority species related to the mining industry. However, these activities might have a large disturbance footprint on the landscape, especially with respect to noise and the air traffic in the area.
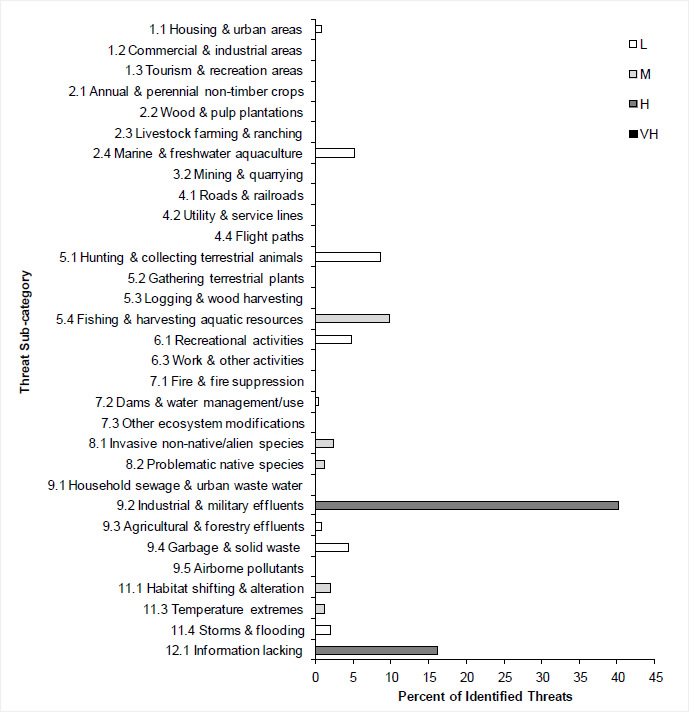
In MBU 10 NL, several high-ranked threats were identified, including habitat degradation, lethal and/or sublethal effects due to chemical or heavy metal contamination, especially from oil spills and discharges by ships or drilling platforms (9.2 Industrial and military effluents), as well as gaps in knowledge of the distribution, abundance and trends of priority bird species (12.1 Information lacking) in both coastal (intertidal) habitats and marine waters (Figure 9). Medium-ranked threats to priority species in MBU 10 NL include mortality from entanglement in fishing gear and habitat degradation from competition with commercial fisheries for prey in marine waters (5.4 Fishing and harvesting aquatic resources). Climate change also resulted in habitat degradation due to changes to habitat structure and food webs (11.1 Habitat shifting and alteration) as well as changes to the formation, distribution and thickness of sea ice (11.3 Temperature extremes). Finally, additional medium-ranked threats in MBU 10 NL were reductions in survival or fecundity from the hybridization of American Black Ducks with Mallards, and increases in predator populations due to anthropogenic land modifications (8.2 Problematic native species) in coastal (intertidal) habitats (Figure 9).
Threats to priority species while they are outside Canada during the non-breeding season were also assessed and are presented in the Threats Outside Canada section of the full strategy.
Figure 8. Percent of identified threats to priority species within BCR 7 NL by threat sub-category.
Note: Each bar represents the percent of the total number of threats identified for each sub-category in BCR 7 NL (for example, if 100 threats were identified in total for all priority species in BCR 7 NL, and 10 of those threats were in the sub-category 1.1 Housing and urban areas, the bar on the graph would represent this as 10%). Shading in the bars (VH = very high, H = high, M = medium and L = low) represents the rolled-up magnitude of all threats in each threat sub-category in the BCR.
Long Description for Figure 8
| Threat sub-category | L | M | H | VH |
|---|---|---|---|---|
| 1.1 Housing and urban areas | 3.06 | blank | blank | blank |
| 1.2 Commercial and industrial areas | 0.31 | blank | blank | blank |
| 1.3 Tourism and recreation areas | 0.31 | blank | blank | blank |
| 2.1 Annual and perennial non-timber crops | blank | blank | blank | blank |
| 2.2 Wood and pulp plantations | 0.92 | blank | blank | blank |
| 2.3 Livestock farming and ranching | blank | blank | blank | blank |
| 2.4 Marine and freshwater aquaculture | blank | blank | blank | blank |
| 3.2 Mining and quarrying | 0.92 | blank | blank | blank |
| 4.1 Roads and railroads | 3.98 | blank | blank | blank |
| 4.2 Utility and service lines | 6.12 | blank | blank | blank |
| 4.4 Flight paths | 3.98 | blank | blank | blank |
| 5.1 Hunting and collecting terrestrial animals | 12.5 | blank | blank | blank |
| 5.2 Gathering terrestrial plants | 0.31 | blank | blank | blank |
| 5.3 Logging and wood harvesting | 3.98 | blank | blank | blank |
| 5.4 Fishing and harvesting aquatic resources | blank | blank | blank | blank |
| 6.1 Recreational activities | 2.75 | blank | blank | blank |
| 6.3 Work and other activities | blank | blank | blank | blank |
| 7.1 Fire and fire suppression | 1.83 | blank | blank | blank |
| 7.2 Dams and water management/use | 3.67 | blank | blank | blank |
| 7.3 Other ecosystem modifications | 0.61 | blank | blank | blank |
| 8.1 Invasive non-native/alien species | 2.14 | blank | blank | blank |
| 8.2 Problematic native species | 4.89 | blank | blank | blank |
| 9.1 Household sewage and urban waste water | blank | blank | blank | blank |
| 9.2 Industrial and military effluents | 7.03 | blank | blank | blank |
| 9.3 Agricultural and forestry effluents | 9.48 | blank | blank | blank |
| 9.4 Garbage and solid waste | 0.92 | blank | blank | blank |
| 9.5 Airborne pollutants | blank | blank | blank | blank |
| 11.1 Habitat shifting and alteration | blank | blank | 9.48 | blank |
| 11.3 Temperature extremes | blank | 2.11 | blank | blank |
| 11.4 Storms and flooding | blank | 2.44 | blank | blank |
| 12.1 Information lacking | blank | blank | 16.2 | blank |
Note: Each bar represents the percent of the total number of threats identified in each sub-threat category in BCR 7 NL (for example, if 100 threats were identified in total for all priority species in BCR 7 NL, and 10 of those threats were in the category 1.1 “Housing and urban areas”, the bar on the graph would represent this as 10%). Shading in the bars (VH = very high, H = high, M = medium and L = low) represents the rolled-up magnitude of all threats in each threat subcategory in the BCR.
Figure 9. Percent of identified threats to priority species within MBU 10 NL by threat sub-category.
Note: Each bar represents the percent of the total number of threats identified for each sub-category in MBU 10 NL (for example, if 100 threats were identified in total for all priority species in MBU 10 NL, and 10 of those threats were in the sub-category 1.1 Housing and urban areas, the bar on the graph would represent this as 10%). Shading in the bars (VH = very high, H = high, M = medium and L = low) represents the rolled-up magnitude of all threats in each threat sub-category in the MBU.
Long Description for Figure 9
| IUCN Threat Sub-category | L | M | H | VH |
|---|---|---|---|---|
| 1.1 Housing and urban areas | 0.79 | blank | blank | blank |
| 1.2 Commercial and industrial areas | blank | blank | blank | blank |
| 1.3 Tourism and recreation areas | blank | blank | blank | blank |
| 2.1 Annual and perennial non-timber crops | blank | blank | blank | blank |
| 2.2 Wood and pulp plantations | blank | blank | blank | blank |
| 2.3 Livestock farming and ranching | blank | blank | blank | blank |
| 2.4 Marine and freshwater aquaculture | 5.14 | blank | blank | blank |
| 3.2 Mining and quarrying | blank | blank | blank | blank |
| 4.1 Roads and railroads | blank | blank | blank | blank |
| 4.2 Utility and service lines | blank | blank | blank | blank |
| 4.4 Flight paths | blank | blank | blank | blank |
| 5.1 Hunting and collecting terrestrial animals | 8.7 | blank | blank | blank |
| 5.2 Gathering terrestrial plants | blank | blank | blank | blank |
| 5.3 Logging and wood harvesting | blank | blank | blank | blank |
| 5.4 Fishing and harvesting aquatic resources | blank | 9.88 | blank | blank |
| 6.1 Recreational activities | 4.74 | blank | blank | blank |
| 6.3 Work and other activities | blank | blank | blank | blank |
| 7.1 Fire and fire suppression | blank | blank | blank | blank |
| 7.2 Dams and water management/use | 0.4 | blank | blank | blank |
| 7.3 Other ecosystem modifications | blank | blank | blank | blank |
| 8.1 Invasive non-native/alien species | blank | 2.38 | blank | blank |
| 8.2 Problematic native species | blank | 1.19 | blank | blank |
| 9.1 Household sewage and urban waste water | blank | blank | blank | blank |
| 9.2 Industrial and military effluents | blank | blank | 40.3 | blank |
| 9.3 Agricultural and forestry effluents | 0.79 | blank | blank | blank |
| 9.4 Garbage and solid waste | 4.35 | blank | blank | blank |
| 9.5 Airborne pollutants | blank | blank | blank | blank |
| 11.1 Habitat shifting and alteration | blank | 1.98 | blank | blank |
| 11.3 Temperature extremes | blank | 1.19 | blank | blank |
| 11.4 Storms and flooding | 1.98 | blank | blank | blank |
| 12.1 Information lacking | blank | blank | 16.2 | blank |
Note: Each bar represents the percent of the total number of threats identified in each sub-threat category in MBU 10 NL (for example, if 100 threats were identified in total for all priority species in MBU 10 NL, and 10 of those threats were in the category 1.1 “Housing and urban areas”, the bar on the graph would represent this as 10%). Shading in the bars (VH = very high, H = high, M = medium and L = low) represents the rolled-up magnitude of all threats in each threat subcategory in the MBU.
Table 4. Relative magnitude of identified threats to priority species within BCR 13-QC by threat category and broad habitat class. Accessible version of Table 4
Element 5: Conservation Objectives
Conservation objectives were designed to address threats and information gaps that were identified for priority species. They describe the environmental conditions and research and monitoring that are thought to be necessary for progress towards population objectives and to understand underlying conservation issues for priority bird species. As conservation objectives are reached, they will collectively contribute to achieving population objectives. Whenever possible, conservation objectives were developed to benefit multiple species and/or respond to more than one threat.
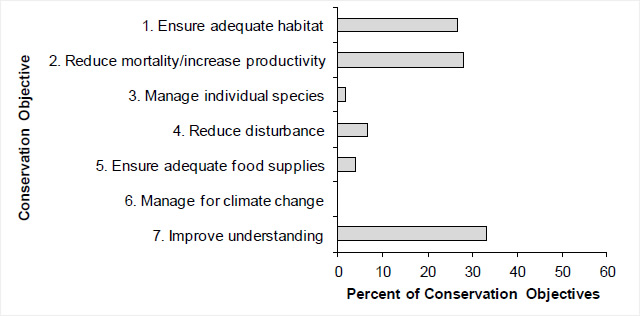
In BCR 7 NL, the most commonly identified conservation objective was improving our understanding of priority bird species, and the second most commonly identified objective was reducing mortality or increasing productivity of priority bird species (Figure 10). In MBU 10 NL, these two objectives were also the most commonly identified; however, their relative importance was reversed (Figure 11). This is consistent with the fact that for the majority of priority bird species in both BCR 7 NL and MBU 10 NL, we do not have enough information on population trends to set specific population objectives.
Figure 10. Percent of all conservation objectives assigned to each conservation objective category in BCR 7 NL.
Note: Widespread issues (including climate change) were excluded from this calculation, as they are discussed in Section 3: Additional Issues in the full version of the strategy.
Long Description for Figure 10
| Conservation Objective | Percent |
|---|---|
| 1. Ensure adequate habitat | 26.86 |
| 2. Reduce mortality/increase productivity | 28.1 |
| 3. Manage individual species | 1.65 |
| 4. Reduce disturbance | 6.61 |
| 5. Ensure adequate food supplies | 3.72 |
| 6. Manage for climate change | 0 |
| 7. Improve understanding | 33.06 |
Figure 11. Percent of all conservation objectives assigned to each conservation objective category in MBU 10 NL.
Note: Widespread issues (including climate change) were excluded from this calculation, as they are discussed in Section 3: Additional Issues in the full version of the strategy.

Long Description for Figure 11
| Conservation Objective | Percent |
|---|---|
| 1. Ensure adequate habitat | 2.5 |
| 2. Reduce mortality/increase productivity | 58.75 |
| 3. Manage individual species | 4.17 |
| 4. Reduce disturbance | 4.17 |
| 5. Ensure adequate food supplies | 6.67 |
| 6. Manage for climate change | 0 |
| 7. Improve understanding | 23.75 |
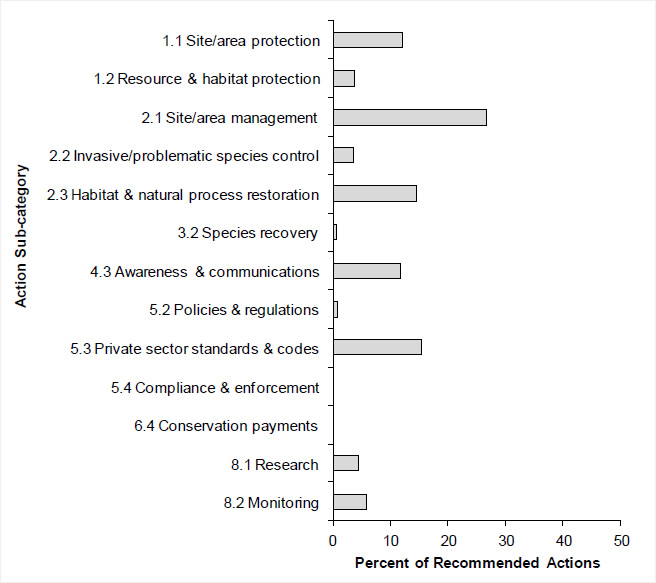
Element 6: Recommended Actions
Recommended actions indicate on-the-ground activities that will help to achieve the conservation objectives (Figs. 12, 13). Actions are strategic rather than highly detailed and prescriptive. Whenever possible, recommended actions benefit multiple species and/or respond to more than one threat. Recommended actions defer to or support those provided in recovery documents for species at risk at the federal, provincial or territorial level, but will usually be more general than those developed for individual species.
The recommended conservation actions are classified following the categories developed by the International Union for Conservation of Nature-Conservation Measures Partnership (IUCN-CMP) with the addition of categories for research and monitoring. In BCR 7 NL, the most frequently recommended conservation actions were not assigned to a sub-category, as they were related to widespread issues such as climate change and a lack of information. The most frequently identified conservation actions for more specific threats fell under the sub-category 2.1 Site/area management (Figure 12). Examples of these actions include: establishing buffer zones around known breeding, foraging and/or staging areas in habitats while limiting industrial activities within the established buffers; maintaining sufficient patch sizes, configuration and connectivity of habitats to support and, where necessary, enhance populations of priority species; managing forests to promote features such as large trees, large snags and closed canopy; limiting human recreational activities in important breeding colony and stopover areas during breeding and migration windows; limiting sources of loud noise and rapidly moving vehicles in sensitive areas during breeding and migration windows; and limiting aircraft traffic, if possible, above sensitive habitats during overwintering, breeding and migration periods.
Figure 12. Percent of recommended actions assigned to each sub-category in BCR 7 NL.
Note: 8.1 Research and 8.2 Monitoring sub-categories refer to specific species where additional information is required. For a discussion of broad-scale research and monitoring requirements, see Research and Population Monitoring Needs in Section 3 of the full version of the strategy. For information on threats related to widespread issues (e.g., climate change), also see Section 3.
Long Description for Figure 12
| Conservation Action | Percent |
| 1.1 Site/area protection | 12.17 |
| 1.2 Resource and habitat protection | 3.86 |
| 2.1 Site/area management | 26.71 |
| 2.2 Invasive/problematic species control | 3.56 |
| 2.3 Habitat and natural process restoration | 14.54 |
| 3.2 Species recovery | 0.59 |
| 4.3 Awareness and communications | 11.87 |
| 5.2 Policies and regulations | 0.89 |
| 5.3 Private sector standards and codes | 15.43 |
| 5.4 Compliance and enforcement | 0 |
| 6.4 Conservation payments | 0 |
| 8.1 Research | 4.45 |
| 8.2 Monitoring | 5.93 |
In MBU 10 NL, the most frequently identified conservation actions fell under the sub-categories 2.3 Habitat and natural process restoration and 5.2 Policies and regulations (Figure 13). Examples of actions under the former are to maintain/restore or improve water quality in marine waters by reducing the use of pollutants or heavy metals leaching into the environment, to maintain/improve effectiveness of emergency intervention programs such as those run by the Regional Environmental Emergencies, to maintain/improve Environment and Climate Change Canada's Birds Oiled at Sea (BOAS) program, and to recover and dispose of derelict fishing gear or garbage and solid wastes in marine waters and coastal (intertidal) habitats. Examples of policies and regulations (sub-category 5.2) that are recommended include making, implementing, changing, influencing or providing input into policies and regulations affecting the implementation of laws at international, national, state/provincial, local and Aboriginal levels. For example, this may include altering fishing practices to avoid important foraging/staging areas during periods of peak bird use, regulating the adoption of fishing gear modifications to reduce bycatch as a condition of licensing, and prohibiting disposal of garbage and solid wastes in marine waters or coastal (intertidal) habitats through regulation.
Figure 13. Percent of recommended actions assigned to each sub-category in MBU 10 NL.
Note: 8.1 Research and 8.2 Monitoring sub-categories refer to specific species where additional information is required. For a discussion of broad-scale research and monitoring requirements, see Research and Population Monitoring Needs in Section 3 of the full version of the strategy. For information on threats related to widespread issues (e.g., climate change), also see Section 3.
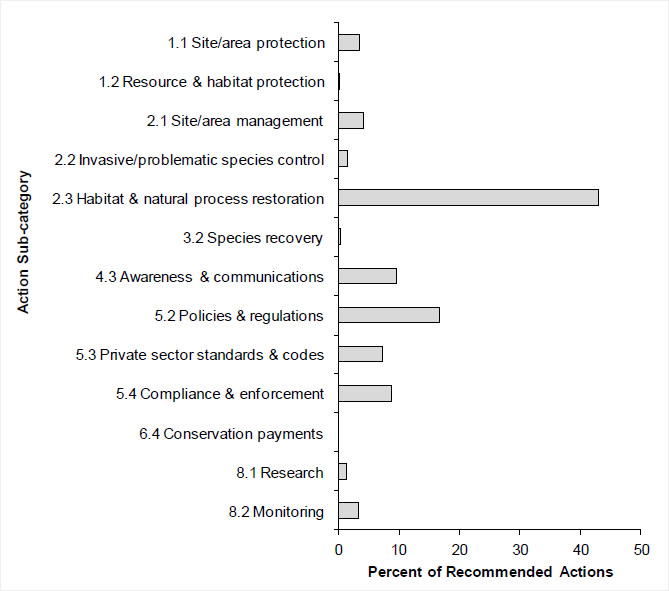
Long Description for Figure 13
| Conservation Action | Percent |
|---|---|
| 1.1 Site/area protection | 3.52 |
| 1.2 Resource and habitat protection | 0.2 |
| 2.1 Site/area management | 4.3 |
| 2.2 Invasive/problematic species control | 1.56 |
| 2.3 Habitat and natural process restoration | 42.97 |
| 3.2 Species recovery | 0.39 |
| 4.3 Awareness and communications | 9.77 |
| 5.2 Policies and regulations | 16.6 |
| 5.3 Private sector standards and codes | 7.23 |
| 5.4 Compliance and enforcement | 8.79 |
| 6.4 Conservation payments | 0 |
| 8.1 Research | 1.37 |
| 8.2 Monitoring | 3.32 |
References
Aboriginal Affairs and Northern Development Canada. 2009. Aboriginal Peoples in the Atlantic Region. (accessed February 2013).
Andres, B.A. 2009. Analysis of Shorebird Population Trend Datasets. Unpublished document for the North American Bird Conservation Initiative, U.S. Committee. State of the Birds. 36 pp., Washington, D.C.: U.S. Department of Interior.
Andres, B.A., P.A. Smith, C.L. Gratto-Trevor, and R.I.G. Morrison. 2012. Population estimates of North American shorebirds. Unpublished report.
Canadian Council on Ecological Areas. 2011. Conservation Areas Reporting and Tracking System. (accessed February 2013).
COSEWIC. 2012. Committee on Status of Endangered Wildlife in Canada. (accessed February 2013).
Cruiseship Authority of Newfoundland and Labrador. 2013. Cruise Executives - Technical Specifications (accessed March 2013).
Department of Fisheries and Oceans. 2010. Canadian Marine Ecosystem Status and Trends Report. Can. Sci. Advis. Sec. Sci. Advis. Report.
Department of Fisheries and Oceans. 2012. Laurentian Channel Area of Interest. (accessed February 2013).
Donaldson, G. M., C. Hyslop, R. I. G. Morrison, H. L. Dickson, and I. Davidson. 2000. Canadian Shorebird Conservation Plan. Canadian Wildlife Service, Environment and Climate Change Canada, Ottawa, ON.
Eastern Habitat Joint Venture (EHJV) Implementation Plan 2008. Five Year Plan for the Implementation of the North American Waterfowl Management Plan in Newfoundland and Labrador. North American Waterfowl Management Plan.
Encyclopedia Britannica Online. 2013. Newfoundland and Labrador. (accessed March 2013).
Environment and Climate Change Canada. 2011. Bird Conservation Regions of Canada. (accessed February 2013).
Food and Agriculture Organization (FAO). 2000. Land cover classification system. United Nations Food and Agriculture Organization, Rome.
IBA Canada. 2012. Map of Important Bird Areas. (accessed April 2013).
Innu Nation. 2013. Welcome to Innu. (accessed April 2013).
Kennedy, J.A., E.A. Krebs and A.F. Camfield. 2012. A Manual for Completing All-bird Conservation Plans in Canada, April 2012 version. Canadian Wildlife Service, Environment and Climate Change Canada. Ottawa, ON.
Milko, R., L. Dickson, R. Elliot, and G. Donaldson. 2003. Wings Over Water: Canada's Waterbird Conservation Plan. Canadian Wildlife Service, Environment and Climate Change Canada, Ottawa ON. 28p.
Nalcor Energy. 2013a. Nalcor Operations. (accessed April 2013).
Nalcor Energy. 2013b. Lower Churchill Project. (accessed April 2013).
Newfoundland Aquaculture Industry Association. 2011. Aquaculture in NL. (accessed February 2013).
NL Department of Environment and Conservation. 2013a. Find a Reserve. (accessed March 2013).
NL Department of Environment and Conservation. 2013b. Birds. (accessed February 2013).
NL Department of Finance. 2012. The Economic Review. Annual economy report, Government of Newfoundland and Labrador, St. John's, NL.
NL Department of Natural Resources. 2012a. Mines - Mining in Newfoundland and Labrador. (accessed February 2013).
NL Department of Natural Resources. 2012c. Tree Species. (accessed February 2013).
NL Department of Natural Resources. 2013d. Aquaculture. (accessed February 2013).
NL Department of Transportation and Works. 2012. Ferry Services. (accessed February 2013).
NL Statistics Agency. 2012. Census Subdivision (Municipalities), Population - Newfoundland and Labrador. Census Information and Statistics. (accessed April 2013).
NL Statistics Agency. 2013. Population and Demographics - Population Estimates, July 1, 1996 to 2012, Census Divisions of St. John's Census Metropolitan Area (CMA), Newfoundland and Labrador. (accessed February 2013).
North American Bird Conservation Initiative. 2013. Bird Conservation Region 7 - Taiga Shield and Hudson Plains. (accessed April 2013).
North American Waterfowl Management Plan (NAWMP), Plan Committee. 2004. North American Waterfowl Management Plan 2004. Implementation Framework: Strengthening the Biological Foundation. Canadian Wildlife Service, U.S. Fish and Wildlife Service, 106pp.
Nunatsiavut Government. 2009. Labrador Inuit. (accessed April 2013).
NunatuKavut. 2012. About Nunatukavut. (accessed April 2013).
Parks Canada. 2011. Parks Canada's Gift to the Earth: Proposed National Park Reserve in the Mealy Mountains. (accessed April 2013).
Pastore, R.T. 1997. The Inuit-Metis. (accessed February 2013).
Rich, T.D., C.J. Beardmore, H. Berlanga, P.J. Blancher, M.S.W. Bradstreet, G.S. Butcher, D.W. Demarest, E.H. Dunn, W.C. Hunter, E.E. Iñigo-Elias, J.A. Kennedy, A.M. Martell, A.O. Panjabi, D.N. Pashley, K.V. Rosenberg, C.M. Rustay, J.S. Wendt, T.C. Will. 2004. Partners in Flight North American Landbird Conservation Plan. Cornell Lab of Ornithology. Ithaca, NY.
Rose, G. A. 2007. Cod: An Ecological History of the North Atlantic Fisheries. Breakwater Books, St. John's, NL, Canada.
Salafsky, N., D. Salzer, A. J. Stattersfield, C. Hilton-Taylor, R. Neugarten, S. H. M. Butchart, B. Collen, N. Cox, L. L. Master, S. O'Connor, and D. Wilkie. 2008. A standard lexicon for biodiversity conservation: Unified classifications of threats and actions. Conservation Biology 22(4):897-911.
Species at Risk Public Registry. 2012. Schedule 1: List of Wildlife Species at Risk. (accessed April 2012).
Templeman, N.D. 2010. Ecosystem Status and Trends Report for the Newfoundland and Labrador Shelf. Can. Sci. Advis. Sec. Res. Doc., Ottawa, ON: Department of Fisheries and Oceans.
Transport Canada. 2012. Map Indicating Port Authorities Across Canada. (accessed February 2013).
Vasseur, L. and Catto, N. 2008. Atlantic Canada in From Impacts to Adaptation: Canada in a Changing Climate 2007 edited by Lemmen, D.S., Warren, F.J., Lacroix, J., and Bush, E.; Government of Canada, Ottawa, ON, pp. 119-170.