
Gulf of Maine quarterly climate impacts and outlook: December 2014
December 2014
Gulf of Maine Significant Events - for September-November 2014
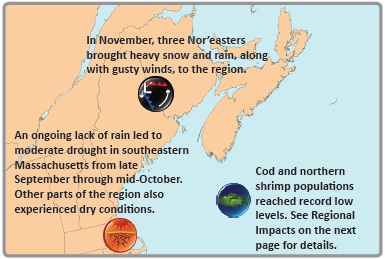
From late September through mid-October, Maine, New Hampshire, and Massachusetts were abnormally dry, with some parts of Massachusetts even reaching moderate drought status. U.S. Geological Survey data indicated that several waterways were at record or near-record low levels, with streamflows at 10% of normal or less. Water conservation alerts were issued due to low reservoirs, and crops and pastures needed to be irrigated due to dry soil conditions. Parts of the Maritimes were also dry, with most rivers and streams in New Brunswick having low water levels.
A slow-moving coastal low moved through the region beginning October 21, with a second low developing over the region on October 26. This resulted in a prolonged period of very heavy rain and strong winds in some locations. Winds gusted to 90 km/h (49 mph), with a peak of 97 km/h (60 mph) in coastal Massachusetts. Rainfall totals for the period topped 100 mm (4 in) in many areas, with highest amounts of up to 210 mm (8 in) in New Brunswick and Nova Scotia. The winds downed trees and power lines and localized flooding was reported. The rain helped ease some of the dryness in parts of the U.S.
Three Nor’easters hit the region in November. On November 1-2, a Nor’easter brought up to 53 cm (21 in) of snow, 66 mm (3 in) of rain, and wind gusts to 98 km/h (61 mph). Around 154,000 customers lost power across the region, with outages lasting several days. Caribou, ME, had its earliest snowfall that was greater than 25 cm (10 in), and some New Brunswick schools had their earliest snow-related closures in 20 years. The storm on November 7 brought light snow, rain, and gusty winds to the Maritimes and Maine. The Nor’easter on November 26-27 brought up to 46 cm (18 in) of snow, 50-100 mm (2-4 in) of rain, and wind gusts to 76 km/h (47 mph). More than 300,000 customers in New England and 48,750 in New Brunswick lost power. The storm caused travel problems the day before U.S. Thanksgiving.
Long description for map
This map shows the Gulf of Maine Region, including Massachusetts, New Hampshire, Maine, New Brunswick, Nova Scotia, and the nearby marine areas. The following highlights are noted. Firstly, an ongoing lack of rain led to moderate drought in southeastern Massachusetts from late September through mid-October, and dry conditions elsewhere. Secondly, in November, three Nor’easters brought heavy snow and rain, along with gusty winds, to the region. Thirdly, cod and northern shrimp populations reached record low levels. See Regional Impacts for details.
November was snowier than normal regionwide. New Brunswick climate sites had two to five times the normal snowfall, and some U.S. sites ranked this November among their top 20 snowiest.
November 30 marked the end of the 2014 hurricane season. Of the eight named storms in the Atlantic basin, six became hurricanes, with two of those becoming major hurricanes. An average hurricane season has 12 named storms, with six becoming hurricanes and three of those becoming major hurricanes. Four storms entered the Canadian Hurricane Centre response zone, which is near average. Hurricane Arthur (in July) was the only landfalling tropical system, causing the most costly power disruption in New Brunswick Power’s history.
Regional Climate Overview - for September-November 2014
Precipitation

Long description for precipitation overview
The Precipitation Percent of Normal map for the Gulf of Maine region shows the percent of normal precipitation, averaged over September to November. This map indicates that eastern Maine, much of New Brunswick, and western Nova Scotia saw above normal precipitation, up to 175% of normal, averaged over the three month period. It shows that Massachusetts, New Hampshire, western Maine, and northeastern New Brunswick were drier than normal, to about 50% below normal precipitation. Eastern parts of Nova Scotia was near normal to drier than normal.
Fall precipitation (accumulated during September, October, and November) ranged from 50% of normal in parts of Maine and New Hampshire up to 175% of normal in parts of Nova Scotia. September was quite dry. Most of the region saw 25-75% of normal precipitation, but parts of Maine and Massachusetts saw less than 25%. In October, precipitation ranged from near normal to 200% of normal in the states and New Brunswick. In Nova Scotia, precipitation ranged from 50% of normal in northern and eastern areas up to 175% of normal in western and southern areas. The three states ranked this September among their top seven driest and this October among their top 20 wettest. November was quite wet in the Maritimes, coastal Massachusetts, and Downeast Maine, with up to 225% of normal. However, New Hampshire and most of Maine saw 50-90% of normal.
Temperature
Long description for temperature overview
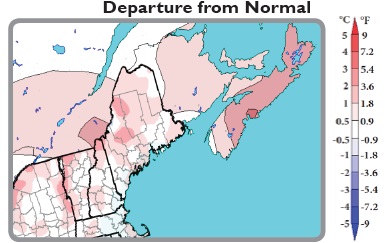
The Temperature Departure from Normal map of the Gulf of Maine region shows the temperature departure from normal, averaged over September to November. Most of the region was warmer than normal. Temperature differences from normal, averaged over the three month period, ranged from 0 to 2°C (0 to 3.6°F). Much of Nova Scotia was 1 to 2°C (1.8 to 3.6°F) above normal.
Fall temperatures (averaged over September, October, and November) were warmer than normal for most of the region, with temperatures ranging from near normal to 2°C (3.6°F) above normal. September temperatures ranged from near normal to 2°C (3.6°F) above normal, with the warmest areas in eastern New Brunswick. The region was quite warm in October, with temperatures generally 1°C (1.8°F) to 4°C (7.2°F) above normal. The three states ranked this October among their top 13 warmest. November temperatures varied. New Brunswick and the three states saw temperatures from near normal to 2°C (3.6°F) below normal, but Nova Scotia saw temperatures from near normal to 2°C (3.6°F) above normal.
Temperature and precipitation normals based on 1981-2010. Canada and ocean precip data: Canadian Precipitation Analysis. U.S. precip data: interpolated station data.
Sea Surface Temperature
Long description sea surface temperature overview
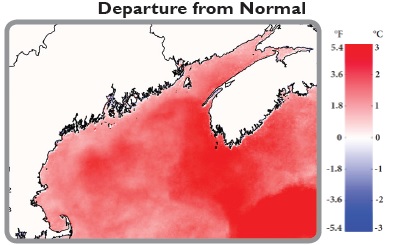
The Sea Surface Temperature Departure from Normal map of the Gulf of Maine region shows the departure from normal sea surface temperature, averaged over September to November. This map indicates that sea surface temperatures were above normal in all regions, averaged over the three month period. Variations across the area are described in the text.
Warm sea surface temperature anomalies that were present throughout most of the region in the summer persisted in the fall, strengthened, and spread to include the entire Gulf of Maine. These warm anomalies were weaker in September, but strengthened in October and November. Warm anomalies were more than 2°C (3.6°F) above the 30-year average for this period over much of the southern Scotian Shelf and the deeper basins of the Gulf of Maine. In the Bay of Fundy and throughout the coastal Gulf of Maine, warm anomalies of more than 1°C (1.8°F) were present. The weakest warm anomalies, around 0.5°C (0.9°F), were over the Georges Bank area.
Sea surface temperature anomalies based on 1985-2014. Mean SST anomalies from NOAA AVHRR data. Credit: University of Maine School of Marine Sciences and NERACOOS
Regional Impacts - for September-November 2014
Ocean Conditions
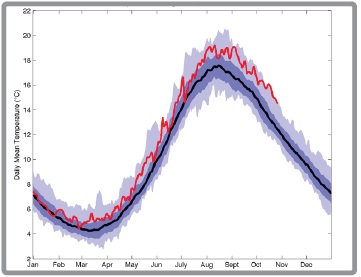
Gulf of Maine daily mean sea surface temperature (red line) relative to mean (black line), standard deviation (dark purple), and range (light purple). This shows an early spring, a warm summer, and delayed fall cooling. (Gulf of Maine Research Institute)
Long description for sea surface temperature daily mean
This time series figure shows the Gulf of Maine daily mean sea surface temperatures (SST) (averaged over the region) for January to October of this past year, and the climatological mean, standard deviation, and range for each month. The mean SST ranges from a minimum of near 4°C (± 1°C) in March to a maximum of nearly 18°C (± 1°C) in August. The monthly range is about ±3°C of the climatological monthly mean. The daily mean SST has been near or above the climatological mean since the beginning of the year. Daily mean SST in July to October exceeded the climatological mean + standard deviation line, and reached to near the top of the climatological range in October.
The trend towards earlier arrival of spring-like temperatures continued, with 2014 seeing one of the earliest springs in the last 30 years (figure at left). Projections indicate that over the next 75 years springlike temperatures will occur three to four weeks earlier and extend later into the fall--increasing the summer season by about two months. (Source: Northeast Fisheries Science Center)
With the current fishable stock being the smallest on record, the northern shrimp season was cancelled for a second consecutive year. The Gulf of Maine cod stock is also at record low levels. Emergency measures were implemented in early November to close more fishing grounds, limit cod catches, and ban recreational cod fishing for at least six months. The Gulf of Maine is near the southern limit for both cod and shrimp. Warmer waters have been implicated in the decline in shrimp and have likely compounded the management challenges for cod. However, lobster populations in the Bay of Fundy are booming, possibly due to warmer waters and a decrease in cod, which eat young lobster. (Sources: CBC News, November 19 and Bangor Daily News, November 6 and November 10)
The chlorophyll seasonal cycle was atypical in 2014, with the smallest spring (April) and highest summer (July) concentrations on record, followed by a late and large fall increase (figure below). Chlorophyll concentrations measure phytoplankton biomass, the microscopic plants that form the base of the marine food web. Major seasonal fluctuations can affect food availability for species whose life cycles are tuned to more normal seasonal cycles. (Source: Satellite Oceanography Data Lab at University of Maine).

Gulf of Maine monthly mean chlorophyll concentrations from satellite data for 2003-2013 (black lines) and 2014 (red line). (University of Maine School of Marine Sciences)
Long description for chlorophyll concentrations
This time series figure shows monthly mean chlorophyll (CHL-a) concentrations, averaged over the region, from January to December for each year from 2003 to 2013, and from January to November 2014. Most years show a spring peak, usually in April, and a second, usually lower peak in September. The April 2014 peak was near the lowest of the past decade, while fall concentrations peaked in October, later than usual, and were the highest of the past decade.
Insects and Health
Warmer temperatures and early spring snow melt have helped winter tick populations explode in New England. As a result, tick-related moose deaths have increased, and moose populations have declined. New Hampshire's moose population "has declined as much as 40% in some areas during the past three years" in part due to winter ticks. New Hampshire issued 55% fewer moose hunting permits this year, and Maine issued 25% fewer. However, New Brunswick's moose population is healthy, with the hunting season extended by two days and the quota increased. Deer ticks are also thriving in New England, bringing an increase in tick-transmitted diseases to humans. In Maine, a record number of residents were infected with anaplasmosis in 2014, and 2013 was a record year for Lyme disease. Infected ticks are also established in parts of southern New Brunswick and Nova Scotia. (Sources: National Wildlife Federation and Portland Press Herald, December 9)
Regional Outlook - for Winter 2014-15
Temperature

Long description for temperature outlook
Environment Canada seasonal outlook map for temperature. This map shows the percent probability of above normal temperatures in the Maritimes for the three month period December 2014 to February 2015. The map shows probabilities of 40% to 60% for above normal temperatures in Nova Scotia and probabilities of 40% to 60% for near normal temperatures in the northern half of New Brunswick. The map over the southern half of New Brunswick is white, indicating equal chances of below, near, or above-normal temperatures.
For December through February, Environment Canada is predicting an increased chance of above-normal temperatures for Nova Scotia. Warmer than normal sea surface temperatures off the Atlantic coast are expected to help maintain warm conditions on land.
Environment Canada is calling for an increased chance of near-normal temperatures for the northern half of New Brunswick, with equal chances of below-, near-, or above-normal temperatures in the rest of the province.
NOAA's Climate Prediction Center is forecasting an increased chance of above-normal temperatures for Maine and northern New Hampshire from December through February. Long-term trends
indicate above-normal temperatures are most likely. Equal chances of below-, near-, or abovenormal temperatures are predicted elsewhere.
Environment Canada map (left) produced on November 30. Climate Prediction Center map (right) produced on November 20.
Precipitation
Long description for precipitation outlook
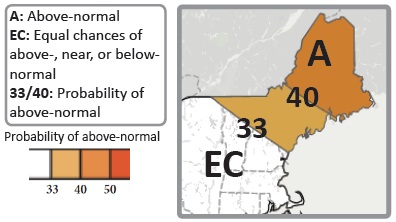
NOAA’s Climate Prediction Center seasonal outlook map for temperature. This map shows percent probability of temperature anomaly categories. Much of Maine has a probability of between 40% to 50% for above normal temperatures, with 33% to 40% probability for above normal temperatures elsewhere, except equal chances over southwestern sections of the region.
Environment Canada and NOAA's Climate Prediction Center are both predicting equal chances of above-, near-, or below-normal precipitation from December through February for most of the region. However, an increased chance of above-normal precipitation is forecast for southeastern Massachusetts based on computer models and the potential development of El Niño.
NOAA's Climate Prediction Center is forecasting an increased chance of above-normal temperatures for Maine and northern New Hampshire from December through February. Long-term trends indicate above-normal temperatures are most likely. Equal chances of below-, near-, or abovenormal temperatures are predicted elsewhere.
Environment Canada map (above) produced on November 30. Climate Prediction Center map (right) produced on November 20.
El Niño
While sea surface temperatures in the equatorial Pacific Ocean became increasingly warm in November, ENSO-neutral conditions continued as of early December. A clear link between expected atmospheric conditions during El Niño and the warm waters has not been established. However, computer models continue to indicate the emergence of a weak El Niño event. The Climate Prediction Center says there is a 65% chance of El Niño during winter and lasting through spring 2015. (Sources: Climate Prediction Center El Niño forecast and El Niño blog)
Gulf of Maine Region Partners
Northeast Regional Climate Center
National Oceanic and Atmospheric Administration
National Operational Hydrologic Remote Sensing Center
Northeast River Forecast Center
Gulf of Maine Research Institute
National Integrated Drought Information System
Cooperative Institute for the North Atlantic Region
Gulf of Maine Council on the Marine Environment, Climate Network
Northeastern Regional Association of Coastal and Ocean Systems
Contacts
NOAA:
Ellen Mecray
Samantha Borisoff
Environment Canada:
1-800-668-6767 (in Canada only)
819-997-2800 (long-distance charges apply)
enviroinfo@ec.gc.ca
To receive this publication every quarter, sign up at http://www.gulfofmaine.org/2/climate-network-climate-outlook.