
LEVELnews: Great Lakes and St. Lawrence River water levels, June 2022

Lake Superior experiences higher than average lake level increase after an extremely wet May
During May, the Great Lakes Basin experienced the following:
- The mean monthly water levels of all of the Great Lakes were above average, with Lakes Superior, Michigan-Huron, and Erie being well above average.
- Lake Superior received above average precipitation, while Lakes Michigan-Huron and Erie received close to average precipitation. Lake Ontario experienced below average precipitation.
- Lake Superior experienced its third largest water supply for the month of May. Lake Michigan-Huron experienced wetter than average water supply conditions. Lake Erie experienced close to average water supply conditions, while Lake Ontario experienced drier than average conditions.
- Lake Superior experienced its third largest May rise on record. Lakes Michigan-Huron and Erie experienced average water level rises and Lake Ontario levels declined during the month of May.
This is the time of year when all lakes typically continue their seasonal rise into summer. Lake Superior water levels are expected to remain above average under typical and wetter than average water supply conditions, while drier than typical conditions may cause levels to drop to below average by mid-summer. The water levels of Lakes Michigan-Huron and Erie are expected to remain above or close to average under any water supply scenario. Lake Ontario levels are above average and would remain so under wetter than average conditions. However, average or drier than average conditions could result in lower than average levels within the next few months.
With water levels remaining above average in some lakes and the possibility of large storms and winds, low-lying areas are at risk for accelerated coastline erosion and flooding. For current information and forecasts, please refer to the sources listed below.
Later in this issue, we provide an overview of Lake Superior's, larger-than-average, lake level rise over the past several months.
May monthly levels
Lake Superior's monthly mean level was 183.45 m (IGLD85Footnote 1), 8 cm above the long-term average (1918-2021) and 6 cm lower than this time last year.
Lake Michigan-Huron's monthly mean level was 176.76 m (IGLD85). This was 26 cm above its May monthly mean water level and 19 cm lower than last year.
Lake Erie had an average monthly water level of 174.66 m (IGLD85), 33 cm above average and 2 cm below the level last year.
Lake Ontario's May monthly mean level was 75.17 m (IGLD85), 14 cm above average and 45 cm higher than last year.
| Lake | Compared to May monthly average (1918–2021) | Compared to May 2021 |
|---|---|---|
| Superior | 8 cm below | 6 cm below |
| Michigan–Huron | 26 cm above | 19 cm below |
| St. Clair | 35 cm above | 7 cm below |
| Erie | 33 cm above | 2 cm below |
| Ontario | 14 cm above | 45 cm above |
Lake level changes
Lake Superior rose by 22 cm in May, more than double its average monthly rise of 10 cm. This is the third largest rise on record for May.
Lake Michigan-Huron rose by 8 cm, an average increase for May.
Lake Erie rose by 5 cm, an average May increase.
Lake Ontario declined by 4 cm, when it typically increases by 9 cm.
(Note: lake level changes are based on the levels at the beginning of the month and not the monthly average levels.)
Beginning-of-June lake levels
Lake Superior was 12 cm above average at the beginning of June, which is 2 cm higher than last year.
Lake Michigan-Huron's level was 27 cm above average at the beginning of June and 14 cm lower than this time last year.
Lake Erie was 32 cm above average at the beginning of June and 1 cm lower than at this time last year.
Lake Ontario's level at the start of June was 8 cm above average and 45 cm higher than at this time last year.
At the beginning of June, all of the Great Lakes except for Lake Superior were at least 34 cm above their chart datum level. Chart datum is a reference elevation for each lake that provides more information on the depth of water for safe boat navigation on the lakes. For more information, please visit Low Water Datum – Great Lakes Coordinating Committee.
| Lake | Compared to beginning-of-month average (1918–2021) | Compared to June 2021 |
|---|---|---|
| Superior | 12 cm above | 2 cm below |
| Michigan–Huron | 27 cm above | 14 cm below |
| St. Clair | 34 cm above | 10 cm below |
| Erie | 32 cm above | 1 cm below |
| Ontario | 8 cm above | 45 cm above |
Water levels forecast
This is the time of year when all of the Great Lakes typically continue their seasonal rise into summer.
Lake Superior is currently above its average level and is expected to remain so under average conditions. Drier than average conditions could result in lake levels dropping below average in the coming months, while wetter than average conditions would result in lake levels continuing to be above average.
Lake Michigan-Huron is currently at an above average level and is expected to remain so under all water supply conditions. In the event of drier than average conditions, lake levels could approach average in the next six months.
Lake Erie levels are currently well above average and are expected to remain high under average and wetter than average water supply conditions. In the event of dry conditions, lake levels could approach average in the next six months.
Lake Ontario levels are above average and are expected to remain so under above average water supply conditions for the next few months. However, if May was an early peak, even typical water supply conditions could result in lake levels falling below average during the summer.
For more information on the probable range of water levels, consult LEVELnews note on projections.
For a graphical representation of recent and forecasted water levels on the Great Lakes, refer to the Canadian Hydrographic Service's Monthly Water Levels Bulletin.
Lake Superior spring increase
During the past three months, Lake Superior levels increased by much higher than average amounts, moving from below average to above average levels, and water levels are now close to those experienced in April 2021. The Lake Superior Basin is located further north and experiences a later freshet (spring runoff) with associated seasonal lake level increases occurring later in the season. The lake is experiencing an earlier rise this year with higher than average spring lake level increases.
During March, the Lake Superior Basin experienced a 2 cm increase at a time when it generally decreases by 1 cm, with water supplies to the lake during this time being close to average. However, during April, the Basin experienced very wet conditions and higher than average water supplies. Precipitation during April was almost double the long-term average amount for the month. This resulted in the lake levels increasing 14 cm at a time when it usually increases by 8 cm. This was the lake's 10th highest lake level rise for April. During May, the Lake Superior Basin experienced its third highest net basin supply for that month, resulting in a lake level increase of 22 cm at a time when lake levels usually increase by 10 cm. This increase was the 3rd highest May increase on record, only surpassed in 1950 and 2013.
The combined rise of 36 cm between the beginning of April and beginning of June was the second highest rise during that period, and much more than the average of 18 cm (2001 saw the highest rise of 41 cm). This demonstrates how quickly a lake can go from below to above average levels with extreme water supplies. Given the size of Lake Superior, this is an extraordinary amount of water.
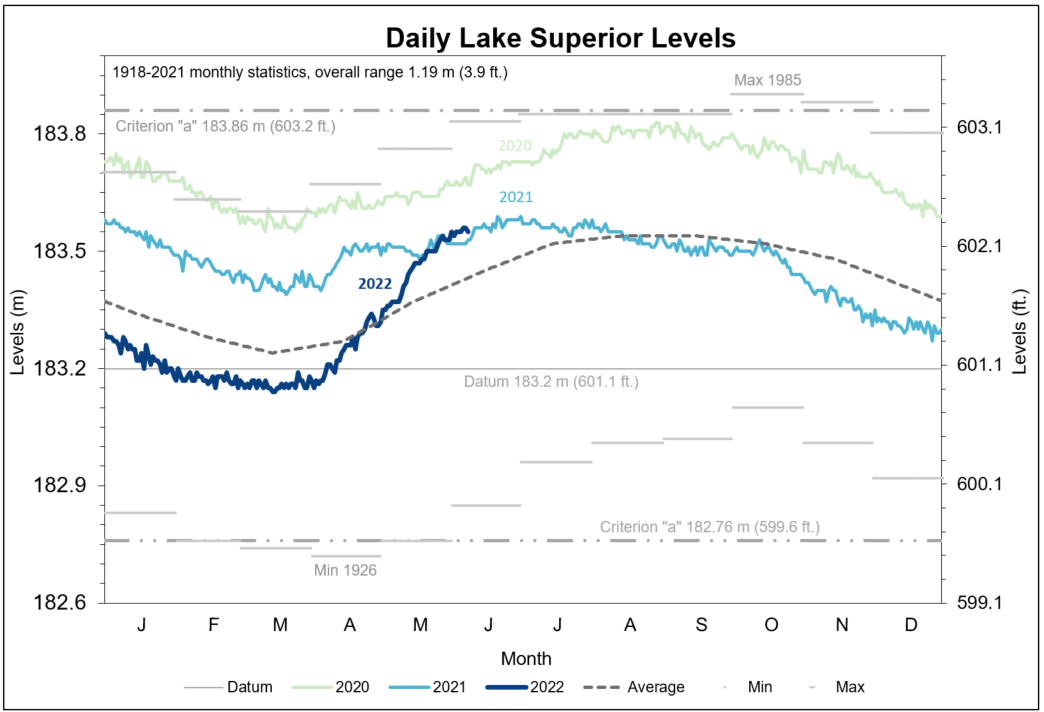
Long description
The figure presents the Lake Superior levels in meters (left) and feet (right) from January to December. 2020, 2021, and 2022 levels are show on the figure. The minimum and maximum monthly values are indicated with grey lines. A black dotted line depicts the average yearly levels.
| Month | Net basin supply (probability of exceedance)a | Precipitation (percentage of LTA)a,b | Lake level increase | Average lake level increase |
|---|---|---|---|---|
| March | 55% (average) | 108% | 2 cm | -1 cm |
| April | 13% (very wet) | 194% | 14 cm | 8 cm |
| May | 2% (third highest on record) | 123% | 22 cm | 10 cm |
a As a percentage of long-term average (LTA).
b United States Army Corps of Engineers
c <5% extremely wet; <25% very wet; <45% wet; 45-55% average; >55% dry; >75% very dry; >95% extremely dry.
Get notified when a new edition of LEVELNews is available!
Did you know that you can opt in to be notified whenever a new edition of LEVELNews is available? Visit the LEVELnews subscription page to sign up for email notifications. You can unsubscribe at any time.
| Lake | Precipitation (percentage of LTA)a,b | Net basin supply (probability of exceedance)c | Outflows (percentage of LTA)a |
|---|---|---|---|
| Great Lakes Basin | 96% | - | - |
| Superior | 122% | 2% (third highest on record) | 91% |
| Michigan-Huron | 84% | 34% (wet) | 112% |
| Erie (including Lake St. Clair) | 99% | 48% (average) | 112% |
| Ontario | 78% | 65% (dry) | 118% |
a As a percentage of long-term average (LTA).
b United States Army Corps of Engineers
c <5% extremely wet; <25% very wet; <45% wet; 45-55% average; >55% dry; >75% very dry; >95% extremely dry.
Note: The figures contained in this report are provisional and are subject to change. Data are calculated from the best available observations at the time of posting. Please refer to the February 2022 edition of LEVELnews for a description of net basin supply.
Flood information
With water levels remaining high on some lakes, there is a high risk of flooding. Great Lakes water levels are difficult to predict weeks in advance due to natural variations in weather. To stay informed about Great Lakes water levels and flooding, visit the Ontario flood forecasting and warning program website.
Additional information can also be found on the International Lake Superior Board of Control website, and the International Lake Ontario–St. Lawrence River Board website.
Information on current water levels and marine forecasts
Daily levels: Current daily lake-wide average levels of all the Great Lakes are available on the Great Lakes water levels and related data page by clicking on "Daily water levels for the current month". The daily average water level is an average taken from a number of gauges across each lake and is a good indicator of the overall lake level when it is changing relatively rapidly due to recent high precipitation.
Hourly levels: Hourly lake levels from individual gauge sites can be found at the Government of Canada Great Lakes Water Level Gauging Stations website at Great Lakes water levels and related data. These levels are useful for determining real-time water levels at a given site, however, it should be noted that they are subject to local, temporary effects on water levels such as wind and waves.
Marine forecasts: A link to current Government of Canada marine forecasts for wave heights for each of the Great Lakes can be found on the Great Lakes water levels and related data page under the "Wave and wind data" heading. Current marine forecasts for Lakes Superior, Huron, Erie and Ontario are available by clicking on the link of the lake in which you are interested. To view a text bulletin of recent wave height forecasts for all of the Great Lakes, click on the "Text bulletin wave height forecasts for the Great Lakes and St. Lawrence River" link.
For more information:
Frank Seglenieks (Editor) and Nicole O'Brien
Boundary Water Issues
Meteorological Service Canada
Environment and Climate Change Canada
Burlington, ON L7S 1A1