
LEVELnews: Great Lakes and St. Lawrence River water levels, November 2024
Download the alternative format
(PDF format, 272 KB, 6 pages)
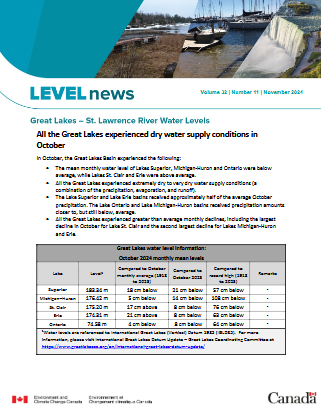
All the Great Lakes experienced dry water supply conditions in October
In October, the Great Lakes Basin experienced the following:
- The mean monthly water level of Lakes Superior, Michigan-Huron and Ontario were below average, while Lakes St. Clair and Erie were above average.
- All the Great Lakes experienced extremely dry to very dry water supply conditions (a combination of the precipitation, evaporation, and runoff).
- The Lake Superior and Lake Erie basins received approximately half of the average October precipitation. The Lake Ontario and Lake Michigan-Huron basins received precipitation amounts closer to, but still below, average.
- All the Great Lakes experienced greater than average monthly declines, including the largest decline in October for Lake St. Clair and the second largest decline for Lakes Michigan-Huron and Erie.
At this time of year, all the lakes are continuing their seasonal declines.
Low-lying areas are at risk for accelerated coastline erosion and flooding with the increased possibility of large storms and stronger winds in the fall months. For current information and forecasts, please refer to the sources listed at the end of this newsletter.
Additional information on fall and winter storm safety is provided below.
Get notified when a new edition of LEVELnews is available!
Did you know that you can be notified whenever a new edition of LEVELnews is available? Visit the LEVELnews subscription page to sign up for email notifications. You can unsubscribe at any time.
| Lake | Level1 | Compared to October monthly average (1918 to 2023) | Compared to October 2023 | Compared to record high (1918 to 2023) |
|---|---|---|---|---|
| Superior | 183.34 m | 18 cm below | 21 cm below | 57 cm below |
| Michigan–Huron | 176.42 m | 5 cm below | 14 cm below | 108 cm below |
| St. Clair | 175.20 m | 17 cm above | 8 cm below | 76 cm below |
| Erie | 174.31 m | 21 cm above | 8 cm below | 63 cm below |
| Ontario | 74.58 m | 4 cm below | 8 cm below | 64 cm below |
1 Water levels are referenced to International Great Lakes (Vertical) Datum 1985 (IGLD85). For more information, please visit International Great Lakes Datum Update – Great Lakes Coordinating Committee.
| Lake | October lake level change | October monthly average change (1918 to 2023) | Compared to average October change (1918 to 2023) | Remarks |
|---|---|---|---|---|
| Superior | 10 cm decline | 4 cm decline | greater than average decline | Fifth largest decline on record |
| Michigan–Huron | 17 cm decline | 7 cm decline | greater than average decline | Second largest decline on record |
| St. Clair | 30 cm decline | 10 cm decline | greater than average decline | Largest decline on record |
| Erie | 20 cm decline | 9 cm decline | greater than average decline | Second largest decline on record |
| Ontario | 23 cm decline | 11 cm decline | greater than average decline | Fifth largest decline on record |
1 Lake level changes are based on the differences in levels at the beginning of the month, not the monthly average levels.
| Lake | Level1,2 | Compared to November beginning-of-month average (1918 to 2023) | Compared to November 2023 | Compared to record high (1918 to 2023) |
|---|---|---|---|---|
| Superior | 183.31 m | 19 cm below | 19 cm below | 37 cm below |
| Michigan–Huron | 176.35 m | 7 cm below | 21 cm below | 91 cm below |
| St. Clair | 175.04 m | 8 cm above | 20 cm below | 66 cm below |
| Erie | 174.21 m | 15 cm above | 13 cm below | 56 cm below |
| Ontario | 74.48 m | 9 cm below | 9 cm below | 65 cm below |
1 At the beginning of November, all the Great Lakes were at least 11 cm above their chart datum level. Chart datum is a reference elevation for each lake that provides more information on the depth of water for safe boat navigation on the lakes. For more information, please visit Low Water Datum – Great Lakes Coordinating Committee.
2 Water levels are referenced to International Great Lakes (Vertical) Datum 1985 (IGLD85). For more information, please visit International Great Lakes Datum Update – Great Lakes Coordinating Committee.
Water levels forecast
Lake Superior ended the month below its average level and is expected to remain so under most water supply conditions.
Lake Michigan-Huron is expected to remain below average under typical and drier than average water supply conditions. However, wetter than average conditions would result in close to average water levels.
Lake Erie is expected to stay above average under most water supply scenarios. It would take dry water supply conditions for lake levels to fall below average by the end of the year.
Lake Ontario water levels are expected to remain below average under typical water supply conditions. However, wetter than average water supply conditions may result in above average lake levels in the next few months.
For more information on the probable range of water levels, consult the LEVELnews note on projections.
For a graphical representation of recent and forecasted water levels on the Great Lakes, refer to the Canadian Hydrographic Service’s monthly water levels bulletin.
| Lake | Precipitation – percentage of LTA (1981 to 2010)1,2 | Net basin supply (probability of exceedance)3,4 | Outflows (percentage of LTA)1 |
|---|---|---|---|
| Superior | 71% | 96% (extremely dry) | 90% |
| Michigan–Huron | 48% | 98% (extremely dry) | 103% |
| Erie | 67% | 99% (extremely dry) | 102% |
| Ontario | 44% | 95% (very dry) | 104% |
1 As a percentage of long-term average (LTA).
2 Environment and Climate Change Canada – Canadian Precipitation Analysis System. For more information, please visit: Technical documentation: Regional Deterministic Precipitation Analysis.
3 <5% extremely wet; <25% very wet; <45% wet; 45-55% average; >55% dry; >75% very dry; >95% extremely dry.
4 Please refer to the LEVELnews – What is net basin supply for a description of net basin supply.
Note: The information contained in this report is provisional and is subject to change. Data are calculated from the best available observations at the time of posting.
Fall and winter storms
Fall and winter can bring higher waves and storm surges on the Great Lakes. Winds blowing across long open water sections, or fetch, can cause large waves and push water levels up on the downwind side of the lakes, creating a storm surge.
The largest waves occur on Lake Superior, where historically, wave heights have approached 9 m. The largest storm surge occurs on Lake Erie, with the largest recorded surge producing about a 2.5 m rise. Although waves and storm surges are usually well below these maximums, they can create rapid changes in water levels that should be considered when undertaking activities on the shores of the Great Lakes.
In the coming months, higher waves and storm surges could increase the potential for erosion of some shorelines, especially steep shoreline bluffs made up of silts, sands, gravels and cobbles that are exposed to waves. Although erosion around the Great Lakes can cause significant changes to the shoreline that can impact property and activities around the lakes, it is also a naturally occurring process that helps support shoreline dynamics such as beach building and the natural ecosystem of the Great Lakes.
Keep in mind that conditions can change quickly along the shores of the lakes, and this can lead to dangerous conditions, especially if you are not prepared. Check the local forecasts and always keep a safe distance from the shoreline edge.
Flood information
Great Lakes water levels are difficult to predict weeks in advance due to natural variations in weather. To stay informed about Great Lakes water levels and flooding, visit the Ontario flood forecasting and warning program.
Additional information can also be found on the International Lake Superior Board of Control website and the International Lake Ontario–St. Lawrence River Board website.
Information on current water levels and marine forecasts
Monthly levels: Fisheries and Oceans Canada produces the Monthly Water Level Bulletin for the Great Lakes and Montréal Harbour. On this page you will find a link to the full bulletin PDF. This publication complements the information provided by LEVELnews monthly.
Daily levels: Current daily average levels of all the Great Lakes are available at Great Lakes – Daily Water Levels for This Month in Meters. The daily average water level is taken from several gauges across each lake and is a good indicator of the overall lake level despite local rises or falls in water levels owing to factors like high precipitation, wind and waves.
Hourly levels: Hourly lake levels from individual gauge sites can be found at the Government of Canada Great Lakes water level gauging stations map. These levels are useful for determining real-time water levels at a given site; however, it should be noted that they are subject to local, temporary effects on water levels such as wind and waves.
Marine forecasts: Visit the “Wave and wind data” section of the Great Lakes water levels and related data webpage for marine forecasts and wave heights. Current marine forecasts for Lakes Superior, Huron, Erie and Ontario are available as well as text bulletins of recent wave height forecasts.
For more information
Frank Seglenieks (Editor) and Sarah Fettah
Boundary Water Issues
National Hydrological Service
Meteorological Service of Canada
Environment and Climate Change Canada
Burlington, ON L7S 1A1