
Species sensitivity distributions for water quality guidelines and ecological risk assessment
Fact sheet series: Topics in risk assessment of substances under the Canadian Environmental Protection Act, 1999 (CEPA)
On this page
- Introduction
- i) Compiling and evaluating toxicity data
- ii) Fitting a statistical distribution to the data
- iii) Interpreting species sensitivity distributions
- Future directions
Introduction
Canadian ecosystems support significant biodiversity, with approximately 80,000 plant and animal species known to exist in Canada and potentially more yet to be discovered. Some species are more sensitive to particular substances while others may be less affected due to differences in their physiology, behaviours, or geographic distributions.
The Government of Canada publishes water quality guidelines (guidelines) and also develops predicted no-effect concentrations (PNECs) in their ecological risk assessments. These aim to identify the concentration of a substance in the environment below which adverse effects are unlikely to occur, typically following chronic or long-term exposure.
Two approaches are used to determine concentrations of substances with the goal of being protective of all species. The first is the assessment factor approach, which is used in cases where a substance has been studied on only a few species. Further information on this approach is provided in the fact sheet on Use of assessment factors in ecological risk assessment for deriving predicted no-effect concentrations. The second is the species sensitivity distribution (SSD) approach which is used when the toxicity of a substance has been studied on a broader range of aquatic species representing multiple species categories (for example, fish, invertebrates, plants). This statistical approach can be used to estimate the concentration of a substance that is potentially hazardous to only a small percentage of species and used as a PNEC.
Of the 2 approaches, the Government of Canada uses the assessment factor approach more often, particularly in the context of risk assessment, as most substances have minimal toxicity data available. However, when sufficient data exist, SSDs are the preferred approach.
This fact sheet summarizes the approach to deriving an aquatic SSD set out by the Canadian Council of Ministers of the Environment (CCME). Advanced explanation and detailed guidance for deriving freshwater and marine SSDs can be found in the Protocol for the Derivation of Water Quality Guidelines for the Protection of Aquatic Life 2007.
The approach for deriving SSDs is typically divided into 3 steps:
- compiling and evaluating toxicity data
- fitting a statistical distribution to the data, and
- interpreting the results
i) Compiling and evaluating toxicity test data
The first step in creating an SSD involves identifying aquatic toxicity studies for the substance of interest and evaluating them for reliability and environmental relevance. Only studies determined to be of acceptable quality are used to develop an SSD.
A key assumption of the SSD approach is that the dataset contains a representative sample of species present in the environment. While it is impossible to represent all species in the Canadian environment, it is important to include all available and acceptable data in the SSD to best represent Canada's biodiversity and the range of sensitivities to substances. The minimum number of species needed to derive SSDs varies depending on the specific goal. For most situations in Canada, a minimum of 7 distinct species are needed to derive an SSD. Typically, this must include at least 3 fish species, 3 aquatic or semi-aquatic invertebrates, and 1 aquatic plant or algal species.
The type of toxicity data collected and evaluated may be either short-term (acute) or long-term (chronic) effect measurements depending on the purpose for constructing the SSD. For example, short-term data may be used to derive a short-term benchmark that gives guidance on the impacts of severe but transient events such as spills to the aquatic environment. Similarly, long-term data may be used to derive a concentration that protects aquatic life for long exposures. The measured effects of interest can range from lethality to various sub-lethal effects, such as impaired growth or reproduction. The compiled data should be consistent in terms of both the duration of exposure (short- versus long-term) and the severity of effect (lethal versus sub-lethal). Ensuring this consistency across the compiled studies means that the differences in endpoint concentrations should mostly result from variability in species sensitivities.
Each species in the SSD is represented by a single data point representing 1 or more experimental results. Typically, the most protective toxicity endpoint for each species is chosen for inclusion in the SSD.
ii) Fitting a statistical distribution to the data
Following data collection and evaluation, statistical software tools are used to fit 1 or more statistical distributions (for example, log-normal, log-logistic, etc.) to the selected toxicity data. The ssdtools software package, published by the Government of British Columbia, is presently the most frequently used tool by the Government of Canada for deriving aquatic SSDs for guideline development and ecological risk assessments.
The statistical distributions are often plotted to give a visual representation of the relative positioning of species in terms of their sensitivity to the substance and are usually represented as sigmoidal (S-shaped) curves (see Figure 1).
Once the SSD is constructed, graphical and statistical assessments of goodness of fit are required. This is necessary to ensure that the fitted model adequately describes the data and that the result is statistically sound and scientifically defensible.
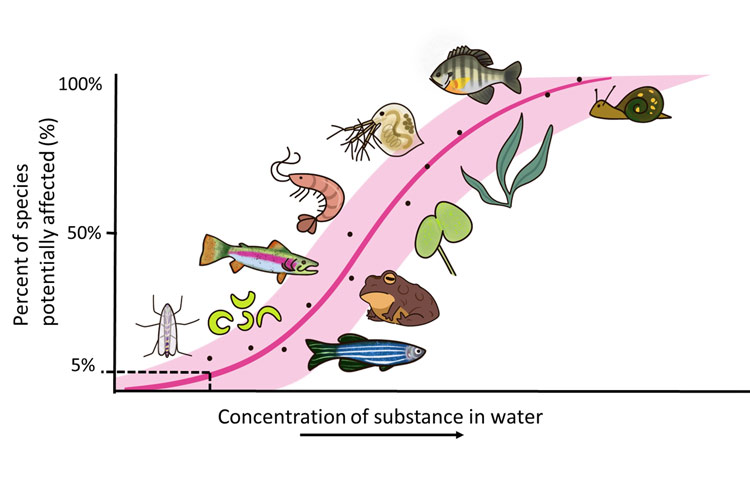
Figure 1 - Text Description
Figure 1 is a plot of endpoint concentrations for a substance in water on the x-axis, and percent of affected species on the y-axis. A point on the fitted distribution is often interpreted as the percent of species affected or potentially affected at a given concentration of the substance in water. The figure shows a species sensitivity distribution for 1 substance (solid pink line) surrounded by the confidence interval (shaded areas surrounding the line). Species names are often indicated beside data points on species sensitivity distributions. In this figure, not-to-scale illustrations of various species are used to illustrate the concept: a midge, green algae, zebrafish, rainbow trout, toad, freshwater shrimp, duckweed, water flea, generic aquatic plant, sunfish, and a freshwater snail. A dotted line identifies the substance concentration at the 5th percentile of species potentially affected.
iii) Interpreting species sensitivity distributions
Water quality guidelines and PNECs are typically identified from the 5th percentile of the fitted SSD curve (see Figure 1).
With smaller datasets, the 5th percentile value can be lower than the lowest toxicity value in the SSD. This is considered appropriate to achieve the protection goal of guidelines and PNECs, as there may be species that are more sensitive than those available in the smaller dataset. Conversely, when a toxicity value is found below the 5th percentile value, the data point is reviewed to determine if a different percentile should be considered for the guideline or PNEC. Particular attention is given when toxicity values below the 5th percentile represent lethality data, involve species at risk, or if there are several values clustered around the 5th percentile. In the case of the PNEC used for risk assessment, the 5th percentile value is most often used directly, but may be divided by an assessment factor if deemed necessary. For example, in a situation when only data sufficient to construct an SSD with short-term or lethality-based endpoints for a substance are available, the 5th percentile value may be divided by an assessment factor to derive a PNEC intended to protect organisms from sub-lethal effects over long-term exposures.
Future directions
SSDs are a robust approach for setting guidelines and PNECs that can provide increased confidence that the values are protective of the most sensitive species in the Canadian environment. The approaches to derive an SSD continue to advance and are adaptable based on the best available science. For example, updated distribution modelling approaches, such as fitting multiple distributions and calculating a weighted averaged 5th percentile, have been recently incorporated into the Canadian methodology. In addition, consideration is now being given to bi-modal distributions (with 2 peaks) that can better characterise toxicity data showing large differences in sensitivities. This is particularly seen with substances that have specific modes of action where the toxicity to 1 category of species may be markedly different from that to another category of species. The Government of Canada is also investigating the integration of non-traditional toxicity data (using New Approach Methods) as it is an area of particular scientific relevance to the advancement of ecological risk assessment.