
Adapting to Extreme Heat Events: Guidelines for Assessing Health Vulnerability

Download
Order a copy
Paper
Prepared by: Water, Air and Climate Change Bureau Healthy Environments and Consumer Safety Branch
2011
ISBN: 978-1-100-18659-7
Cat. No.: H128-1/11-654E
HC Pub.: 110112
Acknowledgements
Health Canada gratefully acknowledges the contribution of the following people to the development of this document:
- Carlos Corvalan
- Pan American Health Organization
- Kristie Ebi
- Carnegie Institution for Science
- Pierre Gosselin
- Institut national de santé publique du Québec and Université Laval
- Norman King
- Montreal Public Health Department
- Tom Kosatsky
- British Columbia Centre for Disease Control
- George Luber
- United States Centers for Disease Control and Prevention
- Toni Morris-Oswald
- Manitoba Health, Office of Disaster Management
- Dawn Paszkowski
- University of British Columbia
- Barry Smit
- University of Guelph
- Sue Sullivan
- Canadian Public Health Association
To receive more information about climate change and health activities at Health Canada, please contact: Climatinfo@hc-sc.gc.ca.
Table of Contents
- Foreword
- 1. Introduction
- 2. Vulnerability to the Health Impacts of Extreme Heat
- 3. Guidelines for Conducting Extreme Heat and Health Vulnerability Assessments
- 3.1 Assessment Methodology
- 3.2 Assessment Steps
- Step 1: Initiate the assessment
- Step 2: Describe current vulnerability to extreme heat events
- Step 3: Assess future health risks associated with extreme heat events
- Step 4: Identify and prioritize adaptation options to address current and projected health risks from extreme heat events
- Step 5: Examine the potential health risks and benefits of adaptation and mitigation measures implemented in other sectors
- Step 6: Develop protocols for evaluating adaptation options and monitoring heat-health risks
- 4. Conclusion
- Glossary
- References
Foreword

A number of studies have documented the growing risks to the health of Canadians from more frequent and severe extreme heat events. Such risks were identified as a key concern in Health Canada's report Human Health in a Changing Climate: A Canadian Assessment of Vulnerabilities and Adaptive Capacity.Footnote 1 Public health officials have recognized the need to prepare their communities and vulnerable populations for extreme heat events, and are seeking information about the best ways to safeguard health. To this end, Health Canada is taking action to help Canadians become more resilient in the face of a changing climate. As more communities in Canada begin to develop systems to reduce risks to health from extreme heat, they require knowledge about strategies and actions that can be taken to effectively address local vulnerabilities.
A major component of public health efforts to protect people from extreme heat events centres on assessments of individual and community level vulnerability. Adapting to Extreme Heat Events: Guidelines for Assessing Health Vulnerability provides an overview of the vulnerability assessment methodology that has been developed by Health Canada, with support from a range of partners active in efforts to prepare people for climate change. In developing this guidance, leading experts and stakeholders from local communities helped to identify and articulate the risks to the health of Canadians from extreme heat and the range of viable adaptation options. The assessment steps and methods set out in this document were tested through the completion of four extreme heat and health vulnerability assessments in partnering pilot communities - Winnipeg, Manitoba; the town of Melita in the Assiniboine Regional Health Authority, Manitoba; Windsor, Ontario; and Fredericton, New Brunswick. Lessons learned, as well as best practices for investigating risks and necessary adaptation actions, are provided here to help public health and emergency management officials better protect the health of Canadians from extreme heat events.
1. Introduction
It is now well established that climate change poses significant risks to the health of Canadians and people around the world.Footnote 1 One of the key issues - health risks from extreme heat eventsFootnote a - is an emerging public health concern. The 2003 extreme heat event in Europe that resulted in 70,000 deathsFootnote 4 and the 2010 event in Russia that resulted in an estimated 55,000 deathsFootnote 5 demonstrate the significant toll on health that such events can have.
Extreme heat is a health concern in Canada as well; research indicates that in Toronto alone an average of 120 people died from extreme heat annually between 1954 and 2000.Footnote 6 In 2005, Toronto experienced 41 extremely hot days exceeding 30°C/86°FFootnote 7 during which health officials called a total of 26 heat alert days to warn the public of the dangerous conditions. In British Columbia, an extreme heat event from July 27 to August 3 in 2009 resulted in 156 excess deaths as temperatures reached 34.4°C/93.9°F.Footnote 8
Heat-related deaths are preventable, and assessments of individual and community vulnerability can help in efforts to reduce mortality associated with extreme heat events. The Intergovernmental Panel on Climate Change (IPCC) defines vulnerability to climate change as the degree to which a system is susceptible to, or unable to cope with, the adverse effects of climate variability and change.Footnote 18 Current and future factors influencing health outcomes, including potential risks and protective measures, are investigated when assessing heathealth vulnerability.Footnote 9
The vulnerability of individuals and communities will vary according to the level of exposure to extreme heat, the sensitivity of individuals to health impacts, and the programs and activities that directly or indirectly lower risks to health. Examples of factors that affect vulnerability include regional climate, population health status, socio-economic conditions, the state of local infrastructure, knowledge of heat-health risks and protective measures, the presence or absence of Heat Alert and Response Systems (HARS), and the strength of social networks and agencies. A vulnerability assessment examining these kinds of factors can provide decision makers and the public with the knowledge of characteristics and trends that increase or decrease their communities' resilience to extreme heat events. This knowledge then allows for the development of effective interventions (e.g., public health programs, transportation services, urban heat island mitigation) so that individuals and communities can protect those most vulnerable to extreme heat-health impacts.Footnote 1,Footnote 3
Several documents and conceptual frameworks provide direction for the application of methods to assess vulnerability to a broad range of climate change impacts and to develop adaptation strategies.Footnote 11 In this regard, the World Health Organization (WHO) and the Pan American Health Organization (PAHO) have developed guidance to be used by both developing and developed countries for assessing the vulnerability of individuals and communities to all climate change impacts on health.Footnote 16
However, little information is available to address considerations specific to the assessment of vulnerability to the health impacts of extreme heat events. This document, Adapting to Extreme Heat Events: Guidelines for Assessing Health Vulnerability (the Guidelines), addresses this need. The stakeholders and assessment steps relevant to the investigation of heat-health vulnerabilities in Canadian communities are presented along with examples of method application and information on key challenges and limitations.
1.1 Benefits of Conducting an Extreme Heat and Health Vulnerability Assessment
An extreme heat and health vulnerability assessment is undertaken to determine existing levels of risk, identify and better understand vulnerabilities, and stimulate actions to increase the resilience of individuals and communities.
Assessments can help health agencies manage competing demands by describing current heat-related health risks, vulnerable groups, existing public health interventions, and adaptive actions, thereby focussing attention and resources on addressing specific needs. A well-designed and executed assessment provides sufficient information to assist in making policy and program recommendations to agencies that lead community efforts to reduce heat-health risks. In Canada, the responsibility for mobilizing these efforts can reside with a range of agencies - local, regional, or provincial public health departments, and emergency management organizations. Partnering organizations and officials, such as city planners, parks and recreation departments, transportation planners, health care practitioners, and social service providers (e.g., Canadian Red Cross) can contribute to and benefit from the results of an assessment. The process of completing an assessment will identify key players and establish a set of cross-cutting institutional linkages, and can be used to garner senior management support that can convert the recommendations into action.
Other benefits that result from completing an assessment include the development of baseline information about vulnerability to extreme heat events as well as an increased capacity to acquire and analyze needed data. An assessment can also serve as a mechanism to mobilize interdisciplinary groups and stakeholders to come together and collaborate in the identification of actions to increase the resiliency of a community.Footnote 1 Whatever the current level of knowledge and coping ability, the long-term benefits of conducting an assessment include moving an organization, or an entire community, towards increased awareness, capacity, and expertise on extreme heat and health issues.
1.2 Structure of the Guidelines
This document is structured to provide practical guidance for conducting extreme heat and health vulnerability assessments as a means to inform actions that can be taken to prepare communities for an increase in the number, intensity, and duration of extreme heat events. Development of the Guidelines was informed by input from a group of international and Canadian experts and stakeholders to ensure that the information presented meets the needs of decision makers tasked with protecting the health of the public.
This document provides information on understanding the health risks of extreme heat events and undertaking an assessment. Section 2 discusses the exposure of Canadians to extreme heat events, provides information on the sensitivity of individuals to health impacts, and highlights the role of HARS as an adaptation strategy. Section 3 presents the assessment steps for identifying current and future vulnerability of individuals and communities to extreme heat events using both qualitative and quantitative methods. Key assessment tasks and methods for each step are explained in table form, and are accompanied by examples to aid in the application of the Guidelines.
2. Vulnerability to the Health Impacts of Extreme Heat
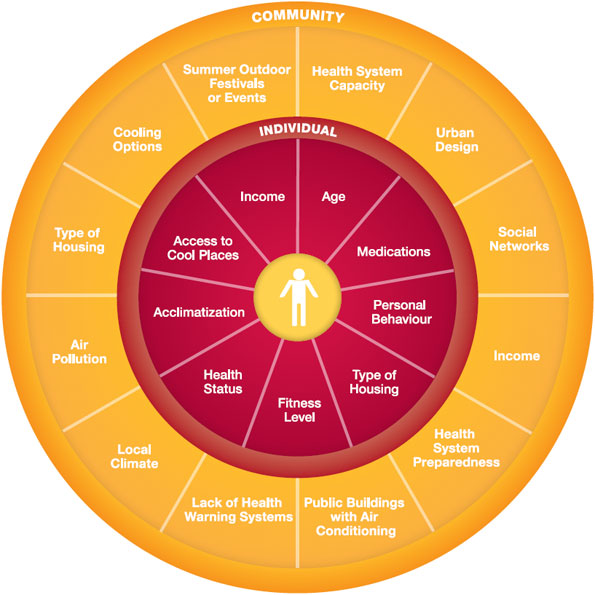
Every individual reacts differently to heat stress, and some communities in Canada are at much greater risk from extreme heat events than others. The health impacts from extreme heat depend upon the vulnerability of individuals and communities; this vulnerability is a function of exposure to extreme heat, physiological sensitivity to heat stress, and the capacity to adapt by taking measures to protect health. Assessments of vulnerability use analyses of data and expert knowledge acquired through consultation with local stakeholders to identify the factors that are most relevant to an investigation for a specific community. Vulnerability to the health effects of extreme heat can often be traced to a combination of factors operating at both the individual and community levels as is shown in Figure 1.
Figure 1: Factors that influence individudal and community level vulnerability to extreme heat events
Figure 1: Factors that influence individudal and community level vulnerability to extreme heat events
A circle diagram has an outer (community factors) and inner ring (individual factors), and an individual at the centre of the rings. Community factors include summer outdoor festivals or events, health system capacity, urban design, social networks, income, health system preparedness, public buildings with air conditioning, lack of health warning systems, local climate, air pollution, type of housing, and cooling options. The individual factors include income, age, medications, personal behaviour, type of housing, fitness level, health status, acclimatization, and access to cool places. A stylized person is at the center of the two rings indicating that both individual and community factors influence a person's total vulnerability.
2.1 Exposure to Extreme Heat
Extreme heat as a health risk is a growing concern to individuals and communities in Canada. Most jurisdictions define extreme heat events based on the potential for hot weather conditions to result in an unacceptable level of health effects, including increased morbidity and mortality. Given the differing nature of meteorological factors and heat-related vulnerabilities across Canadian communities, and the requirement to set different alert triggers to reduce impacts on health, multiple definitions are used in practice. Environment Canada defines a "heat wave" as "three or more consecutive days in which the maximum temperature is greater than or equal to 32°C/90°F."Footnote 7 However, temperature is only one component of heat, which also depends on humidity, wind speed, and radiant load. At the level of the individual, health risks depend on exposure, sensitivity, acclimatization, and adaptability to extreme heat - that is, heat vulnerability.
Climate projections reveal that many Canadian communities can expect a significant increase in extreme heat events (hot days and warm nights) that can negatively impact health (Figure 2). Without effective actions to reduce health risks, the impacts of climate change could increase heatrelated illness and deaths among Canadians.
Figure 2: Historical and projected number of hot days and warm nights for selected cities in CanadaFootnote c
Figure 2: Historical and projected number of hot days and warm nights for selected cities in CanadaFootnote c
Two bar charts show the number of hot days and warm nights, respectively, for seven Canadian cities (Fredericton, Montreal, Kingston, Toronto, Hamilton, Windsor, Winnipeg). The numbers are based on the observed temperature data between 1961 and 2000, and projected for 2011-2040, 2041-2070 and 2071-2100 using Canadian climate models (Scenario A2).
Bar chart for hot days above 30°C/86°F reads:
- 1961-2000: Fredericton = 9, Montreal = 9, Kingston = 4, Toronto = 13, Hamilton = 15, Windsor = 22, Winnipeg = 14
- 2011-2040: Fredericton = 16, Montreal = 18, Kingston = 9, Toronto = 28, Hamilton = 24, Windsor = 35, Winnipeg = 30
- 2041-2070: Fredericton = 24, Montreal = 27, Kingston = 15, Toronto = 48, Hamilton = 36, Windsor = 48, Winnipeg 35
- 2071-2100: Fredericton = 40, Montreal = 44, Kingston = 32, Toronto = 59, Hamilton = 56, Windsor = 64, Winnipeg = 58
Bar chart for warm nights above 22°C/72°F reads:
- 1961-2000: Fredericton = 0, Montreal = 2, Kingston = 3, Toronto = 2, Hamilton = 2, Windsor = 5, Winnipeg = 2
- 2011-2040: Fredericton = 1, Montreal = 6, Kingston = 10, Toronto = 5, Hamilton = 4, Windsor = 10, Winnipeg = 3
- 2041-2070: Fredericton = 3, Montreal = 10, Kingston = 17, Toronto = 7, Hamilton = 7, Windsor = 22, Winnipeg 4
- 2071-2100: Fredericton = 4, Montreal = 22, Kingston = 32, Toronto = 22, Hamilton = 19, Windsor = 40, Winnipeg = 8
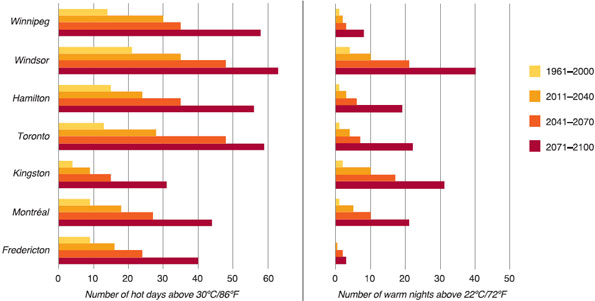
Source: Casati, B. and Yagouti, A. (In Press).Footnote 23
Larger cities can be especially susceptible to extreme heat events because of the urban heat island effect (Box 1). Furthermore, high temperatures can increase the chemical reactions involved in the creation of air pollution resulting in greater risks to health.19,20
Box 1: What is the Urban Heat Island Effect?
The term "urban heat island effect" refers to how urban centres tend to have air and surface temperatures hotter than those of nearby rural areas. This local human-induced condition is caused by the higher heat absorption of urban materials (e.g., concrete, brick, asphalt), the reduction of natural convective cooling due to the presence of tall buildings, and the lack of green spaces that decrease evaporative cooling.Footnote 21 The air temperature difference can be as high as 12°C/22°F in the evening.Footnote 22 Climate change may intensify the urban heat island effect in metropolitan areas. The urban heat island effect can be reduced by increasing the reflectivity of urban surfaces or by increasing green cover in a community through the development of urban forests, parks, or rooftop and vertical gardens.Footnote 22
2.2 Sensitivity of Canadians to the Health Impacts of Extreme Heat
Physiologically, extreme heat can affect the body's thermoregulation by impairing the mechanisms that allow it to maintain a constant core temperature. During extreme heat events, many people with underlying health conditions (e.g., respiratory and cardiovascular conditions) may experience a worsening of, or succumb to, those conditions.24 Some may experience direct impacts on health, such as heat stroke, exhaustion, fainting, cramps, rash, and edema.Footnote d Access to intervals of cooler temperatures (e.g., air conditioning or cool nights) helps to reduce heat stress. Longer durations of extreme heat including high nighttime temperatures, and poor air quality are all factors that can negatively affect health outcomes. Heat illness and deaths are preventable, but they do occur - mainly because people have been overexposed by not changing their behaviours to adjust to the heat. For example, individuals are at a greater risk if they overexert themselves for their age and physical condition or do not check with their medical practitioner about how the medications they are taking may increase their sensitivity to heat. Moreover, the health risks are higher for those who are not regularly exposed to hot environments.Footnote 25,Footnote 26
Extreme heat events early in the summer generally result in higher morbidity and mortality than those later in the season partially because of a lack of acclimatization.Footnote 25 Acclimatization occurs owing to gradual exposure to heat resulting in physiological changes that make a person better able to handle heat.Footnote 27 The body's ability to acclimatize may be limited for some vulnerable populations - older adults, infants and young children, and people with chronic illnesses.Footnote 28 Table 1 describes heat-vulnerable groups and their challenges, which have been identified in the literature. Understanding heat vulnerabilities of specific populations is important for identifying effective public health interventions that can reduce the harmful effects of extreme heat.
2.3 Adapting to Protect Health: Heat Alert and Response Systems
To reduce negative health impacts from extreme heat events, public health and emergency management officials should assess local vulnerabilities and develop necessary policies and programs, such as HARS. Heat alert and response systems centre on efforts to alert health authorities and the public when hazardous conditions arise, provide advice on how health risks can be minimized, and offer assistance to those in need during emergency situations. Although these systems have been in place in some cities across the United States since the mid-1990s and in Toronto since 1999, only during the last few years have a number of Canadian cities and communities begun to develop formal HARS. Typically, HARS include some or all of the following components:
Box 2: Heat Meter Used by the City of Hamilton
Box 2: Heat Meter Used by the City of Hamilton
A half circle gauge used by the City of Hamilton to communicate heat-health risk. The gauge has a monitoring stage shown in gray and three alerting stages: stage 1 (heat advisory) = yellow; stage 2 (heat warning) = orange; stage 3 (heat alert) = red.
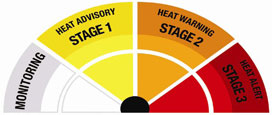
Source: City of Hamilton10
- Alert Protocol - identifies extremely hot weather conditions that could result in increased morbidity and mortality in a region; alerts government officials and stakeholders (e.g., managers of long-term care facilities) who can then take actions to reduce health risks (e.g., inform the target audience and/or provide emergency cooling relief).
- Community Response Plan - facilitates actions by individuals to protect themselves during periods of extreme heat; directs public health interventions aimed at reaching vulnerable individuals who require assistance; develops a network of stakeholders with the goals of reducing barriers to action and meeting the needs of people in the community, especially those who are most heat-vulnerable.
- Communication and Outreach Plan - raises awareness about heat-health impacts; provides advice on how to reduce health risks by educating audiences about protective actions; provides information on services and resources that are available to service providers and the public (Box 2).
- Evaluation Plan - directs HARS evaluation activities to understand the extent to which the alert protocol and response measures are timely, relevant, and effective; provides continual improvement to the HARS to meet the needs of the community.
An effective HARS requires coordinated action across government authorities, involvement of private sector participants and community service organizations, and the ability to address multiple risk factors in the population.Footnote 47 There is wide variation in the types of HARS used in communities across Canada. Box 3 provides information on the City of Greater Sudbury's Hot Weather Response Plan.
Vulnerabilities within a community may increase or decrease over time as demographics, health status, exposure to extreme heat events, and access to health and social services change. Therefore, HARS should be evaluated regularly to ensure that they are contributing to a reduction in heat-related illnesses and deaths. Assessments of vulnerability help to inform the improvement of existing systems and the development of new ones in communities where they do not exist.
Box 3: City of Greater Sudbury - Hot Weather Response Plan
When hot weather conditions exist or are imminent, the City of Greater Sudbury's Hot Weather Response Plan is intended to alert those most at risk of heat-related illness so that they may take appropriate precautions. The system has three levels:
- Level 1 - Heat Advisory
- A humidex of 36 for at least 48 consecutive hours is forecast.
- The City Emergency Management Division informs all community heat response partners of the decision to issue an advisory.
- The Health Unit issues a news release and posts a web notice informing the public of the advisory with heat-risk information as well as protective and preventative measures. The emphasis is on the need for citizens to check in on individuals who may be vulnerable.
- Level 2 - Heat Alert
- A humidex of 40 for at least 48 consecutive hours OR a humidex of 36 for at least 48 consecutive hours with a smog alert is forecast.
- All actions listed in Level 1 continue.
- News releases are jointly prepared and released by the City and the Health Unit.
- The City may implement any or all of the following actions, as appropriate:
- Distribute bottled water to vulnerable populations in conjunction with community partners.
- Expand locations and hours of operation of city pools.
- Expand hours of operation and supervision at municipal beaches.
- Request that local utilities halt service cancellations for the duration of the heat advisory.
- Open cooling centres at city facilities.
- Level 3 - Extreme Heat Alert
- A humidex of 45 for at least 48 consecutive hours OR a humidex of 40 for at least 48 consecutive hours with a smog alert is forecast.
- All actions listed in Level 1 and Level 2 continue.
- The City may implement any or all of the following actions, as appropriate:
- Activate the Municipal Emergency Response Plan.
- Consider extending hours at cooling centres to 24 hours a day.
- Evacuate high-risk individuals to cooling centres.
- Offer free transit service to cooling centres.
- Increase public outreach, using police, postal workers, and utility staff.
- Distribute water more broadly and distribute fans.
The City of Greater Sudbury's Hot Weather Response Plan has provisions for deactivation of the heat alerts, as well as for evaluation of the effectiveness of their system.
Source: City of Greater Sudbury and Sudbury and District Health Unit, 2010.Footnote 48
3. Guidelines for Conducting Extreme Heat and Health Vulnerability Assessments
3.1 Assessment Methodology

Protecting Health from Climate Change
Protecting Health from Climate Change
Front cover of a resource authored by the World Health Organization entitled, Protecting Health from Climate Change: Vulnerability and Adaptation Assessment.

The methodology for conducting extreme heat and health vulnerability assessments presented below is based on the WHO/PAHO report Protecting Health from Climate Change: Vulnerability and Adaptation Assessment.Footnote 16 This document presents a framework for conducting a vulnerability, impact, and adaptation assessment at the community, regional, or national levels for all climate change and health issues of concern. Drawing from the direction provided by WHO/PAHO, the Guidelines presented here provide information on:
- engaging stakeholders throughout the assessment process
- describing existing vulnerability to extreme heat events
- projecting future extreme heat events and possible increases in morbidity and mortality
- identifying and prioritizing adaptation options to address current and projected heat-related health risks
- determining the potential health risks and benefits of adaptation and mitigation measures implemented in other sectors
- developing protocols for monitoring heat-health risks and evaluating the adaptation options
Assessments may employ a broad range of health data, analytical methods, and tools. Key methods are likely to include literature reviews, stakeholder consultations, epidemiological studies, expert judgement, climate models, and climate scenarios.
3.2 Assessment Steps
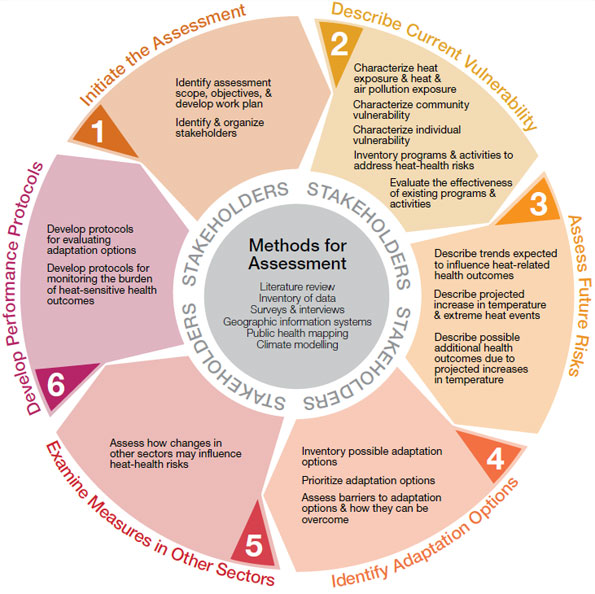
To conduct a comprehensive assessment of health vulnerability to extreme heat events, six steps should be completed. Figure 3 identifies key components of each step, and emphasizes that stakeholder engagement should occur throughout the entire assessment. Examples of the types of methods that can be used to investigate and reach a step's desired outcome are provided in the centre of the figure. Some methods (e.g., literature review) may be used in a number of steps, whereas other methods (e.g., developing climate projections) may be employed only for a specific component of the investigation. An assessment need not cover all steps if public health authorities determine that a focus on specific aspects of current or future vulnerability is warranted, if there are certain limitations (e.g., time, data, expertise), or because of the nature of the objectives identified through stakeholder consultation.
Figure 3: Steps for conducting an extreme heat and health vulnerability assessment
Figure 3: Steps for conducting an extreme heat and health vulnerability assessment
A circular figure illustrates how the assessment guidelines are broken-down into six steps. The objective of the each step is shown on the outside of the parameter of the circle: step 1) initiate the assessment; step 2) Describe current vulnerability; step 3) assess future risk; step 4) identify adaptation options; step 5) examine measures in other sectors, step 6) develop performance protocols. The individual tasks associated with each step's objective are included in boxes that form a ring in the circle figure. The task listed for each step read: step 1) identify assessment scope, objectives, and develop work plan; identify and organize stakeholders; step 2) Characterize heat exposure, and heat and air pollution exposure; characterize community vulnerability; characterise individual vulnerability; inventory programs and activities to address heat-health risks; evaluate the effectiveness of existing programs and activities; step 3) describe trends expected to influence heat-related health outcomes; describe projected increase in temperature and extreme heat events; describe possible additional health outcomes due to projected increases in temperature; step 4) inventory possible adaptation options; prioritize adaptation options; assess barriers to adaptation options and how they can be overcome; step 5) assess how changes in other sectors may influence heat-health risks: step 6) develop protocols for evaluating adaptation options; develop protocols for monitoring the burden of heat-sensitive health outcomes. In the centre of the circular figure, the following assessment methods that may be applied during an assessment are listed: literature reviews, inventory of data, surveys and interviews, geographic information systems, public health mapping and climate modelling. Stakeholders are also located in the center of the circular figure to signify that they have an essential role throughout the assessment process.
The steps for conducting an assessment follow. Each step is accompanied by a table providing detailed information on key tasks, methods, and expected outcomes. The implementation of each step should be tailored to meet the specific objectives of the individual assessment being undertaken.

1 Initiate the assessment
An important first activity in initiating the assessment is defining its scope; this requires engaging knowledgeable participants to identify the geographic region to be studied, the objectives of the assessment, measures of success, the audience, and potential partners. Assessment objectives and measures of success should be tailored to meet the needs of the decision makers and organizations that are the target audience for the report. The main users of the assessment should be asked to review the proposed scope and objectives.
It is at this point that limitations (e.g., time, data, expertise) should be identified. This will require an initial investigation of the types of data and information that are necessary to complete the assessment and that are available at community, provincial, and national levels. If not all assessment steps can be undertaken, focus should be placed on those steps that are needed to achieve priority objectives. Reviewing previously conducted heat-health vulnerability assessments or consulting with officials that have undertaken assessments can be helpful when defining the scope of the assessment (Box 4).
Box 4: Assessment of Vulnerabilities to Extreme Heat in California
As part of a series of scientific studies on climate change health impacts, the California Climate Change Public Health Impacts Assessment and Response Collaborative conducted an assessment of vulnerability to heat-related illness and mortality in 2007.Footnote 49 The report identified county- and community-specific risks and vulnerabilities in California, and preventative actions to protect health. The assessment included the following steps:
- Review the clinical spectrum of heat-related illness.
- Develop a model of population vulnerability based on
- historic heat data in California,
- characteristics of the heat deaths in California during the summer of 2006 (Figure 4), and
- identification of demographic characteristics associated with population vulnerability to heat.
- Identify vulnerable geographic areas based on adaptive capacity.
Figure 4: Geographic distribution of deaths in California due to heat - July, 2006
Figure 4: Assessment of Vulnerability to Extreme Heat in California
A map of California State displays proportional circles representing the number of deaths recorded for each county (not labelled). The map is also color graded from light yellow to dark brown. The darker the color, the higher the temperature (49°C/121°F). There are three sizes of circles: large circles for 10 deaths, medium circles for 5 deaths, and small circles for 1 death. The map shows several large circles located inland throughout mid-central California, and a few middle circles inland in southern California. These areas are also medium to dark brown. This illustrates that more deaths occurred in counties that experienced high temperatures.
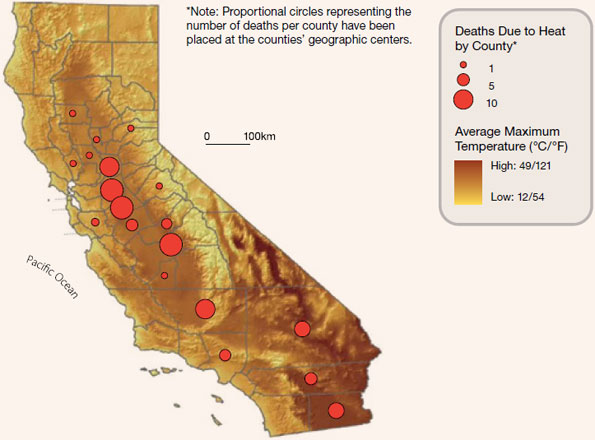
The assessment results are helping decision makers in California facilitate the development of effective public health interventions, such as the provision of targeted information, so that individuals can take the measures necessary to protect themselves and their family members.
Source: English et al., 2007.Footnote 49
Identifying the health outcomes of interest is important in the initial phase of the assessment. Studies have indicated that increases in ambient temperature have important impacts on morbidity as well as mortality.Footnote 50 If morbidity is being examined, then decisions will need to be made as to how it will be assessed (e.g., hospital admission records), which illnesses associated with heat will be investigated (e.g., ischemic stroke, respiratory diseases, dehydration, diabetes, renal failure),Footnote 50 and whether sufficient local data exists for this type of analysis.
Engaging Stakeholders
Special consideration needs to be given to the identification and engagement of stakeholders that should be included in the assessment. In general, stakeholders may come from local, regional, or provincial public health departments, emergency management organizations, parks and recreation departments, transportation planning agencies, health care organizations, and social service providers. Community planners, citizen groups, faith-based organizations, and private sector officials who provide essential services may also be included.
When identifying possible stakeholders, consideration should be given to the degree to which they:
- will be involved in the design, implementation and monitoring of public health and health care interventions to reduce risks from extreme heat
- are affected by the issue
- represent vulnerable populations
- can facilitate achievement of the assessment objectives
- can influence policy and program development
Because some organizations may not have the breadth or depth of in-house expertise available to conduct or participate in some aspects of an assessment, the addition of external expertise may be both desirable and necessary.
Once stakeholders are identified, the project lead will need to develop a process for acquiring input from them to contribute to the design and conduct of the assessment, and communication of the results. Developing a stakeholder engagement plan may assist in organizing stakeholders into categories, such as stakeholders who are partners and directly involved and those who may be consulted or regularly informed of progress. Community consultations, a community committee, a project advisory committee, and an expert review group are mechanisms to engage various stakeholders throughout the assessment.
If necessary, training workshops can be hosted by the project lead to build capacity and increase the knowledge of stakeholders about issues relevant to the assessment. Stakeholders should be engaged throughout the entire assessment process. However, stakeholders may change at various steps of the assessment as different information requirements arise - for example, input from experts in other sectors (e.g., transportation, infrastructure, urban planning, energy systems).


2 Describe current vulnerability to extreme heat events
The objective of this step is to describe the current vulnerability of individuals and the community to extreme heat events. This is accomplished by examining the current burden of heat-related health outcomes, social and personal factors that affect the ability to cope with extreme heat, current exposure at the community level to extreme heat events, and current programs and activities that address existing health risks. The description of the current distribution and burden of heat-related health outcomes may be qualitative or quantitative, depending on the information and resources available. It should include the consideration of individuals and regions that are most vulnerable to the effects of extreme heat. The types of data and information necessary for the assessment at this stage may be available at community, provincial, and/or national levels (Table 2).
Mortality data obtained from provincial health departments (available in some regions) or Statistics Canada can be used to quantify the relationship between extreme heat events and excess deaths. The historical temperature record can be compared to trends in excess deaths to identify any association between these two variables (Box 5).
The description of community vulnerability to extreme heat should capture the existence of both preventative (e.g., reduction of the urban heat island effect) and responsive (e.g., cooling centres) programs, and activities addressing the burden of heat-related health outcomes, as well as planned changes to them. Different metrics can be used to measure levels of exposure to extreme heat and the effectiveness of programs and policies aimed at reducing health risks. Examples of measures that can be used when evaluating programs include trends in heat-related health outcomes, utilization of community cooling centres during extreme heat events, percentage of vulnerable people receiving assistance during extreme heat events (e.g., distribution of water), and audience penetration of heat-health communications messages.
To provide information about vulnerability for planning public health interventions, the results of the analysis can be mapped using geographic information systems (GIS) at the community level. Information about current individual and community-level vulnerability (i.e., challenges and opportunities faced by people in efforts to protect their health) acquired from citizens and stakeholders should be included in the analysis, when available.
Box 5: Relationship Between Temperature and Mortality in Winnipeg, Manitoba
To investigate health risks associated with extreme heat in the City of Winnipeg the relationship between temperature and excess mortality was examined. The association between all non-traumatic daily deaths that occurred from June 1, 1986, to August 31, 2005, and the corresponding maximum daily temperatures was plotted on a graph (Figure 5).
Figure 5: Association between non-traumatic daily deaths and maximum daily temperatures in Winnipeg from 1986 to 2005
Figure 5: Association between non-traumatic daily deaths and maximum daily temperatures in Winnipeg from 1986 to 2005
A mortality curve for Winnipeg shows the relationship between heat and deaths. The daily maximum temperature in degrees Celsius is on the bottom of the graph (x-axis) and number of deaths measured in terms of relative mortality (%) is along the side (y-axis). The amount of deaths related to heat increases above 100% at about 27 degrees. This is with a 95% confidence interval.
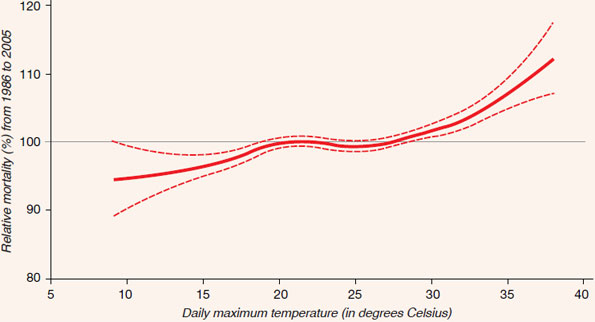
The statistical "generalized additive model" was used to establish the association between mortality and temperature. Daily maximum temperature data were measured during June, July, and August from 1986 to 2005, and were correlated with all non-traumatic deaths (i.e., excluding motor vehicle accidents, homicides, falls, drownings). Meteorological data from Environment Canada's National Climate Archive were selected, based on the proximity of meteorological stations to Statistic Canada's census subdivisions of death. Mortality data were obtained for the same years from Public Health Agency of Canada or Health Canada databases.
The mortality data were first analyzed to determine an average ("normal") for June, July, and August of each year; this is each year's "reference value." Then, a mortality rate for each day was expressed relative to that reference value as a percentage (%). This normalization was performed to account for changes (e.g., demographics, urban landscape, etc.) over the time period analyzed. Mortality curves are generally used to establish a relationship by incorporating data over a long period of observations to deal with inter-annual trends. Figure 5 shows a strong association between temperature and excess mortality in the City of Winnipeg. At approximately 26°C/78.8°F excess mortality begins to increase as ambient temperatures increase; the increase in deaths becomes much more pronounced above 35°C/95°F.
Source: Casati and Yagouti, (In Press).Footnote 23


3 Assess future health risks associated with extreme heat events
The objective of this step is to characterize increased risks to health from future extreme heat events due to a changing climate in conjunction with other expected societal changes. This can be done either qualitatively or quantitatively. First, an estimate is needed of how the current burden of heat-related health outcomes is likely to change over coming decades, irrespective of climate change. The burden of heat-related health outcomes (e.g., illnesses and deaths) may increase or decrease in the future because of changes in vulnerable populations (e.g., more seniors, fewer outdoor workers) and/or changes in adaptive capacity (e.g., improved health care services, implementation of a HARS). The description of how the current burden of heat-sensitive illnesses is likely to vary without climate change is a baseline against which the possible additional health risks of climate change should be assessed. The implications of expected increases in the number, intensity, and duration of extreme heat events for a community or region are then assessed. Climate and temperature projections for Canada are produced by federal government agencies and by the Ouranos Consortium (Table 3); the Ouranos Consortium also works closely with other partners in Canada, such as Environment Canada, Ontario Power Generation, and Manitoba Hydro.
Figure 6: Projected forest fire severity level from 2050 to 2059
Figure 6: Projected forest fire severity level from 2050 to 2059
A map of Canada is colour graded corresponding to a relative risk scale 0.01- >5. The colours show projected relative risk is greatest for the Prairie regions of Canada (4- >5), with the southern part of the region being at greatest risk (>5). Most of the province of British Columbia is at risk (3- >5). Yukon and Northwest Territories range from values of 2- >5 for various regions. Southwestern and southern Ontario have relative values of 3-5, most of the rest of Ontario is value 2. Most regions of Quebec are value 2 or with a value of 3. Atlantic Canada is similar to Quebec.
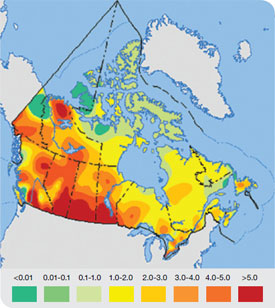
Note: The figure shows projected seasonal severity ratings across Canada from 2050 to 2059, based on a climate with doubled carbon dioxide concentrations (based on the Canadian General Circulation Models). This rating is a measure of fire danger conditions over a complete season and has a relative scale with values above 5 being extreme.
Source: Atlas of Canada, 2007.Footnote 56
There are challenges associated with estimating future vulnerability based on projections of climate conditions, air quality, and expected demographic, health status, and socio-economic changes in society. In particular, use of this data requires specialized knowledge of climate science and health models, as well as their assumptions, limitations, and the degree of uncertainty associated with their application (Figure 6). Public health officials need to build expertise and capacity in this area and collaborate closely with the climate science community to address risks to health from extreme heat events. This collaboration will help to ensure that the communication of assessment results to decision makers will clearly convey information about any uncertainties related to possible future vulnerabilities. Assessment findings that suggest trends in key vulnerability factors are increasing within a population or community may be sufficient to warrant the adoption of proposed adaptation options.
Meteorological variables (e.g., temperature, humidity), and demographic, health status, and socio-economic data can be plotted on maps using GIS to spatially show current and future health vulnerabilities associated with extreme heat events (Box 6).
Box 6: Using GIS to Assess Health Risks due to Extreme Heat Events in Quebec
Vescovi et al., (2005) plotted climate variables and vulnerability parameters (age, poverty, social isolation, education, and income) for southern Quebec on maps to show current and projected health risks associated with extreme heat events.Footnote 51 The maps show that the number of locations where vulnerable populations will be at risk from extreme heat events will dramatically increase in Quebec over the next few decades (Figure 7).
Figure 7: Map of current and future vulnerability to extreme heat events in Quebec based on the projected number of hot days and four underlying indicators (i.e., age, poverty, social isolation, education)
Figure 7: Map of current and future vulnerability to extreme heat events in Quebec based on the projected number of hot days and four underlying indicators (i.e., age, poverty, social isolation, education)
Two maps of southern Quebec are overlaid with social vulnerability index scores assigned by regions and ranging from high (5.1 to 8.5) to low (0 to 1.0). These maps show current (1971- 2000) and projected future (2039-2063) vulnerability by combining the heat risk with other demographic factors (age, poverty, social isolation and education). The first map with areas of current high vulnerability are found largely north of the St. Lawrence River above Montreal and east of the river across from Quebec City. Montreal has medium vulnerability and Quebec City has lower vulnerability. The second map showing future vulnerability illustrates that vulnerability will increase and include much of the St Laurence corridor.
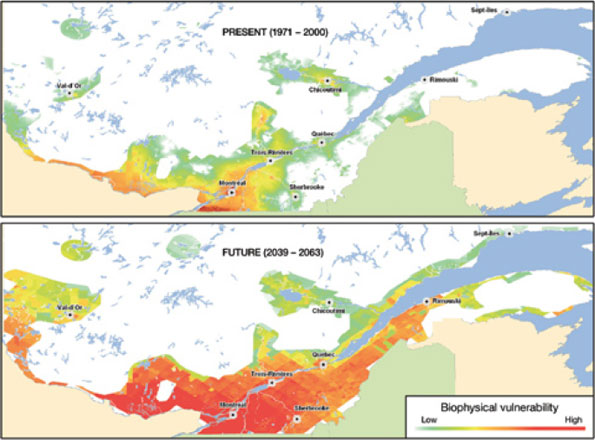
Source: Vescovi et al., 2005.Footnote 51
Public health officials in this province are already using and maintaining an on-line portal including web-based GIS technology to identify areas vulnerable to climate change and relevant indicators for preventative or emergency actions. The tool allows decision makers to conduct analysis with the best available data to better understand vulnerabilities to extreme heat in their respective jurisdictions. The available data will soon be extended to cover other extreme meteorological events. While currently accessible only through the provincial health ministry's Intranet in its full format, a partial cartographic application showing the most important urban heat islands and some other indicators.

4 Identify and prioritize adaptation options to address current and projected health risks from extreme heat events
The objective of this step is to identify possible adaptation options that can address the current and projected health risks related to extreme heat. It may be necessary to augment current programs to take into account the new conditions, pressures, or challenges that climate change is expected to pose for health - in this case, a greater number, intensity, and duration of extreme heat events. Examples include changing current practices related to the identification of alert triggers that are community specific (Box 7); organizing and holding outdoor festivals and events (e.g., marathons and outdoor concerts) earlier in the season; providing assistance during extreme heat events to people living on the street (e.g., providing water); and caring for vulnerable people in their homes (e.g., public education about heat-health risks to eldercare providers). During this step, possible co-benefits associated with the proposed adaptation measures to reduce heat-health risks need to be considered. For example, immediate health benefits, such as reduced respiratory illnesses from improved air quality, can accrue from appropriately designed adaptations (e.g., development of green spaces and bicycle paths) to reduce the urban heat island effect. Health co-benefits of taking actions can help to drive or motivate community efforts to prepare for extreme heat events.
Prioritizing potential adaptation options requires an evaluation of their effectiveness, feasibility, and costs. Measures of program effectiveness may be obtained from existing evaluation practices used by public health officials in their respective fields.Footnote e Key factors and processes that may be barriers to achieving the goals of the adaptation options should be investigated, and opportunities for overcoming these barriers should be identified. Stakeholders play a key role in this process. Assessments should document the results of stakeholder discussions concerning the proposed adaptation options.
Box 7: Developing Heat Alert Thresholds in Quebec, Taking Latitude and Place into Account
Large-scale emergency interventions during extreme heat events can save hundreds of lives, but they also can be very costly; this is because they require the mobilization of policemen and other officials to locate individuals in need of help, distribute water to the homeless, open cooling centers and the like. Decision makers require that such interventions take place at the right time to save lives, with false alarms kept to a minimum. Science tells us that extreme heat events should be defined differently within a country (latitude, elevation, and proximity to bodies of water matter) and across the globe because of variations in normal physiological acclimatization among populations.Footnote 52
Figure 8: Health regions of southern Quebec grouped into homogenous climatic classes
Figure 8: Health regions of southern Quebec grouped into homogenous climatic classes
Health regions within Quebec have been colour coded indicting that some regions have similar climate and the same thresholds for calling a heat alert, where as other regions have different climate and thresholds. There are four different types of grouping that roughly correspond to the health region's latitude, such that northern health regions have lower temperature thresholds than do southern health regions for calling a heat alert.
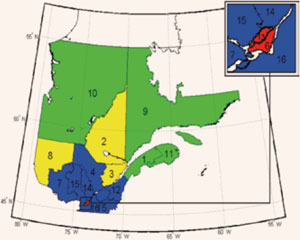
Source: Martel et al., 2010.Footnote 52
Note: The numbers refer to the health regions. The inset (red portion) is an enlargement of the Montreal Island and Laval regions.
The extreme heat thresholds used in Quebec to trigger large-scale emergency response interventions are now based on the analysis of heat-related mortality (Quebec mortality data and Environment Canada meteorological archives for 1981-2005), similar to the analyses used by several European countries. Historical mortality and temperature data (i.e., periods of high temperatures) were used to determine what threshold heat values (daily minimum and maximum temperatures taken together) are associated with a significant increase in mortality. To identify thresholds for the whole province, the health regions of Quebec were divided into classes that are homogeneous from a meteorological standpoint and that have sufficiently high daily mortality rates to permit analysis. These constraints necessitated the use of a mortality increase of 60% over the historical average as the threshold for identifying the triggers for a full heat alert.
A weighted temperature forecast over three days was identified as optimal; this measure was able to reflect regional differences, and thus assign thresholds across the province that were regionally specific. For instance, the city of Montréal area threshold (Figure 8: in the number 6 red zone) was identified as a daily maximum of 33°C/91.4°F, a daily minimum of 20°C/68°F (i.e., nighttime) and a humidex of 40, with daily weights of 40%-40%-20%. The city of Québec, which is only 250 km northeast (Figure 8: in the number 3 yellow zone), would reach the same risk at 31°C/87.8°F and 16°C/60.8°F with the same weights and a humidex of 37.Footnote 52

5 Examine the potential health risks and benefits of adaptation and mitigation measures implemented in other sectors
Existing practices and planned changes to programs in other sectors may also affect risks to health posed by extreme heat (e.g., water restrictions, power outages, lack of air conditioning in public transportation). The objective of this step is to assess the possible health impacts of measures or interventions implemented in other sectors. This would include, but is not limited to, adaptation and greenhouse gas mitigation measures that may impact heat-related health risks. Adaptation and greenhouse gas mitigation measures in other sectors may have both positive and negative health impacts; however, activities with unintended negative consequences are of particular concern. The focus should be on changes or disruptions in other sectors with the greatest potential to influence the burden of heat-related health outcomes in order to maintain a manageable scope. Some functions and sectors that may be affected, and for which consideration should be given when assessing health vulnerability to extreme heat events, include:
- infrastructure planning, renewal, and management
- building engineering and codes
- water and energy supply
- transportation systems and design
- parks and recreation planning and operation
- emergency preparedness and management
Many of these sectors are integral to the performance of health and social services, particularly in times of emergency (Box 8).
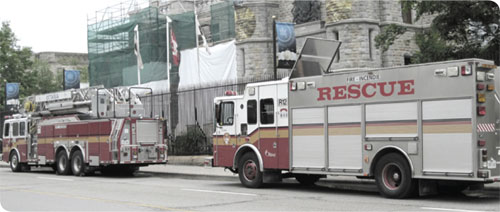
Box 8: Power Outage During an Extreme Heat Event in Toronto - July 5, 2010
On July 5, 2010 a power outage left approximately 250,000 people living in Toronto without electricity. This occurred while the city and most of Ontario were in the grip of an extreme heat event and smog advisory - with temperatures in the 35°C/95°F range and humidex values in the 40 range. A fire at a transformer station sapped some 1,000 megawatts from the city. People were forced to walk down dozens of flights of stairs because buildings were without power to run the elevators. To the extent that older adults and people with limited mobility were unable to leave high-rise buildings to escape the heat, their health could have been seriously impacted. Traffic lights went out, and two subway stations in the west end were affected. The outage was substantial enough to cause blips on the provincial power grid, with reports of lights flickering as far away as Ottawa. If the extreme heat event and the power outage had lasted longer, it could have compromised the ability of public health officials and social service providers to disseminate messages (via radio, television, and Internet) to reach vulnerable populations requiring assistance.
Source: Boesveld, 2010.Footnote 53


6 Develop protocols for evaluating adaptation options and monitoring heat-health risks
The final step of an assessment is to establish an iterative process for monitoring heat-health risks and evaluating the adaptation options that are recommended for implementation. This ensures the measures adopted by public health and emergency management officials are effective in reducing health risks from extreme heat events. Monitoring the burden of heat-sensitive health outcomes is necessary for the continued effectiveness of interventions in a changing climate.
Evaluating programs and initiatives may be challenging. For example, the analytical basis for monitoring may involve very long time frames, such as the development of a long-term record of extreme heat events and health impacts. Indicators that provide evidence of success or failure of public health efforts to protect citizens can be used to assess the effectiveness of programs and ensure that appropriate improvements to practices can be made.
4. Conclusion
Climate change is expected to increase risks to the health and well-being of Canadians from extreme heat events. With sufficient knowledge of existing vulnerabilities and the coping capacities of individuals and communities, public health and emergency management officials can develop effective interventions to safeguard health. Extreme heat and health vulnerability assessments can provide this information to decision makers, along with a range of responses needed to reduce adverse health impacts.
Assessments can mark an important starting point in efforts to protect health by developing information about vulnerability to extreme heat events in a community. If no previous investigation of vulnerability has been conducted, an assessment is an opportunity to bring together relevant data and information sources, conduct the analysis through stakeholder engagement, and develop a definitive baseline. In this regard, an assessment serves as a mechanism to mobilize interdisciplinary groups to come together and collaborate to identify actions to increase the resiliency of the community.
Broad communication of the assessment findings is critical to support the mobilization of a community or region in order to prepare for future extreme heat events. The assessment should influence policy development and the adoption of practical public health interventions to reduce heat-health vulnerabilities. Therefore, results should be shared in a timely fashion with all partners as well as relevant users of the information (e.g., public health officials, emergency management officials, urban planners, social service providers).
A well-communicated assessment that follows a participatory approach is instrumental in directing the needed attention of both stakeholders and decision makers to the health risks of extreme heat events. It provides the opportunity to identify heat-related health risks, vulnerabilities, and adaptation options as priority issues to be addressed by a community in partnership with other levels of government. Awareness can be one of the least expensive and effective methods for decreasing risks. Ultimately, an assessment of community vulnerability and the implementation of adaptation measures reduce the vulnerability of a population to extreme heat events, now and in a changing climate.
Glossary
- Adaptation:
- Process by which strategies and measures to moderate, cope with, and take advantage of the consequences of climatic events are enhanced, developed, implemented, and monitored. Footnote 11 In public health, the analogous term is prevention. Various types of adaptation exist, including anticipatory and reactive, private and public, autonomous, and planned.
- Adaptive Capacity:
- General ability of individuals, communities, and institutions to effectively prepare for and cope with the consequences of climate variability and change.
- Climate:
- "Average weather" in a particular place over a particular time period. It is the statistical description of the mean and variability of weather variables (i.e., temperature, precipitation) over a period of time ranging from months to thousands or millions of years; the typical time period is 30 years.
- Climate Change:
- Statistically significant variation in either the mean state of the climate or in is variability, persisting for an extended period (typically decades or longer). Climate change may be due to natural internal processes or external forcings, or to persistent anthropogenic changes in the composition of the atmosphere. The United Nations Framework Convention on Climate Change defines climate change as "a change of climate which is attributed directly or indirectly to human activity that alters the composition of the global atmosphere and which is in addition to natural climate variability observed over comparable time periods." Footnote 18
- Climate Model:
- Numerical representation of the climate system based on the physical, chemical, and biological properties of its components, and the interactions and feedback processes that account for all or some of the known properties. Models may vary in complexity; as research tools, they are applied to study and simulate the climate, but are also used for operational purposes including monthly, seasonal, and inter-annual climate predictions.
- Climate Scenario:
- Plausible and often simplified representation of the likely future climate, based on an internally consistent set of climatological relationships that has been constructed for explicit use in investigating the potential consequences of anthropogenic climate change, and often serving as an input to impact models.
- Climate Variability:
- Variations in the mean state and other statistics (e.g., standard deviations, the occurrence of extreme events) of climate on all temporal and spatial scales beyond that of individual weather events. Variability may be due to natural internal processes within the climate system or to variations in natural or anthropogenic external forcing.
- Co-Benefits:
- Benefits (often health benefits) associated with reductions in greenhouse gas emissions. For example, reduced emissions of air pollutants can have immediate health benefits such as reduces respiratory and cardiovascular diseases. In addition, co-benefits can be associated with adaptation measures, such as new surveillance systems that monitor climate-related and nonclimate-related infectious diseases.
- Epidemiological Study:
- Science of public health and preventative medicine that studies the distribution and determinants of health-related states or events in specific populations, and that applies study findings to control and/or mitigate health problems.
- Expert Judgement/Key Informant Interviews:
- Statements that represent a process of evaluation, which can be a set of conditions and criteria, by someone widely recognized as a reliable source of knowledge, technique, or skill, and whose judgement is accorded authority and status by the public or their peers.
- Health:
- state of complete physical, mental, and social well-being, and not merely the absence of disease or infirmity.
- Literature Review:
- Comprehensive survey of publications that aims to critically analyze, summarize, and compare prior research in a specific field of study. This may also include "grey literature" refering to a body of materials that is produced by all levels of government, academia, business, and industry in electronic and print formats, but is not traditionally published. Examples of grey literature include technical reports, policy frameworks, and guidance documents from government agencies, scientific research groups, or related committees.
- Mitigation:
- Policies and measures to reduce greenhouse gas emissions and/or enhance carbon sinks.
- Resilience:
- Ability of a natural or human system to absorb disturbances while retaining the same basic structure and ways of functioning, the capacity for self-organization, and the capacity to adapt to stress and change.
- Risk (i.e., Climate-Related Risk):
- Product of likelihood of exposure and the consequence(s) of exposure. It arises from the interaction of a physically defined hazard (i.e., floods and other extreme weather events, increasing temperature) with the properties of the exposed system (vulnerability). Footnote 11 System vulnerability is a critical determinant of the risk a region or subpopulation faces when exposed to a particular hazard. This means that programs to decrease vulnerability will decrease risk.
- Sensitivity:
- An individual's or subpopulation's increased responsiveness, primarily for biological reasons, to a particular exposure. Biological sensitivity may be related to developmental stage, pre-existing medical conditions, acquired factors (e.g., immunity), and genetic factors. Footnote 9 Socioeconomic factors also play a critical role in altering vulnerability and sensitivity by interacting with biological factors that mediate risk (e.g., nutritional status), and/or lead to differences in the ability to adapt or respond to exposures or early phases of illness and injury.
- Stakeholder Consultation:
- Canvassing the views of stakeholders in the process of developing useful information, often through forums, round tables, and advisory bodies. Stakeholders may be drawn from governments, non-governmental organizations, research institutes, and private entities focussing on the issue being investigated.
- Vulnerability:
- Susceptibility to harm, which can be defined in terms of a population or a location. Vulnerability to climate change is the degree to which a system is susceptible to, or unable to cope with, the adverse effects of climate variability and change. Vulnerability is dynamic and may itself be influenced by climate change (e.g., extreme weather events affecting health infrastructure). From a health perspective, vulnerability can be defined as the summation of all risk and protective factors that ultimately determine whether a subpopulation or region experiences adverse health outcomes due to climate change. Footnote 18 Characteristics of a region, such as baseline climate, abundance of natural resources (i.e., access to fresh water), elevation, infrastructure, and other factors can alter vulnerability.
References
Footnotes
- Footnote 1
-
Health Canada. (2008). Human Health in a Changing Climate: A Canadian Assessment of Vulnerabilities and Adaptive Capacity. Séguin, J. (ed). Health Canada, Ottawa, Ont., 483.
- Footnote 2
-
Confalonieri, U., Menne, B. and Akhtar, R. (2007). Climate Change 2007: Climate Change Impacts, Adaption and Vulnerability. Working Group II Contribution to the Intergovernmental Panel on Climate Change Fourth Assessment Report. Parry, M. L., Canziani, O. F., Palutikof, J. P. et al. (eds). Cambridge University Press, Cambridge, UK, 391.
- Footnote 3
-
Costello, A., Abbas, M., Allen, A. et al. (2009). Managing the Health Effects of Climate Change: Lancet and University College London Institute for Global Health Commission. The Lancet, 373, 1693-1733.
- Footnote 4
-
Robine, J. M., Cheung, S. L., Le Roy, S. et al. (2008). Death Toll Exceeded 70,000 in Europe during the Summer of 2003. C. R. Biol., 331, 171-178.
- Footnote 5
-
Barriopedro, D., Fischer, E. M., Luterbacher, J. et al (2011). The Hot Summer of 2010: Redrawing the Temperature Record Map of Europe. Science, 332, 220-224.
- Footnote 6
-
Cheng, C. S., Campbell, M., Li, Q. et al. (2005). Differential and Combined Impacts of Winter and Summer Weather and Air Pollution due to Global Warming on Human Mortality in South-Central Canada. Health Policy Research Program: Project number 6795-15-2001/4400011. Retrieved September 30, 2009.
- Footnote 7
-
Environment Canada - Ontario Region. (2010). Historical Heat-Related Events. Environment Canada. Retrieved April 23, 2010, from http://ontario.hazards.ca/historical/Heat_Ontario-e.html.
- Footnote 8
-
Kosatsky, T. (2010). Hot Day Deaths, Summer 2009: What Happened and How to Prevent a Recurrence. BCMJ, 52, 261.
- Footnote 9
-
Balbus, J. M. and Malina, C. (2009). Identifying Vulnerable Subpopulations for Climate Change Health Effects in the United States. J. Occup. Environ. Med., 51, 33-37.
- Footnote 10
-
Van de Lande, R.A. (2009). Developing the City of Hamilton's Community Heat Response Initiative. City of Hamilton for Health Canada, Hamilton, Ont., 16.
- Footnote 11
-
Lim, B. S. E., Burton, I., Malone, E. L. et al. (2005). Adaptation Policy Frameworks for Climate Change: Developing Strategies, Policies and Measures. United Nations Development Programme (ed). Cambridge University Press, Cambridge, UK.
- Footnote 12
-
Downing, T. E. and Patwardhan, A. (2005). Assessing Vulnerability for Climate Adaptation. In Adaptation Policy Frameworks for Climate Change: Developing Strategies, Policies and Measure. Lim, B. and Spanger-Siegfried, E. (eds). Cambridge University Press, Cambridge, UK, 69-89.
- Footnote 13
-
Carter, T.R., Parry, M.L., Harasawa, H. et al. (1994). IPCC Technical Guidelines for Assessing Climate Change Impacts and Adaptations. Department of Geography, University College London, London, UK.
- Footnote 14
-
Feenstra, J., Burton, I., Smith, J. et al. (1998). Handbook on Methods for Climate Change Impact Assessment and Adaptation Strategies. Nairobi United Nations Environment Programme.
- Footnote 15
-
Kovats, S., Ebi, K. and Menne, B. (2003). Methods of Assessing Human Health Vulnerability and Public Health Adaptation to Climate Change. World Health Organization; Health Canada; World Meteorological Association; United Nations Environment Programme. Retrieved September 26, 2008.
- Footnote 16
-
World Health Organization (WHO) and Pan American Health Organization (PAHO). (In Press). Protecting Health from Climate Change: Vulnerability and Adaptation Assessment. Ebi, K. L. (ed). World Health Organization.
- Footnote 17
-
Lemmen, D. S. and Warren, F. (2004). Climate Change and Health Impacts: A Canadian Perspective. Warren, F. (ed). Natural Resources Canada, Ottawa, Ont.
- Footnote 18
-
Intergovernmental Panel on Climate Change (IPCC). (2007). Climate Change 2007: Synthesis Report. Allali, A., Bojariu, R., Diaz, S. et al. (eds). IPCC, Valencia, Spain, 73.
- Footnote 19
-
Health Canada (2008). Chapter 4: Air Quality, Climate Change and Health. In Human Health in a Changing Climate. Séquin, J. (ed). Health Canada, Ottawa, Ont., 115-170.
- Footnote 20
-
Lin, C., Jacob, D. J. and Fiore, A. M. (2001). Trends in Exceedances of the Ozone Air Quality Standard in the Continental United States, 1980-1998. Am. Env., 35, 3217-3228.
- Footnote 21
-
McMicheal, A. J., Campbell-Lendrum, D. H., Corvalan, C. F. et al. (2003). Climate Change and Human Health: Risks and Responses. World Health Organization, Geneva, Switzerland.
- Footnote 22
-
Environmental Protection Agency (EPA). (2009).
Reducing Urban Heat Islands: Compendium of Strategies. Wong, E., Hogan, K., Rosenburg, J., Denny, A. (ed). U.S. EPA, 22. Retrieved June 23, 2010. - Footnote 23
-
Casati, B. and Yagouti, A. (In Press). Analysis of Extreme Temperature in 9 Canadian Communities Using the Canadian Regional Climate Model Projections for Public Health Planning. Int. J. Biometeorol.
- Footnote 24
-
Kalkstein, L. S. and Greene, J. S. (1997). An Evaluation of Climate/Mortality Relationships in Large U.S. Cities and the Possible Impacts of a Climate Change. Environ. Health Perspect., 105, 84-93.
- Footnote 25
-
Marmor, M. (1975). Heat Wave Mortality in New York City, 1949 to 1970. Arch. Environ. Health, 30, 130-136.
- Footnote 26
-
Mitchell, D., Senay, L. C., Wyndham, C. H. et al. (1976). Acclimatization in a Hot, Humid Environment: Energy Exchange, Body Temperature, and Sweating. J. Appl. Physiol., 40, 768-778.
- Footnote 27
-
Robinson, S. (1967). Training, Acclimatization and Heat Tolerance. Can. Med. Assoc. J., 96, 795-800.
- Footnote 28
-
Ellis, F. P. (1976). Heat Illness. III. Acclimatization. Trans. R. Soc. Trop. Med. Hyg., 70, 419-425.
- Footnote 29
-
Kenny, G. P., Yardley, J., Brown, C. et al. (2009). Heat Stress in Older Individuals and Patients with Common Chronic Diseases. Can. Med. Assoc. J., 8.
- Footnote 30
-
Morley, J. (2000). Water, Water Everywhere and Not a Drop to Drink. J. Gerontol., 55, M359-60.
- Footnote 31
-
Foster, K. G., Ellis, F. P., Dore, C. et al. (1976). Sweat Responses in the Aged. Age and Ageing, 5, 91-101.
- Footnote 32
-
Bridger, C. A., Ellis, F. P. and Taylor, H. L. (1976). Mortality in St. Louis, Missouri, during Heat Waves in 1936, 1953, 1954, 1955, and 1966. Environ. Res., 12, 38-48.
- Footnote 33
-
Anderson, S. J., Griesemer, B. A., Johnson, M. D. et al. (2000). Climatic Heat Stress and the Exercising Child and Adolescent. Pediatrics, 106, 158-159.
- Footnote 34
-
Grubenhoff, J. A., du Ford, K. and Roosevelt, G. E. (2007). Heat-Related Illness. Clin. Pediatr. Emer. Med., 8, 59-64.
- Footnote 35
-
Foster, K. G., Hey, E. N. and Katz, G. (1969). The Response of the Sweat Glands of the Newborn Baby to Thermal Stimuli and to Intradermal Acetylcholine. J. Physiol., 203, 13-29.
- Footnote 36
-
Bouchama, A., Dehbi, M., Mohamed, G. et al. (2007). Prognostic Factors in Heat Wave Related Deaths: A Meta-Analysis. Arch. Intern. Med., 167, 2170-2176.
- Footnote 37
-
Larrieu, S., Carcaillon, L., Lefranc, A. et al. (2008). Factors Associated with Morbidity during the 2003 Heat Wave in Two Population-Based Cohorts of Elderly Subjects: PAQUID and Three Cities. Eur. J. Epidemiol., 23, 295-302.
- Footnote 38
-
Fujimura, A., Sasaki, M., Harada, K. et al. (1996). Influences of Bathing and Hot Weather on the Pharmacokinetics of a New Transdermal Clonidine, M-5041T. J. Clin. Pharmacol., 36, 892-896.
- Footnote 39
-
Cheshire, W. P. and Fealey, R. D. (2008). Drug-Induced Hyperhidrosis and Hypohidrosis: Incidence, Prevention and Management. Drug Safety, 31, 109-126.
- Footnote 40
-
Cuddy, M. L. (2004). The Effects of Drugs on Thermoregulation. AACN Clin. Issues, 15, 238-253.
- Footnote 41
-
Naughton, M. P., Henderson, A., Mirabelli, M. C. et al. (2002). Heat-Related Mortality during a 1999 Heat Wave in Chicago. Am. J. Prev. Med., 22, 221-227.
- Footnote 42
-
Yip, F. Y., Flanders, W. D., Wolkin, A. et al. (2008). The Impact of Excess Heat Events in Maricopa County, Arizona: 2000-2005. Int. J. Biometeorol., 52, 765-772.
- Footnote 43
-
Smargiassi, A., Fournier, M., Griot, C. et al. (2008). Prediction of the Indoor Temperatures of an Urban Area with an in-Time Regression Mapping Approach. J. Expo. Sci. Environ. Epidemiol., 18, 282-288.
- Footnote 44
-
Canadian Centre for Occupational Health and Safety (CCOHS). (2005). Working in Hot Environments: A Health and Safety Guide. CCOHS, Hamilton, Ont., 97.
- Footnote 45
-
Greenberg, J. H., Bromberg, J., Reed, C. M. et al. (1983). The Epidemiology of Heat-Related Deaths, Texas-1950, 1970-79, and 1980. Am. J. Public Health, 73, 805-807.
- Footnote 46
-
Health Canada. (2011). Communicating the Health Risks of Extreme Heat Events: Toolkit for Public Health and Emergency Management Officials. Government of Canada, Ottawa, Ont., 55.
- Footnote 47
-
Bernard, S. M. and McGeehin, M. A. (2004). Municipal Heat Wave Response Plans. Am. J. Public Health, 94, 1520-1522.
- Footnote 48
-
City of Greater Sudbury and Sudbury & District Health Unit. (2010).
City of Greater Sudbury Hot Weather Response Plan. Retrieved March 4, 2010. - Footnote 49
-
English, P., Fitzsimmons, K., Hoshiko, S. et al. (2007). Public Health Impacts of Climate Change in California: Community Vulnerability Assessments and Adaptation Strategies. Report no. 1 Heat-Related Illness and Mortality. California Department of Public Health and Public Health Institute. California. Retrieved January 11, 2011.
- Footnote 50
-
Green, R., Basu, R., Malig, B. et al. (2010) The Effect of Temperature on Hospital Admissions in Nine California Counties. Int. J. Public Health, 55, 113-121.
- Footnote 51
-
Vescovi, L., Rebetez, M. and Rong, F. (2005). Assessing Public Health Risk Due to Extremely High Temperature Events; Climate and Social Parameters. Clim. Res., 30, 71-78.
- Footnote 52
-
Martel, B., Giroux, J., Gosselin, P. et al. (2010). Indicateurs Et Seuils Météorologiques Pour Les Systèmes De Veille-Avertissement Lors De Vagues De Chaleur Au Québec. INSPQ Et INRS-ETE. Institut national de santé public du Québec. Quebec. Retrieved January 27, 2011.
- Footnote 53
-
Boesveld, S. (2010). Toronto Left Powerless by a System Designed not to Fail (July 5, 2010). Toronto Globe and Mail. Retrieved November 15, 2010.
- Footnote 54
-
Health Canada. (2011). Extreme Heat Events Guidelines: Technical Guide for Health Care Workers. Health Canada, Ottawa, Ont., 159.
- Footnote 55
-
Health Canada. (In Press). Heat Alert and Response Systems to Protect Health: Best Practices Guidebook. Government of Canada, Ottawa, Ont., 50.
- Footnote 56
-
Atlas of Canada (2007). Projected Forest Fire Severity Level, 2050 to 2059. Retrieved March 30, 2011.
- Footnote 57
-
Note that this document uses "extreme heat event" rather than "heat wave."
- Footnote 58
-
In 2005, the City of Toronto called eight heat alerts (required when the likelihood of excess weather-related mortality exceeds 65%) and 18 extreme heat alerts (required when the likelihood of excess weather-related mortality exceeds 90%).
- Footnote 59
-
Temperature projections are obtained from the Canadian Regional Climate Model developed by the Ouranos Consortium on Regional Climatology and Adaptation to Climate Change, and using the Special Report Emission Scenario A2.18 The A2 scenario describes "a very heterogeneous world with high population growth, slow economic development and slow technological change."18 The number of hot days and warm nights for each city is based on the observed temperature data between 1961 and 2000, and projected for 2011-2040, 2041-2070, and 2071-2100.
- Footnote 60
-
See Health Canada (2011), "Extreme Heat Events Guidelines: Technical Guide for Health Care Workers."54
- Footnote 61
-
See Health Canada (In Press), "Heat Alert and Response Systems to Protect Health: Best Practices Guidebook" for information on assessing the effectiveness and impact of a HARS.55