
2019 Canada’s Food Guide Food Classification System: Development and validation

Table of contents
- Background
- Objective
- 2019 CFG-FCS development and validation
- Resulting food categories, tiers and diet simulations
- Summary
- Considerations for application
- References
Background
A food classification system is needed to assess if the foods that Canadians report consuming align with Canada’s food guide.
- The first iteration of this food classification system was developed following the release of the 1992 Food Guide. It was later updated and further developed as a surveillance tool to assess the food intakes of Canadians in relation to the 2007 Canada’s Food Guide (2007 CFG) (“CNF/CFG Classification”) (Munene, 2015).
- Over the years, researchers have used the “CNF/CFG Classification” to assess the diet quality of Canadians (Hack, 2020). Some researchers have referred to this tool as the Health Canada Tier Classification System. The “CNF/CFG Classification” facilitates data analyses when assessing dietary survey data against CFG recommendations and improves comparability of results between studies.
- In order to further support researchers and nutrition professionals in performing consistent assessment of food intake alignment with the 2019 Canada’s Food Guide (2019 CFG), HC built on the previous classification to design the new 2019 Canada’s Food Guide Food Classification System (2019 CFG-FCS). This surveillance tool classifies Canadian Nutrient File (CNF) foods into groupings and tiers based on their alignment with the 2019 CFG.
Objective
The objective of this report is to present the methods used by Health Canada to develop and validate the 2019 Canada’s Food Guide Food Classification System.
2019 CFG-FCS development and validation
Health Canada struck an internal working group composed of experts in nutrition and public health to develop a food classification system that is an accurate and valid representation of the 2019 CFG. Comments from experts were collected at project milestones and agreements were reached during meetings.
Working group members agreed that an accurate and valid 2019 CFG-FCS would achieve the two following goals:
- Display content validity by classifying foods in accordance with CFG guidance (Health Canada, 2019);
- Identify foods that can be combined in diets that follow CFG guidance and meet the targets found in Canada’s Dietary Guidelines for sodium, free sugars and saturated fat (Health Canada, 2019).
To assess the first goal, HC embedded content validity testing in the 2019 CFG-FCS development process. As such, nutrition experts were asked to determine whether the resulting classification adequately classified most foods in accordance with guidance provided in the 2019 CFG.
To assess the second goal, HC performed simulations to test whether diets could be created using foods that, for the most partFootnote 1, are encouraged in the 2019 Canada’s Food Guide and meet sodium, free sugars and saturated fat targets.
2019 CFG-FCS development
In developing and testing for the validity of 2019 CFG classification, HC used data from the Canadian Nutrient File (CNF). The CNF is the standard reference food composition database reporting the amount of nutrients in foods commonly consumed in Canada. In the CNF, average amounts of nutrients in foods available in Canada are supplied. Version 2015 of the CNF was used to develop the 2019 CFG-FCS.
Step 1: Develop food categories
Health Canada assigned foods to categories depending on typical usage and their origin (i.e. putting together foods originating from the same agricultural base). For instance, peanuts are typically consumed as a nut rather than a legume and therefore are classified under the “nuts and seeds” category. Another example is potatoes, which HC classifies as “starchy vegetables” based on their agricultural base.
In addition, to facilitate surveillance and analysis, some food categories were further split into High, Mid and Low-level sub-categories to allow more detailed reporting as needed.
Step 2: Identify criteria
With the food categories in place, the intention was to classify foods in tiers where “nutritious foods” would be assigned Tier 1, “foods that undermine healthy eating” would be assigned Tier 3 and remaining foods would be found in Tier 2.
To assign tiers, Health Canada chose two criteria that are in line with Canada’s Dietary Guidelines and describe nutritious foods.
| Nutrient Related Statements in Canada’s Dietary Guidelines | Criteria to Classify Foods |
|---|---|
| “Nutritious foods to encourage should have little to no added sodium and saturated fat, and little to no free sugars.” | Presence or absence of added sodium, added fatFootnote * and free sugars. |
| “Nutritious foods to encourage should not contribute to excess consumption of sodium, free sugars, or saturated fat.” | Whether levels of sodium, saturated fat and sugar exceed agreed upon thresholds for these nutrients. |
|
|
Step 3: Select thresholds
To help apply the first criteria (Table 1) when classifying foods, HC dietitians identified all foods containing free sugars, added sodium or added fat in the 2015 version of the CNF. Since the CNF database does not include ingredient lists, expert judgment and similar brand name foods were used to determine whether foods contained free sugars, and if sodium or fat was added.
In order to apply the second criteria, nutrient thresholds were adapted from existing Canadian food regulations (Government of Canada, 2012) and applied to the total amounts of sodium, sugar and saturated fat in accordance with the 2019 CFG guidance and convincing findings showing links between these nutrients and health outcome in the scientific literature (Health Canada, 2019).
HC working group members agreed the thresholds could vary by food categories and sub-categories in order to take into consideration food characteristics. For instance, the “low-in” saturated fat threshold is applied differently for “Vegetables & Fruit” and for “Meats”.
Using the selected criteria and thresholds for each food category, foods were assigned a tier using an algorithm executed using the SAS statistical software.
Step 4: Evaluate content validity
Once CNF foods were assigned a tier using the proposed criteria and thresholds, HC working group reviewed whether the proposed methodology classified CNF foods in accordance with the 2019 CFG. In the context of this analysis, classifying CNF foods in accordance with the 2019 CFG was deemed successful when, for the most part, food classification aligned with Canada’s Dietary Guidelines 1 and 2 (Health Canada, 2019) (BOX 1).
BOX 1. Canada’s Dietary Guidelines 1 & 2 for Health Professionals and Policy Makers
Canada’s Dietary Guideline 1: Foundation for healthy eating
Nutritious foods are the foundation for healthy eating.
- Vegetables, fruit, whole grains, and protein foods should be consumed regularly. Among protein foods, consume plant-based more often.
- Protein foods include legumes, nuts, seeds, tofu, fortified soy beverages, fish, shellfish, eggs, poultry, lean red meat including wild game, lower-fat milk, lower-fat yogurts, lower fat kefir, and cheeses lower in fat and sodium.
- Foods that contain mostly unsaturated fat should replace foods that contain mostly saturated fat.
- Water should be the beverage of choice.
Canada’s Dietary Guideline 2: Foods and beverages that undermine healthy eating
Processed or prepared foods and beverages that contribute to excess sodium, free sugars, or saturated fat undermine healthy eating and should not be consumed regularly.
Practically, HC’s nutrition experts were asked to assess whether foods in each tier reflected the following descriptions:
Tier 1: Foods that contain little to no added sodium and saturated fat and little to no free sugars. These foods are encouraged in Canada’s Food Guide (Canada’s Dietary Guideline 1);
Tier 2: Foods that did not meet requirements for Tier 1 or Tier 3;
Tier 3: Foods that contribute to excess consumption of sodium, saturated fat or free sugars. These foods should not be consumed regularly. (Canada’s Dietary Guideline 2).
To this end, an iterative approach was used. The way criteria and thresholds were applied to food categories were modified and foods reclassified until HC’s nutrition experts found the resulting classification was, for the most part, reflective of Canada’s Dietary Guidelines (Figure 1).
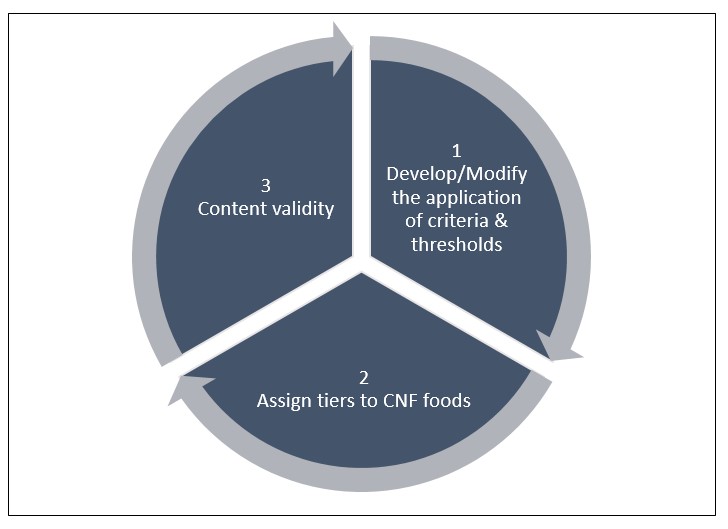
Figure 1 - Text description
Pie shape in which each wedge represents an iterative step in the development of the 2019 CFG-FCS,
- Step 1. Develop/Modify the application of criteria & thresholds
- Step 2. Assign tiers to CNF foods
- Step 3. Content validity
Health Canada generated examples of diets that followed the 2019 CFG guidance. Of particular importance, they met the 2019 CFG targets for sodium, saturated fat and free sugars for all standard Dietary Reference Intakes (DRI). HC built these diets using the nutrient profile of composite foods (i.e. mean nutrient profiles of similar foods) and a trial and error approach. In this way, amounts of foods in each food category were adjusted until targets were met for each DRI Life Stage groupFootnote 2. Reference Amounts (RA), which represent the amount of food typically consumed in one sitting, were used as the unit of measure. More information on the methodology related to the creation of these composite diets can be accessed on the Government of Canada on Open Government or by emailing the Office of Nutrition Policy and Promotion at the following address: nutrition@hc-sc.gc.ca.
A composite diet for each DRI Life Stage group formed the basis for the 2019 CFG-FCS diet simulation validation exercise. More specifically, HC used the number of RAs allotted to each food category found in the composite diet to simulate 500 diets for each DRI Life Stage group using foods from the 2015 CNF. Although one diet was used, Health Canada acknowledges that there is more than one way to follow the 2019 Canada’s Food Guide.
Diets for pregnancy and lactation life stages were also created and these included the following HC dietary supplement recommendations:
- Two separate composite diets were created for pregnant women, one with 16 mg of iron and one with 20 mg, to reflect the Health Canada recommendation to take a daily multivitamin/mineral supplement that provides 16 to 20 mg of iron.
- 400 mcg of folic acid was added to pregnancy and lactating composite diets to reflect Health Canada's recommendation to take a daily multivitamin/mineral supplement that provides 400 mcg folic acid.
To simulate diets, HC first created clustersFootnote 3 of CNF foods consisting of individual foods when the CNF only included the food in one form (ex. the “Radish, raw” cluster) and of several foods when the CNF included several forms of the same food (ex. the “Tier 1 Broccoli cluster” could include “Broccoli frozen”, “Broccoli raw”, “Broccoli boiled”). Only foods assigned the same tier were clustered together. Clustering food was done to avoid the oversampling of foods with multiple entries in the CNF. In this example, avoiding broccoli being randomly selected three times more often than radishes.
The following procedure was then performed:
- Food was randomly selected in two steps.
- First, a cluster was selected at random for each Low-level sub-categoryFootnote 4.
- Second, a specific food item was selected within the cluster.
Both random selections were performed with replacement.
This process was then repeated until enough RAs of food were selected as per the example composite diet.
- Once the correct number of RAs of foods had been selected for all food categories, the diet was deemed complete and the process was repeated for the next diet simulation.
HC performed a series of tests to identify the number of simulation required for nutrient amount distributions to become stable. The tests ascertained how nutrient distributions changed as the number of diet simulations increased. HC determined that mean amounts of nutrients varied little after 500 simulations. For this reason, 500 was chosen as the number of simulations to be performed for each DRI Life Stage group.
HC then evaluated the nutrient distributions of the diet simulations using the targets found in Canada’s Dietary Guidelines (Health Canada, 2019).
Specifically, all simulated diets should meet the following requirements:
- Less than Chronic Disease Risk Reduction (CDRR) levels for sodium (The National Academies of Sciences, Engineering, and Medicine, 2019);
- Less than 10% of total energy intake from free sugars (World Health Organization, 2015);
- Less than 10% of total energy intake from saturated fat (Food and Agriculture Organization of the United Nations, 2010).
Resulting food categories, tiers and diet simulations
Food categories
A multi-level method to categorize foods was used in the 2019 CFG classification system in order to help assess total food choices with more precision and provide additional information on the types of foods eaten.
The 2019 CFG food categories are thus number coded and subdivided in three levels: Low, Mid and High. For instance, Dark green vegetables (Low level, code 1210), Vegetables (Mid level, code 12) and Fruit and Vegetables (High level, code 1). Similarly, grain products with whole wheat as the first ingredient are found in the “Whole wheat products” Low-level (code 2220) which belongs to the “Whole grain and whole wheat products” Mid-level (code 22) which is part of the “Whole Grain and whole wheat foods” High-level (code 2).
Please see the Publications – Food and nutrition - Canada.ca website for a complete description of 2019 CFG-FCS food categories.
2019 CFG-FCS tiers
The 2019 CFG-FCS assigns tiers to foods differently depending on the category to which the food belongs. Table 2 describes in detail how the 2019 CFG-FCS assigns CNF foods a tier.
The following examples demonstrate how Table 2 can be used to assign a tier to CNF foods.
Example 1: Low fat plain yogurt (Food category 4200: Yogurts and kefir). Since this product does not contain free sugars nor sugar substitute, added fat or added sodium AND it contains an amount of saturated fat lower than the “low in” threshold, it is assigned Tier 1.
Example 2: Orange juice, raw (Food category 5160: Fruit juice). While this product meets the “low in” saturated fat and “low in” sodium criteria and contains no sugar substitutes, it is not assigned to Tier 1 since it contains free sugars. This product is assigned Tier 3 since it contains free sugars and does not meet the “low in” sugar criterion.
| Food Categories | Criteria | Tier 1 | Tier 2 | Tier 3 |
|---|---|---|---|---|
|
Do not contain free sugar Or sugar substitutes Or added fat Or added sodium |
All foods in this category | N/A | N/A |
Do contain free sugar Or sugar substitutes Or added fat Or added sodium |
if added fat, meet “low in” saturated fats criterion AND if added sodium , meet “low in” sodium criterion AND if contains free sugars, meet “low in” sugar criterion AND contains no sugars substitute |
All foods in this category that do not meet Tier 1 or Tier 3 criteria |
if added fat, meet “high in” saturated fats criterion OR if added sodium, meet “high in” sodium criterion OR if contains free sugars, meet “high in” sugar criterion |
|
Refined Grains (6510, 6520) |
Do not contain free sugar Or sugar substitutes Or added fat Or added sodium |
N/A | All Refined Grains in this category | All Refined Grains in this category not assigned Tier 2 |
Do contain free sugar Or sugar substitutes Or added fat Or added sodium |
N/A | if added fat, meet “low in” saturated fats criterion AND if added sodium , meet “low in” sodium criterion AND if contains free sugars, meet “low in” sugar criterion |
All Refined Grains in this category not assigned Tier 2 | |
|
Do not contain free sugar Or sugar substitutes Or added fat Or added sodium |
meet “low in” saturated fats criterion | All Dairy & Meats in this category not assigned Tier 1 or Tier 3 |
meet ≥ 25% DV saturated fats criterion |
Do contain free sugar Or sugar substitutes Or added fat Or added sodium |
meet “low in” saturated fats criterion AND if added sodium , meet “low in” sodium criterion AND if contains free sugars, meet “low in” sugar criterion AND contains no sugars substitute |
All Dairy & Meats in this category not assigned Tier 1 or Tier 3 |
meet ≥ 25% DV saturated fats criterion OR if added sodium, meet “high in” sodium criterion OR if contains free sugars, meet “high in” sugar criterion |
|
Fats & Oils (7110, 7120) (Criteria calculated per RA not adjusted. Please see "Low in" Adjusted RA for details) |
Do not contain free sugar Or sugar substitutes Or added fat Or added sodium |
< 30% of total fat from saturated & trans fats AND meet “low in” saturated fats criterion |
< 30% of total fat from saturated & trans fats AND does not meet “low in” saturated fats criterion |
≥ 30% of total fat from saturated & trans fats AND does not meet “low in” saturated fats criterion |
Do contain free sugar Or sugar substitutes Or added fat Or added sodium |
< 30% of total fat from saturated & trans fats AND meet “low in” saturated fats criterion AND if added sodium, meet “low in” sodium criterion AND if contains free sugars, meet “low in” sugar criterion AND contains no sugars substitute |
All Fats & Oils in this category not assigned Tier 1 or Tier 3 |
(≥ 30% of total fat from saturated & trans fats AND does not meet “low in” saturated fats criterion) OR if added sodium, meet “high in” sodium criterion OR if contains free sugars, meet “high in” sugar criterion |
|
|
Do not contain free sugar Or sugar substitutes Or added fat Or added sodium |
meet "low in" saturated fats criterion AND meet "low in" sodium criterion AND contains no free sugars AND contains no sugar substitutes |
All foods in this category not assigned Tier 1 or Tier 3 |
meet ≥ 25% DV saturated fats criterion OR meet "high in" sodium criterion OR if contains free sugars, does not meet “low in” sugar criterion |
Do contain free sugar Or sugar substitutes Or added fat Or added sodium |
||||
|
Do not contain free sugar Or sugar substitutes Or added fat Or added sodium |
N/A | meet "low in" saturated fats criterion AND meet "low in" sodium criterion AND meet “low in” sugar criterion |
All foods in this category not assigned Tier 2 |
Do contain free sugar Or sugar substitutes Or added fat Or added sodium |
N/A | |||
Processed Meats (6600) |
Do not contain free sugar Or sugar substitutes Or added fat Or added sodium |
N/A | N/A | All Processed Meats |
Do contain free sugar Or sugar substitutes Or added fat Or added sodium |
N/A | N/A | ||
| A blank cell indicates no food in the category is assigned the Tier. | ||||
"Low in" & "High in" The “low in” threshold criteria are:
The “high in” threshold criteria depend on the size of the food Reference Amounts (RA). If RA is ≤ 30g:
If RA is > 30g:
|
||||
"Low in" Adjusted RA Small reference amount (RA) is defined as RA ≤ 30g Adjusted RA means in cases where foods RA is ≤ 30g calculations are performed using RA=50g The small RA adjustment is applied in calculating "low in" sugar and sodium for all foods with the exception of Fats & Oils. The small RA adjustment is not applied to saturated fat. |
||||
Tier Not Assigned Baby food (8100) Meal replacements and supplements (8200) Alcoholic beverages (8300) CNF Recipes (8400) Misc. foods & ingredients (8500) Foods missing key information (9990) |
||||
Diet simulations
Diets simulated by HC met the requirements for amounts of sodium, percentages of energy from free sugars and percentages of energy from saturated fat for all DRI Life Stage groups with few minor exceptions (Table 3, 4 & 5).
In the case of males and females 2 to 3 years old, 0.8% of simulated diets exhibited levels of sodium above the CDRR. Similarly, 0.2% of simulated diets showed levels of sodium above the CDRR for both males and females 9 to 13 years olds (Table 3).
Note that results for unmet requirements must be interpreted with caution since they display large variability compared to the estimate.
| Age-Sex Group | Sodium (mg) | |||||||
|---|---|---|---|---|---|---|---|---|
| Percentiles | Requirement | |||||||
| P5 | P25 | P50 | P75 | P95 | CDRR Value | % Requirement Not Met | SE | |
| M & F 2-3 | 547.0 | 651.7 | 731.6 | 820.9 | 954.6 | 1200 | 0.8 <3 | 0.4 |
| M 4-8 | 517.6 | 629.1 | 731.2 | 865.1 | 1066.1 | 1500 | 0.0 | 0.0 |
| F 4-8 | 525.2 | 641.1 | 730.1 | 859.8 | 1047.3 | 1500 | 0.0 | 0.0 |
| M 9-13 | 794.8 | 959.3 | 1086.0 | 1238.6 | 1464.4 | 1800 | 0.2 <3 | 0.2 |
| F 9-13 | 649.6 | 787.8 | 924.0 | 1066.5 | 1286.9 | 1800 | 0.2 <3 | 0.2 |
| M 14-18 | 842.8 | 1017.9 | 1159.5 | 1301.8 | 1529.0 | 2300 | 0.0 | 0.0 |
| F 14-18 | 671.2 | 793.7 | 912.5 | 1047.2 | 1285.2 | 2300 | 0.0 | 0.0 |
| M 19-30 | 890.6 | 1067.8 | 1234.0 | 1416.0 | 1731.6 | 2300 | 0.0 | 0.0 |
| F 19-30 | 829.6 | 999.5 | 1137.5 | 1274.0 | 1546.8 | 2300 | 0.0 | 0.0 |
| M 31-50 | 797.6 | 977.4 | 1133.3 | 1284.2 | 1507.8 | 2300 | 0.0 | 0.0 |
| F 31-50 | 776.6 | 933.2 | 1055.9 | 1191.1 | 1416.1 | 2300 | 0.0 | 0.0 |
| M 51-70 | 842.7 | 1008.9 | 1155.1 | 1293.8 | 1551.1 | 2300 | 0.0 | 0.0 |
| F 51-70 | 652.7 | 780.9 | 912.7 | 1053.1 | 1277.5 | 2300 | 0.0 | 0.0 |
| M 71 + | 742.4 | 930.5 | 1077.7 | 1238.5 | 1479.4 | 2300 | 0.0 | 0.0 |
| F 71 + | 643.6 | 774.1 | 895.3 | 1017.3 | 1223.1 | 2300 | 0.0 | 0.0 |
| Pregnant < 19 (+400mcg folic acid & + 16mg iron) | 667.2 | 798.9 | 927.0 | 1049.6 | 1242.3 | 2300 | 0.0 | 0.0 |
Lactating <19 (+400mcg folic acid) |
688.3 | 825.8 | 945.9 | 1103.8 | 1318.9 | 2300 | 0.0 | 0.0 |
Pregnant 19-30 (+ 400mcg folic acid & + 16mg iron) |
826.6 | 993.6 | 1151.3 | 1302.8 | 1574.1 | 2300 | 0.0 | 0.0 |
| Lactating 19-30 (+400mcg folic acid) | 854.8 | 1033.4 | 1159.4 | 1316.9 | 1585.4 | 2300 | 0.0 | 0.0 |
Pregnant 31-50 (+ 400mcg folic acid & + 16mg iron) |
767.0 | 930.1 | 1053.7 | 1202.7 | 1461.1 | 2300 | 0.0 | 0.0 |
| Lactating 31-50 (+400mcg folic acid) | 785.9 | 950.8 | 1067.4 | 1227.1 | 1456.3 | 2300 | 0.0 | 0.0 |
| Pregnant <19 (+400mcg folic acid & + 20 mg iron) | 661.7 | 798.1 | 928.4 | 1069.6 | 1280.1 | 2300 | 0.0 | 0.0 |
Pregnant 19-30 (+ 400mcg folic acid & + 20 mg iron) |
813.9 | 1000.8 | 1137.9 | 1302.7 | 1572.3 | 2300 | 0.0 | 0.0 |
Pregnant 31-50 (+ 400mcg folic acid & + 20mg iron) |
770.6 | 922.4 | 1040.9 | 1184.1 | 1444.9 | 2300 | 0.0 | 0.0 |
|
Abbreviations & Symbols
|
||||||||
| Age-Sex Group | Percent of Energy from Free Sugars (%) | |||||||
|---|---|---|---|---|---|---|---|---|
| Percentiles | Requirement | |||||||
| P5 | P25 | P50 | P75 | P95 | Max % E Recommended by WHO |
% Requirement Not Met | SE | |
| M & F 2-3 | 0.4 | 0.8 | 1.3 | 1.9 | 2.8 | 10.0 | 0.0 | 0.0 |
| M 4-8 | 0.2 | 0.6 | 1.0 | 1.6 | 2.9 | 10.0 | 0.0 | 0.0 |
| F 4-8 | 0.2 | 0.5 | 0.9 | 1.6 | 2.6 | 10.0 | 0.0 | 0.0 |
| M 9-13 | 0.3 | 0.7 | 1.2 | 2.0 | 2.9 | 10.0 | 0.0 | 0.0 |
| F 9-13 | 0.2 | 0.4 | 1.0 | 1.6 | 2.5 | 10.0 | 0.0 | 0.0 |
| M 14-18 | 0.1 | 0.4 | 0.7 | 1.5 | 2.2 | 10.0 | 0.0 | 0.0 |
| F 14-18 | 0.2 | 0.4 | 0.8 | 1.6 | 2.5 | 10.0 | 0.0 | 0.0 |
| M 19-30 | 0.2 | 0.4 | 0.9 | 1.5 | 2.5 | 10.0 | 0.0 | 0.0 |
| F 19-30 | 0.2 | 0.6 | 1.2 | 1.9 | 2.9 | 10.0 | 0.0 | 0.0 |
| M 31-50 | 0.2 | 0.4 | 0.9 | 1.5 | 2.3 | 10.0 | 0.0 | 0.0 |
| F 31-50 | 0.2 | 0.4 | 0.9 | 1.6 | 2.7 | 10.0 | 0.0 | 0.0 |
| M 51-70 | 0.2 | 0.4 | 0.8 | 1.5 | 2.4 | 10.0 | 0.0 | 0.0 |
| F 51-70 | 0.1 | 0.4 | 0.8 | 1.5 | 2.5 | 10.0 | 0.0 | 0.0 |
| M 71 + | 0.2 | 0.4 | 1.0 | 1.6 | 2.8 | 10.0 | 0.0 | 0.0 |
| F 71 + | 0.2 | 0.5 | 1.0 | 2.1 | 3.1 | 10.0 | 0.0 | 0.0 |
| Pregnant < 19 (+400mcg folic acid & + 16mg iron) | 0.2 | 0.4 | 0.8 | 1.5 | 2.5 | 10.0 | 0.0 | 0.0 |
| Lactating <19 (+400mcg folic acid) | 0.2 | 0.4 | 0.8 | 1.5 | 2.6 | 10.0 | 0.0 | 0.0 |
| Pregnant 19-30 (+ 400mcg folic acid & + 16mg iron) | 0.2 | 0.6 | 1.1 | 1.9 | 3.0 | 10.0 | 0.0 | 0.0 |
| Lactating 19-30 (+400mcg folic acid) | 0.2 | 0.6 | 1.2 | 1.9 | 3.0 | 10.0 | 0.0 | 0.0 |
| Pregnant 31-50 (+ 400mcg folic acid & + 16mg iron) | 0.2 | 0.4 | 1.0 | 1.6 | 2.5 | 10.0 | 0.0 | 0.0 |
| Lactating 31-50 (+400mcg folic acid) | 0.2 | 0.4 | 0.9 | 1.6 | 2.4 | 10.0 | 0.0 | 0.0 |
| Pregnant <19 (+400mcg folic acid & + 20 mg iron) | 0.2 | 0.4 | 0.9 | 1.6 | 2.5 | 10.0 | 0.0 | 0.0 |
| Pregnant 19-30 (+ 400mcg folic acid & + 20 mg iron) | 0.3 | 0.6 | 1.1 | 1.9 | 3.2 | 10.0 | 0.0 | 0.0 |
| Pregnant 31-50 (+ 400mcg folic acid & + 20mg iron) | 0.2 | 0.4 | 0.9 | 1.6 | 2.6 | 10.0 | 0.0 | 0.0 |
|
Abbreviations & Symbols
|
||||||||
| Age-Sex Group | Percent of Energy from Saturated Fat (%) | |||||||
|---|---|---|---|---|---|---|---|---|
| Percentiles | Requirement | |||||||
| P5 | P25 | P50 | P75 | P95 | Max % E Recommended by WHO |
% Requirement Not Met | SE | |
| M & F 2-3 | 0.4 | 0.8 | 1.3 | 1.9 | 2.8 | 10.0 | 0.0 | 0.0 |
| M 4-8 | 0.2 | 0.6 | 1.0 | 1.6 | 2.9 | 10.0 | 0.0 | 0.0 |
| F 4-8 | 0.2 | 0.5 | 0.9 | 1.6 | 2.6 | 10.0 | 0.0 | 0.0 |
| M 9-13 | 0.3 | 0.7 | 1.2 | 2.0 | 2.9 | 10.0 | 0.0 | 0.0 |
| F 9-13 | 0.2 | 0.4 | 1.0 | 1.6 | 2.5 | 10.0 | 0.0 | 0.0 |
| M 14-18 | 0.1 | 0.4 | 0.7 | 1.5 | 2.2 | 10.0 | 0.0 | 0.0 |
| F 14-18 | 0.2 | 0.4 | 0.8 | 1.6 | 2.5 | 10.0 | 0.0 | 0.0 |
| M 19-30 | 0.2 | 0.4 | 0.9 | 1.5 | 2.5 | 10.0 | 0.0 | 0.0 |
| F 19-30 | 0.2 | 0.6 | 1.2 | 1.9 | 2.9 | 10.0 | 0.0 | 0.0 |
| M 31-50 | 0.2 | 0.4 | 0.9 | 1.5 | 2.3 | 10.0 | 0.0 | 0.0 |
| F 31-50 | 0.2 | 0.4 | 0.9 | 1.6 | 2.7 | 10.0 | 0.0 | 0.0 |
| M 51-70 | 0.2 | 0.4 | 0.8 | 1.5 | 2.4 | 10.0 | 0.0 | 0.0 |
| F 51-70 | 0.1 | 0.4 | 0.8 | 1.5 | 2.5 | 10.0 | 0.0 | 0.0 |
| M 71 + | 0.2 | 0.4 | 1.0 | 1.6 | 2.8 | 10.0 | 0.0 | 0.0 |
| F 71 + | 0.2 | 0.5 | 1.0 | 2.1 | 3.1 | 10.0 | 0.0 | 0.0 |
| Pregnant < 19 (+400mcg folic acid & + 16mg iron) | 0.2 | 0.4 | 0.8 | 1.5 | 2.5 | 10.0 | 0.0 | 0.0 |
| Lactating <19 (+400mcg folic acid) | 0.2 | 0.4 | 0.8 | 1.5 | 2.6 | 10.0 | 0.0 | 0.0 |
| Pregnant 19-30 (+ 400mcg folic acid & + 16mg iron) | 0.2 | 0.6 | 1.1 | 1.9 | 3.0 | 10.0 | 0.0 | 0.0 |
| Lactating 19-30 (+400mcg folic acid) | 0.2 | 0.6 | 1.2 | 1.9 | 3.0 | 10.0 | 0.0 | 0.0 |
| Pregnant 31-50 (+ 400mcg folic acid & + 16mg iron) | 0.2 | 0.4 | 1.0 | 1.6 | 2.5 | 10.0 | 0.0 | 0.0 |
| Lactating 31-50 (+400mcg folic acid) | 0.2 | 0.4 | 0.9 | 1.6 | 2.4 | 10.0 | 0.0 | 0.0 |
| Pregnant <19 (+400mcg folic acid & + 20 mg iron) | 0.2 | 0.4 | 0.9 | 1.6 | 2.5 | 10.0 | 0.0 | 0.0 |
| Pregnant 19-30 (+ 400mcg folic acid & + 20 mg iron) | 0.3 | 0.6 | 1.1 | 1.9 | 3.2 | 10.0 | 0.0 | 0.0 |
| Pregnant 31-50 (+ 400mcg folic acid & + 20mg iron) | 0.2 | 0.4 | 0.9 | 1.6 | 2.6 | 10.0 | 0.0 | 0.0 |
|
Abbreviations & Symbols
|
||||||||
Summary
- Sodium, saturated fat and free sugars are considered nutrients of concern since they can contribute to an increased risk of chronic disease when consumed in excess (Health Canada, 2019). For this reason, the 2019 CFG encourages foods that do not contribute to excess consumption of sodium, free sugars, or saturated fat. Conversely, foods and beverages that contribute to excess consumption of these nutrients should not be consumed regularly as per 2019 CFG.
- Consequently, a valid food classification system that accurately represents the 2019 CFG ought to identify foods and beverages to encourage and to limit. Furthermore, one should be able to use this information to construct diets that limit excess consumption of sodium, saturated fat and free sugars.
- In view of that, Health Canada assessed nutrient content distributions of sodium, saturated fat and free sugars when analyzing the outcomes of the diet simulations that serve to validate the 2019 CFG-FCS and results were found to meet requirements for all but three of the Life Stage groups analyzed.
- Distributions of sodium amounts were above the CDRR for 0.8% of diet simulations representing male & females 2-3 year-old (i.e. 4 diet out of 500) as well as 0.2% of diet simulations representing males 9 to 13 years olds along with females of the same age group (i.e. 1 diet out of 500). This very small proportion was considered acceptable.
- Therefore, the 2019 CFG-FCS successfully classifies most CNF foods in accordance with 2019 Canada’s Dietary Guidelines 1 and 2. The simulation of diets using CNF foods classified according to this system showed low levels of saturated fat, free sugars and sodium in all Life Stage groups.
Considerations for application
- It is worth noting that nutrient information included in the CNF database represent averages and not exact values of individual products. That is, validity testing was not performed with the nutrient values of foods found on the market.
- Since the 2019 CFG-FCS was only tested on CNF composite foods, it is recommended to only use it to classify CNF foods. This is consistent with analyzing 2015 CCHS – Nutrition data as CNF information is used to report respondents’ food intake.
- Finally, we want to emphasize that this tool is to be used to assess the alignment of food choices with the 2019 CFG recommendations and should not be used to assess or rate a total diet. HC has developed, in collaboration with researchers, a tool designed to evaluate alignment of the total diet with the 2019 CFG.
More details on this tool can be found in the following scientific articles:
- Development of the Healthy Eating Food Index (HEFI)-2019 measuring adherence to Canada’s Food Guide 2019 recommendations on healthy food choices
- Evaluation of the Healthy Eating Food Index (HEFI)-2019 measuring adherence to Canada’s Food Guide 2019 recommendations on healthy food choices
References
Food and Agriculture Organization of the United Nations. (2010). Fats and fatty acids in human nutrition: Report of an expert consultation.
Government of Canada. (2012, 01 12). Retrieved 2022, from https://www.canada.ca/en/health-canada/services/understanding-food-labels/nutrient-content-claims-what-they-mean.html
Hack, S. J. (2020). Evaluating diet quality of canadian adults using health canada’s surveillance tool tier system: Findings from the 2015 canadian community health survey-nutrition. Nutrients, 12(4).
Health Canada. (2019). Canada’s Dietary Guidelines for Health Professionals and Policy Makers. Retrieved from https://food-guide.canada.ca/en/guidelines/
Munene, L. A.-M.-P. (2015). A surveillance tool to assess diets according to Eating Well with Canada’s Food Guide. Health Reports, 26(11).
The National Academies of Sciences, Engineering, and Medicine. (2019). Dietary Reference Intakes for Sodium and Potassium. Washington, DC: The National Academies Press.
World Health Organization. (2015). Guideline: sugars intake for adults and children.
Footnotes
- Footnote 1
-
80% Tier 1 foods and 20% Tier 2 foods
- Footnote 2
-
In this analysis, DRI Life Stage groups 0 through 6 and 7 through 12 months olds are not used and children 2-3 years old is used instead of children 1-3 years old since the 2019 CFG provides guidelines on nutrition for members of the Canadian population two years of age and older. In addition, results for the 4 through 8 years old males and females are presented separately.
- Footnote 3
-
Note that, here, the term “cluster” does not refer to the statistical technique known as cluster sampling.
- Footnote 4
-
See “Food Categories” in the next section for more details on Low-level sub-categories