
Page 3: National and provincial/territorial tobacco sales data 2021
Fine-cut tobacco sales
- Fine-cut tobacco sales in Canada from 2001-2021
- Fine-cut tobacco sales in Canada by province 2021
- Alberta fine-cut tobacco sales from 2001-2021
- British Columbia fine-cut tobacco sales from 2001-2021
- Manitoba fine-cut tobacco sales from 2001-2021
- New Brunswick fine-cut tobacco sales from 2001-2021
- Newfoundland and Labrador fine-cut tobacco sales from 2001-2021
- Nova Scotia fine-cut tobacco sales from 2001-2021
- Ontario fine-cut tobacco sales from 2001-2021
- Quebec fine-cut tobacco sales from 2001-2021
- Saskatchewan fine-cut tobacco sales from 2001-2021
- Prince Edward Island, Northwest Territories, Nunavut and Yukon fine-cut tobacco sales from 2001-2021
Since 2001, tobacco companies have been required by the Tobacco Reporting Regulations to provide Health Canada with reports on sales of tobacco products.
There are three important factors to consider when using these data:
- The data are subject to ongoing revision due to re-submissions by tobacco companies and/or audits by Health Canada.
- Sales represent shipments to wholesalers or retailers in a province/territory. Sales totals may not be representative of tobacco consumption for that province/territory.
- In certain cases, provincial/territorial sales were not reportable due to a limited number of companies active in that market. In these cases, the data were merged into a larger geographical grouping.
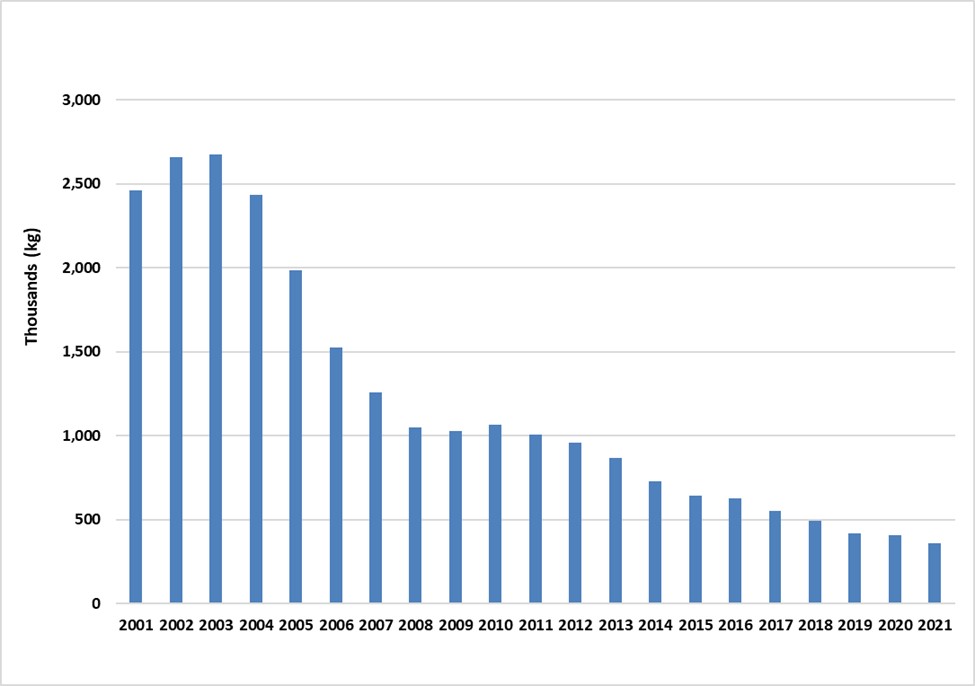
Fine-cut tobacco sales in Canada from 2001-2021
| Year | Kilograms |
|---|---|
| 2001 | 2,460,552 |
| 2002 | 2,658,447 |
| 2003 | 2,677,437 |
| 2004 | 2,434,872 |
| 2005 | 1,987,479 |
| 2006 | 1,526,649 |
| 2007 | 1,259,883 |
| 2008 | 1,049,328 |
| 2009 | 1,027,322 |
| 2010 | 1,063,404 |
| 2011 | 1,005,186 |
| 2012 | 958,118 |
| 2013 | 868,045 |
| 2014 | 728,922 |
| 2015 | 643,464 |
| 2016 | 627,378 |
| 2017 | 550,348 |
| 2018 | 495,189 |
| 2019 | 416,963 |
| 2020 | 409,326 |
| 2021 | 357,767 |
Fine-cut tobacco sales in Canada from 2001-2021 - Text Equivalent
Bar graph showing fine-cut tobacco sales in Canada from 2001 to 2021. Fine-cut sales declined from 2.5 million kilograms in 2001 to 358 thousand kilograms in 2021.
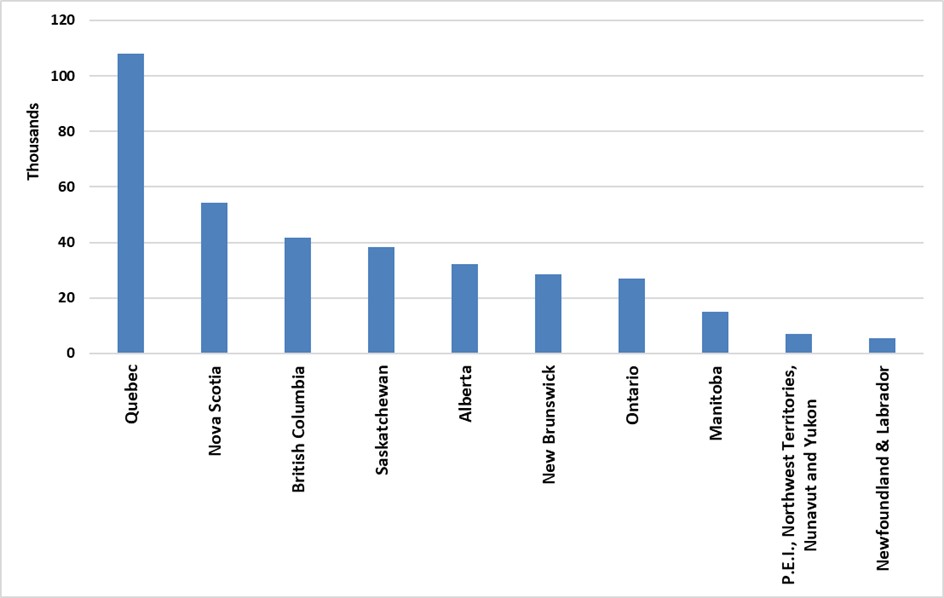
Fine-cut tobacco sales in Canada by province 2021 – 357,767 Kg
| Province | Kilograms |
|---|---|
| Quebec | 108,024 |
| Nova Scotia | 54,270 |
| British Columbia | 41,801 |
| Saskatchewan | 38,473 |
| Alberta | 32,133 |
| New Brunswick | 28,399 |
| Ontario | 27,070 |
| Manitoba | 15,117 |
| P.E.I., Northwest Territories, Nunavut and Yukon | 6,920 |
| Newfoundland & Labrador | 5,561 |
| Canada | 357,767 |
Fine-cut tobacco sales in Canada by province 2021 - Text Equivalent
Bar graph showing fine-cut tobacco sales by province in 2021. Quebec had the highest unit sales followed by Nova Scotia and British Columbia.
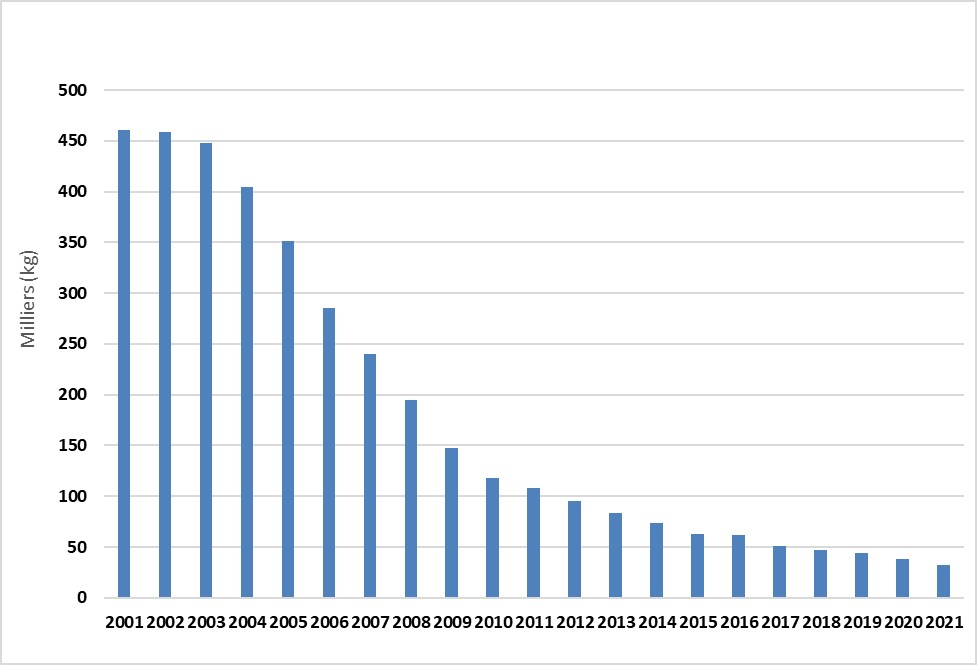
Alberta fine-cut tobacco sales from 2001-2021
| Year | Kilograms |
|---|---|
| 2001 | 460,549 |
| 2002 | 458,324 |
| 2003 | 448,132 |
| 2004 | 404,492 |
| 2005 | 351,442 |
| 2006 | 285,331 |
| 2007 | 240,063 |
| 2008 | 195,279 |
| 2009 | 147,732 |
| 2010 | 117,637 |
| 2011 | 107,756 |
| 2012 | 95,784 |
| 2013 | 83,845 |
| 2014 | 73,214 |
| 2015 | 62,367 |
| 2016 | 61,988 |
| 2017 | 51,310 |
| 2018 | 47,024 |
| 2019 | 43,639 |
| 2020 | 38,395 |
| 2021 | 32,133 |
Alberta fine-cut tobacco sales from 2001-2021 - Text Equivalent
Bar graph showing fine-cut tobacco sales in Alberta from 2001 to 2021. Fine-cut sales declined from 461 thousand kilograms in 2001 to 32 thousand kilograms in 2021.
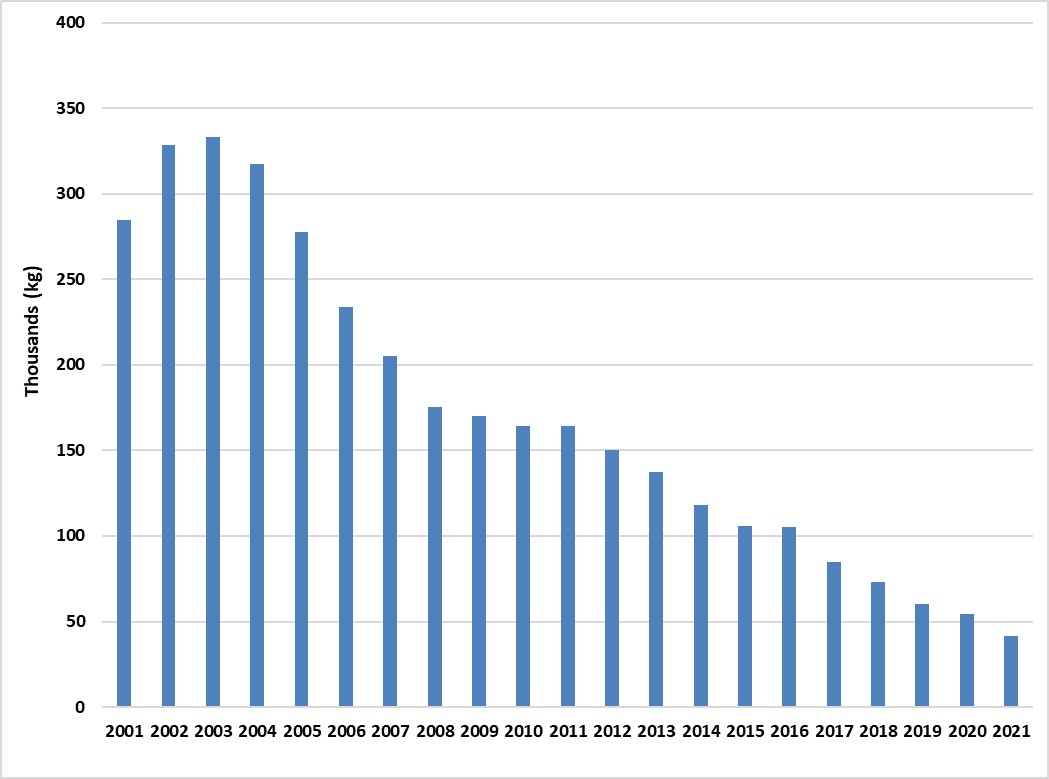
British Columbia fine-cut tobacco sales from 2001-2021
| Year | Kilograms |
|---|---|
| 2001 | 284,550 |
| 2002 | 328,653 |
| 2003 | 333,352 |
| 2004 | 317,354 |
| 2005 | 277,864 |
| 2006 | 233,750 |
| 2007 | 204,948 |
| 2008 | 175,476 |
| 2009 | 170,136 |
| 2010 | 164,439 |
| 2011 | 164,051 |
| 2012 | 150,217 |
| 2013 | 137,358 |
| 2014 | 117,956 |
| 2015 | 105,840 |
| 2016 | 104,986 |
| 2017 | 84,758 |
| 2018 | 73,330 |
| 2019 | 60,480 |
| 2020 | 54,651 |
| 2021 | 41,801 |
British Columbia fine-cut tobacco sales from 2001-2021 - Text Equivalent
Bar graph showing fine-cut tobacco sales in British Columbia from 2001 to 2021. Fine-cut sales decreased from 285 thousand kilograms in 2001 to 42 thousand kilograms in 2021.
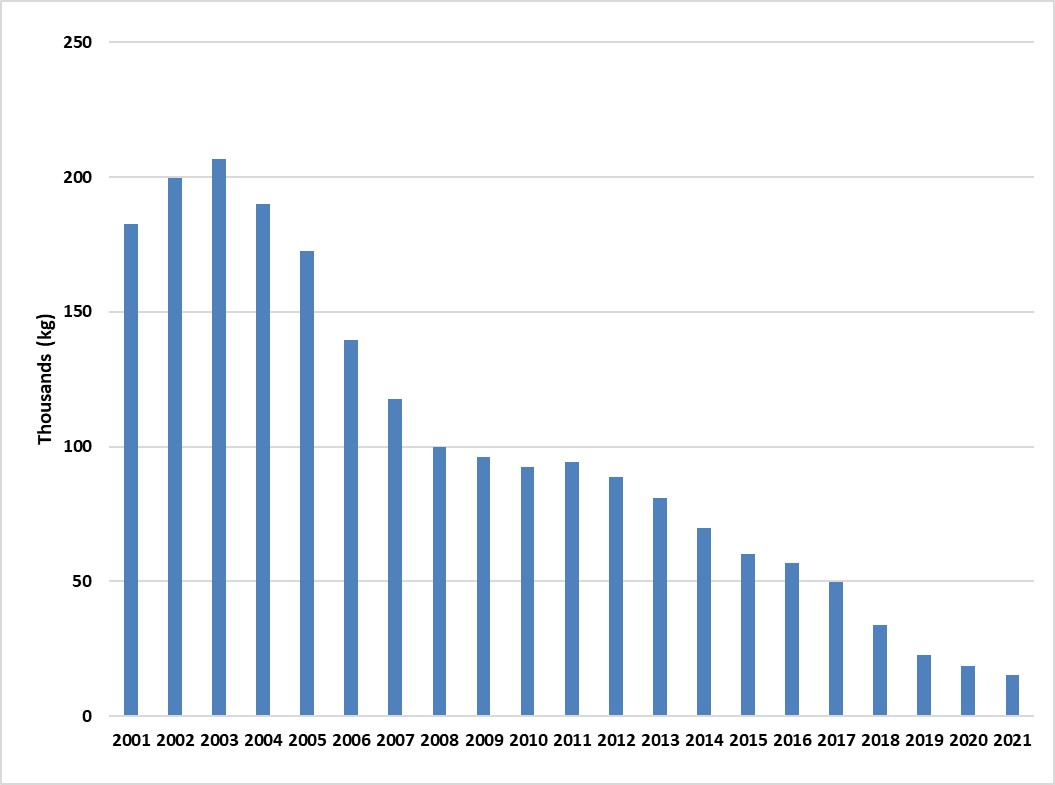
Manitoba fine-cut tobacco sales from 2001-2021
| Year | Kilograms |
|---|---|
| 2001 | 182,559 |
| 2002 | 199,790 |
| 2003 | 206,728 |
| 2004 | 189,927 |
| 2005 | 172,740 |
| 2006 | 139,740 |
| 2007 | 117,681 |
| 2008 | 99,768 |
| 2009 | 96,284 |
| 2010 | 92,506 |
| 2011 | 94,360 |
| 2012 | 88,601 |
| 2013 | 81,063 |
| 2014 | 69,735 |
| 2015 | 60,311 |
| 2016 | 56,940 |
| 2017 | 49,784 |
| 2018 | 33,723 |
| 2019 | 22,502 |
| 2020 | 18,594 |
| 2021 | 15,117 |
Manitoba fine-cut tobacco sales from 2001-2021 - Text Equivalent
Bar graph showing fine-cut tobacco sales in Manitoba from 2001 to 2021. Fine-cut sales declined from 183 thousand kilograms in 2001 to 15 thousand kilograms in 2021.
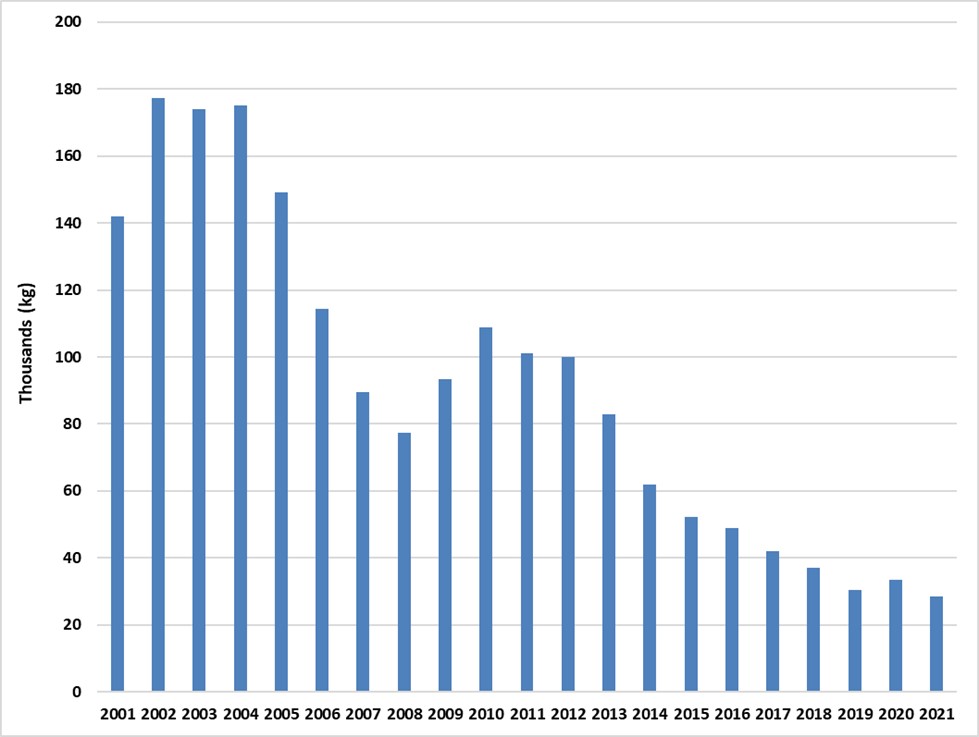
New Brunswick fine-cut tobacco sales from 2001-2021
| Year | Kilograms |
|---|---|
| 2001 | 141,990 |
| 2002 | 177,222 |
| 2003 | 173,933 |
| 2004 | 175,242 |
| 2005 | 149,060 |
| 2006 | 114,354 |
| 2007 | 89,534 |
| 2008 | 77,400 |
| 2009 | 93,328 |
| 2010 | 108,720 |
| 2011 | 101,207 |
| 2012 | 99,887 |
| 2013 | 82,933 |
| 2014 | 61,963 |
| 2015 | 52,130 |
| 2016 | 48,766 |
| 2017 | 42,000 |
| 2018 | 37,045 |
| 2019 | 30,415 |
| 2020 | 33,515 |
| 2021 | 28,399 |
New Brunswick fine-cut tobacco sales from 2001-2021 - Text Equivalent
Bar graph showing fine-cut tobacco sales in New Brunswick from 2001 to 2021. Fine-cut sales declined from 142 thousand kilograms in 2001 to 28 thousand in 2021.
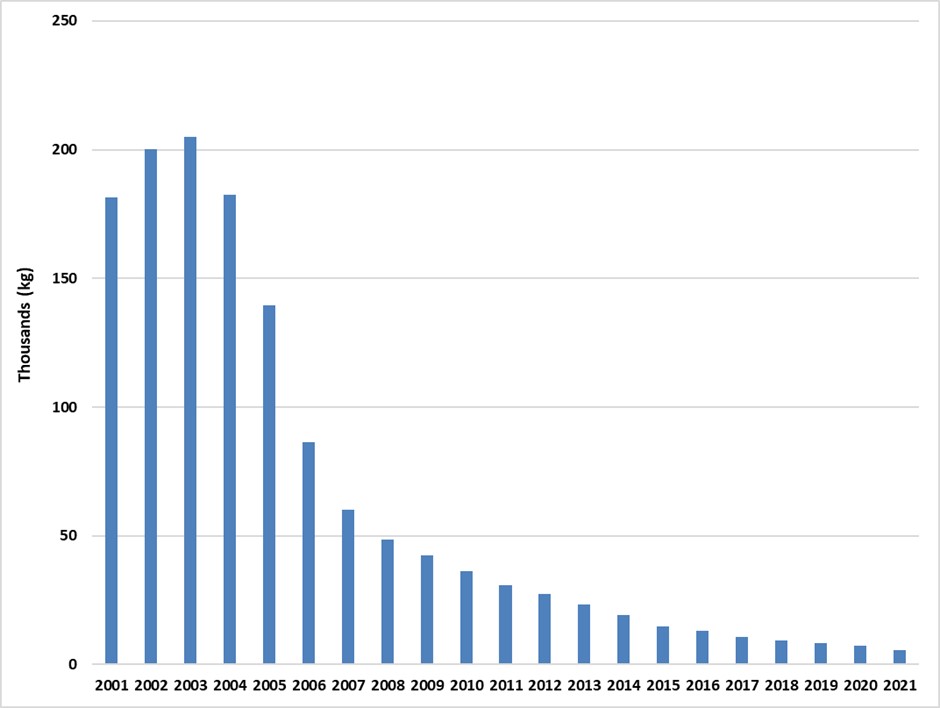
Newfoundland and Labrador fine-cut tobacco sales from 2001-2021
| Year | Kilograms |
|---|---|
| 2001 | 181,447 |
| 2002 | 200,311 |
| 2003 | 204,881 |
| 2004 | 182,574 |
| 2005 | 139,700 |
| 2006 | 86,456 |
| 2007 | 60,195 |
| 2008 | 48,546 |
| 2009 | 42,229 |
| 2010 | 36,417 |
| 2011 | 30,921 |
| 2012 | 27,542 |
| 2013 | 23,412 |
| 2014 | 19,277 |
| 2015 | 14,926 |
| 2016 | 13,200 |
| 2017 | 10,685 |
| 2018 | 9,169 |
| 2019 | 8,280 |
| 2020 | 7,265 |
| 2021 | 5,561 |
Newfoundland and Labrador fine-cut tobacco sales from 2001-2021 - Text Equivalent
Bar graph showing fine-cut tobacco sales in Newfoundland and Labrador from 2001 to 2021. Fine-cut sales declined from 181 thousand kilograms in 2001 to 5.6 thousand kilograms in 2021.
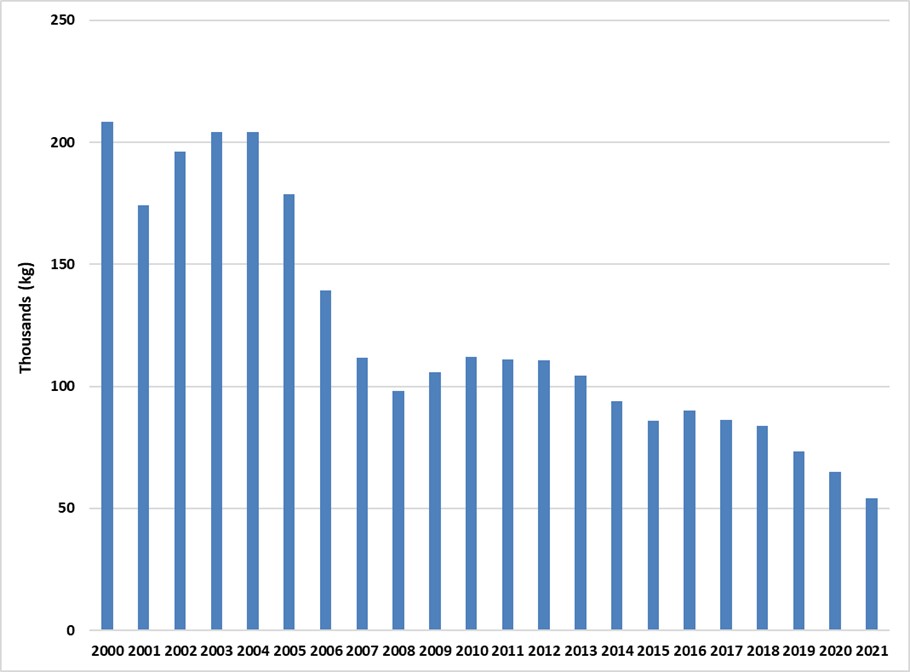
Nova Scotia fine-cut tobacco sales from 2001-2021
| Year | Kilograms |
|---|---|
| 2001 | 174,317 |
| 2002 | 196,180 |
| 2003 | 204,329 |
| 2004 | 204,256 |
| 2005 | 178,779 |
| 2006 | 139,234 |
| 2007 | 111,696 |
| 2008 | 98,107 |
| 2009 | 105,860 |
| 2010 | 112,082 |
| 2011 | 111,071 |
| 2012 | 110,586 |
| 2013 | 104,386 |
| 2014 | 94,101 |
| 2015 | 86,095 |
| 2016 | 89,991 |
| 2017 | 86,233 |
| 2018 | 83,913
|
| 2019 | 73,521 |
| 2020 | 64,808 |
| 2021 | 54,270 |
Nova Scotia fine-cut tobacco sales from 2001-2021 - Text Equivalent
Bar graph showing fine-cut tobacco sales in Nova Scotia from 2001 to 2021. Fine-cut sales declined from 174 thousand kilograms in 2001 to 54 thousand kilograms in 2021.
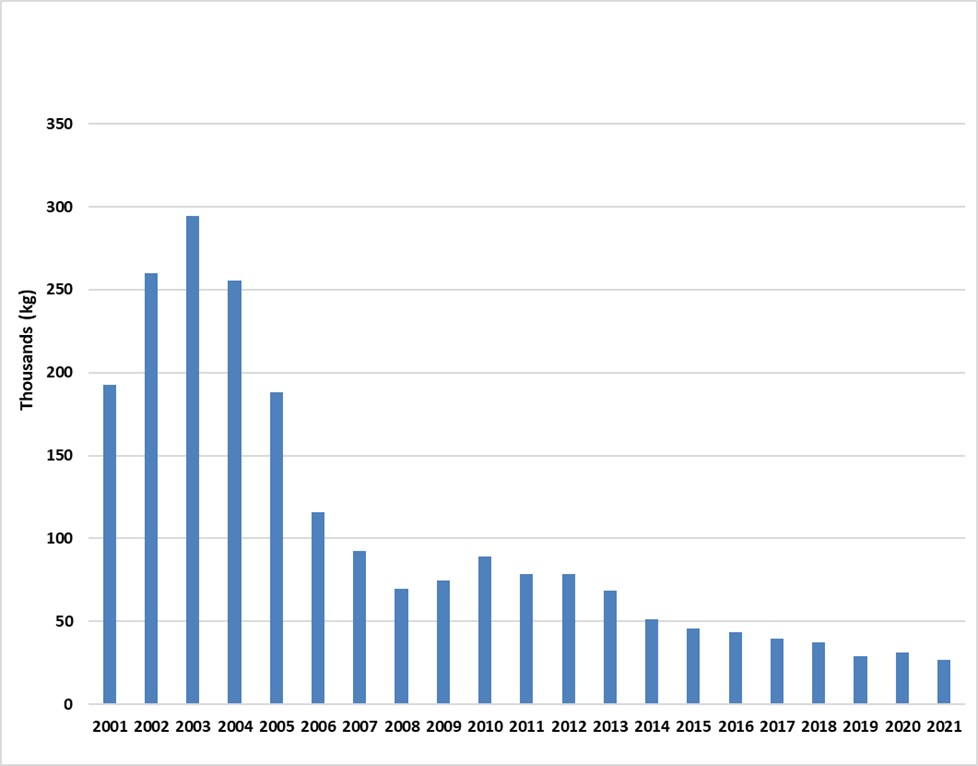
Ontario fine-cut tobacco sales from 2001-2021
| Year | Kilograms |
|---|---|
| 2001 | 192,635 |
| 2002 | 260,172 |
| 2003 | 294,297 |
| 2004 | 255,243 |
| 2005 | 188,372 |
| 2006 | 116,108 |
| 2007 | 92,595 |
| 2008 | 69,621 |
| 2009 | 74,767 |
| 2010 | 88,928 |
| 2011 | 78,345 |
| 2012 | 78,599 |
| 2013 | 68,829 |
| 2014 | 51,348 |
| 2015 | 45,972 |
| 2016 | 43,330
|
| 2017 | 39,523 |
| 2018 | 37,520 |
| 2019 | 28,800 |
| 2020 | 31,452 |
| 2021 | 27,070 |
Ontario fine-cut tobacco sales from 2001-2021 - Text Equivalent
Bar graph showing fine-cut tobacco sales in Ontario from 2001 to 2021. Fine-cut sales declined from 193 thousand kilograms in 2001 to 27 thousand kilograms in 2021.
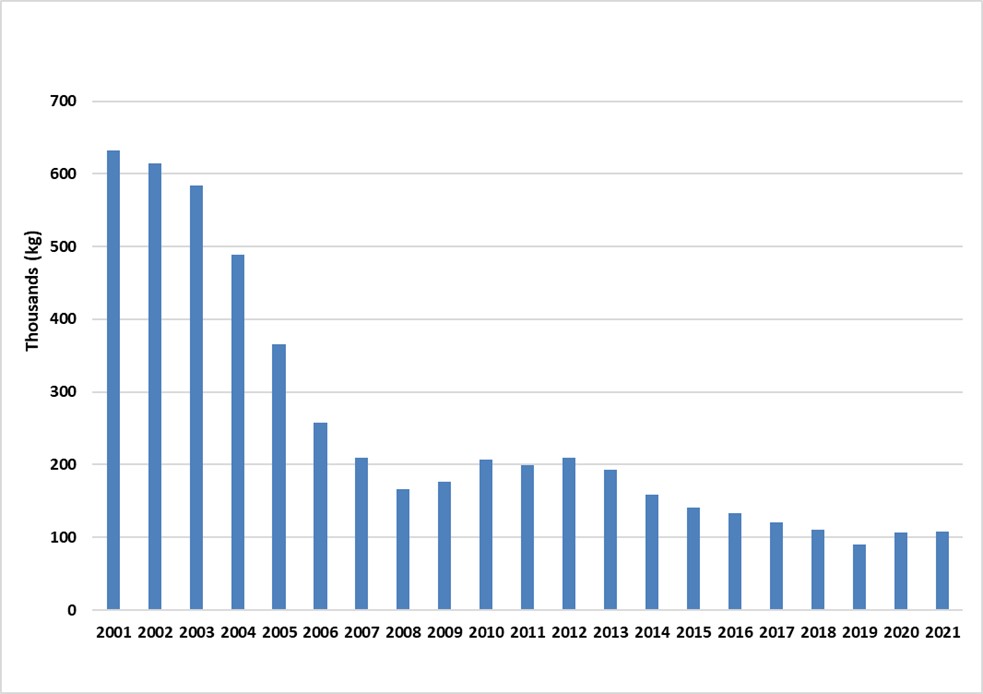
Quebec fine-cut tobacco sales from 2001-2021
| Year | Kilograms |
|---|---|
| 2001 | 632,305 |
| 2002 | 614,256 |
| 2003 | 584,466 |
| 2004 | 489,177 |
| 2005 | 366,219 |
| 2006 | 257,655 |
| 2007 | 209,865 |
| 2008 | 166,608 |
| 2009 | 176,396 |
| 2010 | 207,373 |
| 2011 | 199,879 |
| 2012 | 209,257 |
| 2013 | 192,548 |
| 2014 | 158,872 |
| 2015 | 140,649 |
| 2016 | 133,492 |
| 2017 | 120,184 |
| 2018 | 110,870 |
| 2019 | 89,607 |
| 2020 | 106,433 |
| 2021 | 108,024 |
Quebec fine-cut tobacco sales from 2001-2021 - Text Equivalent
Bar graph showing fine-cut tobacco sales in Quebec from 2001 to 2021. Fine-cut sales declined from 632 thousand kilograms in 2001 to 108 thousand kilograms in 2021.
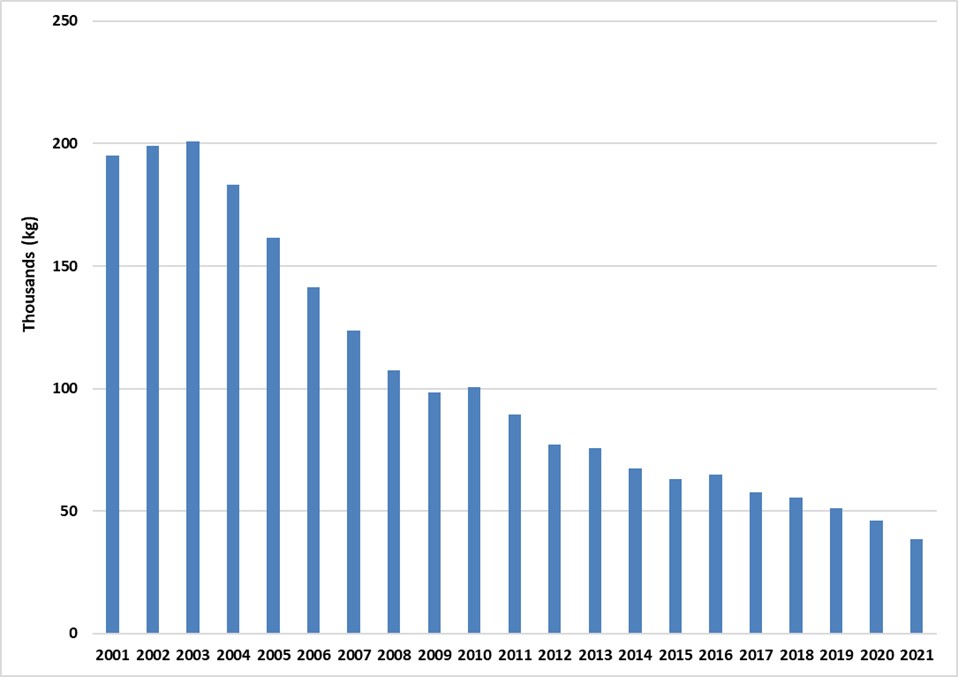
Saskatchewan fine-cut tobacco sales from 2001-2021
| Year | Kilograms |
|---|---|
| 2001 | 194,964 |
| 2002 | 199,014 |
| 2003 | 200,902 |
| 2004 | 183,039 |
| 2005 | 161,698 |
| 2006 | 141,506 |
| 2007 | 123,764 |
| 2008 | 107,407 |
| 2009 | 98,522 |
| 2010 | 100,414 |
| 2011 | 89,263 |
| 2012 | 77,266 |
| 2013 | 75,552 |
| 2014 | 67,559 |
| 2015 | 62,983 |
| 2016 | 64,685 |
| 2017 | 57,719 |
| 2018 | 55,615 |
| 2019 | 51,180 |
| 2020 | 46,248 |
| 2021 | 38,473 |
Saskatchewan fine-cut tobacco sales from 2001-2021 - Text Equivalent
Bar graph showing fine-cut tobacco sales in Saskatchewan from 2001 to 2021. Fine-cut sales declined from 195 thousand kilograms in 2001 to 38 thousand kilograms in 2021.
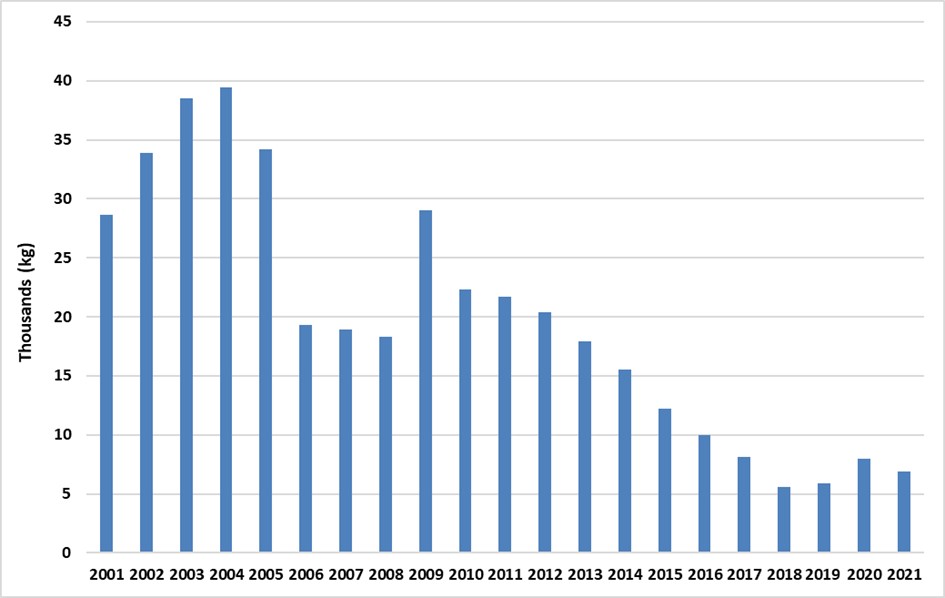
Prince Edward Island, Northwest Territories, Nunavut and Yukon fine-cut tobacco sales from 2001-2021
| Year | Kilograms |
|---|---|
| 2001 | 28,659 |
| 2002 | 33,892 |
| 2003 | 38,500 |
| 2004 | 39,440 |
| 2005 | 34,204 |
| 2006 | 19,308 |
| 2007 | 18,956 |
| 2008 | 18,297 |
| 2009 | 29,032 |
| 2010 | 22,322 |
| 2011 | 21,691 |
| 2012 | 20,379 |
| 2013 | 17,890 |
| 2014 | 15,527 |
| 2015 | 12,188 |
| 2016 | 10,000 |
| 2017 | 8,153 |
| 2018 | 5,550 |
| 2019 | 5,882 |
| 2020 | 7,965 |
| 2021 | 6,920 |
Sales data for PEI and the territories are merged due to the limited number of companies active in those markets. Unit sales may not represent total consumption as they only include direct shipments by tobacco companies and exclude products shipped from wholesalers in other provinces.
Prince Edward Island, Northwest Territories, Nunavut and Yukon fine-cut tobacco sales from 2001-2021 - Text Equivalent
Bar graph showing fine-cut tobacco sales in Prince Edward Island, Northwest Territories, Nunavut and Yukon from 2001 to 2021. Fine-cut sales declined from 29 thousand kilograms in 2001 to 6.9 thousand kilograms in 2021.