
Draft Guidelines for Canadian Drinking Water Quality, Haloacetic Acids

Download in alternative format
(2.5 MB, 253 pages)
Guideline Technical Document for Public Consultation
Consultation period ends March 13, 2026
On this page
- Purpose of consultation
- Proposed guideline value
- Executive summary
- 1.0 Exposure considerations
- 2.0 Health considerations
- 3.0 Derivation of the health-based value (HBV)
- 4.0 Analytical and HAA formation considerations
- 5.0 Treatment considerations
- 6.0 Distribution system and other considerations
- 7.0 Management strategies
- 8.0 International considerations
- 9.0 Rationale
- 10.0 References
- Appendix A: List of abbreviations
- Appendix B: Provincial and Territorial Anticipated Impacts
- Appendix C: Canadian Water Quality Data
- Appendix D: Epidemiology studies
- Appendix E : Database for Oral Toxicity of HAAs in Experimental Animals
- Appendix F: Mixture Analysis
- Appendix G: Suggested Parameters to Monitor From Natural Organic Matter (NOM) Guidance Document
Purpose of consultation
This guideline technical document outlines the evaluation of the available information on haloacetic acids (HAAs) with the intent of updating the guideline value(s) for HAAs in drinking water. The purpose of this consultation is to solicit comments on the proposed guideline value(s), on the approach used for its development, and on the potential economic costs of implementing it.
The existing guideline technical document on HAAs, developed in 2008, recommended a maximum acceptable concentration (MAC) of 0.08 mg/L (80 µg/L) for total HAAs (measured as HAA5: monochloroacetic acid, dichloroacetic acid, trichloroacetic acid, monobromoacetic acid, and dibromoacetic acid) based on consideration of both treatment technology and the ability of treatment plants to achieve the guideline. The MAC is based on a locational running annual average of a minimum of quarterly samples taken in the distribution system.
This document proposes a MAC of 0.08 mg/L (80 µg/L) for total HAAs (measured as HAA6: HAA5 plus bromochloroacetic acid [BCAA]) in drinking water, based on exposure and health effects, and taking into consideration both treatment technology and the ability of treatment plants to achieve the guideline. The MAC is based on a locational running annual average of a minimum of quarterly samples taken in the distribution system. If the locational running annual average for BCAA is measured at levels equal to or greater than 10 µg/L, steps should be taken to reduce brominated-HAA formation.
This document is available for a 60-day public consultation period. Please send comments (with rationale, where required) to Health Canada via email: water-consultations-eau@hc-sc.gc.ca
All comments must be received before March 13, 2026. Comments received as part of this consultation will be shared with members of the Federal-Provincial-Territorial Committee on Drinking Water (CDW), along with the name and affiliation of their author. Authors who do not want their name and affiliation shared with CDW members should provide a statement to this effect along with their comments.
It should be noted that this guideline technical document will be revised following the evaluation of comments received, and a drinking water guideline will be established, if required. This document should be considered as a draft for comment only.
Proposed guideline value
A maximum acceptable concentration (MAC) of 0.08 mg/L (80 µg/L) is proposed for total haloacetic acids (HAAs: measured as HAA6) in drinking water. The MAC is based on a locational running annual average of a minimum of quarterly samples taken in the distribution system. If the locational running annual average for bromochloroacetic acid (BCAA) is measured at levels equal to or greater than 10 µg/L, steps should be taken to reduce brominated-HAA formation.
Water treatment systems should make every effort to maintain concentrations as low as reasonably achievable (ALARA) without compromising the effectiveness of disinfection.
Given the potential health effects of HAAs, and the limited information on the risks and uncertainties of other chlorinated, brominated and iodinated disinfection by-products, it is recommended that treatment plants strive to maintain HAA levels ALARA. It is important to note that the health risks from disinfection by-products, including HAAs, are much less than the risks from consuming water that has not been disinfected. Therefore, efforts to manage HAA levels in drinking water must not compromise the effectiveness of water disinfection.
Executive summary
This guideline technical document was prepared in collaboration with the Federal-Provincial-Territorial Committee on Drinking Water and assesses all available information on haloacetic acids (HAAs).
Exposure
HAAs are a group of compounds that can form when the chlorine used to disinfect drinking water reacts with naturally occurring organic matter such as decaying leaves and vegetation. The use of chlorine in the treatment of drinking water has virtually eliminated waterborne diseases, since chlorine can kill or inactivate most microorganisms commonly found in water. Most drinking water treatment plants in Canada use some form of chlorine to disinfect drinking water, to treat the water directly in the treatment plant and/or to maintain a chlorine residual in the distribution system to prevent bacterial regrowth. Disinfection is an essential component of public drinking water treatment; the health risks from disinfection by-products (DBPs), including HAAs, are much less than the risks from consuming water that has not been appropriately disinfected.
Thirteen different types of HAAs were identified that could be found in disinfected drinking water. These include nine chlorine and bromine-containing HAAs and four iodine-containing HAAs. The specific HAAs targeted by the current Canadian drinking water quality guidelines are monochloroacetic acid (MCAA), dichloroacetic acid (DCAA), trichloroacetic acid (TCAA), monobromoacetic acid (MBAA), and dibromoacetic acid (DBAA). The sum of these five HAAs is commonly referred to as HAA5. This document proposes to include bromochloroacetic acid (BCAA) in addition to these five HAAs; the sum of these is referred to as HAA6. In treated Canadian drinking water, the chlorinated HAAs DCAA and TCAA were the most common HAAs detected, representing greater than 95% of the total HAA5 concentration. Monitoring data were limited for brominated HAAs, such as bromodichloroacetic acid (BDCAA), chlorodibromoacetic acid (CDBAA), and tribromoacetic acid (TBAA). Among all brominated HAAs monitored, bromochloroacetic acid (BCAA) and bromodichloroacetic acid (BDCAA) were the most common in Canadian water. These were seen at much lower concentrations than DCAA and TCAA. Iodine-containing HAAs had very low detection rates and concentrations in Canadian water.
Levels of HAA concentrations are generally higher in treated surface water than in treated groundwater because of the high organic content in lakes and rivers. Levels of HAAs are expected to be higher in warmer months because of the higher concentrations of organic precursor materials in the raw water and because the rate of formation of DBPs increases at higher temperatures. The presence of brominated HAAs will also depend on the presence of bromide in the source water.
Ingestion of HAAs in drinking water is the main source of human exposure to HAAs. Dermal and inhalation exposure of HAAs is not expected to contribute significantly to overall exposure.
Health effects
HAAs are a large group of chemicals; some have more scientific data available than others. To better understand the risk from the group of HAAs, health information for all 13 HAAs was analyzed as a mixture. While some studies suggest possible male reproductive effects from exposure to HAAs, carcinogenicity (the ability to produce tumours) is reported at lower concentrations of HAAs. The mixture analysis considered how HAAs may act on the body to lead to the development of carcinogenicity. Based on this, the HAAs were organized into two groups: those that do not directly bind to DNA (deoxyribonucleic acid), and those that may bind directly to DNA. The most potent member of each of these smaller groups was considered. The chlorinated HAAs are in the subgroup that does not directly bind to DNA to cause carcinogenicity, and the most potent member of this subgroup was DCAA. A health-based value of 0.07 mg/L was calculated based on liver tumours in both mice and rats. The brominated and chlorobromo-HAAs were placed in the subgroup that may directly bind to DNA to cause carcinogenicity. The most potent member of this subgroup was DBAA. A health-based value of 0.003 mg/L was calculated based on tumours in several organs in both mice and rats. Since iodine-containing HAAs had limited human health effect data and they had very low detection rates and concentrations in Canadian water, they were excluded from the subgroupings.
A guideline for total HAAs (measured as HAA6) of 0.08 mg/L is proposed, based on exposure and health effects, and taking into consideration both treatment technology and the ability of treatment plants to achieve the guideline. In addition, if BCAA is present at levels greater than or equal to 10 µg/L, steps should be taken to reduce the formation of brominated HAAs. Chlorinated HAAs are found at the highest levels in drinking water. While brominated HAAs are less prevalent than chlorinated HAAs, they are more potent and have the potential to cause health effects at lower concentrations. For this reason, measurements of BCAA (the most common brominated HAA in Canadian waters that has health effect data) should be used as an indicator of locations with elevated concentrations of brominated HAAs. The proposed HAA6 guideline is considered to be protective of health for all HAAs, considering the proportion of chlorinated and brominated HAAs seen in Canadian drinking water.
Analytical and treatment considerations
The development of a drinking water guideline takes into consideration the ability to both measure the contaminant and remove it from drinking water supplies. Several standardized analytical methods are available for measuring HAAs in water concentrations well below the proposed MAC and individual BCAA concentrations well below 0.01 mg/L (10 µg/L). Measurements for total HAA6 in a water sample should include MCAA, MBAA, DCAA, DBAA, TCAA and BCAA.
The approach to reduce exposure to HAAs is generally focused on minimizing the formation of HAAs using strategies such as organic precursor removal prior to disinfection and changing disinfectant type or dose and the dosing location. This should include assessing the presence of bromide in the source water and characterization of brominated HAA species. Additionally, source water control strategies, such as a change in water source or blending of source waters, can be considered for reducing the formation of HAAs. In situations where HAAs have formed, there are options to remove formed HAAs (for example, biological activated carbon filtration and membrane separation). It is critical that any method used to control levels of HAAs must not compromise the effectiveness of disinfection.
Distribution system
HAAs continue to form within the distribution system. For this reason, it is recommended that water treatment systems develop a distribution system management plan to minimize the formation of HAAs. Strategies to reduce HAA formation may include optimizing chlorine residuals, switching to chloramines, decreasing water age, and system flushing. Well-developed, calibrated and maintained distribution system models may provide another option to assess water age and simulate chlorine decay and HAA formation. Any control strategy should not compromise the effectiveness of disinfection.
Application of the guideline
Note: Specific guidance related to the implementation of drinking water guidelines should be obtained from the appropriate drinking water authority.
All water treatment systems should implement a comprehensive and up-to-date risk management water safety plan. A source-to-tap approach should be taken to ensure that water safety is maintained. This approach requires a system assessment to characterize the source water; describe the treatment barriers that prevent or reduce contamination; identify the conditions that can result in contamination; and implement control measures. Operational monitoring is then established, and operational/management protocols are instituted (for example, standard operating procedures, corrective actions and incident responses). Compliance monitoring is determined and other protocols to validate the water safety plan are implemented (for example, recordkeeping, consumer satisfaction). Operator training is also required to ensure the effectiveness of the water safety plan at all times.
HAAs are DBPs that are formed when chlorine reacts with organic and inorganic precursors. The proposed guideline is based on a locational running annual average of quarterly samples taken at the points in the distribution system with the highest potential HAA concentrations (for example, a location with high water age or dead ends). Locational running annual average means the average concentration for samples collected at a specified location and frequency for the previous 12 months. HAA levels can vary over time, including seasonally, with factors changing, such as the levels of organic matter, inorganics as well as temperature and pH. When the locational running annual average of quarterly samples exceeds the proposed MAC of 80 μg/L for total HAAs (or exceeds 10 µg/L for BCAA), there should be an investigation, followed by appropriate corrective actions. If the total concentration of HAA6 in an individual sample exceeds 80 μg/L, it is a sign to evaluate the cause and determine next steps. Additionally, if the monitoring profile from an individual sample shows that the level of BCAA exceeds 10 µg/L, the cause should be evaluated to determine next steps, which could include characterization of all HAA species. The priority should always be to ensure proper disinfection. Any actions to reduce HAAs must not result in any microbial issues (such as detections of E.coli or total coliforms).
The main approach for reducing exposure to HAAs is focused on minimizing their formation. The most effective and practical way to prevent the formation of HAAs in finished waters is primarily through the removal of organic and inorganic precursors.
When appropriate drinking water treatment strategies are implemented to reduce HAAs, the levels of other DBPs may also be reduced. Changes implemented to address HAAs should be considered holistically to ensure that they do not compromise disinfection; increase other DBPs (for example, although pH adjustments may help reduce HAA formation, they may cause a corresponding increase in the formation of other DBPs, including trihalomethanes [THMs]); cause other compliance issues; or inadvertently increase the levels or leaching of other contaminants, such as lead, in the distributed water.
HAAs, along with THMs, are the most commonly detected DBPs found in drinking water and are often detected in the highest concentrations. The concentration of THMs and HAAs can be used as indicators or surrogates for the total loading of all DBPs in drinking water supplies. For this reason, it is recommended that treatment plants strive to maintain HAA levels as low as reasonably achievable without compromising disinfection.
International considerations
The United States Environmental Protection Agency and the European Union both have a value of 60 µg/L for HAA5. The World Health Organization and Australia’s National Health and Medical Research Council established values for individual HAAs in drinking water (MCAA, DCAA, TCAA). Variations in these values can be attributed to the age of the assessments or to differing policies and approaches, including the choice of key study and the use of different drinking water intake rates, body weights and source allocation factors.
1.0 Exposure considerations
1.1 Substance identity
Haloacetic acids (HAAs) all share a common structure with acetic acid as the parent compound (NTP, 2018). Each molecule consists of two carbons: one alpha carbon and one carbon as part of a carboxylic acid. For different HAAs, one or more of the three hydrogens on the alpha carbon are replaced with one or more halogen atoms, which could include fluorine, chlorine (Cl-HAA), bromine (Br-HAA) and iodine (I-HAA) (Figure 1). Thirteen different types of HAAs have been identified in disinfected drinking water, including nine chlorine- and bromine-containing mono-, di-, or tri-HAAs and four I-HAAs (NTP, 2018). No fluorine-containing HAAs have been identified as water disinfection by-products (DBPs) (NTP, 2018).
Figure 1. Haloacetic acids (HAAs) One, two or three hydrogens on the methyl group of acetic acid can be substituted by halogens (chlorine [Cl], bromine [Br] and iodine [I])

Figure 1: Text description
BSF for HAA6 is the sum of the molar concentration of brominated HAAs divided by the total molar concentration of chlorinated and brominated HAAs in HAA6.
The specific HAAs targeted by Canadian drinking water quality guidelines are monochloroacetic acid (MCAA), dichloroacetic acid (DCAA), trichloroacetic acid (TCAA), monobromoacetic acid (MBAA) and dibromoacetic acid (DBAA). The sum of these five HAAs is commonly referred to as HAA5. Other HAAs include bromochloroacetic acid (BCAA), tribromoacetic acid (TBAA), chlorodibromoacetic acid (CDBAA), and bromodichloroacetic acid (BDCAA). HAA6 refers to the sum of HAA5 plus BCAA, while HAA9 refers to the sum of HAA6 plus TBAA, CDBAA and BDCAA. I-HAAs that have been identified in treated water (according to NTP, 2018) include monoiodoacetic acid (MIAA), diiodoacetic acid (DIAA), chloroiodoacetic acid (CIAA) and bromoiodoacetic acid (BIAA); however, there may be others. Although these chemical analogues are referred to as "acids" in this document, when they are found in drinking water at normal pHs, they are present as salts and are therefore acetates (Urbansky, 2000; EC, 2003). Physical-chemical properties of these HAAs are reported in Table 1.
| Haloacetic acid CAS RN |
Molecular formula | Molecular weight (g/mol) | Water solubility (mg/mL)Table 1 Footnote 7 | Vapour pressure (mmHg)Table 1 Footnote 7 | Octanol-water partition coefficient (logKow) | Henry’s Lawconstant (atm-m3/mol)Table 1 Footnote 7 | Dissociation constant (pKa) |
|---|---|---|---|---|---|---|---|
| MCAA 79-11-8 |
C2H3ClO2 | 94.50 | 858Table 1 Footnote 1 (very high) |
0.065Table 1 Footnote 2 (moderate) |
0.22Table 1 Footnote 3 (low) |
9.26E-09Table 1 Footnote 4 (negligible) |
2.97Table 1 Footnote 3 |
| DCAA 79-43-6 |
C2H2Cl2O2 | 128.94 | 1 000(at 20 °C)Table 1 Footnote 1 (very high) |
0.179Table 1 Footnote 4 (moderate) |
0.92Table 1 Footnote 3 (low) |
8.38E-09Table 1 Footnote 4 (negligible) |
1.41Table 1 Footnote 3 |
| TCAA 76-03-9 |
C2HCl3O2 | 163.38 | 44Table 1 Footnote 1 (very high) |
0.06Table 1 Footnote 4 (moderate) |
1.33Table 1 Footnote 3 (low) |
1.35E-08Table 1 Footnote 4 (negligible) |
0.66Table 1 Footnote 3 |
| MBAA 79-08-3 |
C2H3BrO2 | 138.95 | 94Table 1 Footnote 1 (very high) |
0.118Table 1 Footnote 4 (moderate) |
0.41Table 1 Footnote 3 (low) |
6.52E-09Table 1 Footnote 4 (negligible) |
2.96Table 1 Footnote 3 |
| DBAA 631-64-1 |
C2H2Br2O2 | 217.84 | 2 110Table 1 Footnote 1 (very high) |
0.023Table 1 Footnote 5 (moderate) |
0.7Table 1 Footnote 3 (low) |
4.42E-09Table 1 Footnote 4 (negligible) |
1.39Table 1 Footnote 3 |
| TBAA 75-96-7 |
C2HBr3O2 | 296.74 | 200Table 1 Footnote 1 (very high) |
0.00028Table 1 Footnote 5 (moderate) |
1.71Table 1 Footnote 3 (low) |
3.34E-09Table 1 Footnote 4 (negligible) |
0.03Table 1 Footnote 3 |
| BCAA 5589-96-8 |
C2H2BrClO2 | 173.39 | 250Table 1 Footnote 1 (very high) |
0.14Table 1 Footnote 5 (moderate) |
0.61Table 1 Footnote 3 (low) |
2.2E-08Table 1 Footnote 5 (negligible) |
1.4Table 1 Footnote 3 |
| CDBAA 5278-95-5 |
C2HBr2ClO2 | 252.29 | 2.4Table 1 Footnote 1 (high) |
0.0052Table 1 Footnote 5 (moderate) |
1.62Table 1 Footnote 3 (low) |
2.6E-09Table 1 Footnote 5 (negligible) |
0.04Table 1 Footnote 3 |
| BDCAA 71133-14-7 |
C2HBrCl2O2 | 207.83 | 4.9Table 1 Footnote 1 (high) |
0.036Table 1 Footnote 5 (moderate) |
1.53Table 1 Footnote 3 (low) |
7.9E-09Table 1 Footnote 5 (negligible) |
0.05Table 1 Footnote 3 |
| MIAA 64-69-7 |
C2H3IO2 | 185.95 | 48.8Table 1 Footnote 5 (very high) |
0.0323Table 1 Footnote 5 (moderate) |
0.85Table 1 Footnote 3 (low) |
4.9E-08Table 1 Footnote 5 (negligible) |
2.95Table 1 Footnote 3 |
| DIAA 598-89-0 |
C2H2I2O2 | 311.84 | 53.6Table 1 Footnote 4 (very high) |
0.0149Table 1 Footnote 4 (moderate) |
2.21Table 1 Footnote 4 (low) |
5.8E-09Table 1 Footnote 4 (negligible) |
NA |
| CIAA 53715-09-6 |
C2H2ClIO2 | 220.39 | 253.45Table 1 Footnote 4 (very high) |
0.00234Table 1 Footnote 4 (moderate) |
1.16Table 1 Footnote 3 (low) |
NA | 1.47Table 1 Footnote 3 |
| BIAA 71815-43-5 |
C2H2BrIO2 | 264.84 | 263.78Table 1 Footnote 4 (very high) |
0.0494Table 1 Footnote 4 (moderate) |
1.24Table 1 Footnote 3 (low) |
5.73E-09Table 1 Footnote 4 (negligible) |
1.67Table 1 Footnote 3 |
BCAA – bromochloroacetic acid; BDCAA – bromodichloroacetic acid; BIAA – bromoiodoacetic acid; CAS RN – Chemical Abstracts Service Registry Number; CDBAA – chlorodibromoacetic acid; CIAA –chloroiodoacetic acid; DBAA – dibromoacetic acid; DCAA – dichloroacetic acid; DIAA – diiodoacetic acid; MBAA – monobromoacetic acid; MCAA – monochloroacetic acid; MIAA – monoiodoacetic acid; NA – not available; TBAA – tribromoacetic acid; TCAA –trichloroacetic acid.
|
|||||||
1.2 Sources, uses and environmental fate
Sources: HAAs may form when water disinfectants react with natural organic matter (NOM) or inorganic matter (for example, bromide ion) that is naturally present in raw water (WHO, 2000). HAAs may form during disinfection of water using chlorine, chloramines, chlorine dioxide and ozone (Kimura et al., 2017; Parvez et al., 2019). The majority of drinking water treatment plants (DWTPs) in Canada use some form of chlorine to disinfect drinking water, either to treat the water directly in the treatment plant and/or to maintain a chlorine residual in the distribution system to prevent bacterial regrowth. Disinfection is an essential component of public drinking water treatment. The health risks from DBPs, including HAAs, are much less than the risks from consuming water that has not been appropriately disinfected.
HAAs are the second most prevalent chlorination by-products by weight in disinfected water, after trihalomethanes (THMs) (Singer, 2002; Krasner et al., 2006; NTP, 2018). Together, HAAs and THMs make up approximately 50%–75% of total halogenated DBPs and approximately 25%–50% of total organic halides (Krasner et al., 2006, 2016). The formation and speciation of HAAs in drinking water may be influenced by a variety of factors, including type of disinfectant used, pH/temperature of the water (that is, seasonal variability) and type/amount of NOM (WHO, 2000; Singer, 2002; NTP, 2018).
Uses: While disinfecting drinking water is the most relevant source of HAA exposure for this guideline, HAAs also have laboratory, medical and industrial uses. MCAA is used to synthesize industrial cellulose ethers, herbicides (2,4-dichlorophenoxyacetic acid, 2,4,5-trichlorophenoxyacetic acid and 4-chloro-2-methylphenoxyacetic acid), surfactants (shampoos and industrial cleaning agents), indigo dyes, plastics and pharmaceuticals (caffeine and vitamin B6) (Morris and Bost, 2002; ECB, 2005). MCAA is also used to synthesize DCAA, a chemical intermediate in the synthesis of compounds used in the agricultural sector (Morris and Bost, 2002). Other uses for MCAA/DCAA include as an analytical reagent in fibre manufacture, medicinal disinfectant, cauterizing agent, and therapy for congenital lactic acidosis and cancers (Gennaro, 2000; Tennant et al., 2010; IARC, 2014).
TCAA has been used as an analytical agent, as an antiseptic, for organic syntheses, to treat local lesions and dermatological diseases, in textile finishing, in the surface treatment of metals and as a herbicide (Gennaro, 2000; WHO, 2004a; IARC, 2014; NTP, 2018). MBAA has been used in letterpress printing, organic synthesis, production of plastics and abscission of fruits (Larranaga et al., 2016). TBAA is used in organic synthesis and polymerization (O'Neil, 2006). DBAA, BCAA, CIAA and BIAA are used in laboratories for research purposes only (IARC, 2014). MIAA derivatives have been used as reagents to block or crosslink sulfhydryl groups in proteins and other molecules and inhibit glycolysis (Hermanson, 2013; Kan, 2013). No industrial uses of CDBAA, BDCAA, DIAA, CIAA and BIAA were found.
Environmental fate: In drinking water distribution systems, some HAAs may decompose or biodegrade under certain conditions (for example, high pH or absence of chlorine residual) (Singer, 2002). Some HAAs can decompose to form THMs, and therefore HAAs and THMs should be managed conjunctively. For example, TCAA, TBAA, dibromochloroacetic acid (DBCA), and BDCAA can decompose to form chloroform, tribromomethane, dibromochloromethane and bromodichloromethane, respectively (Zhang and Minear, 2002; Xiang et al., 2005). TBAA may also decompose to bromoform in aqueous solutions (Heller-Grossman et al., 1993). However, these decomposition reactions are predicted to be very slow. The decomposition half-lives at 15 °C were suggested to range from 103 days (TBAA) to 68 years (DCAA) in a study that calculated the half-lives of MCAA, DCAA, TCAA, MBAA, DBAA, TBAA and BCAA (Lifongo et al., 2010).
In the environment, HAAs are predicted to move easily in water and have low adsorption to soil due to their high solubility in water and low octanol-water partition coefficients (Table 1), respectively. Volatilization from water surfaces is predicted to be minor based on the high water solubilities, moderate vapour pressures and negligible Henry’s law constants of these compounds. Low values of the dissociation constant (pKa) indicate that these compounds will exist almost entirely in the ionized form at pH values found in drinking water.
The thermal degradation of HAAs in water is slow at environmental temperatures, which suggests that many of these compounds may be long-lived in water (Lifongo et al., 2010). HAAs such as MBAA, DBAA, MCAA and DCAA degrade through hydrolysis with half-lives of 2, 12, 15 and 68 years, respectively, at 15 °C (Lifongo et al., 2010). BCAA also degrades through hydrolysis with a half-life of 6 years at 15 °C (Lifongo et al., 2010). Tri-substituted HAAs such as TBAA and TCAA degrade through decarboxylation with half-lives of 103 days and 46 years, respectively, at 15 °C (Lifongo et al., 2010). Photodegradation to less harmful products, carbon dioxide and hydrogen halide is a potentially faster route but depends on the intensity of radiation that penetrates the water (Lifongo et al., 2010).
1.3 Exposure
Ingestion of HAAs in drinking water is the main source of human exposure to HAAs. Inhalation and dermal exposures to HAAs are limited due to their physical and chemical properties (moderate vapour pressure and high polarity) (Savitz, 2012; NTP, 2018). Cl-HAAs generally dominate in drinking water; however, in high-bromide or high-iodide waters, the Br-HAAs or I-HAAs, respectively, may be more prevalent (IPCS, 2000; Krasner et al., 2006; NTP, 2018). Air and food are potentially minor sources of HAA5; however, data are insufficient to quantify their relative contributions. No information on Canadian biomonitoring was found (Government of Canada, 2023).
Water: Water monitoring data from distribution systems was obtained from the provinces and territories (Table 2 and Table 3) and from the National Drinking Water Survey (NDWS) (Table 4 and Table 5). The results showed that the Cl-HAAs, DCAA and TCAA were the predominant HAAs; the Br-HAAs, MBAA, DBAA and TBAA were the least predominant. The mixed bromochloro HAAs, BCAA, CDBAA and BDCAA, had relatively high detection rates, but the concentrations were relatively low in comparison to DCAA and TCAA. BCAA and BDCAA had the highest occurrence and concentrations among the Br-HAAs. However, sufficient exposure and health effect data are available only for BCAA, making BCAA the better indicator of the presence of Br-HAAs.
It is not generally known whether the exposure data was collected for compliance or operational purposes. In addition, other factors that affect HAA concentrations were not available for consideration in this analysis (for example, season, disinfection strategy, distribution system conditions). The exposure data provided reflect different detection limits (DLs) of accredited laboratories used within and amongst the jurisdictions, as well as their respective monitoring programs. As a result, the exposure data and its statistical analysis provide only a limited picture. For example, the HAA6 and HAA9 data provided by some jurisdictions cannot be compared to HAA5 monitoring results (Table 3) due to different monitoring campaigns. Overall, the analysis of the provincial and territorial data shows variability Canada-wide.
| Jurisdiction [sample collection timeframe] |
Parameter | MCAA (μg/L) |
DCAA (μg/L) |
TCAA (μg/L) |
MBAA (μg/L) |
DBAA (μg/L) |
TBAA (μg/L) |
BCAA (μg/L) |
CDBAA (μg/L) |
BDCAA (μg/L) |
|---|---|---|---|---|---|---|---|---|---|---|
| FNIHB AtlanticTable 2 Footnote b [2014–2018] |
DL | 5 | 5 | 5 | 5 | 5 | NR | NR | NR | NR |
| FNIHB AtlanticTable 2 Footnote b [2014–2018] |
# detects/N | 7/1 889 | 305/ 1 189 | 332/ 1 189 | 0/ 1 189 | 76/ 1 189 | NR | NR | NR | NR |
| FNIHB AtlanticTable 2 Footnote b [2014–2018] |
Detection % | 0.4 | 25.7 | 27.9 | 0 | 6.4 | NR | NR | NR | NR |
| FNIHB AtlanticTable 2 Footnote b [2014–2018] |
Median | < DL | < DL | < DL | < DL | < DL | NR | NR | NR | NR |
| FNIHB AtlanticTable 2 Footnote b [2014–2018] |
MeanTable 2 Footnote a | 3 | 6 | 8 | < DL | 3 | NR | NR | NR | NR |
| FNIHB AtlanticTable 2 Footnote b [2014–2018] |
90th percentile | < DL | 18 | 24 | < DL | < DL | NR | NR | NR | NR |
| FNIHB ManitobaTable 2 Footnote b [2014–2018] |
DL | 5 | 1–5 | 1–5 | 1 | 1 | NR | NR | NR | NR |
| FNIHB ManitobaTable 2 Footnote b [2014–2018] |
# detects/N | 9/183 | 156/ 183 | 148/ 183 | 8/183 | 31/183 | NR | NR | NR | NR |
| FNIHB ManitobaTable 2 Footnote b [2014–2018] |
Detection % | 4.9 | 85.2 | 80.9 | 4.4 | 16.9 | NR | NR | NR | NR |
| FNIHB ManitobaTable 2 Footnote b [2014–2018] |
Median | < DL | 15 | 25 | < DL | < DL | NR | NR | NR | NR |
| FNIHB ManitobaTable 2 Footnote b [2014–2018] |
MeanTable 2 Footnote a | 3 | 22 | 34 | 1 | 1 | NR | NR | NR | NR |
| FNIHB ManitobaTable 2 Footnote b> [2014–2018] |
90th percentile | < DL | 50 | 78 | < DL | 2 | NR | NR | NR | NR |
| FNIHB OntarioTable 2 Footnote b [2014–2018] |
DL | 1–2 | 0.5–50 | 0.5–50 | 2–40 | 0.5–5 | NR | 2 | NR | NR |
| FNIHB OntarioTable 2 Footnote b [2014–2018] |
# detects/N | 260/ 2 058 | 1 810/ 2 193 | 1 721/ 2 193 | 32/ 1 876 | 220/2 193 | NR | 561/ 1 876 | NR | NR |
| FNIHB OntarioTable 2 Footnote b [2014–2018] |
Detection % | 12.6 | 82.5 | 78.5 | 1.7 | 10.0 | NR | 29.9 | NR | NR |
| FNIHB OntarioTable 2 Footnote b [2014–2018] |
Median | < DL | 13 | 16 | < DL | < DL | NR | < DL | NR | NR |
| FNIHB OntarioTable 2 Footnote b [2014–2018] |
MeanTable 2 Footnote a | 1 | 23 | 37 | 1 | 1 | NR | 2 | NR | NR |
| FNIHB OntarioTable 2 Footnote b [2014–2018] |
90th percentile | 2 | 54 | 94 | < DL | 1 | NR | 4 | NR | NR |
| ManitobaTable 2 Footnote c [2014–2019] |
DL | 5.0 | 1.0 | 1.0 | 1.0 | 1.0 | NR | 1.0 | NR | NR |
| ManitobaTable 2 Footnote c [2014–2019] |
# detects/N | 86/ 1 230 | 1 169/ 1 230 | 1 053/ 1 230 | 89/ 120 | 401/ 1 230 | NR | 665/ 875 | NR | NR |
| ManitobaTable 2 Footnote c [2014–2019] |
Detection % | 7.0 | 95.0 | 85.6 | 74.2 | 32.6 | NR | 76.0 | NR | NR |
| ManitobaTable 2 Footnote c [2014–2019] |
Median | < DL | 18.2 | 22.1 | 0.50 | <DL | NR | 3.2 | NR | NR |
| ManitobaTable 2 Footnote c [2014–2019] |
MeanTable 2 Footnote a | 2.9 | 26.2 | 36.9 | 0.57 | 1.3 | NR | 4.6 | NR | NR |
| ManitobaTable 2 Footnote c [2014–2019] |
90th percentile | < DL | 51.4 | 75.6 | 0.50 | 2.8 | NR | 10.8 | NR | NR |
| New BrunswickTable 2 Footnote d [2014–2019] |
DL | 1–5 | 1–5 | 1–5.3 | 1–5 | 1–5 | NR | 1–5 | NR | NR |
| New BrunswickTable 2 Footnote d [2014–2019] |
# detects/N | 70/796 | 750/ 796 | 756/ 795 | 0/796 | 1/796 | NR | 126/ 796 | NR | NR |
| New BrunswickTable 2 Footnote d [2014–2019] |
Detection % | 8.8 | 94.2 | 95.1 | 0 | 0.1 | NR | 15.8 | NR | NR |
| New BrunswickTable 2 Footnote d [2014–2019] |
Median | < DL | 53.0 | 102.5 | < DL | < DL | NR | < DL | NR | NR |
| New BrunswickTable 2 Footnote d [2014–2019] |
MeanTable 2 Footnote a | 2.4 | 49.3 | 98.6 | < DL | 0.05 | NR | 1.3 | NR | NR |
| New BrunswickTable 2 Footnote d [2014–2019] |
90th percentile | 2.5 | 84.0 | 180.3 | < DL | < DL | NR | 2.5 | NR | NR |
| Newfoundland and LabradorTable 2 Footnote e [2004–2018] |
DL | 5 | 5 | 5 | 5 | 5 | NR | 5 | NR | NR |
| Newfoundland and LabradorTable 2 Footnote e [2004–2018] |
# detects/N | 4 183/ 13 856 | 11 111/ 13 856 | 11 000 / 13 856 | 57/ 13 856 | 360/ 13 856 | NR | 749/ 6 308 | NR | NR |
| Newfoundland and LabradorTable 2 Footnote e [2004–2018] |
Detection % | 30.2 | 80.2 | 79.4 | 0.4 | 2.6 | NR | 11.9 | NR | NR |
| Newfoundland and LabradorTable 2 Footnote e [2004–2018] |
Median | < DL | 33.0 | 37.8 | < DL | < DL | NR | < DL | NR | NR |
| Newfoundland and LabradorTable 2 Footnote e [2004–2018] |
MeanTable 2 Footnote a | 3.5 | 49.9 | 66.3 | 2.5 | 2.6 | NR | 2.9 | NR | NR |
| Newfoundland and LabradorTable 2 Footnote e [2004–2018] |
90th percentile | 6.3 | 120.0 | 160.0 | < DL | < DL | NR | 2.6 | NR | NR |
| Nova ScotiaTable 2 Footnote f [2014–2019] |
DL | 0.5–1.7 | 0.2–5 | 0.2–5 | 0.2–5 | 0.1–5 | NR | 0.2–1 | NR | NR |
| Nova ScotiaTable 2 Footnote f [2014–2019] |
# detects/N | 4/189 | 159/ 189 | 162/ 189 | 1/ 189 | 29/ 189 | NR | 75/189 | NR | NR |
| Nova ScotiaTable 2 Footnote f [2014–2019] |
Detection % | 2.1 | 84.1 | 85.7 | 0.5 | 15.3 | NR | 39.7 | NR | NR |
| Nova ScotiaTable 2 Footnote f [2014–2019] |
Median | < DL | 16.9 | 16.0 | < DL | < DL | NR | < DL | NR | NR |
| Nova ScotiaTable 2 Footnote f [2014–2019] |
MeanTable 2 Footnote a | 1.6 | 18.0 | 21.1 | 1.3 | 1.3 | NR | 2.2 | NR | NR |
| Nova ScotiaTable 2 Footnote f [2014–2019] |
90th percentile | < DL | 32.0 | 45.0 | < DL | 2.5 | NR | 3.1 | NR | NR |
| NunavutTable 2 Footnote g [2015–2018] |
DL | 5 | NR | 1 | 1 | 1 | NR | 1 | NR | NR |
| NunavutTable 2 Footnote g [2015–2018] |
# detects/N | 0/11 | 11/11 | 11/11 | 7/11 | 10/11 | NR | 10/11 | NR | NR |
| NunavutTable 2 Footnote g [2015–2018] |
Detection % | 0 | 100 | 100 | 63.6 | 90.9 | NR | 90.9 | NR | NR |
| NunavutTable 2 Footnote g [2015–2018] |
Median | < DL | 14.0 | 15.6 | 1.4 | 5.1 | NR | 12.0 | NR | NR |
| NunavutTable 2 Footnote g [2015–2018] |
MeanTable 2 Footnote a | < DL | 15.4 | 19.3 | 1.2 | 4.2 | NR | 11.2 | NR | NR |
| NunavutTable 2 Footnote g [2015–2018] |
90th percentile | < DL | 27.2 | 50.6 | 1.9 | 6.7 | NR | 19.4 | NR | NR |
| OntarioTable 2 Footnote h [2017–2019] |
DL | 0.3 | 0.3 | 0.75 | 0.15 | 0.3 | 0.3 | 0.15 | 0.15 | 0.3 |
| OntarioTable 2 Footnote h [2017–2019] |
# detects/N | 159/ 257 | 249/ 257 | 235/ 257 | 152/ 257 | 163/ 257 | 63/257 | 243/ 257 | 161/ 257 | 251/ 257 |
| OntarioTable 2 Footnote h [2017–2019] |
Detection % | 61.9 | 96.9 | 91.4 | 59.1 | 63.4 | 24.5 | 94.6 | 62.6 | 97.7 |
| OntarioTable 2 Footnote h [2017–2019] |
Median | 0.72 | 13.0 | 14.0 | 0.20 | 0.53 | < DL | 2.3 | 0.42 | 2.2 |
| OntarioTable 2 Footnote h [2017–2019] |
MeanTable 2 Footnote a | 1.1 | 16.6 | 18.5 | 0.26 | 0.75 | 0.29 | 2.8 | 0.68 | 2.9 |
| OntarioTable 2 Footnote h [2017–2019] |
90th percentile | 2.5 | 35.2 | 44.0 | 0.54 | 1.5 | 0.61 | 5.5 | 1.7 | 5.7 |
| Prince Edward IslandTable 2 Footnote i [2015–2018] |
DL | 1.7 | 0.2 | 0.2 | 0.3 | 0.1 | NR | 0.2 | NR | NR |
| Prince Edward IslandTable 2 Footnote i [2015–2018] |
# detects/N | 0/2 | 1/2 | 1/2 | 0/2 | 1/2 | NR | 1/2 | NR | NR |
| Prince Edward IslandTable 2 Footnote i [2015–2018] |
Detection % | 0 | 50 | 50 | 0 | 50 | NR | 50 | NR | NR |
| Prince Edward IslandTable 2 Footnote i [2015–2018] |
Median | < DL | NC | NC | < DL | NC | NR | NC | NR | NR |
| Prince Edward IslandTable 2 Footnote i [2015–2018] |
MeanTable 2 Footnote a | < DL | 1.4 | 0.2 | < DL | 0.83 | NR | 0.75 | NR | NR |
| Prince Edward IslandTable 2 Footnote i [2015–2018] |
90th percentile | < DL | NC | NC | < DL | NC | NR | NC | NR | NR |
| QuebecTable 2 Footnote j [2014–2018] |
DL | 1–6 | 0.5–3 | 0.6–6 | 0.7–6 | 0.5–6 | 0.5 | 0.6 | 0.5 | 0.5 |
| QuebecTable 2 Footnote j [2014–2018] |
# detects/N | 334/ 531 | 518/ 531 | 507/ 531 | 51/ 531 | 95/ 531 | 32/ 123 | 111/ 123 | 123/ 123 | 111/ 123 |
| QuebecTable 2 Footnote j [2014–2018] |
Detection % | 62.9 | 97.6 | 95.5 | 9.6 | 17.9 | 26.0 | 90.2 | 100 | 90.2 |
| QuebecTable 2 Footnote j [2014–2018] |
Median | 3.5 | 19.6 | 20.5 | < DL | < DL | < DL | 2.3 | 1.5 | 3.0 |
| QuebecTable 2 Footnote j [2014–2018] |
MeanTable 2 Footnote a | 7.0 | 32.4 | 35.8 | 3.0 | 3.1 | 18.3 | 5.3 | 8.5 | 6.6 |
| QuebecTable 2 Footnote j [2014–2018] |
90th percentile | 19.3 | 89.6 | 101.0 | < DL | 2.6 | 36.4 | 16.5 | 27.8 | 18.0 |
| SaskatchewanTable 2 Footnote k [2015–2018] |
DL | 0.5–10 | 0.5–10 | 0.5–5 | 1–5 | 0.5–5 | 0.5 | 0.5–10 | 0.5–1 | 0.5 |
| SaskatchewanTable 2 Footnote k [2015–2018] |
# detects/N | 115/ 1 747 | 1 597/ 1 740 | 1 564/ 1 723 | 329/ 1 578 | 665/ 1 723 | 1/26 | 1 261 / 1 549 | 27/43 | 26/26 |
| SaskatchewanTable 2 Footnote k [2015–2018] |
Detection % | 6.6 | 91.8 | 90.8 | 20.8 | 38.6 | 3.8 | 81.4 | 62.8 | 100 |
| SaskatchewanTable 2 Footnote k [2015–2018] |
Median | < DL | 16.0 | 14.0 | < DL | < DL | < DL | 3.0 | 1.7 | 9.5 |
| SaskatchewanTable 2 Footnote k [2015–2018] |
MeanTable 2 Footnote a | 2.95 | 22.9 | 22.5 | 1.4 | 2.1 | 1.0 | 4.8 | 2.7 | 11.0 |
| SaskatchewanTable 2 Footnote k [2015–2018] |
90th percentile | < DL | 48.0 | 49.0 | 2.5 | 4.4 | < DL | 10.0 | 6.1 | 22.1 |
BCAA – bromochloroacetic acid; BDCAA – bromodichloroacetic acid; CDBAA – chlorodibromoacetic acid; DBAA –dibromoacetic acid; DCAA – dichloroacetic acid; DL – detection limit; < DL – less than detection limit (if detection % < 10% then 90th percentile < DL; if detection % < 50% then median < DL); FNIHB – First Nations and Inuit Health Branch; MBAA – monobromoacetic acid; MCAA – monochloroacetic acid; N – sample size; NC – not calculated due to insufficient sample size; NR – not reported; TBAA – tribromoacetic acid; TCAA – trichloroacetic acid.
|
||||||||||
| Jurisdiction [sample collection timeframe] |
Parameter | HAA5Table 3 Footnote a (μg/L) |
HAA6Table 3 Footnote a (μg/L) |
HAA9Table 3 Footnote a (μg/L) |
|---|---|---|---|---|
| FNIHB AtlanticTable 3 Footnote d [2014–2018] |
DLTable 3 Footnote b | 5–10 | NR | NR |
| FNIHB AtlanticTable 3 Footnote d [2014–2018] |
# detects/N | 374/1 189 | NR | NR |
| FNIHB AtlanticTable 3 Footnote d [2014–2018] |
Detection % | 31.5 | NR | NR |
| FNIHB AtlanticTable 3 Footnote d [2014–2018] |
Median | < DL | NR | NR |
| FNIHB AtlanticTable 3 Footnote d [2014–2018] |
MeanTable 3 Footnote c | 14 | NR | NR |
| FNIHB AtlanticTable 3 Footnote d [2014–2018] |
90th percentile | 40 | NR | NR |
| FNIHB ManitobaTable 3 Footnote d [2014–2018] |
DLTable 3 Footnote d | 5.4–29 | NR | NR |
| FNIHB ManitobaTable 3 Footnote d [2014–2018] |
# detects/N | 202/267 | NR | NR |
| FNIHB ManitobaTable 3 Footnote d [2014–2018] |
Detection % | 75.7 | NR | NR |
| FNIHB ManitobaTable 3 Footnote d [2014–2018] |
Median | 41 | NR | NR |
| FNIHB ManitobaTable 3 Footnote d [2014–2018] |
MeanTable 3 Footnote c | 68 | NR | NR |
| FNIHB ManitobaTable 3 Footnote d [2014–2018] |
90th percentile | 158 | NR | NR |
| FNIHB OntarioTable 3 Footnote d [2014–2018] |
DLTable 3 Footnote b | 1.4–7.1 | 2–40 | NR |
| FNIHB OntarioTable 3 Footnote d [2014–2018] |
# detects/N | 248/317 | 1 612/1 876 | NR |
| FNIHB OntarioTable 3 Footnote d [2014–2018] |
Detection % | 78.2 | 85.9 | NR |
| FNIHB OntarioTable 3 Footnote d [2014–2018] |
Median | 29 | 33 | NR |
| FNIHB OntarioTable 3 Footnote d [2014–2018] |
MeanTable 3 Footnote c | 56 | 62 | NR |
| FNIHB OntarioTable 3 Footnote d [2014–2018] |
90th percentile | 126 | 157 | NR |
| ManitobaTable 3 Footnote e [2014–2019] |
DLTable 3 Footnote b | 5.4–6.4 | 5.5 | NR |
| ManitobaTable 3 Footnote e [2014–2019] |
# detects/N | 1 070/1 230 | 777/875 | NR |
| ManitobaTable 3 Footnote e [2014–2019] |
Detection % | 87.0 | 88.8 | NR |
| ManitobaTable 3 Footnote e [2014–2019] |
Median | 42.7 | 46.2 | NR |
| ManitobaTable 3 Footnote e [2014–2019] |
MeanTable 3 Footnote c | 64.7 | 60.5 | NR |
| ManitobaTable 3 Footnote e [2014–2019] |
90th percentile | 132.0 | 779.9 | NR |
| New BrunswickTable 3 Footnote f [2014–2019] |
DLTable 3 Footnote b | 2.2–10.5 | 2.5–11.6 | NR |
| New BrunswickTable 3 Footnote f [2014–2019] |
# detects/N | 754/796 | 754/796 | NR |
| New BrunswickTable 3 Footnote f [2014–2019] |
Detection % | 94.7 | 94.7 | NR |
| New BrunswickTable 3 Footnote f [2014–2019] |
Median | 158.0 | 158.0 | NR |
| New BrunswickTable 3 Footnote f [2014–2019] |
MeanTable 3 Footnote c | 148.5 | 148.8 | NR |
| New BrunswickTable 3 Footnote f [2014–2019] |
90th percentile | 264.3 | 265.1 | NR |
| Newfoundland and LabradorTable 3 Footnote g [2014–2019] |
DLTable 3 Footnote b | 5 | 5 | NR |
| Newfoundland and LabradorTable 3 Footnote g [2014–2019] |
# detects/N | 11 542/13 856 | 5 082/6 308 | NR |
| Newfoundland and LabradorTable 3 Footnote g [2014–2019] |
Detection % | 83.3 | 80.6 | NR |
| Newfoundland and LabradorTable 3 Footnote g [2014–2019] |
Median | 75.0 | 78.0 | NR |
| Newfoundland and LabradorTable 3 Footnote g [2014–2019] |
MeanTable 3 Footnote c | 117.7 | 120.4 | NR |
| Newfoundland and LabradorTable 3 Footnote g [2014–2019] |
90th percentile | 277.0 | 280.0 | NR |
| Nova ScotiaTable 3 Footnote h [2014–2019] |
DLTable 3 Footnote b | 4–10 | 1.8–12.3 | NR |
| Nova ScotiaTable 3 Footnote h [2014–2019] |
# detects/N | 491/764 | 159/189 | NR |
| Nova ScotiaTable 3 Footnote h [2014–2019] |
Detection % | 64.3 | 84.1 | NR |
| Nova ScotiaTable 3 Footnote h [2014–2019] |
Median | 24.0 | 37.0 | NR |
| Nova ScotiaTable 3 Footnote h [2014–2019] |
MeanTable 3 Footnote c | 28.8 | 37.0 | NR |
| Nova ScotiaTable 3 Footnote h [2014–2019] |
90th percentile | 67.0 | 77.0 | NR |
| NunavutTable 3 Footnote i [2015–2018] |
DLTable 3 Footnote b | 5.4 | 5.5–8.8 | NR |
| NunavutTable 3 Footnote i [2015–2018] |
# detects/N | 11/11 | 11/11 | NR |
| NunavutTable 3 Footnote i [2015–2018] |
Detection % | 100 | 100 | NR |
| NunavutTable 3 Footnote i [2015–2018] |
Median | 42.8 | 50.1 | NR |
| NunavutTable 3 Footnote i [2015–2018] |
MeanTable 3 Footnote c | 44.3 | 50.9 | NR |
| NunavutTable 3 Footnote i [2015–2018] |
90th percentile | 80.1 | 92.9 | NR |
| OntarioTable 3 Footnote j [2017–2019] |
DLTable 3 Footnote b | 1 | 0.94 | NR |
| OntarioTable 3 Footnote j [2017–2019] |
# detects/N | 10 713/10 720 | 251/257 | 251/257 |
| OntarioTable 3 Footnote j [2017–2019] |
Detection % | 99.9 | 97.7 | 97.7 |
| OntarioTable 3 Footnote j [2017–2019] |
Median | 8.0 | 32.4 | 37.2 |
| OntarioTable 3 Footnote j [2017–2019] |
MeanTable 3 Footnote c | 20.0 | 39.7 | 43.4 |
| OntarioTable 3 Footnote j [2017–2019] |
90th percentile | 51.8 | 83.6 | 88.4 |
| Prince Edward IslandTable 3 Footnote k [2015–2018] |
DLTable 3 Footnote b | 1.8 | 4 | NR |
| Prince Edward IslandTable 3 Footnote k [2015–2018] |
# detects/N | 1/2 | 1/2 | NR |
| Prince Edward IslandTable 3 Footnote k [2015–2018] |
Detection % | 50 | 50 | NR |
| Prince Edward IslandTable 3 Footnote k [2015–2018] |
Median | NC | NC | NR |
| Prince Edward IslandTable 3 Footnote k [2015–2018] |
MeanTable 3 Footnote c | 2.7 | 4.0 | NR |
| Prince Edward IslandTable 3 Footnote k [2015–2018] |
90th percentile | NC | NC | NR |
| QuebecTable 3 Footnote l [2014–2018] |
DLTable 3 Footnote b | 1.5–11.2 | 1.65 | 1.86 |
| QuebecTable 3 Footnote l [2014–2018] |
# detects/N | 520/531 | 123/123 | 123/123 |
| QuebecTable 3 Footnote l [2014–2018] |
Detection % | 97.9 | 100 | 100 |
| QuebecTable 3 Footnote l [2014–2018] |
Median | 48.4 | 20.5 | 28.9 |
| QuebecTable 3 Footnote l [2014–2018] |
MeanTable 3 Footnote c | 78.4 | 30.6 | 63.6 |
| QuebecTable 3 Footnote l [2014–2018] |
90th percentile | 214.2 | 81.9 | 165.9 |
| SaskatchewanTable 3 Footnote m [2015–2018] |
DLTable 3 Footnote b | 5.2–10.5 | 7.14 | 7.19 |
| SaskatchewanTable 3 Footnote m [2015–2018] |
# detects/N | 1 444/1 577 | 26/26 | 26/26 |
| SaskatchewanTable 3 Footnote m [2015–2018] |
Detection % | 91.6 | 100 | 100 |
| SaskatchewanTable 3 Footnote m [2015–2018] |
Median | 33.0 | 145.0 | 158.6 |
| SaskatchewanTable 3 Footnote m [2015–2018] |
MeanTable 3 Footnote c | 49.3 | 138.3 | 151.6 |
| SaskatchewanTable 3 Footnote m [2015–2018] |
90th percentile | 102.1 | 204.7 | 211.4 |
DL – detection limit; FNIHB – First Nations and Inuit Health Branch; HAA5 – sum of monochloroacetic acid, dichloroacetic acid, trichloroacetic acid, monobromoacetic acid and dibromoacetic acid; HAA6 – sum of HAA5 and bromochloroacetic acid; HAA9 – sum of HAA6 and tribromoacetic acid, chlorodibromoacetic acid, bromodichloroacetic acid; N – sample size; NC – not calculated due to insufficient sample size; NR – not reported.
|
||||
| Water Source | Parameter | MCAA (μg/L) |
DCAA (μg/L) |
TCAA (μg/L) |
MBAA (μg/L) |
DBAA (μg/L) |
TBAA (μg/L) |
BCAA (μg/L) |
CDBAA (μg/L) |
BDCAA (μg/L) |
|---|---|---|---|---|---|---|---|---|---|---|
| N/A | DL | 0.9 | 0.83 | 0.69 | 0.91 | 0.79 | 2.84 | 1.14 | 1.22 | 0.65 |
| Lake water | # detects/N | 69/111 | 109/111 | 111/111 | 2/111 | 16/111 | 0/111 | 58/111 | 13/111 | 70/111 |
| Lake water | Detection % | 62.2 | 98.2 | 100 | 1.8 | 14.4 | 0 | 52.3 | 11.7 | 63.1 |
| Lake water | Median | 1.4 | 18.1 | 16.6 | < DL | < DL | < DL | 1.3 | < DL | 1.3 |
| Lake water | MeanTable 4 Footnote 1 | 1.8 | 23.0 | 20.8 | 0.47 | 0.9 | < DL | 1.4 | 0.8 | 2.1 |
| Lake water | 90th percentile | 3.9 | 44.8 | 42.6 | < DL | 2.9 | < DL | 8.3 | 1.6 | 5.7 |
| River water | # detects/N | 85/151 | 151/151 | 151/151 | 0/151 | 24/151 | 0/151 | 87/151 | 4/151 | 82/151 |
| River water | Detection % | 56.3 | 100 | 100 | 0 | 15.9 | 0 | 57.6 | 2.6 | 54.3 |
| River water | Median | 1.5 | 15.2 | 9.4 | < DL | 0.40 | < DL | 1.4 | < DL | 0.9 |
| River water | MeanTable 4 Footnote 1 | 1.8 | 24.0 | 19.8 | < DL | 0.56 | < DL | 2.8 | 0.7 | 2.4 |
| River water | 90th percentile | 3.8 | 37.7 | 43.6 | < DL | 1.1 | < DL | 8.6 | < DL | 8.7 |
| Well water | # detects/N | 5/107 | 63/107 | 52/107 | 0/107 | 33/107 | 0/107 | 22/107 | 5/107 | 18/107 |
| Well water | Detection % | 4.7 | 58.9 | 48.6 | 0 | 30.8 | 0 | 20.6 | 4.7 | 16.8 |
| Well water | Median | < DL | 1.6 | 0.4 | < DL | < DL | < DL | < DL | < DL | < DL |
| Well water | MeanTable 4 Footnote 1 | 0.5 | 2.9 | 2.2 | < DL | 0.9 | < DL | 1.2 | 0.9 | 1.4 |
| Well water | 90th percentile | < DL | 6.2 | 4.7 | < DL | 1.7 | < DL | 2.0 | < DL | 1.4 |
BCAA – bromochloroacetic acid; BDCAA – bromodichloroacetic acid; CDBAA – chlorodibromoacetic acid; DBAA – dibromoacetic acid; DCAA – dichloroacetic acid; DL – detection limit; < DL – less than detection limit (if detection % < 10% then 90th percentile < DL; if detection % < 50% then median < DL); MBAA – monobromoacetic acid; MCAA – monochloroacetic acid; N – sample size; N/A – not applicable; TBAA – tribromoacetic acid; TCAA – trichloroacetic acid. Source: Health Canada (2017).
|
||||||||||
| Water Source | Parameter | HAA5Table 5 Footnote a (μg/L) |
HAA6Table 5 Footnote a (μg/L) |
HAA9Table 5 Footnote a (μg/L) |
|---|---|---|---|---|
N/A |
1.85 |
2.17 |
3.83 |
|
Lake water |
# detects/N |
111/111 |
111/111 |
111/111 |
Lake water |
Detection % |
100 |
100 |
100 |
Lake water |
Median |
33.6 |
37.4 |
39.1 |
Lake water |
45.9 |
48.5 |
50.7 |
|
Lake water |
90th percentile |
88.7 |
93.2 |
95.1 |
River water |
# detects/N |
150/151 |
150/151 |
149/151 |
River water |
Detection % |
99.3 |
99.3 |
98.7 |
River water |
Median |
27.1 |
27.8 |
28.3 |
River water |
45.6 |
48.1 |
50.4 |
|
River water |
90th percentile |
107.5 |
118.5 |
124.1 |
Well water |
# detects/N |
61/107 |
58/107 |
43/107 |
Well water |
Detection % |
57.0 |
54.2 |
40.2 |
Well water |
Median |
2.3 |
2.5 |
1.9 |
Well water |
5.6 |
6.4 |
9.3 |
|
Well water |
90th percentile |
12.0 |
15.2 |
16.6 |
DL – detection limit; FNIHB – First Nations and Inuit Health Branch; HAA5 – sum of monochloroacetic acid, dichloroacetic acid, trichloroacetic acid, monobromoacetic acid and dibromoacetic acid; HAA6 – sum of HAA5 and bromochloroacetic acid; HAA9 – sum of HAA6 and tribromoacetic acid, chlorodibromoacetic acid, bromodichloroacetic acid; N – sample size; N/A – not applicable. Source: Health Canada (2017).
|
||||
To compare HAA formation in distribution systems from surface water versus groundwater sources, data from different sources were analyzed. These datasets include three national surveys (Appendix C, Table C1) and data from Newfoundland and Labrador and Ontario (Appendix C, Table C2). Generally, it was found that:
- DCAA and TCAA are higher with a surface water supply.
- TBAA, CDBAA and BDCAA had similar levels between ground and surface waters.
- DBAA and BCAA are slightly higher in groundwater.
- Overall, surface water sources resulted in higher HAA5 and HAA6 concentrations and occurrence than groundwater.
Using the NDWS dataset, data was paired for treated water and at a point farthest from the treatment plant (samples taken on same day). These data were then separated for summer and winter (Appendix C, Table C3). These results showed that:
- MCAA, DCAA, TCAA, BCAA and BDCAA concentrations were higher for distributed than treated water.
- MCAA, DCAA, TCAA, BCAA and BDCAA concentrations were higher in summer than winter.
- MBAA, TBAA, DBAA and CDBAA concentrations had little change seasonally or between treated and distributed water.
- Total HAA concentrations were higher in distributed water than treated water regardless of season.
A similar pairing was done for the Quebec data, comparing the centre to the extremity of the distribution system (Appendix C, Table C4) and the Ontario data, comparing treated and distributed water (Appendix C, Table C5). The Quebec dataset did not show a big difference in HAA concentrations between the middle of the distribution system and the extremity. The Ontario dataset generally showed higher HAA concentration in the distribution system than in treated water.
Water supply systems in Newfoundland and Labrador were studied to evaluate the impacts of source water and treatment plant size based on population served (≤ 100; 101–250; 251–500; 501–1000; 1001–3000; 3001–5000; 5001–10 000; and 10 000+). This study took place over an 18-year period (1999 to 2016) (Chowdhury, 2018). For all systems, regardless of size, those using surface water had higher mean HAA5 concentrations than those using groundwater (Appendix C, Table C6). The mean HAA5 concentration was generally highest for smaller systems.
A study evaluating HAA5 and bromide concentrations in the United States showed that, overall, there has not been a significant change in HAA5 concentrations since 2004. However, the extremely high concentrations, represented by 95th percentiles, have been decreasing over time (Westerhoff et al., 2022). At some water treatment systems, seasonal changes in bromide were noted. Generally, these changes were more prevalent in surface source waters from rivers. Bromide concentrations were found to be higher during periods of lower streamflow. Bromide incorporation into DBPs has been variable with no statistical temporal trends. Groundwater sources tend to have higher Br-HAAs.
I-HAAs were measured as part of the NDWS of Disinfection By-Products and Selected Emerging Contaminants. Out of 369 samples, zero samples had any detectable level of any of the I-HAAs (Health Canada, 2017). Concentrations of two I-HAAs were measured in chloraminated and chlorinated drinking waters from 23 cities in Canada and the United States in 2005–2006 (Richardson et al., 2008). MIAA and BIAA were found at most treatment plants with maximum concentrations of 1.7 μg/L and 1.4 μg/L, respectively. Quebec and Ontario also provided some I-HAA data. Quebec had a total of 123 samples collected in 2014–2016, of which there were no detects for BIAA. For MIAA, there was one detect of 0.9 μg/L; for CIAA, there were five detects with a maximum of 0.9 μg/L; and for DIAA, there were three detects with a maximum of 0.7 μg/L (Ministère du Développement durable, de l’Environnement et de la Lutte contre les changements climatiques du Québec, 2019). MIAA was reported within the Ontario data and had no detects for 244 samples (Ontario Ministry of the Environment, Conservation and Parks, 2019).
Other – Swimming pools, spas, and food: Exposure to HAAs may occur in swimming pools and spas where chlorine, used for disinfection, reacts with organic matter (for example, sweat, hair, skin, lotions) present in the water (Kim et al., 2002; NTP, 2018). Mean concentrations for HAA9 were 412.9 µg/L (364 µg/L in summer months) in 15 indoor pools and 807.6 µg/L in 39 outdoor pools. DCAA and TCAA were the most prevalent HAAs, accounting for almost 93% of the HAAs measured (Simard et al., 2013). However, due to the physicochemical properties of HAAs (moderate vapour pressure and high polarity), inhalation and dermal exposure in swimming pools is expected to be minor (Savitz, 2012; NTP, 2018). Accidental ingestion of the water could contribute to HAA exposure.
HAAs have been detected in food due to the use of chlorine-based disinfectants in the food industry, along with preparing food with treated water during cooking (U.S. EPA, 1998; Cardador and Gallego, 2012, 2015, 2016, 2017, 2018; Lee et al., 2018, 2019). In general, DCAA and TCAA were the most prominent HAAs (or only HAAs) detected. In canned vegetables, MIAA was detected occasionally due to the use of iodized salts in the brine solution (Becalski et al., 2006; Cardador and Gallego, 2017). The United States Environmental Protection Agency (U.S. EPA, 1998) investigated the extent of HAA adsorption to food during cooking. Using water spiked with high concentrations of HAAs (50–500 ppb each), more than 60% of HAAs in the cooking water were taken up by the food in some cases. MBAA, DCAA, BCAA and DBAA showed the highest levels of uptake, while CDBAA and TBAA were not detected in the majority of foods after cooking.
2.0 Health considerations
2.1 Kinetics
Kinetic information for human health considerations is largely based on rodent data and some human data.
Oral absorption: HAAs are rapidly absorbed and distributed following oral exposure, as expected for small hydrophilic compounds (NTP, 2018; OEHHA, 2022). More than 99.99% of HAA5 exists as the dissociated carboxylate anions at a pH range of 6.8–8.5, which is typical for biological tissues (OEHHA, 2022). However, HAA5 becomes the corresponding acetate after it leaves the stomach (OEHHA, 2022). Structural features that have an effect on the distribution of HAAs include the substitution of a halogen for a hydrogen and the degree of bromine substitution (Schultz et al., 1999). HAAs generally are highly metabolized, except for TCAA, and are primarily eliminated from the body via urine (NTP, 2018; OEHHA, 2022). Information on the absorption, distribution, metabolism and elimination of mono-, di-, and tri-HAAs as classes can be found in Table 6 while this information for individual HAAs is in Table 7. As a group, HAAs are corrosive to tissues at high concentrations due to their acidic properties with the mono-substituted acids being weaker acids than the tri-substituted acids (Table 1 for Phys/chem, pKa values). No kinetic data were found for DIAA, CIAA and BIAA.
When exposed to a mixture of HAAs rather than a single dose, an increase in metabolism and/or reduced renal clearance may result, suggesting competitive interactions between HAAs (Saghir and Schultz, 2005; NTP, 2018). Pre-treatment with DCAA or TCAA may alter the metabolism and clearance of BDCAA, DCAA and BCAA (Austin and Bull, 1997; Barton et al., 1999; Gonzalez-Leon et al., 1999; Schultz and Sylvester, 2001; Saghir and Schultz, 2002, 2005). See Section 2.4 Mode of action (MOA) for further information on cellular regulation of metabolism.
Dermal and inhalation absorption: The daily dermal absorption of HAAs (MCAA, DCAA, TCAA, MBAA, DBAA) from bathing activities was determined to be an insignificant percentage of daily ingestion doses (around 0.01%–0.04%; steady-state permeability through the skin was very low 1.1 × 10⁻³ to 2.6 × 10⁻³ cm/h [Xu et al., 2002]). Shower-generated airborne particulate HAA concentrations (MCAA, DCAA, TCAA, MBAA, DBAA, and BCAA) ranged from 4.25 ± 1.95 µg/m3 (BCAA) to 9.98 ± 4.58 µg/m3 (MCAA) for a 10-minute shower with water HAA concentrations of 250 µg/L. This level of HAAs during showers was concluded to represent less than 0.5% of the ingestion dose (Xu and Weisel, 2003). Thus, dermal and inhalation exposure of HAAs is not expected to contribute significantly to overall exposure.
| HAA | Absorption | Distribution | Metabolism | Elimination | References |
|---|---|---|---|---|---|
Mono-HAAs |
Rats: rapidly absorbed via oral ingestion. |
Rats: rapid distribution; MCAA and MIAA distribute to organs rich in sulfhydryl groups. |
Rats: rapid metabolism. |
Rats: rapid elimination. |
Thomassen and Leicester, 1951; Hayes et al., 1973; Bhat et al., 1990; Kaphalia et al., 1992; Schultz et al., 1999; Saghir and Schultz, 2005 |
Di-HAAs |
OverallTable 6 Footnote a: rapidly absorbed via oral ingestion. |
Rats: rapid equilibrium between plasma and tissues. Plasma protein binding 6%–11%. Apparent volume of distribution not significantly different among di-HAAs. Rapid log-linear decline in blood concentrations to below LoD within 12 h. |
OverallTable 6 Footnote a: GST-ζ metabolism in cytosol to glyoxylic acid (BCAA > DCAA > DBAA). Reductive dehalogenation to mono-HAAs is a minor pathway. Ultimate metabolites are glyoxylic acid, glycolic acid, oxalic acids, glycine and carbon dioxide. RodentsTable 6 Footnote b: high metabolism DCAA, BCAA, DBAA irreversibly inhibit GST-ζ. |
RodentsTable 6 Footnote b: low amounts of parent compounds in urine. Rats: low renal clearance; urinary excretion of di-HAAs is controlled by tubular reabsorption. |
Larson and Bull, 1992; Lin et al., 1993; Xu et al., 1995; Gonzalez-Leon et al. 1997; Yan et al., 1997; James et al., 1997, 1998; Tong et al., 1998a and 1998b; Cornett et al., 1999; Schultz et al., 1999; Anderson et al. 1999; Tzeng et al., 2000; Schultz and Sylvester, 2001; Saghir and Schultz, 2005; NTP, 2018 |
Tri-HAAs |
OverallTable 6 Footnote a: rapidly absorbed via oral ingestion. |
Rats: rapid equilibrium between plasma and tissues. Plasma protein binding 50% to 80%. Blood: plasma ratio 0.66–0.82. Maximum blood concentrations ~1.5–6 times greater for tri-HAAs than corresponding di-HAAs. Vd in rats not significantly different among tri-HAAs. Rapid log-linear decline in blood concentrations to below LoD within 12 h (except TCAA). |
OverallTable 6 Footnote a: P450 metabolism in microsomes to dihaloacetic acid via dihaloacetic radical. TCAA is the least metabolized HAA. In vitro: rapidly metabolized by liver microsomes; rate of metabolism directly proportional with number of bromines (that is, TBAA > CDBAA > BDCAA). RodentsTable 6 Footnote b: ultimate metabolites glyoxylic acid, glycolic acid, oxalic acids, glycine and carbon dioxide. |
Rats: moderate to high renal clearance for brominated tri-HAAs; moderate renal clearance for TCAA. Urinary excretion of tri-HAAs is controlled by tubular secretion. |
Paykoc and Powell, 1945; Hobara et al., 1988; Styles et al., 1991; Larson and Bull, 1992; Xu et al., 1995; Schultz et al., 1999; Merdink et al., 2000; Yu et al., 2000; Saghir and Schultz, 2005; Saghir et al., 2011 |
Di-HAAs – includes dichloroacetic acid (DCAA), dibromoacetic acid (DBAA) and bromochloroacetic acid (BCAA); GST-ζ – glutathione S-transferase zeta; h – hour; LoD – limit of detection; Mono-HAAs – includes monochloroacetic acid (MCAA) and monobromoacetic acid (MBAA), distribution data also includes monoiodoacetic acid (MIAA); Tri-HAAs: includes trichloroacetic acid (TCAA), tribromoacetic acid (TBAA), chlorodibromoacetic acid (CDBAA) and bromodichloroacetic acid (BDCAA); Vd – volume of distribution. Adapted from NTP (2018).
|
|||||
| HAATable 7 Footnote a | Absorption | Distribution | Metabolism | Elimination | References |
|---|---|---|---|---|---|
MCAA |
Rats: rapidly absorbed via oral ingestion. |
Rats: rapidly distributed to organs rich in sulfhydryl groups such as liver and kidneys; distributed to the intestinal tract, thymus, brown and white fat, spleen, testes, lungs, brain and heart; rapid equilibrium between plasma and tissues. |
Rats: hepatic first pass metabolism follows oral exposure. Mice: glutathione conjugation-mediated pathway produces two major urinary metabolites (S-carboxymethylcysteine and thiodiacetic acid). Glycolic acid and oxalic acid are minor metabolites produced in an independent pathway. |
Rats: 64%–90% excreted via urine. Mice: 82%–88% excreted via urine, 8% as carbon dioxide and 0.2%–3% via feces. |
Yllner, 1971; Hayes et al., 1973; Daniel et al., 1991; Kaphalia et al., 1992; Schultz et al., 1999; Saghir et al., 2001; Saghir and Rozman, 2003; Saghir and Schultz, 2005 |
DCAA |
Humans: variable from 27% to 100%. Rats: 81% bioavailability, mean absorption time: 4.5 h; Tmax: 8.0 h. |
Humans: minimally binds to plasma proteins. Rats: Highest concentrations found in liver, muscle, skin, blood and intestines. Complex concentration-time profile with multiple peaks. Vd = 618 mL/kg Mice: Vd = 548, 497 mL/kg; tissues: blood partitions ranged from 0.37 (muscle) to 1.08 (liver). |
OverallTable 7 Footnote b: glutathione conjugation-mediated pathway catalyzed by GST-ζ. Relative rates: mice > rats > humans. Metabolites include MCAA, glyoxylic acid, oxalic acid, glycolate, glycine and carbon dioxide. Inhibits GST-ζ activity (that is, inhibits its own metabolism). Humans: human GST-ζ more resistant to inhibition than rodent or dog GST-ζ; adults experience a five-fold greater metabolic inhibition compared to young subjects. |
OverallTable 7 Footnote b: only a small fraction of the parent compound (1%–20%) was recovered in urine. Humans: large interindividual variations in clearance may be due to GST-ζ polymorphisms. Plasma half-life after intravenous dose (10 or 20 mg/kg): 20–36 minutes. RodentsTable 7 Footnote c: mainly excreted via urine, with 17%–46% excreted as carbon dioxide and 0.01%–2% via feces. t1/2 in rats: 2.40 h. |
Lukas et al., 1980; Larson and Bull, 1992; Lin et al., 1993; Abbas and Fisher, 1997; Gonzalez-Leon et al., 1997, 1999; Yan et al., 1997; James et al., 1998; Tong et al., 1998a, 1998b; Anderson et al., 1999; Cornett et al., 1999; Kim et al., 1999; Schultz et al., 1999; Tzeng et al., 2000; Schultz et al., 2002; Saghir and Schultz, 2002, 2005; Board and Anders, 2005, 2011; Jia et al., 2006; Schultz and Shangraw, 2006; Maisenbacher et al., 2013 |
TCAA |
Rats: ~100% bioavailability; mean absorption time: 6 h; Tmax: 1.55 h. |
Humans: volume of distribution lower than in rodents, possibly due to greater plasma protein binding (75%–87%) in humans. Rats: blood levels still detectable after 24 h. 39%–54% Bound to plasma proteins. Vd = 782 mL/kg. Mice: 19%–57% bound to plasma proteins. Vd = 571 mL/kg; tissues: blood partitions ranged from 0.54 (lungs) to 1.18 (liver). |
OverallTable 7 Footnote b: least metabolized HAA in humans and animals with 45%–84% excreted unchanged in the urine. RodentsTable 7 Footnote c: primary metabolic route is reductive dechlorination of TCAA to DCAA. |
Humans: urinary clearance half-life 2.1–6.3 days; clearance slower than in rats and mice; 75%–93% excreted unchanged in urine. Rats: 50%–58% recovered unchanged in urine; t1/2: 8.0 h. Mice: 45%–84% recovered unchanged in urine. |
Paykoc and Powell, 1945; Larson and Bull, 1992; Allen and Fischer, 1993; Templin et al., 1993, 1995; Xu et al., 1995; Abbas and Fisher, 1997; Gonzalez-Leon et al., 1999; Schultz et al., 1999; Yu et al., 2000; Lumpkin et al., 2003; Bader et al., 2004 |
MBAA |
Rats: rapid absorption. |
Rats: rapid distribution (not detected in plasma 1 minute after oral dose). |
Rats: rapid metabolism (not detected in plasma 1 minute after oral dose). |
Rats: rapid elimination (not detected in plasma 1 minute after oral dose). |
Saghir and Schultz, 2005 |
DBAA |
Rats: 30% bioavailability; mean absorption time: 1.2 h; Tmax: 1.0 h. |
Rats: detectable levels measured in testicular interstitial fluid, parental and fetal plasma, placental tissue, amniotic fluid and maternal milk. Does not bioaccumulate or bind significantly to plasma proteins. Vd = 400 mL/kg |
OverallTable 7 Footnote b: not thoroughly investigated; however, proposed to be metabolized in a similar manner to DCAA. Currently unknown if toxicological effects are due to parent compound or active metabolite. Inhibits GST-ζ activity (that is, inhibits its own metabolism), which may indicate that repression of tyrosine degradation may be involved in the toxicity of brominated HAAs. |
Rats: rapidly cleared from the blood due to biotransformation. Small fraction (3%) of parent compound accounts for total clearance; negligible amounts recovered in feces. t1/2: 0.72 h. |
Anderson et al., 1999; Schultz et al., 1999; Christian et al., 2001; Holmes et al., 2001; U.S. EPA, 2005 |
TBAA |
Rats: 62% bioavailability; mean absorption time: 1.1 h; Tmax: 0.94 h. |
Rats: distributes uniformly outside the vascular system and has a low tendency to accumulate in peripheral tissues. Binds significantly to plasma proteins. Vd = 449 mL/kg |
In vitro: rapidly metabolized by liver microsomes; predominant metabolite was DBAA, corresponding to the loss of a bromine atom. |
Rats: 31% of parent compound accounts for total clearance. t1/2: 0.58 h. |
Schultz et al., 1999; Saghir et al., 2011 |
BCAA |
Rats: 47% bioavailability; mean absorption time: 1.2 h; Tmax: 1.5 h. |
Rats: distributes uniformly outside the vascular system and has a low tendency to accumulate in peripheral tissues; does not bind significantly to plasma proteins. Vd = 881 mL/kg |
OverallTable 7 Footnote b: not thoroughly investigated; however, proposed to be metabolized in a similar manner to DCAA. Currently unknown if toxicological effects are due to parent compound or active metabolite. Inhibits GST-ζ activity (that is, inhibits its own metabolism), which may indicate that repression of tyrosine degradation may be involved in the toxicity of brominated HAAs. In vitro: Rate of metabolism is stereospecific (metabolism more rapid for (–)-BCAA compared with (+)-BCAA). |
Rats: rapidly cleared from the blood due to biotransformation. Small fraction (2%) of parent compound accounts for total clearance; negligible amounts recovered in feces. t1/2: 3.93 h. |
Anderson et al., 1999; Schultz et al., 1999; Schultz and Sylvester, 2001; U.S. EPA, 2005 |
CDBAA |
Rats: ~100% bioavailability; mean absorption time: 1.7 h; Tmax: 0.73 h. |
Rats: distributes uniformly outside the vascular system and has a low tendency to accumulate in peripheral tissues. Binds significantly to plasma proteins. Vd = 636 mL/kg |
In vitro: rapidly metabolized by liver microsomes; predominant metabolite was BCAA, corresponding to the loss of a bromine atom. |
Rats: 60% of parent compound accounts for total clearance. t1/2: 1.26 h. |
Schultz et al., 1999; Saghir et al., 2011 |
BDCAA |
Rats: 96% bioavailability; mean absorption time: 0.7 h; Tmax: 1.10 h. Mice: 28%–73% bioavailability. |
Rats: distributes uniformly outside the vascular system and has a low tendency to accumulate in peripheral tissues. Binds significantly to plasma proteins. Vd = 730 mL/kg
Mice: Vd = 518 mL/kg |
RodentsTable 7 Footnote c: greater rate of metabolism in mice compared with rats. In vitro: greater rate of metabolism in mice compared with rats corresponding to the loss of a bromine atom. Mice: oxalate was a major metabolite; glycolate, glyoxylate and DCAA were minor metabolites. Limited evidence for the direct decarboxylation of BDCAA to form carbon dioxide and a THM. |
RodentsTable 7 Footnote c: urinary excretion higher in rats than mice, likely due to more efficient renal tubular reabsorption and greater rate of metabolism in mice. Rats: 49% of parent compound accounts for total clearance. t1/2: 1.85 h. Mice: 2.4% eliminated unchanged in urine, 50% as urinary metabolites, 30% as carbon dioxide and 10% in feces. Total body clearance: 156–220 mL/h/kg. t1/2: 1.4 h. |
Xu et al., 1995; Austin and Bull 1997; Schultz et al., 1999; Merdink et al., 2001; Saghir et al., 2011 |
MIAA |
ND |
Rats: distributed rapidly to organs rich in sulfhydryl groups such as thyroid and liver. |
ND |
ND |
Thomassen and Leicester, 1951; Hayes et al., 1973 |
BCAA – bromochloroacetic acid; BDCAA – bromodichloroacetic acid; BIAA – bromoiodoacetic acid; CDBAA – chlorodibromoacetic acid; CIAA – chloroiodoacetic acid; DBAA – dibrimoacetic acid; DCAA – dichloroacetic acid; DIAA – diiodoacetic acid; GST-ζ – glutathione S-transferase zeta; h – hour(s); MBAA – monobromoacetic acid; MCAA – monochloroacetic acid; MIAA – monoiodoacetic acid; ND – no data; t1/2 – half-life; TBAA – tribromoacetic acid; TCAA – trichloroacetic acid; THM – trihalomethane; Tmax – time to peak concentration; Vd – steady-state apparent volume of distribution, calculated as the amount of HAA in the body divided by the concentration of HAA in the plasma, using the time point where the net flux of the HAA between central and peripheral compartments is 0. Adapted from NTP (2018).
|
|||||
2.1.1 Physiologically based pharmacokinetic (PBPK) modelling
PBPK models use kinetic data to reduce uncertainties with intraspecies, interspecies and high-to-low dose extrapolations for risk assessment. PBPK models are available for humans and mice for both DCAA and TCAA and a rat model is available for DBAA. No PBPK models have been reported for the other HAAs. Due to limitations in the available models, they cannot be used at this time to reduce uncertainty in the risk assessments.
While the DCAA models account for its metabolism by glutathione S-transferase zeta (GST-ζ) and the inhibitory effect of DCAA on its own metabolism (Barton et al., 1999; Keys et al., 2004; Li et al., 2008b), their limitations (as reported by OEHHA, 2022) include:
- Low-dose data could not be fit to the mouse model (Barton et al., 1999); the model may inadequately predict internal doses at the low-dose range.
- Limited validation studies and inter/intra species differences (especially age differences) in DCAA’s self-inhibition of its metabolism, which was not accounted for in the mouse and rat model (Keys et al., 2004).
- While Li et al. (2008) extends the Keys et al. (2004) model to humans, the models do not include metabolites (uncertainty remains about whether parent or a metabolite is key for toxicity). Also, neither human nor mouse PBPK models account for age-dependent differences in metabolic self-inhibition; these differences could lead to increased uncertainty.
Further studies on the metabolism of DCAA as well as intra- and inter-species differences are needed to enhance the current PBPK models.
TCAA is included as a metabolite in the PBPK model for perchloroethylene in mice, rats and humans (Chiu and Ginsberg, 2011). While this model also considers DCAA, DCAA is directly excreted to urine without distribution to other tissues; thus, it is not suitable for modelling of DCAA kinetics. Further, the human module of the PBPK model cannot be calibrated or validated due to the lack of human oral TCAA exposure studies. Additionally, the TCAA PBPK model does not account for TCAA metabolism. Older PBPK models for perchloroethylene and trichloroethylene (from which TCAA is formed) are published but have the same limitations as the Chiu and Ginsberg (2011) model. Future studies on the human bioavailability of TCAA and metabolism of TCAA are necessary for the future use of PBPK modelling in the risk assessment of TCAA.
The complex PBPK model for DBAA in rats includes hepatic DBAA metabolism with self-inhibition by GST-ζ and its metabolites glyoxylate and oxalate (Matthews et al., 2010). In total, 12 parameters were calibrated in the model; however, for some parameters, DCAA values are used instead of DBAA and the metabolism followed a sequential irreversible scheme and not a Michaelis-Menten type of reaction. Nevertheless, the model predicted the observed DBAA blood concentration.
2.2 Effects in humans
Epidemiology studies evaluated the association between human exposure to HAAs in drinking water and cancer, as well as reproductive or developmental outcomes (Appendix D). However, with the potential co-exposure to numerous DBPs in drinking water, it is challenging to assign causation to any single component. No epidemiological studies investigating exposure to I-HAAs or the genotoxicity of HAAs were identified. Interestingly, DCAA has been used to treat inherited mitochondrial disorders and tumors through its ability to alter cellular energy metabolism; the main clinically limiting toxicity is reversible peripheral neuropathy (James et al., 2017).
2.2.1 Carcinogenicity
The International Agency for Research on Cancer (IARC, 2014) and the National Toxicology Program (NTP, 2018) considered the limited epidemiological data inadequate to evaluate the relationship between HAA exposure and cancer in humans. Only three studies examined associations between human exposure to HAAs in drinking water with carcinogenicity (Appendix D). The plausible associations with rectal and endometrial cancer require further study of exposure levels and replication in other populations (Jones et al., 2019; Medgyesi et al., 2022). No association was found with kidney cancer (Jones et al., 2017). In 2021, the NTP declared DCAA, DBAA, BCAA, TBAA, BDCAA and CDBAA as “reasonably anticipated to be a human carcinogen,” based on sufficient evidence of carcinogenicity from experimental animal studies and supporting evidence from mechanistic studies that demonstrated biological plausibility of carcinogenicity in humans (NTP, 2021).
2.2.2 Reproductive and developmental
Overall, the studies on reproductive and developmental outcomes associated with human exposure to HAAs are mixed (Appendix D).
Reproductive outcomes: 3/6 identified studies found an association with HAA exposure.
- Reduced sperm quality: 2 studies found an association with TCAA and DCAA exposure in the Chinese cohort; 2 other studies [American and Chinese cohort] did not find an association
- Fertilization: 1 Chinese study found an association with DCAA exposure while 1 American study found no association with HAAs
Developmental outcomes: 6/21 identified studies found a potential association with HAA exposure.
- Fetal growth: 3 studies found an association with HAAs; 10 studies found no association
- Defects: 2/4 studies found an association with HAAs (TCAA and DCAA)
- Pregnancy loss: 1 study each found no association, inconsistent response, or positive association (in high DCAA exposure and HAA5 groups)
- Hypospadias: No association with HAAs (two studies)
Published reviews of the evidence for an association between human exposure to HAAs through drinking water and reproductive or developmental outcomes are also mixed. An association between maternal exposure to drinking water DBPs and adverse pregnancy outcomes was reported in 38%–40% of studies reviewed (Grellier et al., 2010; Mashau et al., 2018). For higher HAA exposure categories, a slightly positive association with adverse pregnancy outcomes was found–small for gestational age (SGA) was reported (Mashau et al., 2018). The State of California’s Office of Environmental Health Hazard Assessment (OEHHA) also concluded that the epidemiologic evidence is mixed, with five studies reporting modest but inconsistent evidence of an association with any individual HAA and four studies reporting no associations (OEHHA, 2022). A meta-analysis of the epidemiological data reported an increased risk for SGA with exposure to HAA5 (odds ratio [OR] = 1.12; 95% confidence interval [CI]: 1.01, 1.25), DCAA (OR = 1.25; 95% CI: 1.01, 1.41) and TCAA (OR = 1.21; 95% CI: 1.07, 1.37) that was statistically significant only after a study was removed post-heterogeneity analysis (Summerhayes et al., 2021).
Given the difficulties in differentiating the specific human outcomes of HAA exposure from other DBPs and the limited dose-response data, the epidemiologic data is not sufficient for quantitative risk assessment for HAAs at this time (Appendix D for individual study notes).
2.3 Effects in animals
Overall, the database for oral toxicity of HAAs in experimental animals is extensive (Appendix E). However, the completeness of the database for individual HAAs varies considerably. The available studies showed that the toxicity of HAAs follows two general trends: a) toxicity increases with increasing size of the halogen atom, Cl ≪ Br < I; and b) toxicity decreases with the number of halogen substitutions, that is, mono- > di- > tri-. These trends were consistently reported for cytotoxicity, oxidative stress, genotoxicity, and developmental toxicity (Atwood et al., 2019; OEHHA, 2022).
As a group, HAAs at higher concentrations are corrosive to tissues due to their acidic properties with the mono-substituted acids being weaker acids than the tri-substituted acids (Table 1 for Phys/chem, pKa values). More than 99.99% of HAA5 exists as the dissociated carboxylate anions at a pH range of 6.8–8.5, typical of drinking water and in biological tissues (OEHHA, 2022). However, HAA5 becomes the corresponding acetate after it leaves the stomach (OEHHA, 2022). In the following studies, HAAs were administered as the free acid, as the sodium salt or as a neutralized solution, depending on the study methodology. The form of HAA used in each study is noted, because the form can influence the effects seen in the test systems. As HAAs are present as salts and as acetates in drinking water (neutral pHs), studies using neutralized HAAs were given preference (Urbansky, 2000; EC, 2003).
2.3.1 Acute
Oral median lethal dose (LD50) values for HAAs were limited to MCAA, DCAA, TCAA, MBAA, DBAA and MIAA (Table E1). Overall, rats were more sensitive than mice to the acute toxicity of HAAs, based on their lower oral LD50 values (ranging from 55–5000 mg/kg). Un-neutralized HAAs were more toxic than neutralized HAAs, with the severity of effects being at least partially related to their low pKa values and irritant or corrosive properties (Table 1) (Eriksson et al., 1994; NIOSH, 2000 cited in U.S. EPA, 2005). MCAA was more toxic than acetic acid, DCAA and TCAA (NTP, 1992; OEHHA, 2022). In general, the brominated and mixed halogenated HAAs tend to be more toxic than Cl-HAAs, but acute studies were limited (OEHHA, 2022). Clinical observations included necrosis, excessive drinking water intake and mobility problems (Table E1).
2.3.2 Subchronic, chronic, reproductive/developmental, genotoxic and carcinogenic
Monochloroacetic acid (MCAA)
Database summary: The database for MCAA contained short-term, subchronic and chronic studies but lacked well-conducted reproductive and developmental studies (Appendix E). The main target organs included the liver, kidney, testes and heart (Appendix E). While MCAA caused neurological effects in LD50 and short-term studies in animals (Table E1), changes in brain weights or in histopathology were not seen in subchronic and chronic studies (Table E2).
F344 rats were more sensitive than B6C3F1 mice to MCAA. Mice showed fewer morphological or functional changes and lower mortality when compared to rats in both 13-week and 2-year studies (Bryant et al., 1992; NTP, 1992). In the 2-year study, deaths occurred at 11 mg/kg bw per day in rats compared to 71 mg/kg bw per day for mice (Bryant et al., 1992; NTP, 1992). Although one study showed increased sensitivity of male rats to liver effects caused by MCAA, other studies did not show any sex-related differences (Table E2).
The lowest no observed adverse effect level (NOAEL) was 3.5 mg/kg bw per day in male F344 rats, based on weight changes in the liver, kidney and testes and depressed growth weights. The lowest observed adverse effect level (LOAEL) for the same study was 26.1 mg/kg bw per day (DeAngelo et al., 1997). MCAA is likely not genotoxic or carcinogenic.
Development effects: In a single-dose study in which 10 pregnant Hsd:SD rats were gavaged with 193 mg/kg bw per day of neutralized MCAA throughout pregnancy, no fetal cardiac effects or gross external or noncardiac internal congenital abnormalities were seen (Johnson et al., 1998). In whole CD-1 mouse embryo cultures, MCAA induced overall malformations and neural tube defects starting at 175 µM, and heart and pharyngeal arch defects at 250 µM (Hunter et al., 1996) and cranial neural tube dysmorphogenesis at 74.3 µM (Hunter et al., 2006).
Genotoxicity: Based on the weight of evidence (WOE), MCAA is likely not directly genotoxic (Table E3). Bacterial assays were mostly negative and mammalian assays for mixed DNA damage were positive in in vitro assays but negative at low doses in vivo. Discrepancies in the results may be attributed to varying degrees of cytotoxicity. Antioxidant addition reduced induced DNA damage and micronucleus formation, implicating oxidative stress in DNA damage induction (Ali et al., 2014). DNA damage in rat hepatocytes was secondary to cytotoxicity. OEHHA (2022) concluded that the evidence of genetic toxicity for MCAA is mixed.
Carcinogenicity: There is no evidence of carcinogenicity in experimental mice or rats orally exposed to MCAA (NTP, 1992; DeAngelo et al., 1997; Table E4). NTP (2018) concluded that the evidence is not sufficient to classify the carcinogenicity of MCAA. The U.S. EPA classifies MCAA as “inadequate information to assess carcinogenic potential.” IARC has not reviewed MCAA.
Dichloroacetic acid (DCAA)
Database summary: The database for DCAA (Appendix E) is almost complete, lacking only single- and multi-generational developmental studies. The main targets of DCAA in rodents and dogs included liver, kidneys, brain and nervous system, male reproductive system and fetus; heart and eye defects were seen both in adult dogs and in fetal rats (Table E2). Dogs had multiple organ effects starting at 12.5 mg/kg bw per day, the lowest dose tested (Cicmanec et al., 1991). Changes in serum chemistry and markers of oxidation were seen in rats (3.9 mg/kg bw per day) and mice (7.7 mg/kg bw per day) at lower doses but they were not accompanied by organ effects or other signs of toxicity (Mather et al., 1990; Hassoun et al., 2010a, 2010b).
The lowest NOAELs in rats were 3.6 mg/kg bw per day (LOAEL of 40.2 mg/kg bw per day; testicular weight changes and liver neoplasia in a 1-year rat study; DeAngelo et al., 1996) and 3.9 mg/kg bw per day (LOAEL of 35.5 mg/kg bw per day; changes in liver and kidney weights and decreased final body weights in a 90-day study; Mather et al., 1990). For mice, the lowest NOAEL was 7.6 mg/kg bw per day (LOAEL of 77 mg/kg bw per day) based on liver weights in a 60- to 75-week study (DeAngelo et al., 1991). These studies are considered in the selection of the key study (Section 2.5). While there is evidence of carcinogenicity, DCAA is not likely to be directly genotoxic.
Reproductive effects: DCAA targeted the male reproductive system in both rats and dogs. Effects seen included changes in reproductive organ weights (epididymis, preputial glands, testes, prostate), altered sperm/spermatid parameters, and decreased fertility (Table E2). Decreased fertility (decreased number of live implants per untreated dams) was seen at the lowest dose tested of 26 mg/kg bw per day (Toth et al., 1992). The NOAEL for male reproductive effects was 3.6 mg/kg bw per day (the same NOAEL for liver effects) based on increased relative and absolute testes weight in male rats given drinking water containing DCAA for 100 weeks (DeAngelo et al., 1996).
Female reproductive effects were limited to effects on fertility (decreased mean live fetuses per litter, increased male:female sex ratio, decreased total implants per litter) and occurred at doses much higher (≥ 400 mg/kg bw per day) than those affecting fertility in males (Smith et al., 1991).
Development effects: Increased fetal malformations and maternal toxicity were observed after pregnant rats were given DCAA on gestational day (GD) 6–15 (NOAEL/LOAEL 14/140 mg/kg bw per day (Randall et al., 1991b; Smith et al., 1991; Table E2). In in vitro studies, DCAA was dysmorphogenic to rat (≥ 2 500 µM) and mice (≥ 5 871 µM) whole embryo cultures (Hunter et al., 1996; Andrews et al., 1999).
Genotoxicity: Based on the WOE, DCAA is likely not directly genotoxic (Table E3). In vitro, bacterial assays were mostly negative and mammalian assays negative or mixed. In vitro studies that examined higher DCAA concentrations were more likely to report a positive finding (OEHHA, 2022). In vivo assays (given higher weight in the WOE analysis) were negative or only positive at high DCAA doses or at a later timepoint. OEHHA’s (2022) evaluation supports this non-genotoxic WOE (evidence of in vitro genetic toxicity of DCAA is inconsistent; DCAA genotoxicity in vivo was observed at higher doses and primarily in liver cells).
Carcinogenicity: Hepatic adenomas and carcinomas were reported in both sexes of mice and rats exposed to DCAA in drinking water (Table E4). Three studies (DeAngelo et al., 1999; Bull et al., 2002; Wood et al., 2015) are considered of sufficient quality (multiple dose groups including low doses, large number of animals used, quality control performed and adequate reporting of results) for the selection of the key study (Section 2.5). OEHHA (2022) concludes that rat studies are not considered for dose-response analysis due to the lower sensitivity of this species as observed in the available studies. NTP (2018) concludes that DCAA is reasonably anticipated to be a human carcinogen based on sufficient evidence from studies in experimental animals and supporting mechanistic data. IARC classified DCAA as “Group 2B–possibly carcinogenic to humans” (IARC, 2014). The U.S. EPA classified DCAA as “likely to be carcinogenic to humans” (U.S. EPA, 2003a). Interestingly, DCAA has also demonstrated anticancer properties by inhibiting abnormal metabolic process in mitochondria (altered cellular metabolism in Section 2.4 Mode of action [MOA]).
Trichloroacetic acid (TCAA)
Database summary: The database for TCAA is mostly well-characterized but lacks one- and/or two-generation reproductive and developmental studies (Appendix E). TCAA primarily targeted the liver with carcinogenicity being the most severe effect observed; effects on female reproduction, fetal development, and the kidneys were also observed (Tables E2 and E4). Rats were more sensitive than mice to TCAA; however, liver tumours were not reported in rats.
Subchronic studies report the lowest LOAEL of 7.7 mg TCAA/kg bw per day causing hepatic lipid peroxisome proliferation and oxidative stress (Hassoun et al., 2010a, 2010b). After chronic exposure to TCAA, the lowest LOAEL was 8 mg/kg bw per day, causing hepatic lesions and inflammation (DeAngelo et al., 2008). While there is evidence of carcinogenicity, TCAA is not likely to be directly genotoxic.
Reproductive and development effects: The lowest NOAEL for reproductive effects was 330 mg/kg bw per day; a LOAEL of 800 mg/kg bw per day led to altered reproductive outcomes, including increased percent post-implantation loss, decreased mean live fetuses per litter, increased number of totally resorbed litters and decreased number of viable litters in pregnant rats gavaged with TCAA on GD 6–15 (Smith et al., 1989). In this same study, TCAA (330 mg/kg bw per day; LOAEL) caused decreased fetal growth, increased malformations and cardiac defects. In in vitro studies, TCAA was dysmorphogenic to rat (0.5–5 µM) and mice (≥769 µM) whole embryo cultures (Saillenfait et al., 1995; Hunter et al., 2006).
Genotoxicity: Based on the WOE (Table E3), TCAA does not appear to be directly genotoxic. In vitro bioassay results were mostly negative, with some positive results. Mixed results were reported for in vivo bioassays. Positive results were at high doses or in a species where TCAA exposure did not cause tumours (rats).
Carcinogenicity: Liver tumours were reported in several chronic studies in mice of both sexes exposed to TCAA but not in rats (Table E4). Overall, DeAngelo et al. (2008) appeared to be the best quality study (multiple doses, large number of animals, longer duration than most other studies, multiple endpoints examined, consistent results in independent studies, examined the mode of action [MOA] of peroxisome proliferation) for the selection of the key study (Section 2.5). NTP (2018) concludes that existing evidence of TCAA carcinogenicity as not sufficient. IARC has classified TCAA as “Group 2B – possibly carcinogenic to humans” (IARC, 2014). The U.S. EPA classifies TCAA as having “suggestive evidence of carcinogenic potential” (U.S. EPA, 2011).
Monobromoacetic acid (MBAA)
Database summary: The toxicological database for MBAA is limited, lacking subchronic, chronic and reproductive/developmental studies in experimental animals exposed to HAAs of sufficient quality (multiple doses, large number of animals, subchronic or chronic duration, multiple endpoints examined, reporting of study conditions) (Appendix E, Table E2). A 14-day oral gavage study did not find any effects on spermatotoxicity or on weight of testes, epididymis, seminal vesicles or ventral prostate in male rats gavaged with either 25 mg/kg bw per day for 14 days or a single dose of 100 mg/kg bw (Linder et al., 1994a). Developmental effects (decreased size of live fetuses, increased soft tissue malformations) but not female reproductive effects were seen in the presence of maternal toxicity (100 mg/kg bw per day) in pregnant Long Evans rats gavaged with 25, 50 or 100 mg/kg bw per day from GD 6–15. However, further details of the study could not be obtained (Randall et al., 1991a; abstract only). In an in vitro study using cultured mouse embryos, MBAA disrupted neuro-regulation and caused malformations with a benchmark concentration of 2.7 µM (Hunter et al., 1996). While there are no studies on the carcinogenicity of MBAA, there is evidence to suggest that MBAA may be genotoxic and may therefore be a carcinogen.
Genotoxicity: Based on the WOE (Table E3), MBAA might be genotoxic; supported by OEHHA (2022). In in vitro studies of more than 70 DBPs, MBAA was the most cytotoxic and genotoxic among chlorinated and brominated DBPs (THMs and HAAs). The rank order of genotoxic response among monosubstituted HAAs was MIAA > MBAA > MCAA. MBAA was ranked more genotoxic than DCAA and TCAA. However, two in vivo bioassays in newt larvae and nematodes were negative for genotoxicity (Giller et al., 1997; Zuo et al., 2017). As MBAA is rapidly metabolized and excreted in vivo, the positive in vitro studies should be interpreted with caution (Saghir and Schultz, 2005).
Carcinogenicity: No studies on the carcinogenicity of MBAA were located. OEHHA (2022) suggests that MBAA may be a carcinogen since MBAA is more potent in genotoxicity assays than DCAA (classified as carcinogen). The carcinogenicity of MBAA has not been evaluated by any route of exposure or by IARC or U.S. EPA.
Dibromoacetic acid (DBAA)
Database summary: Overall, the database for DBAA is well characterized (Appendix E). The liver, kidneys, nervous system, female and male reproductive tract and developing offspring were targets of DBAA toxicity (Table E2). Although organ weight changes were noted in adrenal glands, thymus, heart, brain and lungs, these changes were not accompanied by histological or functional changes and were considered secondary to decreased body weights (Christian et al., 2002; NTP, 2007a). Body weight decreases were consistently seen in adult male and female rats as well as in offspring of treated rats and were commonly associated with decreased drinking water and/or food intake (Table E2). Body weights were unaffected in mice in a two-year study (Melnick et al., 2007; Table E2). The lowest LOAEL of 2 mg/kg bw per day for liver and kidney effects occurred in F344 rats in a two-year study and was based on minimal to mild cystic degeneration in livers of males and on nephropathy in females (NTP, 2007a). Liver effects were seen in both rats and mice drinking water studies and included increased absolute and relative weights, mild cystic degeneration, increased hepatocellular vacuolization and increased glycogen content (Table E2). Increased absolute and relative kidney weights occurred in adults and offspring of rats and in adult mice (subchronic studies only), while small kidneys and hydronephrosis were reported in the fetuses of mice given DBAA during GD 6–15 (Table E2). The WOE supports DBAA as a genotoxic carcinogen.
Reproductive effects: DBAA had multiple effects on the male reproductive tract in all three species tested. It impacted spermiogenesis in rabbits starting at 1 mg/kg bw per day and delayed spermiation in rats and mice starting at 10 and 115 mg/kg bw per day, respectively (Table E2). Decreased testicular and epididymal weights, accompanied by histopathological changes, occurred at higher DBAA concentrations (50 mg/kg bw per day in rats; Table E2). DBAA caused delayed parturition in mice (LOAEL of 24 mg/kg bw per day) and rats (52.4 mg/kg bw per day) as well as increased prenatal loss in mice but not rats (Narotsky et al., 1996; Cummings and Hedge, 1998; Christian et al., 2002). DBAA had no reproductive effects on estrous cycle, pre- and post-implantation loss or live litter size in rats given up to 250 ppm per day of DBAA via gavage in either a one- or two-generation study (Christian et al., 2001, 2002).
Development effects: One- and two-generation studies in rats given up to 250 ppm of DBAA did not show any developmental effects, including alterations in gross external morphology (Christian et al., 2001, 2002). In an in vitro study using rat whole embryo culture, DBAA was dysmorphogenic at concentrations of ≥ 200 µM (Andrews et al., 2004), similar to the concentration of ≥ 250 µM needed to cause dysmorphology in mice (Hunter et al., 1996).
Genotoxicity: Several studies have shown that DBAA is genotoxic in vitro and in vivo (Table E3). Based on the WOE, DBAA is likely genotoxic, a conclusion that is supported by OEHHA (2022). Although the mechanism of carcinogenicity of DBAA is unknown, IARC noted that “[s]everal comparative genotoxicity and mutagenicity studies … have demonstrated that [DBAA] is more potent than its chlorinated analogue, [DCAA], and that they have several molecular and biochemical activities in common” (IARC, 2013).
Carcinogenicity: Liver tumours were reported in male and female mice (lowest LOAEL of 4 mg/kg bw per day) and multiple organ mesothelioma in male rats (lowest LOAEL of 40 mg/kg bw per day) exposed to DBAA in drinking water for two years (Table E4; NTP, 2007a). IARC (2012) classified DBAA as “Group 2B – possibly carcinogenic to humans” and the NTP lists DBAA as “reasonably anticipated to be a human carcinogen” (NTP, 2021).
Tribromoacetic acid (TBAA)
Database summary: The database for TBAA is limited to only one 35-day reproductive and developmental rat toxicity screen (NTP, 1998a; Appendix E, Table E2). This screen did not find any reproductive/developmental effects, clinical signs of toxicity or changes in cellular proliferation from the liver, kidney or urinary bladder at doses as high as 39 mg/kg bw per day. The limited genotoxicity studies were equivocal, but TBAA may not be genotoxic at low doses (Table E3). No carcinogenicity studies were found.
Bromochloroacetic acid (BCAA)
Database summary: The database for BCAA contained a short-term reproductive and developmental study, as well as subchronic, chronic, and genotoxicity studies (Appendix E, Table E2). Key targets included the liver, kidney, reproductive and developmental systems in rats and mice of both sexes (Table E2). Exposure to BCAA for three months in drinking water resulted in increased liver and kidney weights in female mice (LOAEL 8 mg/kg bw per day) and increased liver weights in male rats (LOAEL 10 mg/kg bw per day; NOAEL 5 mg/kg bw per day) (NTP, 2009). Exposure to BCAA for two years in drinking water studies resulted in increased incidence of hepatocellular adenomas and/or carcinomas (LOAEL 15 mg/kg bw per day, female mice; NTP, 2009). While there is evidence that BCAA is carcinogenic, the evidence for its genotoxicity is limited.
Reproductive and development effects: BCAA may have effects on reproduction. BCAA decreased sperm parameters and percent fertility in male rats exposed by gavage for 14 days (LOAELs 1.6 and 8 mg/kg bw per day) and decreased number of live fetuses/litter and total implants per litter in female rats drinking water for 35 days (LOAEL 50 mg/kg bw per day; Table E2). However, no effects on sperm parameters (NOAELs 39 mg/kg bw per day for 35 days and 75 mg/kg bw per day for three months) or estrous cycle (NOAEL 85 mg/kg bw per day for three months) were reported in rats drinking water containing BCAA (Table E2). In in vitro studies, BCAA was dysmorphogenic to rat (≥ 200 µM) and mice (≥ 100 µM) whole embryo cultures (Andrews et al., 1999, 2004; Hunter et al., 2006).
Genotoxicity: The limited genotoxicity studies were equivocal, but BCAA may not be genotoxic at low doses (Table E3).
Carcinogenicity: BCAA caused intestinal and mammary tumours in rats and liver tumours in mice at doses as low as 15 mg/kg bw per day (female mice; no NOAEL) and 25 mg/kg bw per day (rats; NOAEL 13 mg/kg bw per day; Table E4; NTP, 2009). NTP (2018) concluded BCAA is “reasonably anticipated to be a human carcinogen”.
Chlorodibromoacetic acid (CDBAA)
Database summary: The database for CDBAA was limited to one subchronic reproductive/developmental screening study, one in vitro developmental study, and one genotoxicity study (Appendix E, Tables E2 and E3). The subchronic study (35 days) did not find any clinical effects in rats in either the range finding or the main study (500, 1 000 or 1 500 ppm in drinking water; NTP, 2000; Table E2). Female reproduction and pup development were unaffected. However, decreased sperm velocity and maximum amplitude of lateral head displacement (no change in other sperm measurements) were seen in males starting at 1 500 ppm (78 mg CDBAA/kg bw per day). Cell proliferation was statistically increased in the livers of male rats at 78 mg/kg bw per day and in the livers and kidneys of female rats at 58 mg/kg bw per day but was only statistically significant at 124 mg/kg bw per day. The authors state that the lack of overt cytotoxicity in the presence of a cell proliferative response suggests a mitogenic MOA. In an in vitro study, CDBAA was dysmorphogenic to mouse embryos (≥ 1500 µM; Hunter et al., 1996).
While CDBAA caused cytotoxicity and DNA damage in mammalian cells in vitro at higher doses (Plewa et al., 2010; Table E3), the WOE is insufficient to determine the genotoxic potential of CDBAA. No carcinogenicity studies were located and CDBAA has not been evaluated for carcinogenicity by either IARC or U.S. EPA. However, NTP classified CDBAA as “reasonably anticipated to be a human carcinogen,” based on sufficient evidence of carcinogenicity from experimental animal studies and supporting evidence from mechanistic studies that demonstrated biological plausibility of carcinogenicity in humans (NTP, 2021). This is supported by evidence that CDBAA is metabolized to BCAA (Schultz et al., 1999; Saghir et al., 2011), and BCAA is reasonably anticipated to be a human carcinogen based on experimental animal studies and supporting evidence from mechanistic studies (NTP, 2009, 2018, 2021).
Bromodichloroacetic acid (BDCAA)
Database summary: The database for BDCAA is limited to a few subchronic, chronic, and reproductive studies in mice and rats, an in vitro developmental study and a genotoxicity study (Appendix E, Tables E2 and E3). The liver, kidney and fetus were targets of BDCAA (Table E2).
Subchronic (14-week) exposure to BDCAA in drinking water affected the liver and kidneys of rats (LOAEL of 5 mg/kg bw per day for decreased serum alanine transaminase [ALT]) and mice (LOAEL of 30 mg/kg bw per day for increase liver weight) (NTP, 2015). The male/female reproductive systems of the mice were not affected at doses that went up to 129 mg/kg bw per day. Chronic exposure to BDCAA in drinking water increased incidence of carcinogenic activity in rats (LOAEL 11 mg/kg bw per day) and mice (LOAEL 17 mg/kg bw per day, increased incidences of hepatocellular adenomas and carcinomas) in both sexes (NTP, 2015; Tables E2 and E4).
Overall, BDCAA caused cancer in several organs. However, evidence for its genotoxicity is limited.
Reproductive and development effects: In an in vitro study, BDCAA was dysmorphogenic to mouse embryos (≥ 1 200 µM; Hunter et al., 2006).
Genotoxicity: The data is insufficient to provide a WOE for BDCAA’s genotoxic potential. A few in vitro mutation assays were positive, while a micronucleus assay in vivo was negative (NOAEL 123 mg/kg; Plewa et al., 2010; NTP, 2015; Table E3).
Carcinogenicity: Evidence of carcinogenicity was seen in both sexes of rats and mice in long-term studies (NTP, 2015; Table E4). The increased incidence of mammary lesions in F344 rats given BDCAA seen in the NTP (2015) study prompted Harvey et al. (2016) to compare gene and protein expression in control and BDCAA-exposed F344 rats with relevant human breast cancer genes. Harvey et al. (2016) suggests that adenocarcinomas from BDCAA-treated rats are molecularly different from spontaneous tumours in rats and that they may be mediated by tumour growth factor-β, an important mediator in many human breast cancers. NTP (2018) concluded BDCAA is “reasonably anticipated to be human carcinogen”. BDCAA has not been assessed for carcinogenicity by either the IARC or the U.S. EPA.
Iodinated HAAs (I-HAAs)
Database summary: The database for I-HAAs is very limited (Appendix E, Table E2). Available studies were primarily reproductive and developmental studies on exposure to MIAA. MIAA caused reproductive, developmental and endocrine system effects. The lowest NOAEL reported was 2.5 mg/kg per day based on teratogenicity (LOAEL 7.5 mg/kg per day; Long et al., 2021). While no carcinogenicity studies are available, I-HAA may potentially be genotoxic (Table E3).
Reproductive and development effects: In female mice or rats, no reproductive toxicity was reported at doses < 500 mg MIAA/L (28–40 days; three studies). However, in one study, ovarian weights were decreased starting at 6 mg MIAA/kg bw per day and altered levels of hormones were seen in both male and female rats starting at 12 and 24 mg MIAA/kg bw per day (28 days), respectively (Table E2).
In male rats, increased relative weights of testes (in the absence of histopathological changes) and seminal vesicles plus coagulating glands were seen at 22.5 mg MIAA/kg bw per day (Table E2).
In offspring, MIAA caused increased head congestion starting at 7.5 mg/kg bw per day (NOAEL 2.5 mg/kg bw per day) and decreased litter weight, lower viability index and decreased anogenital distance index in male pups at 22.5 mg/kg bw per day (Table E2; Long et al., 2021). Increased absolute ovarian weights, delayed rate of vaginal opening, increased anogenital distance relative to body weight and decreased percentage of atretic follicles were also seen in F1 female offspring (Table E2).
In vitro studies using mouse ovarian follicles showed MIAA (2–15 µM) was an ovarian toxicant that decreased estradiol levels and ovarian follicle growth and altered gene expression involved in cell cycle regulation, apoptosis, cell proliferation, steroidogenesis, and estrogen receptors (Gonsioroski et al., 2020). MIAA was not cytotoxic, did not induce cell proliferation, and was not an estrogenic or an androgenic disrupter in in vitro assays (Long et al., 2021). Also, in in vitro studies, MIAA inhibited the differentiation of midbrain and limb bud cells (indicating a strong teratogen), reduced triiodothyronine-activated GH3 cell proliferation, and was antagonistic to thyroid hormone activity (Xia et al., 2018).
Genotoxicity: Based on the WOE (Table E3), I-HAAs are likely genotoxic to humans.
Carcinogenicity: No studies on carcinogenicity were located. I-HAAs have not been classified by either IARC or U.S. EPA.
2.4 Mode of action (MOA)
A direct DNA-reactive or a non-direct DNA-reactive carcinogenic MOA informs whether a linear or threshold approach are used respectively in order to derive a health-based value (HBV) (Section 3.0). Six of the 13 HAAs found in drinking water are reasonably anticipated to be human carcinogens: BCAA, BDCAA, CDBAA, DBAA, DCAA and TBAA (NTP, 2018). In its Report on Carcinogens, the NTP concluded that direct acting genotoxicity does not appear to be a primary MOA for HAAs but instead states that the mutagenic and genotoxic effects of HAAs are likely due to oxidative stress (NTP, 2018). To determine if HAAs induced tumours in animals by directly damaging DNA (direct DNA-reactive) or, indirectly (non-direct DNA-reactive) and if this MOA is relevant to humans, a comparative MOA/human relevance analysis was performed (guided by Meek et al., 2014a, 2014b) with consideration of the key characteristics of carcinogens (Smith et al., 2020).
MOAs consistent with HAAs’ soft electrophilicity (electron withdrawal from the α-carbon by the halogen substituents) include indirect genotoxicity, generation of reactive oxygen species (ROS) (Stalter et al., 2016), as well as inhibition of pyruvate dehydrogenase kinase (PDK), glyceraldehyde-3-phosphate dehydrogenase (GAPDH), and GST-ζ (NTP, 2018). While evidence supports TCAA and DBAA as peroxisome proliferator-activated receptor α modulators, the relevance of this MOA for carcinogenesis in humans is low (Corton, 2008, 2014). No evidence of HAA modulation of other receptors were found. Evidence for HAAs inducing chronic inflammation or immunosuppression is generally weak and inconsistent (NTP, 2018).
Figure 2 summarizes the key events in the postulated MOAs by which HAAs may induce tumours. The potential early key events are 1A) genotoxicity (discussed below and in Section 2.3 and in Table E3), 1B) epigenetic alterations (discussed below), and 1C) altered cellular energy metabolism (discussed below). These early key events potentially lead to later key events of altered key genes, ROS generation, oxidative stress and ultimately altered cell growth and survival and, subsequently, tumour formation. The early key events inform whether an individual HAA is directly DNA-reactive (1A genotoxic) or non-direct DNA-reactive (1B epigenetic or 1C altered cellular metabolism) and which approach may be used for derivation of a HBV (Section 3.0).
Overall, the available data suggest that HAA carcinogenesis is complex and may involve multiple MOAs. HAAs may induce cancer through their electrophilic reactions with macromolecules leading to altered gene expression, oxidative stress and altered cell growth and survival. Data are not available for all 13 HAAs. MOAs that are potentially relevant to humans with experimental support include epigenetic alterations leading to altered expression of key genes and altered cellular energy metabolism leading to oxidative stress. Direct DNA genotoxicity does not appear to be a primary MOA for the HAAs and, overall, the data suggest that oxidative stress is responsible for the mutagenic and genotoxic effects of these compounds (NTP, 2018).
Figure 2. Potential modes of action (MOA) examined for haloacetic acid (HAA)-induced carcinogenicity
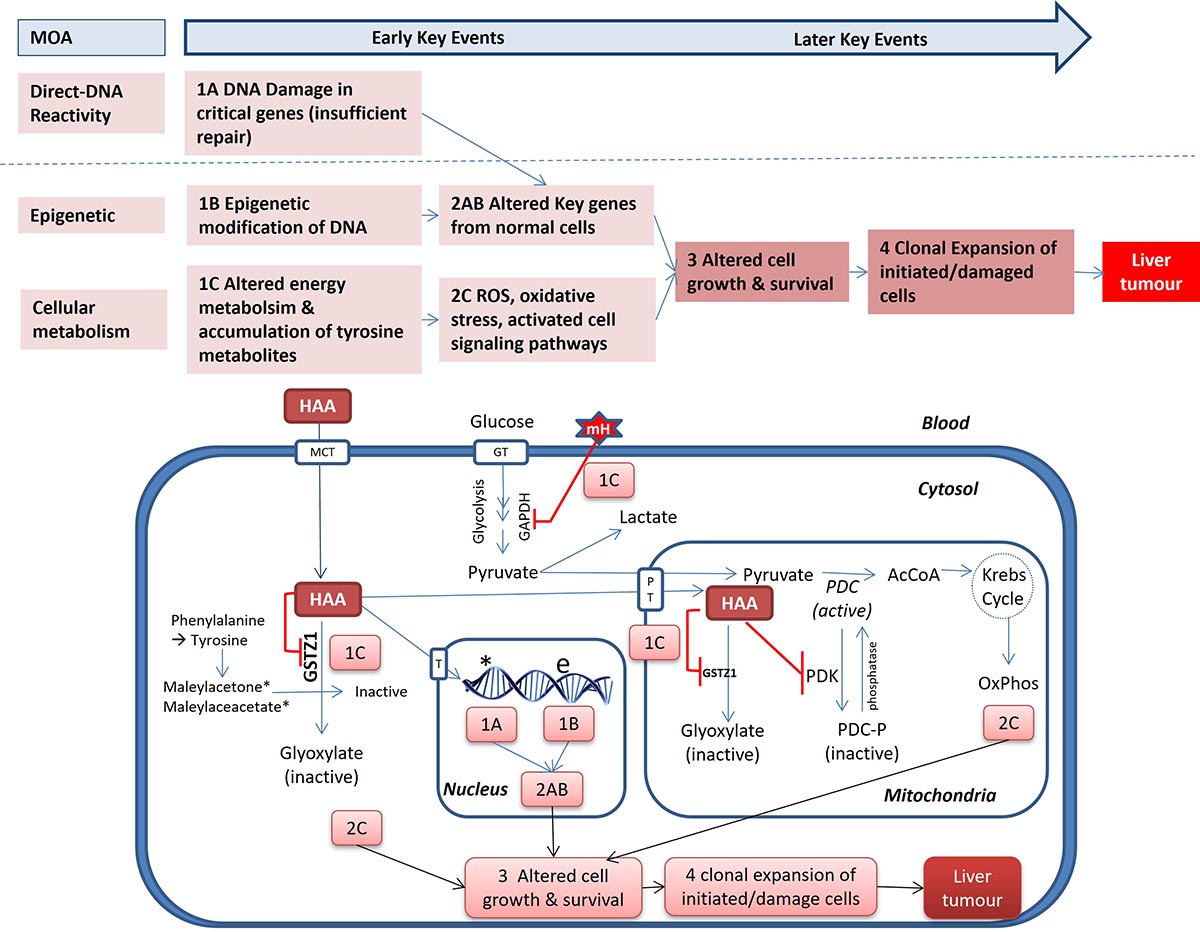
Figure 2: Text description
Key event 1A) Direct DNA-reactive (genotoxic): HAAs bind to DNA to induce damage in critical genes and this damage is not repaired. Key event 1B) Indirect epigenetic: HAAs induce hypomethylation of DNA in the promoter regions of oncogenes to increase their messenger ribonucleic acid (mRNA) expression. Key events 1A) and 1B) could lead to 2AB) altered key genes in normal cells. Key event 1C) Indirect cellular metabolism:
- Mono-HAAs (mH) inhibit glyceraldehyde-3-phosphate dehydrogenase (GAPDH): blocking formation of pyruvate for energy and inducing mitochondrial stress and decreased adenosine triphosphate (ATP) production;
- HAAs inhibit pyruvate dehydrogenase kinase (PDK): alters the function of the pyruvate dehydrogenase complex (PDC) to form acetyl-CoA (AcCoA), used to produce energy via the Krebs cycle and oxidative phosphorylation (OxPhos) in the mitochondria, thus inhibiting energy production and enhancing oxidative metabolism
- HAAs inhibit Glutathione S-transferase zeta (GST-ζ/GSTZ1): to a) decrease its own metabolism, clearance and increase its half-life, both in the cytosol and mitochondria, and b) increase levels of toxic tyrosine metabolites (maleylacetone*, maleylaceacetate*) in the cytosol
Event 1C) could lead to 2C) Reactive oxygen species (ROS) formation, oxidative stress and activation of cell signalling pathways. Subsequently, the early key events (1 and 2) can lead to later key events of 3) altered cell growth and survival that could lead to 4) tumour formation.
* – potential for direct DNA damage; e – epigenetic modification; GT – glucose transporter; MCT – sodium-coupled monocarboxylate transporter; PDC-P – phosphorylated-PDC; PT – pyruvate transporter.
Adapted from Vander Heiden et al. (2009), Lu et al. (2015), Tran et al. (2016) and NTP (2018).
Summary of the evidence for the potential MOAs
1A) Genotoxicity: Based on the WOE (Section 2.3 and Table E3), MCAA, DCAA and TCAA are likely non-direct DNA-reactive, while MBAA, DBAA and I-HAAs are potentially directly DNA-reactive; I-HAAs > BAA > CAA (Escobar-Hoyos et al., 2013). Insufficient data is available to evaluate BCAA, BDCAA, CDBAA and TBAA. MBAA was found to be the most cytotoxic and genotoxic among 70 chlorinated and brominated HAAs tested in vitro; the rank order of genotoxicity among mono-HAAs was MIAA > MBAA > MCAA (Kargalioglu et al., 2002; Plewa et al., 2004; Richardson et al., 2007; Komaki et al., 2009; Attene-Ramos et al., 2010; Muellner et al., 2010). NTP (2018) concludes that the genotoxicity of most HAAs is indirect, occurring at higher doses and as the result of ROS generation and oxidative stress. Antioxidant addition reduced induced DNA damage and micronucleus formation, implicating oxidative stress in DNA damage induction (Ali et al., 2014).
1B) Epigenetic modification (DCAA, TCAA, DBAA): Hypomethylation of oncogenes may represent early events in the carcinogenicity of HAAs. DCAA, TCAA and DBAA dose-dependently induced hypomethylation of DNA in the promoter regions of oncogenes (c-myc, c-jun and insulin-like growth factor-2) and increased their messenger ribonucleic acid (mRNA) expression in mice (Tao et al., 2000a, 2000b, 2004a, 2004b, 2005; IARC, 2013, 2014). DBAA also induced liver and kidney DNA hypomethylation in rats (Tao et al., 2004b, 2005). Hypomethylation was prevented by methionine and methylation and returned to normal with termination of DCAA exposure (Tao et al., 1998, 2000a; Ge et al., 2001). Hypomethylation of c-myc occurred with enhanced cell proliferation and was correlated with the carcinogenicity of DCAA and TCAA in rodents (Tao et al., 1998, 2000a, 2000b, 2004a, 2004b, 2005; Pereira et al., 2001; Ge et al., 2001). No clear potency trends were observed for HAAs (NTP, 2018). This MOA is biologically relevant to humans.
1C) Altered cellular metabolism: Inhibition of GAPDH, PDK and GST-ζ can alter cellular energy metabolism leading to ROS generation, oxidative stress and subsequently altered cell growth and survival, leading to tumour formation (Figure 2). This MOA is biologically relevant to humans.
GAPDH inhibition (monoHAAs): Mono-HAAs dose-dependently inhibit GAPDH (iodo- > bromo- ≫ chloro-) (Hernández-Fonseca et al., 2008; Pals et al., 2011, 2016; Dad et al., 2013). MBAA and MIAA possessed the highest potencies in in vitro studies examining GAPDH inhibition (BDCAA < CDBAA << DCAA < DBAA < BCAA < TCAA < MCAA < TBAA < MBAA < MIAA) and altered adenosine triphosphate levels (ATP; energy to drive and support many processes in living cells; BDCAA < MCAA < MIAA < MBAA) (Pals et al., 2011; Dad et al., 2013, 2018).
GAPDH inhibition blocks glucose metabolism to pyruvate (glycolysis). Decreased pyruvate leads to decreased ATP production, mitochondrial stress, increased intracellular Ca2+, generation of ROS and genotoxicity (Figure 2). Pyruvate addition enhanced ATP production and reduced DNA damage in vitro (Dad et al., 2013). GAPDH is also involved in DNA repair, cell-cycle progression and cell death (Colell et al., 2009; Zhang et al., 2015).
PDK inhibition (Di-/Tri-HAAs): Since DCAA is a structural analog of pyruvate, it enters the mitochondria through the pyruvate transporter where it binds and inhibits PDK activity, such that the pyruvate dehydrogenase complex (PDC) remains in its unphosphorylated, active state (Figure 2). The PDC regulates conversion of pyruvate to acetyl-CoA for use in the Kreb’s (tricarboxylic acid) cycle; thus, DCAA diverts cellular metabolism away from the glycolytic pathway towards oxidative metabolism (Stacpoole et al., 2008). Higher oxidative metabolism over time may overburden mitochondria, leading to accumulation of ROS, which can cause oxidative stress and DNA damage and, if left unrepaired, lead to tumour formation (Stacpoole et al., 2008).
DCAA dose-dependently increased total and unphosphorylated PDC and this was not prevented by the addition of inhibitors of transcription or translation in rat liver and primary fibroblast cultures from PDC-deficient patients (Evans and Stacpole, 1982; Morten et al., 1998; Han et al., 2008). DCAA inhibits PDK in rat, rabbit and pig (Deuse et al., 2014).
This MOA made DCAA a potential therapy for clinical use in metabolic disorders and as a cancer therapy (Warbug effect: cancer cells using glycolysis for energy become more sensitive to hypoxia and apoptosis when DCAA switches cellular metabolism to oxidative metabolism; Stacpoole et al., 2008).
MBAA and MIAA possessed the highest potencies in in vitro studies examining PDC activation (BDCAA < BCAA < CDBAA ~ TCAA < DBAA ~ MCAA < TBAA < DCAA MBAA < MIAA) (Pals et al., 2011; Dad et al., 2013, 2018).
GST-ζ inhibition (Di-HAAs; DCAA, DBAA and BCAA): Di-HAAs are metabolized by GST-ζ (tyrosine catabolism pathway) but also bind to and inhibit GST-ζ resulting in:
- self regulation of own decreased metabolism, clearance, and increased half-life; and
- increased levels of toxic tyrosine metabolites, both of which can result in oxidative stress and activation of stress-response pathway that could potentially lead to tumour formation (Stacpoole, 2011; James et al., 2017; Figure 2).
- BCAA > DCAA > DBAA to bind and irreversibly inhibit GST-ζ (Gonzalez-Leon et al., 1997; Tong et al., 1998b; Anderson et al., 1999; Cornett et al., 1999; Tzeng et al., 2000; Schultz and Sylvester, 2001).
- Human GST-ζ has similar affinity for DCAA as mouse and rat enzymes, but its inactivation is 3.5 times slower (Tzeng et al., 2000). Relative rates: mice > rats > humans (Tong et al., 1998b). Human GST-ζ more resistant to inhibition than rodent or dog GST-ζ (Board and Anders, 2011; Maisenbacher et al., 2013).
- Adults experience a five-fold greater metabolic inhibition compared to young subjects (Shroads et al., 2008). Cytosolic GST-ζ activity with DCAA is at or below the limits of detection prenatally and until about two months after birth, it rises with age until age 7 and then it is similar to adults (James et al., 2017). Increased levels of maleylacetone (tyrosine metabolite) were measured in children treated for months or years with DCAA; however, reactive tyrosine metabolites were not detected in urine of humans exposed sub-acutely or chronically to environmental levels of DCAA (Stacpoole, 2011).
- GST-ζ is present in liver, kidney, testis, heart, brain and other tissues of mice, rats and humans (James et al., 2017). GST-ζ expression in rat liver cytosol (86%) is greater than in the mitochondria (4%); no differences in protein sequence were identified in GST-ζ isolated from either location in either rat or human (James et al., 2017).
- GST-ζ-null mice appear normal unless stressed with diet high in homogentisic acid, tyrosine or phenylalanine which caused renal and hepatic failure and enlarged livers due to oxidative stress (James et al., 2017).
- No human conditions due to loss of the GST-ζ enzyme are reported (James et al., 2017).
- Humans with at least one copy of GST-ζ-1C are considered to be rapid DCAA metabolizers following repeat administration of 25 mg/kg per day for five or more days (James et al., 2017).
- Chloride modulates GST-ζ inactivation by DCAA. Chloride prolongs in vitro half-lives of GST-ζ inactivation in human cytosols (James et al., 2017).
- However, GST-ζ inhibition, observed at high DCAA concentrations, could be negligible at exposures to the relatively low environmental DCAA concentrations (Li et al., 2008b).
Later key events – Altered cell growth and survival: Regardless of the early key events (DNA damage, epigenetic event, altered cellular metabolism), later key events that stimulate oxidative stress, cell proliferation or inhibit apoptosis have the potential to lead to tumor formation (Figure 2). Oxidative stress, lipid peroxidation and oxidative DNA damage potentially play a role in the carcinogenicity of HAAs. Rodent and human cancer cell lines exposed to HAAs induce oxidative stress (mono- > di- > tri-haloacetic acids and iodinated > brominated ≫ chlorinated acetic acids (Larson and Bull, 1992; Austin et al., 1996; Pals et al., 2013; Stalter et al., 2016). Plewa et al. (2004) showed that the rank order of cytotoxicity and genotoxicity of the monohaloacetic acids was correlated with their electrophilic reactivity (that is, iodo- > bromo- ≫ chloroacetic acid). The potencies of cytotoxicity induced by MCAA, DCAA and TCAA were not correlated with their carcinogenic potencies, which suggest cytotoxicity is not the main cause for this group of chemicals (Plewa et al., 2002). Numerous studies report increased cell proliferation and decreased apoptosis in TCAA- and DCAA-induced hepatic foci and tumours in experimental animals (Sanchez and Bull, 1990; Richmond et al., 1991; Styles et al., 1991; Dees and Travis, 1994; Snyder et al., 1995; Pereira, 1996; Stauber and Bull, 1997; Channel et al., 1998; Stauber et al., 1998; Ge et al., 2001; Tao et al., 2004a, 2004b; Walgren et al., 2005; DeAngelo et al., 1991, 2008; IARC, 2014). Transcriptomic analyses demonstrates that HAAs (chloro, bromo, iodo, dichloro, bromochloro, trichloro and bromodichloroacetic acids) affect the expression of genes involved in oxidative stress response, DNA damage and repair, cell growth and proliferation, tissue remodelling, apoptosis, angiogenesis, cancer progression, fatty acid metabolism and xenobiotic metabolism (NTP, 2018).
2.5 Selection of key studies
All endpoints were considered in selecting the key study(ies) for deriving HBVs for HAAs. The most sensitive endpoints were selected, and the dose-response relationships were analyzed. The response that could potentially lead to an adverse effect, that occurs at the lowest dose (point of departure [POD]) is selected as the critical effect. Benchmark dose (BMD) modelling was used over the NOAEL/LOAEL approach, when possible, to identify PODs, since all experimental data is modelled, which offers better dose-response analysis. BMD modelling was performed at a default 10% benchmark response and then a BMD10 and a lower 95% confidence limit on that BMD (BMDL10) were selected (U.S. EPA BMDS online version https://bmdsonline.epa.gov; version 3.3.0). Data do not support moving away from default approach. All models were evaluated for fit: goodness of fit P-value greater than 0.1, BMD/BMDL ratio less than 5, visual inspection of the curve. All models with BMDs outside of observable range (that is, greater than highest dose tested or less than 3 times the lowest non-zero dose) were not considered for PODs. The model with the lowest Akaike Information Criterion was selected to estimate the BMD10 and BMDL10 for each selected endpoint. This value was used as a POD for development of an HBV (Section 3.0). A NOAEL/LOAEL was selected when data was not sufficient for modelling (no dose groups showing a statistically significant response compared to controls or high variability in response, no statistically significant data trend). Selection of the approach to derive the HBV (Section 3.0; linear or threshold) was based on the weight of genotoxic evidence (ability to bind DNA; Section 2.3, Table E3) and MOA analysis (Section 2.4). A direct-DNA reactive or a non-direct DNA-reactive carcinogenic MOA informs whether a linear or threshold approach are used, respectively, to derive an HBV.
Monochloroacetic acid (MCAA)
No epidemiological studies linked MCAA exposure with adverse effects in humans. No carcinogenic effects of MCAA were identified (NTP, 1992; DeAngelo et al., 1997). Systemic and cardiovascular toxicities in rats appear to be the sensitive endpoints for MCAA (NTP, 1992; DeAngelo et al., 1997). The chronic NTP (1992) study reported mortality (unidentified causes; NOAEL of 11 mg/kg bw per day). DeAngelo et al. (1997) reported myocardial degeneration (LOAEL of 26 mg/kg bw per day) and systemic toxicity (NOAEL of 3.5 mg/kg bw per day) in a chronic study in male rats. DeAngelo et al. (1997) was chosen as the key study for MCAA because it had the lowest POD; studied a reasonable number of animals (23–25 male rats); administered MCAA in drinking water for a lifetime exposure; and included pathological examination and serum analysis. Based on systemic toxicity (decreased body weight and changes in relative liver weights), 3.5 mg/kg bw per day was selected as the NOAEL and 26 mg/kg bw per day as the LOAEL, which were also selected by the U.S. EPA (2006) and OEHHA (2022). Given the lack of genotoxicity and carcinogenicity, a threshold approach is appropriate to derive an HBV (Section 3.0).
Dichloroacetic acid (DCAA)
No epidemiological studies link DCAA exposure with adverse effects in humans. The most sensitive endpoints in animals orally exposed to DCAA subchronic or chronically include liver toxicity and hepatic tumours (combined adenomas and carcinomas) in mice and rats, as well as testicular degeneration in dogs (low study numbers and varying effects; Cicmanec et al., 1991). Mather et al. (1990) and Wood et al. (2015) were excluded since they were of shorter durations, thus introducing greater uncertainty in extrapolating from subchronic to chronic duration, which would require application of an additional uncertainty factor. DeAngelo et al. (1996) was excluded since the high dose was sequentially lowered to 1 g/L by 52 weeks and then discontinued at 60 weeks, and, although DCAA was a hepatocellular carcinogen in male F344 rats, the concurrent observations of high mortality and tumour incidences at the highest dose decreases the sensitivity of the study, making it unsuitable as a critical study for carcinogenesis.
DeAngelo et al. (1991, 1999) and Bull et al. (2002) were considered of sufficient quality (chronic duration, multiple dose groups [including low doses], large number of animals used, quality control performed and adequate reporting of consistent adverse effects) for further consideration as the key study for liver effects. Table 8 compares the potential key studies and their potential PODs (NOAELs/LOAELs and BMDs/BMDLs). The NOAEL of 7.6 mg/kg bw per day for increased relative liver weight from DeAngelo et al. (1991) and the BMDL10 of 8.7 mg/kg bw per day for liver neoplasms (DeAngelo et al., 1999) are close. However, the lowest POD was a BMDL10 of 3.6 mg/kg bw per day for liver neoplasms (Bull et al., 2002). This value is also supported by NOAELs of 3.6 and 3.9 mg/kg bw per day for rats (testicular, liver and kidney weight changes and liver neoplasia) (Mather et al., 1990; DeAngelo et al., 1996).
Based on the weight of genotoxic evidence (Section 2.3, Table E3) and MOA analysis (Section 2.4), DCAA should follow a non-linear risk assessment approach. Specifically, in vivo assays (given higher weight in the WOE analysis) were negative or only positive at high DCAA doses or at a later timepoint and the MOA supports epigenetic or altered cellular metabolism as early key events in the MOA. OEHHA (2022) and NTP (2018) evaluations support this non-genotoxic WOE (evidence of in vitro genetic toxicity of DCAA is inconsistent; DCAA’s genotoxicity in vivo was observed at higher doses).
3.6 mg/kg bw per day (Bull et al., 2002) was selected as the POD for deriving the HBV via a threshold approach (Section 3.0); this value would be protective of liver, kidney and testicular toxicity and liver neoplasms.
| Method | Endpoint (mg DCAA/kg bw per day; incidence/total # animals at each treatment level) |
NOAEL/ LOAEL (mg/kg bw per day) |
BMD/BMDL10 (mg/kg bw per day) |
Reference |
|---|---|---|---|---|
Mice, male B6C3F1 (50/dose) given pH adjusted DCAA at 0.05, 0.5, 3.5, 5 g/L (calculated as 7.6, 77, 410, 486 mg/kg bw per day) in drinking water for 60 or 75 weeks |
Liver Toxicity and neoplasia: ≥77: increased final relative liver weights and carcinogenic. |
7.6/77 |
Did not pass BMD modelling quality control criteria |
DeAngelo et al. (1991) |
Male B6C3F1 mice (35-88/dose); Drinking water, 0, 0.5, 1, 2, or 3.5 g/L (0, 8, 84, 168, 315, or 429 mg/kg bw per day) neutralized DCAA for up to 100 weeks. (10/dose at 26-, 52- and 78-week interim sacrifices - data not reported here since concerned with chronic exposure.) |
Liver neoplasms: HA: 5/50, 1/33, 5/25, 18/35*, 9/21*, 5/11* HC: 13/50, 11/33, 12/25, 25/35*, 20/21*, 11/11* HA or HC: 18/50, 11/33, 14/25, 30/35*, 21/21*, 11/11* Significant early mortality and decreased body weights at two highest doses. |
84/168 |
HA: 80.9/37.9 (Hill model) HC: 29.0/23.6 (Probit model) HA or HC: 11.7/8.7 (multistage model) |
DeAngelo et al. (1999) |
Male B6C3F1 mice (20/dose); Drinking water, 0, 0.1, 0.5, or 2 g/L (0, 11, 54, or 216 mg/kg per day) neutralized DCAA for 52 weeks. |
Liver neoplasms: HA: 0/20, 1/20, 4/20, 10/19*; HC:0/20, 0/20, 1/20, 1/19; HA or HC: 0/20, 1/20, 5/20*,11/19* |
11/54 |
HA or HC: 19.7/3.6 (gamma model) |
Bull et al. (2002) |
BMD – benchmark dose; BMDL10 – BMD limit 10% increased risk of developing toxicity; HA – hepatocellular adenoma; HC – hepatocellular carcinoma; LOAEL – lowest observed adverse effect level; NOAEL – no observed adverse effect level. Dose response data was analyzed using U.S. EPA BMDS online version (https://bmdsonline.epa.gov; version 3.3.0) to estimate the lower 95% confidence limit of the dose associated with a BMDL10; only those passing BMD modelling quality control criteria are reported. |
||||
Trichloroacetic acid (TCAA)
No epidemiological studies link TCAA exposure with adverse effects in humans. Increased relative liver weight, hepatocellular necrosis and inflammation, peroxisome proliferation and hepatocellular adenomas and carcinomas were reported in several subchronic and chronic studies in mice exposed to TCAA. However, there was little or no evidence of neoplasms in females or rats. The tumours in mice are likely due to the MOA of peroxisome proliferation and not via a direct DNA-reactive MOA, which may not be relevant to humans (Section 2.4; Cattley et al., 1998). The developing fetus appears to be susceptible to maternal exposure to TCAA doses of 330 mg/kg bw per day (Smith et al., 1989); however, these doses are higher than those potentially causing liver effects in adults.
Overall, DeAngelo et al. (2008) appeared to be the best quality study for the selection of the key study (multiple doses, large number on animals, longer duration, multiple endpoints examined, consistent results in independent studies, examined the MOA of peroxisome proliferation; correlated significant increases for both hepatic peroxisome proliferation and hepatic neoplasms at 68.2 mg/kg bw per day). Of the three experiments performed in this study, the third did not require a time adjustment for less than lifetime, which would introduce additional uncertainty. Therefore, experiment 3 was chosen as the critical study for TCAA dose-response analysis (DeAngelo et al., 2008). The output for all PODs is displayed in Table 9. BMD modelling of the data identified a BMD10/BMDL10 of 8.9 and 6 mg/kg bw per day as the POD for TCAA to be used to derive the HBV via a threshold approach (Section 3.0).
| Method | Endpoint (mg TCAA/kg bw per day; incidence/total # animals at each treatment level) |
NOAEL/LOAEL (mg/kg bw per day) |
BMD/BMDL10 (mg/kg bw per day) |
Reference |
|---|---|---|---|---|
Drinking water. Exp1: 0, 0.05, 0.5, or 5 g/L (0, 7.7, 68.2, or 602.1 mg/kg bw per day) neutralized TCAA for 60 weeks; Controls received 2 g/L sodium chloride. Exp2: 0 or 4.5 g/L (0 or 572 mg/kg bw per day) neutralized TCAA for 104 weeks; controls received 1.5 g/L neutralized acetic acid. Exp3: 0, 0.05, or 0.5 g/L (0, 6.7, or 81.2 mg/kg bw per day) neutralized TCAA for 104 weeks; controls received deionized water. |
Exp1: HA and/or HC 45-60 weeks: 4/35, 5/32, 12/34*, 19/34*; HA and/or HC 60 weeks: 4/30, 4/27, 11/29*, 16/29*. Exp2: HA: 0/25, 21/36*; HC: 3/25, 28/36*; HA and/or HC: 3/25, 32/36*. Exp3: HA and/or HC 52-104 weeks: 31/56, 21/48, 36/51; HA and/or HC 104 weeks: 27/42, 19/35, 32/36*. |
Carcinomas: Exp1: 7.7/68.2; Exp2: LOAEL 572; Exp3: 6.7/81.2. |
Exp3: 52-104 weeks 19/12 (probit model) 104 weeks 8.9/6 (probit model) |
DeAngelo et al. (2008) |
BMD – benchmark dose; BMDL10 – BMD limit 10% increased risk of developing toxicity; Exp – experiment; HA – hepatocellular adenoma; HC – hepatocellular carcinoma; LOAEL – lowest observed adverse effect level; NOAEL – no observed adverse effect level. Dose response data was analyzed using U.S. EPA BMDS online version (https://bmdsonline.epa.gov; version 3.3.0) to estimate the lower 95% confidence limit of BMD associated with a 10% increased risk of developing toxicity (BMDL10); only those passing BMD modelling quality control criteria are reported. |
||||
Monobromoacetic acid (MBAA)
No epidemiological or chronic studies linking MBAA exposure with adverse effects in humans or animals were sufficient for quantitative risk assessment at this time. MBAA was neither a male nor female reproductive toxicant in rats but did cause developmental effects both in vivo and in vitro. A NOAEL of 25 mg/kg bw per day for male reproductive effects in rats exposed to this dose of neutralized MBAA for two weeks was reported (Linder et al., 1994a; no LOAEL). A NOAEL/LOAEL of 50/100 mg/kg bw per day was reported for developmental effects in the presence of maternal toxicity in rats gavaged with 25, 50 or 100 mg/kg bw per day MBAA from GD 6–15 (Randall et al., 1991b). Both studies are limited due to short duration and limited number of examined effects. While in vitro studies suggest that MBAA might be genotoxic, in vivo bioassays in newt larvae and nematodes were negative (Table E3). Importantly, animal data suggest that MBAA is rapidly metabolized and eliminated, thus in vitro studies should be interpreted with caution and in vivo toxicity studies may overestimate the human health risk of MBAA relative to other HAAs (Saghir and Schultz, 2005). While MBAA may be genotoxic, no carcinogenicity studies were identified. There does not appear to be an acceptable key study on which to base a guideline; therefore, a mixture assessment might be useful to compare exposure, kinetics, potential health effects and MOAs to other HAAs (Section 3.2).
Dibromoacetic acid (DBAA)
No epidemiological studies link DBAA exposure with adverse effects in humans. The most sensitive endpoints in experimental animals orally exposed to DBAA include liver toxicity, hepatic tumours, bronchial tumours, and reproductive and developmental effects.
For non-cancer effects, the male reproductive tract was the most sensitive endpoint in a subchronic study, with the rabbit being the most sensitive species (Veeramachaneni et al., 2007) with an LOAEL of 1 mg/kg bw per day (data not amenable to BMD modelling). Male reproductive toxicity is supported by several other reports in rats and mice (Table E2).
For cancer, male mice were the most sensitive to the carcinogenic effects of DBAA; male mouse response/incidence was greater than rat and female mice (NTP, 2007a). Based on liver tumours, an NOAEL of 4 mg/kg bw per day and a BMDL10 of 3.68 mg/kg bw per day for DBAA-induced cancer effects were determined (Table 10). However, since the BMDL model did not pass all the quality control criteria and the BMDL value is similar to the NOAEL, 4 mg/kg bw per day was selected as the POD for cancer. Since DBAA could be a direct DNA-acting genotoxic carcinogen, linear low-dose extrapolation should be considered to derive DBAA’s HBV.
Both the non-cancer and cancer PODs (1 and 4 mg/kg bw per day) are considered to derive the HBV via a threshold and linear approaches, respectively (Section 3.0).
| Method | Endpoint (mg DBAA/kg bw per day; incidence/total # animals at each treatment level) |
NOAEL/LOAEL (mg /kg bw per day) |
BMD/BMDL10 (mg/kg bw per day) |
Reference |
|---|---|---|---|---|
Male or female Fischer 344 rats and B6C3F1 mice (50/ dose). Drinking water, 0, 50, 500, or 1 000 mg/L (0, 2, 20, or 40 mg/kg bw per day for male rats; 0, 2,25, or 45 mg/kg bw per day for female rats; 0, 4, 45, or 87 mg/kg bw per day for male mice; and 0, 4, 35, or 65 mg/kg bw per day for female mice) DBAA for 2 years. |
Male mice: HA: 18/49, 37/50*, 37/50*, 42/50*; HC: 14/49, 9/50, 19/50, 26/50*. HA or HC: 28/49, 41/50*, 42/50*, 47/50*; Hepatic cystic degeneration in male rats. Alveolar epithelial hyperplasia in female rats. Male mouse response was greater than rat and female mice. |
4/45 |
HA or HC: Male mice: 5.66/3.68 (multistage; but goodness of fit p-value less than 0.1) |
NTP (2007a) |
Dutch-Belted rabbits, pregnant dams and offspring (≥ 10 dams/dose; 10–22 pups/dose). 0, 1–1.25, 5.2–6.7, or 55–61 mg/kg bw per day neutralized DBAA in drinking water from gestation day 15 to weaning at 6 weeks, continuing in offspring to 12 or 24 weeks. |
Offspring: Decrease in morpho-logically normal sperm, lesions in seminiferous epithelium. Reduced primordial follicles in first generation offspring at 24 weeks. |
Not available/1 |
Data did not pass quality control criteria for BMD modelling |
Veeramach aneni et al. (2007) |
BMD – benchmark dose; BMDL10 – BMD limit 10% increased risk of developing toxicity; HA – hepatocellular adenoma; HC – hepatocellular carcinoma; LOAEL – lowest observed adverse effect level; NOAEL – no observed adverse effect level. Dose response data was analyzed using U.S. EPA BMDS online version (https://bmdsonline.epa.gov; version 3.3.0) to estimate the lower 95% confidence limit of the BMD associated with a 10% increased risk of developing toxicity (BMDL10); only those passing BMD modelling quality control criteria are reported. |
||||
Tribromoacetic acid (TBAA)
No epidemiological or chronic studies linking TBAA exposure with adverse effects in humans or animals are available. There does not appear to be an acceptable key study on which to base a guideline; a mixture assessment might be useful to compare exposure, kinetics, potential health effects and MOAs to other HAAs (Section 3.2).
Bromochloroacetic acid (BCAA)
No epidemiological data linking BCAA exposure with adverse effects in humans were sufficient for quantitative risk assessment at this time. Several studies identified reproductive and developmental effects, as well as carcinogenicity in experimental animals associated with exposure to BCAA. The most sensitive non-cancer endpoint is reduced fertility in male rats (LOAEL of 1.6 mg/kg bw per day; Section 2.3). However, there is too much uncertainty to develop an HBV based on non-cancer effects, since the study is of short duration and data are not provided for dose-response assessment.
For carcinogenicity, Table 11 summarizes the potential key study and the potential PODs (NOAELs/LOAELs and BMDs/BMLs). A BMDL10 of 7.07 mg/kg bw per day for hepatoblastomas in male mice was the lowest POD with a model passing the adequate fit criteria. Please note that the BMDL10 for this endpoint is 3 times lower than the lowest non-zero dose, which indicates that further data needs to be collected in this dose range; however, given that the BMD is in the observable range, the use of this BMDL10 is justified. Furthermore, this value is similar to the next lowest value of 7.72 mg/kg bw per day for hepatocellular carcinomas in male mice. Thus, the BMDL10 of 7.07 mg/kg bw per day was selected as the POD for HBV derivation (Section 3.0). Given the limited genetic toxicology data and the positive results in various in vitro genetic toxicology studies, a linear extrapolation approach to calculating BCAA’s HBV for cancer should be considered.
| Method | Endpoint (mg BCAA/kg bw per day) |
NOAEL/LOAEL (mg/kg bw per day) |
BMD/BMDL10 (mg/kg bw per day) |
Reference |
|---|---|---|---|---|
Female F344 rats; male and female B6C3F1 mice (50/dose). Drinking water for 2 years. BCAA 0, 250, 500, 1 000 mg/L (rats: 0, 13, 25, 50 mg/kg bw per day; male mice: 0, 25, 50, 90 mg/kg bw per day; female mice:0, 15, 30, 60 mg/kg bw per day). |
Rats: adenoma of large intestine at 50, multiple fibroadenomas of mammary gland at 25 and 50, trend for HA. Male mice: HA at 25 and 50, HC at 50 and 90, HA and HC combined at all doses, HB at all doses. Also reduced survival. Female mice: HA at all doses, HC at 30, combined at all doses. |
Rat: 13/25; Male mice: NA/25; Female mice: NA/15 |
Male mice: HB BMDL10 8.8/7.07 (multistage model); HC BMDL10 7.72; Female mice: no BMD models passed quality control criteria Male rats: (Mesothelioma - all organs): 9.28 |
NTP (2009) |
BMD – benchmark dose; BMDL10 – BMD limit 10% increased risk of developing toxicity; HA – hepatocellular adenoma; HB – hepatoblastoma; HC – hepatocellular carcinoma; LOAEL – lowest observed adverse effect level; NA – not available; NOAEL – no observed adverse effect level. Dose response data was analyzed using U.S. EPA BMDS online version (https://bmdsonline.epa.gov; version 3.3.0) to estimate the lower 95% confidence limit of the BMD associated with a 10% increased risk of developing toxicity (BMDL10); only those passing BMD modelling quality control criteria are reported. |
||||
Chlorodibromoacetic acid (CDBAA)
The literature for CDBAA was limited to one subchronic 35-day study (NTP, 2000). Effects in male rats appeared at 78 mg/kg bw per day (NOAEL 62 mg/kg bw per day) and in female rats at 124 mg/kg bw per day (NOAEL 100 mg/kg bw per day). The NOAEL of 62 mg/kg bw per day is selected as the POD for deriving a potential HBV via a threshold approach for non-cancer effects (Section 3.0). Since CDBAA is a metabolite of BCAA (Schultz et al., 1999; Saghir et al., 2011), an HBV for BCAA’s carcinogenic effects would also be protective of CDBAA’s potential carcinogenic effects.
Bromodichloroacetic acid (BDCAA)
No epidemiological data linking BDCAA exposure with adverse effects in humans are available. NTP (2015) was the only high-quality study to investigate health effects associated with exposure to BDCAA in drinking water (mice and rats, both sexes), including short-term, sub-chronic and chronic exposures, as well as genotoxicity. The NTP concluded that there is clear evidence of carcinogenicity in both sexes of both rats and mice, while results were mixed for genotoxicity endpoints. BDCAA induces multi-organ tumours in both sexes of rats and mice. Given the limited genetic toxicology data and the positive results in bacterial mutagenicity experiments (NTP, 2015), a linear extrapolation approach to determine a POD for carcinogenicity of BDCAA is appropriate.
Cancer and non-cancer effects following chronic exposure to BDCAA in drinking water (NTP, 2015) were evaluated by BMD modelling. For non-cancer effects, the lowest POD is the BMDL10 of 4.03 mg/kg bw per day for bone marrow hyperplasia in female rats. This BMDL10 is similar to those calculated for eosinophilic liver foci in female mice (4.08 mg/kg bw per day) and female rats (5.58 mg/kg bw per day), hematopoietic cell proliferation in the spleen (4.59 mg/kg bw per day), and bone marrow hyperplasia in male rats (6.49 mg/kg bw per day).
For cancer, the endpoints with the lowest PODs had a high incidence of tumours in the control group, making interpretation of the results difficult (Table 12). It is possible that malignant mesotheliomas occur spontaneously in rats and are thus unrelated to treatment (Tokarz et al., 2022). Therefore, the next lowest value, a BMDL10 of 3.32 mg/kg bw per day for increased combined incidence of malignant mesotheliomas in all organs of male rats, was selected as the POD. Note that the BMDL10 for this endpoint is 3 times lower than the lowest non-zero dose, which indicates that further data needs to be collected in this dose range; however, given that the BMD is in the observable range (greater than 3 times the lowest non-zero dose and less than the highest dose tested) the use of this BMDL10 is justified. The BMDL10 of 3.32 mg/kg bw per day is protective of both cancer and noncancer effects. Thus, a BMDL10 of 3.32 mg/kg bw per day for cancer is selected to derive an HBV for BDCAA using a linear approach (Section 3.0).
| Endpoint (NTP, 2015) |
Species | Sex | NOAEL/LOAEL (mg/kg bw per day) |
BMDL10 (mg/kg bw per day) |
Notes |
|---|---|---|---|---|---|
| HA multiple | Mouse | F | NA/17 | 2.70 | High incidence in controls (25/49), making interpretation of results difficult. BMDL 3× lower than lowest non-zero dose for only models that fit. |
| HA or HC | Mouse | F | NA/17 | 3.23 | High incidence in controls (36/49). BMDL is 3× lower than lowest non-zero dose, but BMD is within observable rangeTable 12 Footnote *. |
| HA or HC or HB | Mouse | F | NA/17 | 3.23 | High incidence in controls (36/49). BMDL 3× lower than lowest non-zero dose, but BMD is within observable rangeTable 12 Footnote *. |
| Malignant mesotheliomas - all organs | Rat | M | NA/11 | 3.32 | BMDL 3× lower than lowest non-zero dose for best fit model, but the BMD is within observable range* (multistage model). |
| HA | Mouse | F | NA/17 | 3.76 | High incidence in control group (33/49). BMDL 3× lower than the lowest non-zero dose but BMD is within observable rangeTable 12 Footnote *. |
| HC | Mouse | F | 17/34 | 5.88 | 8 models fit; selected one with lowest AIC. |
| HC or HB | Mouse | F | NA/17 | 7.20 | BMDL 3× lower than lowest non-zero dose, but BMD is within observable rangeTable 12 Footnote *. |
| HC | Mouse | M | NA/23 | 7.33 | 5 models fit, all with same BMDL. |
BMD – benchmark dose; BMDL10 – BMD limit 10% increased risk of developing toxicity; HA – hepatocellular adenoma; F – female; HA – hepatocellular adenoma; HB – hepatoblastoma; HC – hepatocellular carcinoma; LOAEL – lowest observed adverse effect level; M – male; Multiple – multiple incidences of tumours in an animal; NA – not available; NOAEL – no observed adverse effect level. Dose response data was analyzed using U.S. EPA BMDS online version (https://bmdsonline.epa.gov; version 3.3.0) to estimate the lower 95% confidence limit of the BMD associated with a 10% increased risk of developing toxicity (BMDL10); only those passing BMD modelling quality control criteria are reported.
|
|||||
Iodinated HAAs (I-HAAs)
No epidemiological or chronic studies linking I-HAA exposure with adverse effects in humans or animals are available. The limited toxicity data available for I-HAAs precludes the selection of a key study for the derivation of an HBV for these substances. New approach methods (NAMs) and mixture analysis may be helpful. In the absence of traditional toxicity data, quantitative in vitro to in vivo extrapolation (qIVIVE) was used to examine in vitro effect levels in relation to human exposure levels (Health Canada, 2021a).
An overview of the qIVIVE process is provided by Wetmore (2015). In brief, in vitro pharmacokinetic data (that is, metabolic stability, plasma protein binding and gut cell permeability) were collected and used to model a blood concentration at steady state (Css) for four I-HAAs using the approaches described in Pearce et al. (2017). Monte Carlo analysis was used to simulate population variability and to calculate the 95th percentile Css. In vitro toxicity data were then collected from the literature to determine the concentrations of I-HAAs, at which bioactivity was observed. Data on chronic mammalian cell cytotoxicity and bacterial cytotoxicity were used for the analyses (Richardson et al., 2008; Stalter et al., 2016). Reverse dosimetry was then used to estimate the human oral equivalent dose. This is the amount of a chemical that a person would need to be exposed to externally in order to achieve blood concentration levels that elicited activity in the in vitro toxicity assays.
The human oral equivalents, calculated based on the in vitro assay results, are listed in Table 13. The data show that MIAA is the most potent I-HAA and BIAA is the least potent based on all three assay results. When the derived human oral equivalent doses are compared to concentrations of I-HAAs to which humans are exposed through drinking water (Exposure Section 1.3), it is evident that human exposure levels are several orders of magnitude below those concentrations that would result in blood concentrations similar to those that elicited in vitro toxicity.
The interpretation of the qIVIVE undertaken for I-HAAs is limited by a lack of in vitro toxicity data in relevant systems that can accurately depict molecular initiating events following exposure to I-HAAs. There is also no abundant human exposure data to which the oral equivalent doses can be compared. However, the results of the qIVIVE process still provides an in vivo context to the in vitro data. NAMs such as qIVIVE could be used to inform relative potencies and mixture assessments and may be helpful as an initial tier in the future to prioritize chemicals for hazard and risk assessment. The columns showing oral equivalent doses are shaded.
| I-HAA | IVIVE FactorTable 13 Footnote a (mg/kg bw per day)/uM |
LTCTable 13 Footnote b (M) |
OED_LTC (mg/kg bw per day) |
LC50Table 13 Footnote c (M) |
OED_LC50 (mg/kg bw per day) |
EC50Table 13 Footnote d (M) |
OED_EC50 (mg/kg bw per day) |
|---|---|---|---|---|---|---|---|
| BIAA | 0.0935 | 0.0002500 | 23.36 | 0.000897 | 83.83 | 0.000160 | 14.95 |
| CIAA | 0.1280 | NA | NA | NA | NA | 0.000031 | 3.97 |
| DIAA | 0.0924 | 0.0001000 | 9.24 | 0.000332 | 30.68 | NA | NA |
| MIAA | 0.1344 | 0.0000005 | 0.07 | 0.000003 | 0.40 | 0.000017 | 2.28 |
BIAA – bromoiodoacetic acid; CIAA – chloroiodoacetic acid; DIAA – diiodoacetic acid; MIAA – monoiodoacetic acid; NA – not available; OED – oral equivalent dose (data from in vitro toxicity studies [LTC, LC50, EC50] were multiplied by an IVIVE conversion factor to arrive at the equivalent dose in humans).
|
|||||||
3.0 Derivation of the health-based value (HBV)
When possible, individual HBVs were derived (Table 14) using information from selected key studies, a linear or threshold approach (Section 2.5), and the standard approach for deriving the HBVs (Section 3.1). Since HAAs are a large group of DBPs with at least 13 distinct chemicals detected in disinfected drinking water and there is not enough scientific data available to derive HBVs for all HAAs, a mixture analysis was performed (Section 3.2). After analysis of all integrated key information, the mixture analysis recommended grouping the HAAs based on their carcinogenic MOA (non-direct DNA-reactive or direct DNA-reactive) and then using the HBV of the most potent index chemical (IC) for each subgroup:
- Subgroup – Non-direct DNA-reactive MOA (Cl-HAAs: MCAA, DCAA, TCAA): the HBV of the IC (DCAA) is 0.07mg/L (70 µg/L)
- Subgroup – Direct DNA-reactive MOA (Br-HAAs: MBAA, DBAA, TBAA, BCAA, CDBAA, BDCA): the HBV of the IC (DBAA) is 0.003 mg/L (3 µg/L)
These two HBVs were then considered with exposure, analytical and treatment considerations in the rationale for proposing a maximum acceptable concentration (MAC) for total HAAs (HAA6) in drinking water (Section 9.0).
3.1 Derivation of HBVs for individual HAAs
The key endpoint, POD, and low-dose extrapolation approach selected in Section 2.5 was used to derive an HBV for each individual HAA, if possible. Table 14 summarizes the HBVs derived using a threshold or a linear low-dose extrapolation approach, as follows:
Threshold approach for a non-carcinogenic substance or a non-direct DNA reactive carcinogen:
- A Human equivalent dose [HED = POD × ASF] is determined by applying an allometric scaling factor (ASF) for interspecies differences in susceptibility to the POD (ASF; 0.14 for mice, 0.26 for rats and 0.48 for rabbits; see footnote to Table 14 for calculation).
- The Tolerable daily intake [TDI = HED/UFT] is then derived by dividing the HED by the appropriate total uncertainty factors (UFT), indicated for each HAA in Table 14. Since an ASF was applied to the POD, the inter-species uncertainty factor was reduced from 10 (default) to 3 for all HAAs. A default uncertainty factor of 10 was applied for intra-species variability and a default uncertainty factor of 10 was applied for database deficiency.
- The HBV [HBV = (TDI × BW × AF)/WC] is then calculated by multiplying the TDI by the average body weight (BW) for an adult (74 kg; Health Canada, 2021b) and the default allocation factor (AF) of 0.8 or 80%. 80% was used as the proportion of exposure to the HAA from drinking water, as opposed to other environmental media, since drinking water is the main source of the contaminant (Krishnan and Carrier, 2013). The daily water consumption (WC) is the estimated daily volume of tap water consumed by an adult, 1.53 L (Health Canada, 2021b). Due to their physicochemical properties (Table 1) and experimental studies (section 2.1 absorption), showering or bathing in drinking water containing HAAs is not likely a significant source of exposure. Consequently, a multi-route exposure assessment, as outlined by Krishnan and Carrier (2008), was not performed.
Linear approach for a direct DNA-reactive carcinogen or a carcinogen with an unknown MOA:
- A cancer slope factor (CSF) is calculated by: [CSF = BMR0.1/HED], where the default 10% benchmark response (BMR0.1) is divided by the HED [as above, HED = POD × ASF].
- The HBV is then calculated by: [HBV = (1 x 10⁻⁵/CSF) × BW/WC], where the excess lifetime cancer risk of 1 x 10⁻⁵ (used when intake from drinking water is predominant) is divided by the CSF. BW and WC are as described above for the threshold approach.
| HAA | Key endpoint Section 2.5 (Reference) |
POD and HED (mg/kg bw per day); HED = POD × ASF |
Low-dose extrapolation approach TDI = HED/UFT OR CSF = BMR0.1/HED |
HBV (mg/L) = (TDI × BW × AF)/WC OR = (10−5/CSF) × BW/WC |
|---|---|---|---|---|
MCAA |
Systemic toxicity and no incidence of cancer in rats (DeAngelo et al., 1997) |
3.5 NOAEL 0.91 HED = 3.5 × 0.26 |
TDI: 0.003 mg/kg bw per day = 0.91/300 [x3 inter- x10 intra-species variation, x10 database deficiency] | 0.12 = (0.003 × 74 × 0.8)/1.53 |
DCAA |
Hepatic adenomas and carcinomas in mice (Bull et al., 2002) |
3.6 BMDL10 0.50 HED = 3.6 × 0.14 |
TDITable 14 Footnote a: 0.0017 mg/kg bw per day = 0.50/300 [x3 inter- x10 intra-species variation, x10 database deficiency] |
0.07 = (0.0017 × 74 × 0.8)/1.53 |
TCAA |
Neoplastic and non-proliferative lesions in male mice (DeAngelo et al., 2008) |
6 BMDL10 0.85 HED = 6 × 0.14 |
TDITable 14 Footnote a: 0.0028 mg/kg bw per day = 0.85/300 [x3 inter- x10 intra-species variation, x10 database deficiency] |
0.11 = (0.0028 × 74 × 0.8)/1.53 |
MBAA |
DD |
DD |
DD |
DD |
DBAA |
Tumours in mice (NTP, 2007a) |
4 NOAEL 0.57 HED = 4 × 0.14 |
CSF: 0.176 = 0.1/0.57 |
0.00275Table 14 Footnote b= (10−5)/0.176 x 74/1.53 |
DBAA |
Male rabbit reproduction (Veeramachaneni et al., 2007) |
1 LOAEL 0.48 HED = 1 × 0.48 |
TDI: 0.00016 mg/kg bw per day = 0.48/3 000 [x10 used LOAEL, x3 inter- x10 intra-species variation, x10 database deficiency] |
0.01 = (0.00016 × 74 × 0.8)/1.53 |
TBAA |
DD |
DD |
DD |
DD |
BCAA |
Hepatoblastomas in male mice (NTP, 2009) |
7.07 BMDL10 1.00 HED = 7.07 × 0.14 |
CSF: 0.1 = 0.1/1.00 |
0.00485Table 14 Footnote c= (10−5)/0.1 × 74/1.53 |
CDBAA |
Male rat reproduction; no cancer studies (NTP, 2000) |
62 NOAEL 16.12 HED = 62 × 0.26 |
TDI: 0.00537 mg/kg bw per day = 16.12/3 000 [x3 inter- and x10 intra-species variation, x10 short-term study (default), x10 database deficiency] |
0.21Table 14 Footnote c= (0.00537 × 74 × 0.8)/1.53 |
BDCAA |
Malignant mesotheliomas in all organs of male rats (NTP, 2015) |
3.32 BMDL10 0.87 HED = 3.32 × 0.26 |
CSF: 0.1149 = 0.1/0.87 | 0.00421 = (10−5)/(0.1 × 74)/1.53 |
I-HAAs |
DD |
DD | DD | DD |
AF – allocation factor (0.8 or 80% exposure through drinking water over other sources, Krishnan and Carrier, 2013); ASF – allometric scaling factor for interspecies differences in susceptibility [for mice 0.14 = (0.03 kg/74kg)1/4; rats 0.26 = (0.35 kg/74kg)1/4; rabbits 0.48 = (4 kg/74kg)1/4]; BCAA – bromochloroacetic acid; BDCAA – bromodichloroacetic acid; BMD – benchmark dose; BMDL10 – benchmark dose limit 10%; BMR – benchmark response (0.1, 10%); BW – body weight (74 kg; average for an adult, Health Canada, 2021b); CDBAA – chlorodibromoacetic acid; CSF – cancer slope factor; DBAA – dibromoacetic acid; DCAA – dichloroacetic acid; DD – database deficient; HBV – health-based value; HED – human equivalent dose; I-HAAs – iodinated-HAAs; LOAEL – lowest observed adverse effect level; MBAA – monobromoacetic acid; MCAA – monochloroacetic acid; NOAEL – no observed adverse effect level; POD – point of departure; TBAA – tribromoacetic acid; TCAA – trichloroacetic acid; TDI – tolerable daily intake; UFT – uncertainty factor total (since ASF was used, the inter-species uncertainty factor was reduced from 10 to 3); WC – daily water consumption (1.53L estimated daily volume of tap water consumed by an adult, Health Canada, 2021b); 10-5 – excess lifetime cancer risk of 10-5 (used when intake from drinking water is predominant)
|
||||
3.2 Mixture analysis
In drinking water, HAAs often occur as a mixture with each other and other DBPs. Based on the toxicity database for mixtures of HAAs, the approach for a mixture assessment is not clearly evident (Appendix D for epidemiology studies and Appendix F, Table F1 for animal studies). The majority of available studies investigated reproductive and/or developmental effects of HAAs when administered as a combination of two, three or five. In almost all cases, the toxicity of HAAs was additive when administered as a mixture (Andrews et al., 2004; Kaydos et al., 2004; Hassoun et al., 2013, 2014).
A “Combined exposure to multiple substances (Mixture) Risk Assessment” (Appendix F: Mixture Analysis) found evidence that combined exposure to some or all HAAs had potential for adverse effects in humans and to cause toxicity in a similar way or affect the same organ(s). A mixture risk assessment is appropriate for subgroups of HAAs, rather than consideration of all 13 HAAs together, since it is not reasonable to assume MOAs for all HAAs are the same (Section 2.4). Therefore, HAAs should be subgrouped based on their carcinogenic MOAs (direct DNA-reactive vs. non-direct DNA-reactive). Exposure and hazard information should be compared for risk characterization using a response addition method. Two response addition methods for combining the exposure and hazard information for the mixture of HAAs could be used.
- The first method is simple and conservative whereby it assumes that the HAAs within each subgroup have equivalent potencies to the most toxic member (IC) and then adds the total exposures measured for each HAA within the subgroup. This total exposure value is then compared to the HBV for the subgroup IC.
- The second Combined Relative Potency Factor (CRPF) method derives IC effective doses (ICEDs) for each subgroup HAA component before adding them (Appendix F, Table F3). The subgroup ICED can then be compared to the HBV of the IC for each subgroup. If the subgroup ICED < HBV of the IC, then the combined risk is considered acceptable.
For the non-direct DNA-reactive subgroup (MCAA, DCAA, TCAA), the HBV of the IC (DCAA) is 0.07mg/L (70 µg/L); for the direct DNA-reactive subgroup (DBAA, MBAA, TBAA, BCAA, CDBAA, BDCAA) the HBV of the IC (DBAA) is 0.00275 mg/L (3 µg/L).
4.0 Analytical and HAA formation considerations
4.1 Analytical methods
4.1.1 Standardized methods to detect haloacetic acids
Standardized methods available for the analysis of HAAs in drinking water and their respective method detection limits (MDLs) are summarized in Table 15. MDLs are dependent on the sample matrix, instrumentation, and selected operating conditions and will vary between individual laboratories. These methods are subject to a variety of interferences, which are outlined in their respective references.
The analytical methods in Table 15 measure the concentration of individual HAA compounds in the sample. The total HAA concentrations are calculated by summing the individual HAA concentrations.
Accredited laboratories in Canada were contacted to determine MDLs and method reporting limits (MRLs) for HAAs analysis. The MDLs were in the same order of magnitude as the range of those reported in Table 15. The MRLs ranged from 0.5 to 10 µg/L for MCAA; 0.5 to 5 µg/L for DCAA; 0.5 to 5 µg/L for TCAA; 0.5 to 5 µg/L for MBAA; 0.5 to 5 µg/L for DBAA; and 0.5 to 5 µg/L for BCAA (AGAT Laboratories, 2020; City of Winnipeg, 2020; Metro Vancouver Laboratory, 2020; Ontario Ministry of the Environment, Conservation and Parks, 2020; RPC, 2020; Saskatchewan Research Council, 2020). Of the accredited laboratories contacted, only one provided MDLs for BDCAA (0.3 µg/L), CDBAA (0.15 µg/L), and TBAA (0.30 µg/L) (Ontario Ministry of the Environment, Conservation and Parks, 2020). The DLs from provincial and territorial data are from 0.3 to 10 µg/L for MCAA; 0.2 to 10 µg/L for DCAA; 0.2 to 6 µg/L for TCAA; 0.15 to 6 µg/L for MBAA; 0.3 to 6 µg/L for DBAA; 0.15 to 10 µg/L for BCAA; 0.3 to 0.5 µg/L for TBAA; 0.15 to 1 µg/L for CDBAA; and 0.3 to 0.5 µg/L for BDCAA (see Table 15).
Drinking water treatment system operators should discuss sampling requirements with the accredited laboratory conducting the analysis to ensure that quality control procedures are met. MRLs need to be low enough to ensure accurate monitoring at concentrations below the MAC.
| Method (Reference) |
Methodology | MDL(µg/L) | Interferences/Comments |
|---|---|---|---|
EPA 552.1 Rev. 1.0 (U.S. EPA, 1992) |
Ion-Exchange Liquid-Solid Extraction and Gas Chromatography with an Electron Capture Detector (IX/LSE-GC/ECD) |
|
Sulfate ion can cause inferences. |
EPA 552.2 Rev. 1.0 (U.S. EPA, 1993) |
Liquid-Liquid Extraction and Gas Chromatography with an Electron Capture Detector (LLE-GC/ECD) |
|
Potential interference with phthalates and other organic substances from sodium sulfate. |
EPA 552.3 Rev. 1.0 (U.S. EPA, 2003b) |
Liquid-Liquid Microextraction and Gas Chromatography with an Electron Capture Detector (LLME-GC/ECD) |
|
Potential interference with phthalates and other organic substances from sodium sulfate. Substitution of H2SO4Cl can promote formation of brominated HAAs. Unchlorinated field samples should be extracted as soon as possible. |
EPA 557 (U.S. EPA, 2009) |
Ion Chromatography Electrospray Ionization Tandem Mass Spectrometry IC-ESI-MS/MS |
|
Chlorite anion may cause suppression of MCAA. CDBAA and TBAA may degrade during storage at higher pH and temperature between 25 oC and 30 oC. |
Standard Method (SM): SM 6251B (APHA et al., 2023) |
Micro Liquid-Liquid Extraction and Gas Chromatography (MLLE-GC) |
|
None |
BCAA – bromochloroacetic acid; BDCAA – bromodichloroacetic acid; CDBAA – chlorodibromoacetic acid; DBAA – dibromoacetic acid; DCAA – dichloroacetic acid; MBAA – monobromoacetic acid; MCAA – monochloroacetic acid; MDL – method detection limit; TBAA – tribromoacetic acid; TCAA – trichloroacetic acid.
|
|||
4.1.2 Sample preservation and preparation
Sample processing considerations for analysis of HAAs in drinking water (that is, sample preservation, storage) using U.S. EPA methods can be found in the references listed in Table 15. In addition, SM 6010B provides guidance on sample collection and preservation for the methods listed in the standard methods manual (APHA et al., 2023). Appropriate sample handling procedures are essential to obtain accurate, precise, and reliable data on HAA occurrence and formation.
Once a sample is taken, it is critical to stop disinfectants from further reacting with precursors to form more HAAs prior to analysis. This is generally achieved by adding reducing (quenching) agents in excess to the water samples. Quenching agents are listed in the analytical methods presented in Table 15. HAAs are biodegradable, therefore unchlorinated field samples should be extracted as soon as possible to prevent biological degradation of analytes (U.S. EPA, 2009).
4.1.3 Online and portable meters
Automated analyzers have been developed for quantifying individual HAA compounds and total HAAs (Foundation Instruments, 2025). Portable analyzers are currently not available for HAA analysis. Colorimetric Hach THM Plus method can be used operationally to estimate tri-HAAs. This method has been demonstrated to have good correlation with standardized methods and has been used in small-scale systems (Ali et al., 2019).
Commercial online and portable total organic carbon (TOC) analyzers, which were specifically designed for the drinking water industry, are also available. These analyzers are intended for both raw and finished water monitoring and can measure organics at treatment plants or within distribution systems. These analyzers recover difficult-to-oxidize organic compounds, such as humic acid, and detect organics of all molecular weights (MWs) and chemical structures, including complex aromatics. Analysis is based on ultraviolet (UV) persulfate oxidation with membrane conductivity detection. Automatic calculations of TOC % removal for influent and effluent streams by the TOC analyzers can support HAA regulatory compliance. The TOC analysis can help optimize chemical dosing for coagulation, flocculation and other processes.
Based on the assumption that THM concentrations are proportional to the concentration of other DBP classes and that THM formation kinetics are similar to those of tri-HAAs, the analyzers for THM quantification can be beneficial for better understanding HAA formation. Site-specific relationships between THMs and HAAs may be established and calibrated. These commercial online and portable analyzers can be used to obtain a rapid or near-continuous indication of THM concentrations. They can also be used to determine the potential of treated waters to form THMs in the distribution system. Real-time monitoring of THMs at various locations in distribution system will allow for:
- optimization of treatment processes at the treatment plant
- more targeted and effective treatment plant operation
- identification of problematic areas (for example, inorganic/organic pipe deposits that cause increased levels of THM formation)
- determination of flushing location and time in distribution system
- water age evaluation in key locations in the distribution system
To ensure accurate measurements using these TOC and THM analyzers, water treatment systems should develop a quality assurance and quality control program. This program should include periodic verification of results using an accredited laboratory. These devices should be calibrated according to the manufacturer’s instructions. Water treatment plant managers should check with the responsible drinking water authority to determine whether results from these units can be used for compliance reporting.
4.1.4 HAA formation potential tests
Water treatment plants need to understand the source-specific reactivity of NOM when selecting a disinfectant to mitigate the formation of HAAs (Hua and Reckhow, 2007a). Source-specific treatability studies, including HAA formation potential (FP) methods, should be conducted when evaluating different mitigation measures and/or alternative treatment options. The FP methods are intended to evaluate water sources or water treatment processes, or to predict HAA concentrations in the distribution system. All methods require control of certain parameters to obtain reproducible and meaningful results. These parameters include water temperature, pH, reaction time and free chlorine doses and residuals (or monochloramine for simulated distribution system [SDS] tests) (Symons et al., 1981; Koch et al., 1991; Sketchell et al., 1995; Summers et al., 1996, APHA et al., 2023).
Different methods to evaluate HAA FP along with test conditions and various considerations are presented in Table 16. FP test methods that use very high chlorine doses may not correctly evaluate difference in FP in water with bromide. This is because chlorine can out-compete bromine when in excess. For HAA FP, the mass concentration increased in presence of bromide. However, unlike with THMs, the HAA molar concentration remained about the same (Bond et al., 2014). Uniform formation conditions (UFC) tests utilize a typical chlorine dose and enable the direct comparison of results to assess the effectiveness of various treatment options (Summers et al., 1996; AWWA, 2011).
| Methods | Test conditions: Chlorine residual at the end of test | Test conditions: pH/T °C/Reaction time | Comments/Limitations/Considerations |
|---|---|---|---|
SM 5710 D Haloacetic Acid Formation Potential (HAA FP) (APHA et al., 2023) |
3–5 mg/L chlorine residual |
Standard reaction conditions: 7.0 ±0.2/ 25 °C/ 7 days |
|
SM 5710 D Simulated Distribution System Haloacetic Acids (SDS-HAA) (APHA et al., 2023) |
Sample is disinfected so as to be comparable to finished drinking water |
Test conditions (for example, temperature, pH, incubation time, bromide concentration, disinfectant dose and residual concentration) mimic local distribution system conditions |
|
Uniform Formation Conditions (UFC) test (Summers et al., 1996) |
1.0 ± 0.4 mg/L chlorine residual |
8.0 ±0.2/ 20 °C/ 1 day |
|
Hold Study (Alexander et al., 2019) |
Evaluated as part of test |
DWDS pH/DWDS temperature/ 0.6, 12, 24, 48 and 96 hours |
|
| Br-HAA – brominated haloacetic acids; DWDS – drinking water distribution system; HAA – haloacetic acids. | |||
4.2 Operational indicators of HAA formation
There are various operational parameters that can be used as indicators of HAA formation. These are not to be used for compliance to the MAC. However, these indicators provide alternative parameters that can be measured. Depending on the indicator, it may be measured more frequently and provide operators with additional information that may assist in the management of HAAs. For example, NOM has been characterized by surrogate parameters such as TOC, dissolved organic carbon (DOC) or UV absorbance (Reckhow et al., 2007; Health Canada, 2020). TOC and DOC are more related to the quantity of organic carbon. UV-visible light absorbance at 254, 350 and 440 nm can be linearly correlated to DOC concentration in some freshwater systems. The measurement of UV254 has historically been used in the water industry, providing valuable information to operators about pending impacts to the coagulant dose.
4.2.1 Chlorine demand
DBP formation during chlorination is directly related to chlorine demand. Gang et al. (2002) provide a simple mechanistic model to predict total THM and HAA9 formation based on chlorine demand. For surface waters subjected to alum coagulation, the average total THM and HAA9 yield coefficients were 30 μg TTHM/mg Cl2 and 17 μg HAA9/mg Cl2 consumed, respectively. This DBP predictive model can be readily calibrated to local conditions.
4.2.2 Specific UV absorbance
Specific UV absorbance (SUVA) is defined as UV absorbance at 254 nm (m-1) divided by the DOC concentration (mg/L) (AWWA, 2011; Hua et al., 2015). While UV absorbance reflects more the bulk concentration of aromatic precursors, SUVA is used as an operational indicator of the reactivity of DBP organic precursors such as aquatic humic substances (Reckhow et al., 2007; Hua et al., 2015; Health Canada, 2020). SUVA is not a strong indicator of the overall DOC reactivity, especially for waters with low humic content, considering that non-humic substances may also play an important role in HAA formation. Chowdhury (2013) demonstrated that higher MW NOM (greater than 1 kDa) was strongly correlated with DOC and SUVA, while SUVA may not effectively characterize NOM with lower MW (less than 1 kDa). Different species of HAAs can show different relationships with SUVA. Frequently, studies segregate HAA9 to mono-HAAs (MCAA and MBAA), di-HAAs (DCAA, DBAA and BCAA) and tri-HAAs (TCAA, TBAA, BDCAA and CDBAA) (Cowman and Singer, 1996; Bond et al., 2014). Tri-HAA concentrations correlated strongly with SUVA, whereas weak correlations were observed between SUVA and di-HAA yields during chlorination in Hua et al. (2015) study. It was concluded that these two groups of HAAs should be evaluated separately to better identify their precursors and control their formation. Moreover, the use of different disinfectant (that is, chlorination vs. chloramination) can alter the correlation between SUVA and DBP formation in the same source water. Hua et al. (2015) demonstrated that chloramines can react with organic precursors with a wider SUVA range to form DBPs in comparison with chlorine.
In general, high SUVA sources (greater than 4 L/mg∙m) have NOM that is amenable to coagulation. However, the hydrophilic neutral fraction can have a high SUVA, which can be misleading with respect to the potential for organic carbon removal using coagulation (Health Canada, 2020). Low SUVA sources tend to have NOM that is not amenable to coagulation (Pernitsky, 2003). If the post-coagulation DOC residual remains reactive with respect to HAA formation, other technologies targeting the removal of specific NOM fractions may be necessary (Bond et al., 2011).
4.2.3 Differential UV absorbance
Differential UV absorbance (DUVA) evaluates the difference in UV absorbance at specific wavelengths before and after chlorination that can be correlated to DBP occurrence (Guilherme and Dorea, 2020). DUVA at wavelengths near 272 nm has been used to track the halogenation of NOM (Roccaro and Vagliasindi, 2009). The differential spectra generated during chlorination of NOM-containing waters have some common features. For example, the sign of differential absorbance is always negative as chlorination decreases the absorbance of NOM. Most importantly, DUVA is well correlated with the concentration of total organic halogen (TOX) formed in water. However, this parameter is not a predictive parameter. It reflects more the extent to which NOM has been changed by chlorination (Korshin et al., 2002).
Several bench-scale studies determined relationships between DUVA and various DBPs (for example, THMs and HAAs) before and after chlorination, with good correlation (Korshin et al., 2002; Roccaro and Vagliasindi, 2009; Beauchamp et al., 2018; Guilherme and Dorea, 2020). These studies found that the relationship was site-specific and found to vary seasonally. However, it was not determined if they varied from year to year (Beauchamp et al., 2018). The DUVA-DBP relationships determined at full-scale were found to differ from those seen at lab-scale. A bench-scale study by Guilherme and Dorea (2020) indicated the importance of developing this relationship at a range of DBP concentrations that would be expected to occur.
4.2.4 Fluorescence spectroscopy
Fluorescence spectroscopy is a low-cost, non-destructive, sensitive, and selective technique that can provide critical information on the molecular properties of complex fluorescent dissolved organic matter (FDOM) (Fernández-Pascual et al., 2023). A fluorescence excitation-emission matrix (EEM) contains a large amount of information on FDOM composition and structure, which can be correlated with DBP formation. Advanced statistical and computational techniques, such as parallel factor analysis (PARAFAC), have been developed to analyze multi-dimensional fluorescence data for exploration of the patterns within fluorescence spectra (Bridgeman et al., 2011). The EEM-PARAFAC components can be classified according to their wavelength pairs into the five environmental fluorescence regions: humic-like, fulvic-like, microbial humic-like, tyrosine-like, and tryptophan-like regions. Fernández-Pascual et al. (2023) summarized EEM-PARAFAC and DBP data reported in 45 studies and established 218 statistically significant linear relationships with one or more DBP classes. The results showed that THMs and HAAs exhibited strong, recurrent relationships with ubiquitous humic/fulvic-like FDOM components, highlighting their potential as surrogates for carbonaceous DBP formation. In situ or online fluorescence spectroscopy has been developed for water analysis and has proven to be a reliable and fast monitoring tool in quantifying aquatic dissolved organic matter (DOM) from autochthonous, allochthonous, or anthropogenic sources (Carstea et al., 2020).
4.2.5 Total organic halogen (TOX) and unknown TOX (UTOX)
TOX is used to characterize the incorporation of a halogen into organic molecules (Kristiana et al., 2009). TOX would include THMs, HAAs, haloacetonitriles and any other known or unknown halogenated DBP. TOX is a parameter used in some studies to assess overall impact of a treatment or operational change on all halogenated DBPs. It has been shown that THMs and HAAs collectively account for about 50% of the TOX in chlorinated water and about 20% of the TOX in chloraminated water (Hua and Reckhow, 2007b). Unknown TOX (UTOX) represents the unknown halogenated DBPs in the water.
4.3 Source water considerations
Each water source in Canada has unique features and characteristics that can vary significantly from one region to another depending on the regional geological conditions and the surrounding watershed (Health Canada, 2020). Many factors affect the formation of HAAs, but the concentration and characteristics of NOM may have the most significant influence on the generation of DBPs (Chang et al., 2001; Jung and Son, 2008).
Although NOM concentrations are typically lower in groundwater than in surface water, concentrations of organic carbon vary widely (less than 0.1–22 mg/L) in North American groundwaters as they can flow through aquifer materials that are rich in organic matter (Health Canada, 2020). It is therefore important to also characterize groundwater as some sources can have elevated NOM concentrations.
Since NOM characteristics vary with time and can be greatly affected by local conditions, seasonal variations and climate change, source water should be characterized as part of routine system assessments.
4.3.1 NOM speciation
NOM in raw water consists of hydrophobic and hydrophilic fractions that can be categorized based on their acid/neutral/base properties. Hydrophilic acids can also be reported as transphilic NOM (Health Canada, 2020). Hydrophobic fractions like humic acid and fulvic acid are expected to have a higher distribution proportion in surface waters; however, hydrophilic fraction concentrations have been increasing in the last decades due to anthropogenic activities (Chang et al., 2001). With rising water demand, water treatment systems are increasingly treating surface waters, which are more impacted by algae and municipal wastewater (Xue et al., 2014). The wastewater increases DBP precursors in the receiving water, leading to an increase in DBP formation in drinking water (Chu et al., 2002; Chen et al., 2009; Liu et al., 2014).
4.3.2 Seasonal changes
An increase in NOM concentration and a change in its character have been reported following snowmelt, spring runoff or heavy rain (Health Canada, 2020). The highest NOM concentrations can occur during the seasons with warmer temperatures, higher biological activity, and high-intensity/short-duration rainstorms (Aitkenhead-Peterson et al., 2003). Rainfall events can result in overland flow of contaminants to surface water. This is offset by increased flowrate resulting in dilution (Clark et al., 2007). Changes in NOM quality and quantity during and after rainfall events can lead to HAA variations in the distribution system (Delpla and Rodriguez, 2016). Generally, higher TOC was found in filtered water during and after rainfall events. This resulted in a need to increase chlorine and alum doses to compensate for these changes (Table 17).
| Location | Systems | Parameter | Comments | Reference |
|---|---|---|---|---|
Quebec 4 spring rainfall events |
2 systems |
HAA6 |
Rainfall events had less noticeable impact on HAA formation potential in raw waters in comparison to THMs. Following rainfall, the organic carbon reactivity of filtered waters (SDS tests) increased resulting in a two-fold increase in HAA concentrations for waters representing the end of distribution system (20-hour contact time). Br-HAA proportion decreased during and after rainfall with a rise in DCAA and TCAA. |
Delpla and Rodriguez (2016) |
Quebec 4 spring rainfall events |
1 system |
Chloride and Bromide |
In general, levels remained constant during the three hydroclimatic periods. Potential leaching of road salts during rainfall. Rainfall dilution effect is partly offset by chloride and bromide transported to river. |
Delpla and Rodriguez (2017) |
Quebec 4 spring rainfall events |
1 system |
TOC |
Somewhat higher during and after rainfall causing increased chlorine demand and alum dose. |
Delpla and Rodriguez (2017) |
Quebec 4 spring rainfall events |
1 system |
HAA6 |
Small increase in HAA6 levels in treated waters during and after rainfall event (from <9 µ/L to 12.6 µg/L). DCAA was a predominant specie (47%–58%) followed by TCAA (20%–31%) and MCAA (7%–24%). A slight decrease in Br-HAA proportion following rainfall events. Increased loads of bromide due to the intensification of rainfall events could lead to an increase in Br-DBP formation in future. |
Delpla and Rodriguez (2017) |
| Br-DBPs – brominated DBPs; Br-HAAs – brominated HAAs; DBP – disinfection by-product; DCAA – dichloroacetic acid; HAA – haloacetic acid; HAA6 – sum of MCAA, DCAA, TCAA, MBAA, DBAA and BCAA; MCAA – monochloroacetic acid; QC – Quebec; TCAA – trichloroacetic acid; THM – trihalomethane; TOC – total organic carbon; SDS – simulated distribution system. | ||||
So et al. (2017) observed the seasonal variations in the NOM composition of the source water of Lake Paldang, Korea for three years. Even though the average DOM concentration in the source water was not significantly different between summer and winter, the distribution of NOM components varied seasonally. For example, biopolymer concentrations were higher in winter, while low-MW neutrals and acids were higher in summer, which was explained by enhanced biodegradation and phototransformation during summer months. The biopolymer fraction mainly originated from autochthonous sources. It was the most readily available biodegradable fraction, especially during warm temperatures but less biodegradable at low temperatures. DOM exposure to simulated sunlight can cause decrease of average molecular mass and aromaticity (Niu et al., 2019).
4.3.3 Climate change impacts
More and more attention is given to the impact of climate change on water resources. Linden et al. (2018) suggests that the most likely climate-related risks to water quality are algal growth, increased turbidity, and increased DOC loads. Pagano et al. (2014) discussed in detail two hypotheses that can explain an increasing DOC trend. The reduction in acidic deposition and consequences inherent to climate change (for example, increasing temperatures, unpredictable weather, increasing atmospheric CO2, etc.) are the two key considerations. The reduction in acidic deposition has resulted in the recovery of pH (increased) and acid neutralization capacity (alkalinity) of surface waters. Increases in NOM concentrations and in NOM hydrophobicity have been associated with this recovery in water quality (Anderson et al., 2023), whereas consequences inherent to climate change cause higher DOC concentrations and the accumulation of degrading biomass in surface waters (Pagano et al., 2014).
Seidel et al. (2013) reported high spikes in HAA5 at four water treatment plants of the Cleveland Division of Water in the summer and fall of 2006. Since no significant changes were observed in TOC, SUVA, or treated water pH values, it was hypothesized that the high HAA5 concentrations were due to changes in the character of the DOM in the water. In 2006, Cleveland and the Lake Erie region experienced an unusually warm winter with subsequent higher water temperatures. Since warmer water temperatures can contribute to increased algal blooms, it was hypothesized that the algal blooms may have changed DOM characteristics in the lake water resulting in higher HAA5 formation in the treated water.
Studies showing impacts of extreme events on HAA formation are presented in Table 18. More detailed discussion of potential impacts to NOM from climate change can be found elsewhere (Ritson et al., 2014; Anderson et al., 2023). Source water changes from extreme weather events may benefit from early warning systems, allowing for treatment to be adjusted accordingly (Barry et al., 2016).
| Event | Systems | Parameter | Comments | Reference |
|---|---|---|---|---|
North Carolina and South Carolina flooding (2016) |
18 sub-watersheds |
HAA5 FP |
The average HAA FP was not significantly different between the flooding and baseflow conditions. This can be attributed to the increase in abundance of hydrophobic compounds under flooding conditions, which favour more THM formation. |
Majidzadeh et al. (2020) |
Hurricane Matthew (2016) |
2 sites |
HAA5 FP |
Increased continuously for up to 17 days after max rainfall. From 404.3 to 2 380 μg/L at one site (488% increase). From 1 460 to 2 760 μg/L at another site (89% increase). Both followed by gradual decline. |
Majidzadeh et al. (2020) |
Hurricane Joaquin (2015) |
Water collected from river |
HAA FP |
October 4 – around 2000 μg/L October 6 – peak discharge October 22 – maximum of 5772 μg/L November 30 – 3 751 μg/L indicating HAA FP remained high for a prolonged period after peak discharge and had long-term impacts. |
Ruecker et al. (2017) |
North California 2 fires (2015) |
3 watersheds (burn areas: 0%, 20% and > 90%) |
HAA9 FP |
Higher in short term (< 1 year) in the > 90% burned area. Elevated bromide concentration shifted HAA speciation to Br-HAAs for up to 2 years. Overall Br-HAAs decreased with subsequent rainfalls and flushes as bromide concentration decreased. |
Uzun et al. (2020) |
| Br-HAAs – brominated HAAs; FP – formation potential; HAA – haloacetic acid; HAA5 – sum of MCAA, DCAA, TCAA, MBAA and DBAA; MCAA – monochloroacetic acid; HAA9 – sum of HAA5 and BCAA, TBAA, CDBAA, BDCAA; THM – trihalomethane. | ||||
4.4 HAA formation
Chlorinated DBPs like HAAs and THMs are formed when chlorine reacts with organic and inorganic precursors. The type and amount of HAAs that form depend on numerous factors such as:
- Organic precursors (for example, NOM)
- Inorganic precursors (for example, bromide and iodide)
- The oxidation and disinfection strategy
- pH
- Water temperature
- Reaction time (Liang and Singer, 2003; Baribeau et al., 2006; Srivastav et al., 2020)
4.4.1 Organic precursors
NOM is an extremely complex mixture of organic compounds that can impact processes designed to remove or inactivate pathogens, contribute to the formation of DBPs and favour the development of biofilms in the distribution system. The treatability and reactivity of NOM varies significantly in Canada, as each water source has unique features. It is important to understand variations in NOM concentrations and character to select, design and operate appropriate water treatment processes and disinfection practices, to control HAA formation. More detailed information on NOM, its characterization and its impact on drinking water and treatment can be found elsewhere (Health Canada, 2020).
When NOM is characterized using surrogate parameters (for example, DOC, UV absorbance), the measurements can be applied to isolated NOM fractions. These fractions are typically separated based on different chemical and physical properties, such as hydrophobicity and molecular size (Reckhow et al., 2007). Fractionation and molecular characterization of NOM can help to better understand the extent of DBP formation in different types of waters and at different times of the year and the interaction of different NOM fractions with treatment processes (Reckhow and Singer, 2011; Health Canada, 2020). For example, hydrophilic and lower MW fractions are more likely to pass through conventional treatment processes and produce DBPs when disinfectants are added. Additionally, a change of disinfectant and/or pre-oxidant will alter the amount and type of HAAs formed from different NOM fractions.
Reckhow et al. (2007) studied the relationship of HAA formation to precursor hydrophobicity and molecular size under chlorination and chloramination. Three geographically and chemically distinct natural waters from drinking water treatment plant intakes were collected, fractionated and analyzed. These waters represent a wide range of DOC and SUVA levels. The authors found that decreasing raw water SUVA levels corresponded to an increase in the percentage of transphilic and hydrophilic carbon. This result indicated that hydrophilic NOM becomes a more important fraction for low SUVA waters. For all three waters, fractions with MWs higher than 3 kDa had the highest SUVA values, while fractions with MWs lower than 0.5 kDa consistently had the lowest SUVA values.
The samples were also analyzed for the molar yields of di-HAAs and tri-HAAs after chlorination (see Table 19) and chloramination. For chlorination, no significant trend between MW distribution and tri-HAA formation was evident, in particular for low humic content water. For all chlorinated waters, the MW less than 0.5 kDa fractions gave the highest di-HAA yields, and di-HAAs were the major DBPs identified in all chloraminated NOM isolates. No significant difference was observed for the di-HAA yields between NOM fractions of each chloraminated water. Tri-HAAs were negligible compared to di-HAA concentrations in chloraminated samples. In general, chlorine produces higher concentrations of all HAA species than any of the other disinfectants (that is, monochloramine, chlorine dioxide). Hua and Reckhow (2007b) demonstrated that tri-HAA formation was significant only with chlorination. Monochloramine and chlorine dioxide produced little or no tri-HAAs (less than 2 μg/L) in seven diverse natural waters. The di-HAAs formed by monochloramine and by chlorine dioxide were 15% to 29% and 9% to 21%, respectively, of those formed by free chlorine. It is important to note that there is the potential for formation of other DBPs, such as N-nitrosodimethylamine, bromate and chlorate/chlorite, when using alternative disinfectants and/or oxidants (Health Canada, 2008, 2011, 2018).
| Raw water | NOM fractions as di-HAA and tri-HAA precursors: Hydrophobic | NOM fractions as di-HAA and tri-HAA precursors: Transphilic | NOM fractions as di-HAA and tri-HAA precursors: Hydrophilic |
|---|---|---|---|
Winnipeg, Manitoba DOC: 7.8 mg/L SUVA254: 1.8 L/mg∙m |
Similar tri-HAA yields with other fractions; the lowest di-HAA yields |
Similar tri-HAA yields with other fractions; lower di-HAA yields |
Similar tri-HAA yields with other fractions; the highest di-HAA yields |
Waco, Texas DOC: 4.0 mg/L SUVA254: 2.9 L/mg∙m |
The highest tri-HAA yields; the lowest di-HAA yields |
Tri-HAA yields lower in comparison to hydrophobic fraction; higher di-HAA yields than from hydrophobic fraction |
The lowest tri-HAA yields (38% decrease from hydrophobic yields); the highest di-HAA yields |
Repentigny, Quebec DOC: 7.1 mg/L SUVA254: 4.4 L/mg∙m |
The highest tri-HAA yields; higher di-HAA yields than from transphilic fraction |
Tri-HAA yields lower in comparison to hydrophobic fraction; the lowest di-HAA yields |
The lowest tri-HAA yields (56% decrease from hydrophobic yields); the highest di-HAA yields |
Di-HAAs – dihaloacetic acids; DOC – dissolved organic carbon; HAAs – haloacetic acids; NOM – natural organic matter; SUVA – specific ultraviolet absorbance; Tri-HAAs – trihaloacetic acids. Source: Reckhow et al. (2007) |
|||
Studies have reinforced the hypothesis that di-HAAs and tri-HAAs form through different precursors and reaction pathways (Reckhow et al., 2007; Hua and Reckhow, 2007a, 2008, 2013; Hua et al., 2015). Hydrophilic and low-MW NOM fractions have been shown to produce the highest di-HAA yields, suggesting that these fractions were more significant di-HAA precursors than hydrophobic and high-MW carbons (Reckhow et al., 2007). However, in high SUVA waters, high di-HAA yields have also been observed for hydrophobic NOM during chlorination (Liang and Singer, 2003; Hua and Reckhow, 2007a).
When comparing the speciation of HAAs during chlorination and chloramination, Hong et al. (2013) showed that di-HAAs (average 48.8%) and tri-HAAs (average 46.4%) were the dominant HAAs species in chlorinated water, whereas mono-HAAs were detected mostly in trace amount (average less than 5%). For chloraminated water, the yields of di-HAAs (average 68%) were much higher in comparison with the yields of mono-HAAs (average 14%) and tri-HAAs (average 19%). The study results confirmed previous findings that different reaction pathways exist for the formation of tri-HAAs and di-HAAs. Hua et al. (2015) found that chloramine demand and TOX yields were generally one order of magnitude lower in comparison to chlorination regardless of the nature of the NOM fractions, indicating a much lower reactivity of monochloramine with NOM.
The nature of NOM in source waters affects the reactions of ozone and DBP precursors. Ozone can destroy some DBP precursors by partially oxidizing humic materials and increase the proportion of hydrophilic material in raw water sources (Von Gunten, 2003; Swietlik et al., 2004). Hua and Reckhow (2013) found that the impact of pre-ozonation on HAA formation was species-specific. Chlorination and chloramination were conducted on both raw water samples and ozonated samples of six diverse North American natural waters with low to high SUVA levels. In chlorinated samples, ozonation generally reduced the tri-HAA formation in waters with SUVA higher than 2 L/mg∙m, ranging from 18% to 50% of tri-HAA yield reductions, whereas the reductions of the di-HAA yields ranged from 2% to 16% for the higher SUVA waters. Ozonation increased the di-HAA yields by 22% to 26% for the waters with SUVA values below 2 L/mg·m. It was concluded that ozone does not remove a large number of di-HAA precursors in comparison to tri-HAA precursors with subsequent chlorination. In chloraminated samples, ozonation reduced the yields of di-HAAs by 28% to 45% for all the tested waters.
Chowdhury et al. (2008) characterized two Canadian source waters based on their NOM size and polarity. The response of different NOM fractions to ozonation in terms of HAA FP was studied (see Table 20). Aliquots from MW fractions were ozonated in bench-scale experiments for a period of 5 minutes (ozone/DOC ratio of approximately 1.1) for both waters. Bromide was not present in the waters tested; therefore, the HAA concentrations in chlorinated aliquots were determined in terms of MCAA, DCAA and TCAA. The two raw waters responded very differently to ozonation (Table 20). This result indicated that the use of ozone as a primary disinfectant does not necessarily reduce the DBP formation potential of NOM in all source waters. The study demonstrated the complex structure of NOM and that NOM from different sources cannot simply be treated as one entity and compared with one another.
| Characteristics of raw waters | HAA FP of different NOM fractions |
|---|---|
Capilano Reservoir
|
HAA FP of the hydrophobic NOM with MW < 1 kDa increased by 43%. HAA FP of the hydrophilic NOM with MW > 10 kDa decreased by 48%. Total HAA FP was reduced from 1 557 ± 54 μg/L to 966 ± 19 μg/L due to a reduction in the DCAA FP and TCAA FP of the hydrophilic NOM. |
South Thompson River
|
HAA FP of the hydrophilic NOM with MW < 1 kDa increased by 170%. No significant change in HAA FP of MW > 10 kDa NOM fractions. Total HAA FP was increased from 410 ± 39 μg/L to 891 ± 109 μg/L due to an increase in the DCAA FP of the hydrophilic NOM. |
DCAA – dichloroacetic acid; DOC – dissolved organic carbon; FP – formation potential; HAA – haloacetic acid; MW – molecular weight; NOM – natural organic matter; SUVA – specific ultraviolet absorption; TCAA – trichloroacetic acid. Source: Chowdhury et al. ( 2008) |
|
Algal organic matter (AOM) is a potential HAA precursor that can impact treatment processes. When algal blooms are present, there is an increase in algae cells and AOM. This type of NOM is primarily composed of amino acids, proteinaceous substances and carbohydrates that are more hydrophilic with abundant organic nitrogen (Fang et al., 2010). In general, terrestrial NOM produces more HAAs than those from AOM during chlorination or chloramination (Fang et al., 2010; Li and Mitch, 2018; Zhao et al., 2018; Liu et al., 2020a). AOM can release extracellular organic matter (EOM) and, through cell lysis, intracellular organic matter (IOM) (taste and odour compounds and cyanotoxins). Generally, SUVA of EOM and IOM is less than 2 L/mg∙m (Huang et al., 2009; Pivokonsky et al., 2015; Dong et al., 2021).
Fang et al. (2010) characterized organic nitrogen contents in both EOM and IOM produced from Microcystis aeruginosa (the most widely occurring blue-green algae). Additionally, the study assessed the roles of IOM and EOM in the formation of commonly found carbonaceous DBPs (HAA9) and nitrogenous DBPs (N-DBPs) in chlorination and chloramination. The formation of DBPs from Suwannee River NOM was also studied for comparison. The authors found that EOM and IOM were rich in organic nitrogen, with IOM having a higher fraction of total organic nitrogen with larger proportions of higher MW and more hydrophobic content. HAA9 yields were lower in chlorination/chloramination of EOM and IOM than those of NOM. However, chlorination of EOM and IOM produced more N-DBPs and less carbonaceous DBPs than did chlorination of NOM. Chloramination formed much less amounts of N-DBPs and HAA9 from EOM or IOM than that from NOM. In general, EOM produced less DBPs than did IOM in both chlorination and chloramination.
Plummer and Edzwald (2001) investigated the effect of ozone at 1 mg/L and 3 mg/L on HAA6 FP of two algae species, Scenedesmus quadricauda (green algae) and Cyclotella sp. (diatom) in the absence of bromide in batch scale chlorination experiments. The predominant HAAs among six species were DCAA and TCAA. For green algae, pre-ozonation did not substantially increase HAA6 levels at both ozone doses as compared to the control samples. For diatoms, with 3 mg/L of ozone, the HAA6 formation was increased by 43% over the control case (from 97 μg/L to 139 µg/L). For the diatom experiments, without pre-ozonation, the production of DCAA and TCAA was comparable, whereas with pre-ozonation, DCAA formation was predominant. The authors compared the results of this study with some published DCAA formation data on humic and fulvic acids. It was concluded that with pre-ozonation, DCAA yields from the studied algae species exceeded the published yields for both humic and fulvic acids. Findings of this study demonstrated that algae could contribute considerably to the HAA precursor pool, especially during bloom periods, and that ozonation could increase HAA precursor concentrations.
4.4.2 Inorganic precursors
The presence of inorganic precursors, such as bromide and iodide, impact the type of HAAs that are formed. The presence of bromide may result in formation of Br-HAAs, while the presence of iodide in water may result in formation of I-HAAs. When ammonia is present, it will react with chlorine to form chloramines and impact the amount and type of HAAs formed.
4.4.2.1 Bromide
Bromide ion can occur naturally from saltwater intrusion and the dissolution of geological formations, or it can enter water sources through human activities. Relatively little information is available on the occurrence of bromide in Canadian water bodies. Health Canada conducted a drinking water survey of high-bromide sources in Canada in winter 2012 and summer 2013. Bromide was detected in 22 of 23 raw water samples (MDL = 0.006 mg/L); concentrations ranged from 0.034 to 2.55 mg/L, with a median of 0.505 mg/L and a mean of 0.62 mg/L (Health Canada, 2018). In the United States, the average raw water bromide concentration was found to be approximately 0.1 mg/L in a study undertaken to assess the nationwide occurrence of bromide (Health Canada, 2018). Westerhoff et al. (2022) showed that bromide concentrations can vary weekly or monthly within any given source water. The authors recommended the use of online bromide sensors at utilities with high bromide levels in source water in order to monitor data hourly.
Aqueous chlorine, chloramines, and ozone are all capable of oxidizing naturally occurring bromide to form active bromine (Reckhow and Singer, 2011). Bromine exists in water as a combination of hypobromite ion (BrO-) and hypobromous acid (HOBr) (Amy et al., 1997). Oxidation and substitution reactions of aqueous bromine with NOM lead to the formation of organo-bromine compounds. Studies have demonstrated that bromine favourably competes with chlorine in HAA formation, even when the chlorine concentrations are higher than the bromide ion concentrations (Pourmoghaddas et al., 1993; Cowman and Singer, 1996; Bond et al., 2014). When the bromine/chlorine ratio increases, the speciation of HAAs is shifted to mixed bromochloro species, such as BCAA, BDCAA and DBCAA, and eventually to fully brominated species (Pourmoghaddas et al., 1993; Cowman and Singer, 1996; Wu and Chadik, 1998; Bond et al., 2014).
Understanding and predicting the formation of DBPs during drinking water treatment processes is challenging-particularly when bromide occurs in source water, as it alters DBP formation. The bromine incorporation factor (BIF) and bromine substitution factor (BSF) are typically used to understand the formation of brominated DBPs. BIF describes the molar contribution of all brominated species into a given class of DBP compared to the total molar concentration of that class (MacKeown et al., 2020; Hua et al., 2021). BIF is the earliest indicator for the level of Br-DBP formation and its maximum values can be one, two, and three for mono-, di-, and tri-DBPs, respectively. However, if the substitution levels of bromide among different DBP classes need to be compared (for example, di-HAAs vs. tri-HAAs), the BSF can be an alternative. BSF estimates the molar proportion of bromine incorporation relative to overall halogen content of HAAs (Young et al., 2020). The BSF for HAA6 can be calculated according mb where BSF values range from 0 to 1, with the minimum and maximum signifying exclusively chlorinated or brominated HAAs.

Equation: Text description
BSF for HAA6 is the sum of the molar concentration of brominated HAAs divided by the total molar concentration of chlorinated and brominated HAAs in HAA6.
Surrogates typically used (for example, initial DOC, Cl2 dose, and SUVA) for the monitoring of DBP formation are insufficient for monitoring Br-DBPs and BSF (Young et al., 2020; Zheng et al., 2020; Hua et al., 2021). For a given water sample, it is common to see the BSF of HAAs increase with bromide level (Hua et al., 2006; Ersan et al., 2019). However, because of variable raw and distribution system water quality, a single parameter such as raw water bromide is not sufficient to evaluate the BSF of HAAs (Zheng et al., 2020). Additionally, it is not known which bromide concentrations in source water can trigger substantial formation of Br-HAAs. Zheng et al. (2020) sampled eight different sites with source water bromide concentrations ranging from 6.3 to 141.7 µg/L. The BCAA concentrations were 10.8 µg/L and 12.7 µg/L at 12.9 µg bromide/L and 11.9 µg bromide/L, respectively. MBAA and DBAA formation were negligible in the HAA6 mix. DBAA levels of 10.3 µg/L and 13.7 µg/L were detected when the bromide concentrations were 119 µg/L and 141.7 µg/L, respectively. The BCAA levels were approximately five times higher than BDAA levels in samples, indicating that bromochloro HAA species are more readily formed than fully brominated species at this range of bromide concentrations in source waters. Canadian and U.S. monitoring data demonstrate higher BCAA occurrence and concentrations in comparison to MBAA and BDAA. Therefore, it can be concluded that BCAA is a better indicator than MBAA and BDAA of the occurrence and levels of Br-HAAs in total HAA6 for Canadian bromide levels and DBP formation conditions.
Francis et al. (2010) stated that the aggregated DBP subgroups, such as HAA5, used in statistical modelling of DBP bromine incorporation may only be representative of waters with low bromide content (such as less than 100 µg/L). When higher concentrations of bromide are present in the water, the total HAA concentrations are unlikely to be sufficient to predict the presence of brominated HAAs. In general, Br-DBPs are either not correlated or negatively correlated with fully chlorinated DBPs and, therefore, the analysis of individual HAA species is recommended, particularly when conditions favour Br-HAA formation.
Krasner et al. (1996) compared the formation behaviour of BCAA at different bromide levels (10 µg/L to 800 µg/L) in a bench-scale study. At a concentration of 10 µg/L of bromide, BCAA contribution to HAA6 total concentration was insignificant. However, at a concentration of 100 µg/L of bromide, BCAA contributed from 15% to 26% of the total HAA6. The authors studied the use of pre-chlorination/post-chloramination on water with 4.15 mg DOC/L water and 10 µg bromide/L and 400 µg bromide/L. At a bromide concentration of 10 µg/L, the total HAA5 concentration was 76 µg/L (exceeding the U.S. EPA regulated level for HAA5 of 60 µg/L). The main contribution to the total HAA5 concentration was found to be from chlorinated HAAs like DCAA and TCAA. However, at 400 μg/L of bromide, the HAA5 level was 54 µg/L, meeting the U.S EPA regulated level but indicating the formation shift towards Br-HAAs. The concentration of BCAA was analyzed and the calculated total HAA6 was 77 µg/L.
Analysis of Canadian HAA6 monitoring data over five years for sites with BCAA detections over 10 µg/L (Water Security Agency, 2024) found a clear indication of different HAA speciation between the sites. At one location, the total HAA5 concentrations were below or slightly above the current HAA5 MAC of 80 µg/L. DBAA commonly represented greater than 70 % of the total HAA5, and BCAA concentrations were often two times lower than DBAA levels at this site. Additionally, the formation of fully chlorinated species such as DCAA and TCAA was generally below 5 µg/L. Data on source water bromide levels were not available, but the results suggest that they were high and occurred with other conditions that favoured the formation of fully brominated HAAs. Neither the total HAA5 nor HAA6 value is predictive of the correlated Br-HAA toxicity risk. Br-HAA monitoring and control are necessary in this case. The data also showed that some sites with BCAA concentrations of greater than 10 µg/L had total HAA5 concentrations of greater than 100 µg/L with the main concentration inputs from DCAA and TCAA, and low MBAA and DBAA concentrations. When managing such sites, it is important to note that there could be inputs from mixed bromochloro HAAs, thus increasing the toxicity risk from Br-HAAs. Some sites had high concentrations of DCAA, TCAA, BCAA and DBAA with total HAA concentrations much higher than the MAC of 80 µg/L. This data analysis demonstrates the importance of understanding the formation specifics of individual HAA species and bromine substitution behaviours, particular at sites with substantial levels of bromide in the source water.
Useful surrogates for effective monitoring of Br-HAAs and bromine substitution behaviours have been discussed in recent studies (MacKeown et al., 2020; Young et al., 2020; Zheng et al., 2020; Hua et al., 2021). Young et al. (2020) examined the source waters of small public groundwater systems on coastal islands prone to seawater intrusion. These systems have reported frequent regulatory exceedances of halogenated organic DBPs with high proportions of brominated THMs and HAAs. The study included 18 groundwater sources (bromide levels ranged from 50 µg/L to 710 µg/L) supplying 15 treatment systems, most practising only chlorination. Similar to other studies (Zheng et al., 2020; Hua et al., 2021), bromide levels in source water were not a strong predictor of HAA formation and speciation, likely due to large differences in DOC between the water sources. Bromination of DBP precursors depends on the concentration of these precursors and free bromine. When free bromine is in excess, the organic precursor sites are expected to be predominantly brominated and the BSF would approach one. Assuming that DBP precursor concentrations are proportional to DOC concentrations, the BSF should rise with the increase of bromide/DOC ratio. Based on the study results, the authors concluded that the BSF of HAA9 showed good correlation with bromide/DOC ratios. Higher bromide/DOC values indicated a higher tendency to form brominated HAAs (mixed bromochloro species in particular). Only a weak correlation was observed for the BSF of HAA5 and was likely due to having only MBAA and DBAA included in the measure of the HAA5. In U.S. studies, fully brominated HAA species typically formed at the lowest concentrations and were detected in fewer water treatment systems than mixed bromochloro HAAs (Peterson et al., 2023). Young et al. (2020) noted large seasonal variations in DOC concentrations in several groundwater sources. The use of UV54 was recommended as a surrogate for DOC concentration when more frequent monitoring is needed.
Zheng et al. (2020) also demonstrated the significant relationship between bromide/DOC ratios and BSFs of HAAs when investigating Br-HAA9 formation from chlorination of different source waters in China. In this study, bromide/UV254 was also shown to have a positive correlation with the BSF of HAAs, thus suggesting that bromide/UV254 may be the best indicator to describe BSF in chlorinated waters. The authors also investigated the difference in organic precursors of fully chlorinated, fully brominated and mixed bromochloro HAA species and the effects of DOC and SUVA on their formation. It was concluded that among detected HAAs, the yields of fully brominated HAAs such as MBAA and DBAA were significantly related with DOC but not significantly with SUVA. These results may indicate that aromatic organic precursors contributed little to the formation of MBAA and DBAA, whereas for the mixed bromochloro species BCAA and BDCAA, both aromatic and non-aromatic precursors played important roles during their formation. In comparison, the yields of DCAA and TCAA were only significantly related to SUVA, which reflects the reactivity of aromatic precursors such as aquatic humic substances. Various studies reported the higher formation of Br-HAA species in hydrophilic and low MW fractions of NOM in comparison to hydrophobic fractions (for example, humic and fulvic acids) (Heller-Grossman et al., 1993; Huang and Yeh, 1997; Liang and Singer, 2003; Hua and Reckhow, 2007a).
Cowman and Singer (1996) analyzed the distribution of HAA species after the chlorination and chloramination of aquatic humic substances isolated from two American waters (Table 21). Ten bromide concentrations, 0–25 µM (0–2 mg/L), were applied in this study, while several other factors, such as chlorine dose, reaction time, and TOC concentration, were held constant. The authors concluded that bromochloro HAA species (BCAA, CDBAA and BDCAA) are readily formed from the chlorination of humic substances in the presence of bromide ion. These species may constitute more than 50% of the total HAA9 concentration when bromide concentrations in water are greater than 0.2 mg/L.
| Distribution of HAA species | Chlorination | Chloramination |
|---|---|---|
Total HAAs |
Both humic substance isolatesTable 21 Footnote a showed similar distributions of HAAs. Quantitatively, the total HAA formation from surface water extract was approximately two times greater than from groundwater extract. |
For both humic substance isolatesTable 21 Footnote a, total HAA formation decreased by 90% to 95% in comparison to chlorination. |
Yields of different HAA species |
The molar yields of mono-HAAs, di-HAAs and tri-HAAs were constant. Tri-HAAs constituted the greatest mole fraction of total HAAs (61%–67%), with di-HAA and mono-HAA molar fractions ranged from 30% to 36% and from 3% to 5%, respectively. |
Di-HAAs (DCAA in particular) were the principal species formed, while tri-HAAs were the minor species. DCAA observed concentrations did not exceed 0.07 µM (9 µg/L). |
Brominated HAAs |
Bromine incorporation into HAAs increased with increasing bromide concentration. At bromide levels < 3 µM: TCAA > DCAA > BDCAA > BCAA > DBCAA > DBAA > TBAA. At bromide levels > 20 µM: TBAA > DBAA > BDCAA > BDCAA > BCAA > DCAA, TCAA. |
Bromine incorporation into HAAs increased with increasing bromide concentration. The extent of bromine incorporation into the HAAs was less during chloramination. Formation of MBAA, DBAA, BCAA, DBCAA and TBAA were observed. But DBCAA and TBAA were quantifiable only at bromide levels > 12.5 µM. |
BCAA – bromochloroacetic acid; BDCAA – bromodichloroacetic acid; CDBAA – chlorodibromoacetic acid; DBAA – dibromoacetic acid; DCAA – dichloroacetic acid; Di-HAAs – dihaloacetic acids; HAAs – haloacetic acids; MCAA – monochloroacetic acid; Mono-HAAs – monohaloacetic acids; SUVA – specific ultraviolet absorbance; TBAA; tribromoacetic acid; TCAA – trichloroacetic acid; Tri-HAAs – trihaloacetic acids. Source: Cowman and Singer (1996)
|
||
Hua and Reckhow (2013) studied the effect of pre-ozonation on the HAA formation of six natural North American waters with low to high SUVA levels that were chlorinated and chloraminated. The bromide concentrations in the waters ranged from less than 10–89 µg/L. Pre-ozonation shifted the formation of tri-HAA and di-HAAs to the more brominated species during subsequent chlorination. For example, pre-ozonation of the chlorinated water with a bromide concentration of 45 µg/L reduced the formation of the DCAA, TCAA and BDCAA species and increased the formation of the BCAA, DBAA and DBCAA species. For chloramination, di-HAAs were the predominant species formed, and pre-ozonation generally reduced the yields of di-HAAs by 28% to 45%. The authors stated that under the study conditions, the HOBr produced by pre-ozonation did not contribute significantly to the formation of the Br-HAA species, likely due to the transformation of NOM caused by ozonation. This is supported by the findings that high concentrations of bromide are required for substantial bromine incorporation when using ozone (Reckhow and Singer, 2011).
4.4.2.2 Iodide
Two inorganic forms of iodine in natural water sources are iodide (I-) and iodate (IO3-), with iodide being the largest contributor to the formation of iodinated DBPs (I-DBPs). Sharma et al. (2023) sampled 286 drinking water sources across the Unites States. Iodide was detected in 41% of surface water and 62% of groundwater samples. The concentrations ranged from non-detect (less than 1.0 μg/L) to 72 μg/L and from non-detect (less than 1.0 μg/L) to 250 μg/L in surface water and in groundwater, respectively. Organic forms of iodine as dissolved organic iodine (DOI) also exist. However, the biologically induced iodine cycling and DOI conversion by drinking water treatment processes are not well understood. Sharma et al. (2023) observed the cycling of iodine species in surface waters used as drinking water sources. The authors concluded that total iodine was comprised of iodide, iodate and DOI in surface waters and correlated well with bromide. But when the DOI was excluded from total iodine, the correlation was lower. The poor correlation between bromide and iodide concentrations has been reported in many source waters (Tugulea et al., 2018). For example, bromide/iodide mass ratios from source waters in the U.S. and Canada ranged between 2.9 to 238 µg/L(Richardson et al., 2008). The large variations are due to salt water intrusion, various salt deposits containing different levels of bromide and iodide, anthropogenic influences, and the general instability of iodide species compared to bromide (Whitehead, 1984; Steinberg et al., 2008; Dong et al., 2019).
The formation of I-DBPs during disinfection involves the oxidation of iodide to hypoiodous acid (HOI), and then the reaction of HOI with organic matter. HOI can be further oxidized by some oxidants (for example, chlorine, ozone and ferrate) under aerobic conditions to form iodate. Iodate is thermodynamically stable and does not form I-DBPs. As such, it is the desired species of iodide in drinking water (Bichsel and Von Gunten, 1999; Hua et al., 2006; Hua and Reckhow, 2007a, 2008; Gallard et al., 2009; Ye et al., 2012; Allard et al., 2013; Liu et al., 2017b; Postigo et al., 2017; Dong et al., 2019).
Richardson et al. (2008) measured MIAA and BIAA acids in chloraminated and chlorinated drinking waters from 23 cities in the United States and Canada. Most of the water treatment plants used chloramination for treatment with only two treatment plants with chlorination. I-HAAs were found in waters of almost all the DWTPs with maximum levels of 1.7 µg/L and 1.4 µg/L of MIAA and BIAA, respectively. The formation of I-HAAs was highest at chloramination plants with short free chlorine contact times (less than 1 min) and were lowest at the chlorine-only plants or at chloramination plants with long free chlorine contact times (greater than 45 min) prior to ammonia addition.
The reaction rate constants for the oxidation of iodide to HOI by different oxidants are highly variable. The probability of forming iodoorganic compounds during drinking water disinfection increases in the following order: ozonation < chlorination < chloramination (Bichsel and Von Gunten, 1999). Postigo et al. (2017) conducted a laboratory-controlled reaction to assess the formation of MIAA, CIAA, BIAA and DIAA acids after chlorination and chloramination of different water matrices (see Table 22). In this study, Suwannee River and Nordic Lake NOM solutions (5 mg/L of NOM isolate) were fortified with 500 μg/L of bromide (as KBr) and two different levels of iodide (as KI), 50 μg/L and 100 μg/L. Llobregat River bromide and total iodine concentrations were 788 ± 83 μg/L and 17.7 ± 0.7 μg/L, respectively. Chlorine/monochloramine doses for each raw water were selected according to the specific chlorine demand resulting in 0.5 mg/L of residual chlorine. Chloramination resulted in higher I-HAA formation than chlorination. I-HAAs also had higher concentrations in less aromatic NOM solutions with low bromide/iodide and high iodide/DOC concentration ratios. The most abundant I-HAA was CIAA (detected in 86% of the disinfected water samples) with an average concentration of 0.9 μg/L. The authors stated that the occurrence of CIAA in drinking water distribution systems has not been well investigated.
| Raw water | Disinfection scenarios with two bromide:iodide ratios | MIAA (μg/L) |
CIAA (μg/L) |
BIAA (μg/L) |
DIAA (μg/L) |
|---|---|---|---|---|---|
| Suwannee River reverse osmosis-isolated NOM TOC: 5.4 mg/L SUVA254: 1.8 L/mg∙m pH:7.5 |
Cl 10:1 ratio | 0.3 | 0.8 | 0.2 | ND |
| NH2Cl 10:1 ratio | 0.6 | 0.5 | 0.7 | 0.6 | |
| Cl 5:1 ratio | 0.4 | 1.8 | 0.3 | 0.4 | |
| NH2Cl 5:1 ratio | 0.7 | 1.7 | 1.7 | 0.9 | |
| Nordic Lake reverse osmosis-isolated NOM TOC: 4.9 ± 0.9 mg/L SUVA254: 1.5 L/mg∙m pH: 7.5 |
Cl 10:1 ratio | 0.3 | 0.4 | 0.3 | ND |
| NH2Cl 10:1 ratio | 0.4 | 0.9 | 0.3 | 0.3 | |
| Cl 5:1 ratio | 0.6 | 0.6 | ND | ND | |
| NH2Cl 5:1 ratio | 0.9 | 1.7 | 1.3 | 1.0 | |
| Llobregat River water TOC: 6.8 ± 0.7 mg/L SUVA254: 4.3 L/mg∙m pH: 7.5 |
Cl around 45:1 ratioTable 22 Footnote a | 0.4 | ND | 0.1 | ND |
| NH2Cl around 45:1 ratioTable 22 Footnote a | 0.3 | 0.4 | 0.2 | ND | |
BIAA – bromoiodoacetic acid; Cl – chlorine; CIAA – chloroiodoacetic acid; DIAA – diiodoacetic acid; MIAA – monoiodoacetic acid; ND – not detected; NH2Cl – monochloramine; NOM – natural organic matter; SUVA – specific ultraviolet absorbance; TOC – total organic carbon. Source: Postigo et al. (2017)
|
|||||
Liu et al. (2017) systematically investigated the factors influencing the formation of I-DBPs during chloramination of iodide-containing waters (see Table 23). After chloramination, MIAA, DIAA and triiodoacetic acid were detected in raw waters with Suwannee River NOM isolate. Triiodoacetic acid consistently had the highest concentrations among three I-HAAs detected under all experimental scenarios. Additionally, the authors assessed the effect of water matrix on other I-DBP formation in various water sources spiked with 200 µg/L of iodide. They found that low-SUVA254 NOM was more reactive in the formation of I-DBPs during chloramination than high-SUVA254 NOM.
| Factors influencing I-HAA formation |
MIAA concentration | DIAA concentration | TIAA concentration |
|---|---|---|---|
| Reaction time (0 h–12 h) |
Increased with reaction time (45 nM at 12 hours). | Increased with reaction time (71 nM at 12 hours). | Increased with reaction time (321 nM at 12 hours). |
| NH2Cl dose (0.01mM–0.4 mM) |
Increased progressively with increasing NH2Cl dose. | Increased progressively with increasing NH2Cl dose. | Significantly increased from 0.01–0.1 nM, and then decreased with higher NH2Cl doses. |
| Iodide concentration (10 μM–300 μM) |
Decreased from 120 to 50 nM with increasing iodide concentrations. | Progressively increased with increasing iodide concentrations. | Significantly increased from 10 to 200 μM, and then decreased slightly at higher iodide concentrations. |
| pH (5.0–9.0) |
Decreased from 110 nM at pH 5.0 to 58 nM at pH 9.0, respectively, although the highest yield was observed at pH 6.0. | Decreased from 183 nM at pH 5.0 to 72 nM at pH 9.0. | Decreased from 382 nM at pH 5.0 to 364 nM at pH 9.0, although the highest yield was observed at pH 6.0. |
| DOC concentration (1 mg/L–7 mg/L) |
Remained nearly constant over the studied DOC concentration range. | Progressively increased over the studied DOC concentration range. | Significantly increased with increasing DOC concentration from 1.0 to 5.0 mg/L, and then decreased at a higher DOC concentration (that is, 7.0 mg/L). |
DIAA – diiodoacetic acid; DOC – dissolved organic carbon; I-HAAs – iodinated haloacetic acids; MIAA – monoiodoacetic acid; NH2Cl – monochloramine; NOM – natural organic matter; TIAA – triiodoactic acid. Source: Liu et al. (2017b) |
|||
4.4.3 Additional factors
Additional factors that impact HAA formation are include reaction time, temperature, and pH. Generally, bromide and disinfectant dose affect HAA formation more significantly than reaction time, temperature, and pH (Hong et al., 2013).
4.4.3.1 Reaction time
During disinfection processes, when a disinfectant residual persists, reaction time is one of the most important factors determining HAA concentrations. Because of their chemical stability, HAA concentrations typically increase with reaction time for as long as a disinfectant residual exists (Reckhow and Singer, 2011). However, in distribution systems, HAA concentrations can significantly decrease after long residence times due to biodegradation of di-HAAs (Section 6.0).
Pourmoghaddas et al. (1993) studied the formation of nine HAA species in a water solution of humic acid at two chlorine dosages (11.5 mg/L and 25 mg/L), four bromide levels (0.0, 0.5, 1.5 and 4.5 mg/L), and three reaction times (6, 48 and 168 hours). The authors observed similar HAA formation trends for the two chlorine doses. The reaction time had a substantial effect on the formation of TCAA and DCAA. The concentrations of these two HAA species increased with longer reaction time under all the experimental conditions. The concentrations of bromochloro and brominated species generally increased with reaction time; however, other experimental conditions such as pH and bromide levels strongly affected the formation of these species. For example, for DCBAA and DBCAA, their formation initially increased with reaction time; however, the high pH (9.4) changed the formation to being nearly zero. Hong et al. (2013) also demonstrated an increase in the yields of HAAs when the reaction time increased from 2–24 hours and to 72 hours after chlorination of raw drinking water at pH 7. The reaction rate of the formation became slower after two hours, which indicated a decrease in NOM reactive sites.
For chloramination, the concentrations of HAAs generally stayed stable as the reaction time prolonged (Hong et al., 2013). Hua and Reckhow (2008) pointed out that di-HAAs formed quickly within 30 minutes of chloramination and did not increase significantly after that. Ozonation by-products form quickly and show little increase with time due to the rapid dissipation of ozone residuals (Reckhow and Singer, 2011).
The residence time is a function of water quantity and usage and can be subject to changes over time. These changes in residence time may coincide with water quality variations, which can compound effects on HAA formation. Overall, water quality and water quantity should both be examined to understand potential impacts to HAA concentrations.
4.4.3.2 Disinfectant dose and residual
Disinfectant dose and residual have a variable impact on DBP formation. For residual disinfection, small changes in disinfectant dose have a minor effect on the formation. Typically, there is an excess of disinfectant; therefore, the DBP formation reaction is precursor-limited. When the disinfectant residual drops below approximately 0.3 mg/L, DBP formation becomes disinfectant-limited (Reckhow and Singer, 2011). Disinfectant dose plays a greater role in DBP formation during primary disinfection than during secondary disinfection, as primary disinfectant amounts are usually below the long-term demand (Reckhow and Singer, 2011).
Uyak and Toroz (2007) carried out chlorination of Buyukcekmece Lake water samples in Istanbul at pH 7.0 with 5 mg/L and 12 mg/L chlorine doses. The concentrations of the HAA species were expected to increase in the high chlorine dose samples because of the HOBr generated from the reaction of chlorine and bromide. However, the increased chlorine dose did not significantly affect the distribution of the HAA5. The maximum concentrations of total HAA5 with 5 mg/L and 12 mg/L chlorine doses were 0.46 µM (at 50 µM bromide) and 0.66 µM (at 12.5 µM bromide), respectively.
Reckhow and Singer (2011) demonstrated that the DBP formation was directly proportional to the chlorine dose increase from 3 mg/L to 5 mg/L. When the chlorine dose was higher than 5 mg/L, the disinfectant residual was sufficient and DBP formation levelled off. The authors stated that with lower TOC values, chlorine demand could be less than 3 mg/L and no effect on the DBP formation would be expected at higher chlorine concentrations.
Hong et al. (2013) studied HAA9 formation with both chlorine and chloramines. The authors found that HAA9 concentrations generally increased as the disinfectant dose increased. Chlorine and chloramine doses ranged from 0.65–3.9 mg/L and from 1.3–7.8 mg/L, respectively. The average yields of HAAs in chloramination were only 24% of those in chlorination. The authors speculated that some intermediate DBPs may be formed during chlorination/chloramination. These intermediates can further react with chlorine/chloramine resulting in the formation of downstream DBP products such as HAAs when NOM-reactive sites are exhausted. The HAA speciation was greatly influenced by the monochloramine dose. For example, higher percentage yields of tri-HAAs (increased from 9% to 26%) were observed as the monochloramine dose rose to 7.8 mg/L. These results were explained by more free chlorine release at higher monochloramine doses, leading to more oxidation products such as tri-HAAs.
For chloramination, the presence of transient free chlorine residuals increased with the rise in the Cl2:N ratio, and it took longer for free chlorine residuals to disappear. This can shift HAA yields and speciation from that typical of chloramines to that of free chlorine (Reckhow and Singer, 2011).
4.4.3.3 pH
The formation of specific halogenated DBPs is strongly influenced by pH (Reckhow and Singer, 2011). Generally, the formation of HAAs during chlorination increased with decreasing pH (Pourmoghaddas et al., 1993; Cowman and Singer, 1996; Liang and Singer, 2003; Hua and Reckhow, 2008; Reckhow and Singer, 2011). The highest concentrations of HAAs were observed by Pourmoghaddas et al. (1993) at pH 5.0, in particular for mixed halogenated species, with a definite increase in TBAA with decreasing pH. The increase of pH from 6.0–8.0 decreased tri-HAA formation, with little effect on di-HAA formation(Liang and Singer, 2003). Hua and Reckhow (2008) also observed that tri-HAA formation was supressed at higher pH, whereas di-HAA formation increased by 30% when pH was increased to 10.0. For chloramination, the authors observed the lowest di-HAA formation at pH 10.0, and only trace amounts of tri-HAAs formed at various pH values.
4.4.3.4 Temperature
In general, the rate of formation of DBPs generally increases with rising temperature (Hua and Reckhow, 2008; Reckhow and Singer, 2011). Some DBPs are more sensitive to temperature changes than others. Increased chlorine decay with warmer temperature limits DBP formation reaction, particularly TCAA formation. However, in practice, the chlorine dose would be increased to accommodate for the chlorine decay (Rodriguez and Sérodes, 2001; Reckhow and Singer, 2011). DCAA formation is less sensitive to chlorine residual concentration, demonstrating again the different formation chemistry for di-HAAs and tri-HAAs. In addition, an increased biodegradation rate for di-HAAs is expected with higher temperatures (Reckhow and Singer, 2011).
Hong et al. (2013) studied DBP formation at 10 °C, 20 °C and 30 °C. With chloramination, no effect was observed related to temperature increase in the case of HAA9 formation. With the chlorination, the authors observed that HAA formation initially increased when the temperature rose from 10 °C to 20 °C but decreased when the temperature rose to 30 °C. The decrease of HAAs was attributed mostly to the reduction of TCAAs. The authors concluded that elevated temperatures potentially contributed to the decomposition of tri-HAAs, as they are thermally unstable DBPs. The concentration of thermally unstable DBPs as a function of temperature depends on their formation and decomposition rates.
Disinfectant residual within the distribution system can be impacted by a rise in temperature due to higher reaction rates, increased biological activity, and variations in NOM (AWWA, 2017). Changes in water temperature should be considered together with other parameters that also vary seasonally, such as NOM quantity and composition.
5.0 Treatment considerations
Water treatment plants must balance effective disinfection against the creation of DBPs because drinking water must, first and foremost, be microbiologically safe in order to prevent waterborne disease. For HAA control, the preferred and most effective option is to reduce or limit its formation prior to and during distribution. In situations where HAAs have formed, there are options to remove formed HAAs.
5.1 Municipal-scale treatment
Strategies to reduce the formation of HAAs include precursor removal prior to disinfection, altering disinfectant dose, type or dosing location in a treatment train, or change in disinfection practices. Treatment may change seasonally or temporally to account for changes in factors that affect HAA formation. Additionally, there are treatment processes (for example, biological filtration and membrane separation) that can reduce HAAs after their formation. Any changes to control/minimize HAAs need to be evaluated using bench- and pilot-scale testing to ensure that treatment goals are met, effective disinfection is achieved, and changes do not result in unintended consequences and challenges in complying with other regulatory requirements. These tests need to be repeated regularly to account for source water quality changes, seasonal variability and climate change.
To minimize the formation of HAAs during drinking water treatment processes, the focus should be on reduction of HAA organic precursors before primary disinfection takes place. The HAA organic precursor control approaches include the following: optimized coagulation, biological filtration, oxidation before chlorination, granular activated carbon (GAC), ion exchange and membrane separation (McGuire et al., 2014). Switching disinfectant can lead to the formation of other DBPs. However, alternative oxidants and disinfectants can provide valuable options in DBP control strategies. Precursor removal and alternative oxidants/disinfectants may not be the best approach for systems, such as consecutive systems without control of treatment processes or large distribution systems with DBP hot spots.
Changing source water or blending of source waters for DBP precursor dilution can be used for controlling HAA precursors if alternative source waters are available to a water utility (Becker et al., 2013). Characterization of alternative source water before blending is critical to ensure water quality is maintained (for example, potential for corrosion due to water chemistry changes and formation of other DBPs). These approaches can be used seasonally during periods of peak TOC concentration.
Localized water treatment for removal of formed HAAs may include GAC, biological activated carbon (BAC), and membrane separation. Operational parameters drinking water characteristics should be carefully monitored. Implementing technologies that can remove DBPs and prevent their re-emergence in the distribution network may be necessary (Gilca et al., 2020).
5.1.1 Precursor control options
Removal of organic and inorganic precursors can minimize the formation of HAAs. The NOM guidance document provides a detailed discussion of the various treatment technologies that can be used to remove NOM. The choice of treatment depends on many factors including (Health Canada, 2020):
- type of NOM
- interactions with other water constituents (for example, bromide and iodide)
- interactions with treatment chemicals
- interactions with processes (for example, fouling of membranes)
- impacts on distribution system water quality
Source-specific treatability studies, including bench- and/or pilot-scale testing, are essential to determine the most effective treatment option(s) to remove NOM, decrease its reactivity to form HAAs, and remove inorganic precursors. The lack of a source-specific treatability study may result in the selection of inappropriate treatment and an increase in HAAs following implementation. As water sources or treatment processes can change seasonally and temporally, it is important to routinely monitor the concentration and character of NOM and to evaluate its impact on treatment, water quality, and distribution system conditions.
Variable levels of organic precursor removal can be achieved using a single process (for example, coagulation) or by integrating multiple processes (for example, ion exchange-coagulation). Conventional drinking water treatment processes may need to be followed by advanced technologies prior to disinfection in order to improve removal of DBP precursors (Gilca et al., 2020). Though many studies investigated the impact of specific treatment unit performance and source water quality on resulting DBP concentrations, few directly compared the technologies on various source waters and evaluated the integration of these technologies in one treatment train and the order of unit processes (Bond et al., 2011; Plourde-Lescelleur et al., 2015). Decisions on which technology to apply for control of HAA formation should include whether it can also address other water quality problems. The selection of treatment and disinfection strategies for controlling the formation of DBPs should also consider the formation of other DBPs of potential concern.
Removal of inorganic precursors, such as bromide and iodide, can also be used to reduce formation of Br-HAAs and I-HAAs. Bromide is difficult to remove from water and, despite being technically feasible, a cost-effective option to reduce Br-HAAs is unlikely to be available (Health Canada, 2018; Criquet and Allard, 2021). The most common technologies used for organic precursor removal (for example, enhanced coagulation and GAC) result in a shift to more Br-DBPs as they remove DOC but not bromide (Krasner et al., 1996; Criquet and Allard, 2021). The ratio of bromide/DOC increases; therefore, the BSF or BIF of HAAs increases (MacKeown et al., 2020; Young et al., 2020; Zheng et al., 2020; Hua et al., 2021). During early GAC breakthrough when the organic precursor levels are low, bromine can react with active organic precursors more readily than chlorine. Krasner et al. (1996) indicated that enhanced coagulation had a less substantial effect than GAC on shifting the speciation towards Br-DBPs as it was less effective in reducing TOC. Wang and Chen (2014) studied the removal of HAAs in bench-scale experiments by catalytic ozonation followed by a biofiltration column. The authors concluded that when catalytic ozonation reduced DOC before chlorination, the formation of brominated HAAs increased. The subsequent use of biofiltration after ozonation and catalytic ozonation increased the BIF values.
Many DWTPs use pre-chlorination to oxidize iron or manganese or to avoid biofouling of filters (Cuthbertson et al., 2019; MacKeown et al., 2020). Though pre-chlorination or intermediate chlorination results in the formation of DBPs, it also transforms NOM into intermediate aromatic halogenated DBPs, which may be more easily removed by GAC than larger precursor molecules (Jiang et al., 2017, 2018; Cuthbertson et al., 2019; Erdem et al., 2020; MacKeown et al., 2020). When high-bromide waters are chlorinated before GAC treatment, the bromide is oxidized and subsequently incorporated into hydrophilic NOM molecules that are more adsorbable by GAC (McGuire et al., 2014). Chlorination before GAC treatment may be a beneficial strategy for water treatment systems where Br-HAAs are detected at high levels in the distribution system. However, it is important to maintain the GAC capacity to retain formed HAAs. An overview of bromide removal strategies, including bench- and pilot-scale studies, are presented in Westerhoff et al. (2022). The authors indicated the necessity for significant improvements in bromide removal capacities for removal to be viable at full-scale. Bromide selective ion exchange resins may be a viable option (see Section 5.1.1.5). Water treatment systems should have a good understanding of the sources, concentration, and seasonal variability of bromide in their source waters.
For high-iodide source waters, the removal of iodide may be achieved by oxidation to iodate (stable compound that does not form I-HAAs). Pre-chlorination and pre-ozonation are two options that can oxidize iodide to iodate and avoid formation of I-DBPs (Allard et al., 2015; Kimura et al., 2017). However, it is important to note that pre-chlorination forms regulated DBPs. To provide effective oxidation of iodide to iodate, pre-chlorination time prior to ammonia addition (to form chloramines) can be optimized (Dong et al., 2019). Generally, organic precursors are more easily removed than inorganic precursors. The increase in the bromide/DOC and iodide/DOC ratios causes a shift towards more Br-HAAs and I-HAAs.
5.1.1.1 Enhanced coagulation
Enhanced coagulation often represents one of the simplest strategies to prevent DBP formation. This strategy may only require the modification of current coagulation practices by conducting jar tests (Ontario Ministry of the Environment, Conservation and Parks, 2023). Impacts such as elevated corrosivity, increased sludge production, and changes in disinfection efficacy are considerations for water treatment systems when selecting the coagulation strategy (McGuire et al., 2014).
The reduction of HAA precursors can be achieved through increased coagulant dose or by adjusting the coagulation pH (McGuire et al., 2014). The choice of coagulant will depend on the characteristics of the water to be treated (Health Canada, 2020). The use of different coagulants results in different reactivity of the remaining NOM fractions towards HAA formation (Tubic et al., 2013).
In a bench-scale study, Lapointe et al. (2021) compared the enhanced coagulation results of three Canadian source waters using six different coagulants (see Table 24). The formation of HAAs in the treated waters was performed under UFC. For the two river source waters, ferric sulfate outperformed aluminum-based coagulants for HAA precursor removal at pH 5, whereas at pH 6, alum had a better result. The NOM from Des Rapides Lake had a high DBP formation potential, and HAA precursors were better removed using highly pre-hydrolyzed coagulants at pH 5. Performance of polyaluminum chloride (PACl) coagulants decreased when pH increased. The best performance for the lake source water at pH 6 was demonstrated by aluminum chlorohydrate. The authors suggested that some NOM present in Des Rapides Lake interacted with Al cationic species and was removed via electrostatic affinities.
| Coagulant | St. Lawrence Rivera pH 5 |
St. Lawrence Rivera pH 6 |
Des Prairies Riverb pH 5 |
DesPrairies Riverb pH 6 |
Des Rapides Lakec pH 5 |
Des Rapides Lakec pH 6 |
|---|---|---|---|---|---|---|
| Ferric sulfate | 12 | 15 | 86 | 82 | 41 | 75 |
| Alum | 20 | 13 | 142 | 68 | 72 | 65 |
| Polyaluminum chloride (PAX 14) | 23 | 30 | 109 | 82 | 31 | 42 |
| Polyaluminum chloride (PAX 18) | 17 | 25 | 188 | 105 | 26 | 43 |
| Polyaluminum chloride (PAX XL8) | 26 | 22 | 109 | 104 | 28 | NA |
| Aluminum chlorohydrate (PAX XL1900) | 33 | 32 | 102 | 96 | 34 | 36 |
DOC – dissolved organic carbon; NA – not available; SUVA – specific ultraviolet absorbance. Source: Lapointe et al. (2021)
|
||||||
Zhao et al. (2013) reported the same observation with their high DOC source water when comparing four coagulants (ferric chloride, aluminum sulfate, PACl and composite polyaluminum) for HAA precursor removal. The greatest HAA precursor removals (59%) were achieved by PACl at pH 5.5, at which point charge neutralization was the predominant mechanism. The high-polymeric Al-containing PACl coagulants can outcompete commercial PACls in destabilizing DBP precursors (Lin and Ika, 2020).
Enhanced coagulation is not very effective in removing the hydrophilic fractions of HAA precursors, resulting in increased formation of dihalogenated HAA species (Tubic et al., 2013; Lin and Ika, 2020). The high reactivity of the hydrophilic fractions of HAA precursors requires that special attention be paid to their removal from source waters with a high content of these fractions.
5.1.1.2 Pre-oxidation strategies
Pre-chlorination minimizes biological slime formation on filters, pipes, and tanks, controls zebra mussels at the raw water intake, and oxidizes hydrogen sulfide or reduced iron. However, the ideal approach for minimizing DBPs is to apply chlorination in the treatment train after NOM removal. When pre-oxidation is needed, alternative pre-oxidation strategies (for example, ozonation, chlorine dioxide [ClO2] and advanced oxidation processes) may be explored (McGuire et al., 2014; Gilca et al., 2020; Health Canada, 2020). By using pretreatment oxidants other than chlorine, water treatment systems can delay chlorine disinfection until after conventional water treatment where HAA precursor concentrations have been reduced (Singer et al., 2003). Under typical water treatment conditions, pre-oxidation processes transform the nature of the organics rather than remove bulk NOM. They can also be used for disinfection as well as taste and odour control (Health Canada, 2020). However, there are still many uncertainties around the effect of some pre-oxidation processes on DBP formation (Yang et al., 2013; Gao et al., 2019; Carra et al., 2020; Liu et al., 2021). In general pre-oxidation transforms large aromatic and long aliphatic chain organics to small, hydrophilic structures. Therefore, pre-oxidation reduces UV absorbance, affecting SUVA without an associated reduction in NOM concentration. Thus, it is important to select appropriate sampling sites along the treatment train when measuring UV absorbance to calculate SUVA (Health Canada, 2020).
Waters with low TOC content and SUVA value are not highly amenable to coagulation, therefore ozonation coupled with biofiltration treatment is recommended to increase DBP precursor removal (Chaiket et al., 2002). A survey of 284 United States drinking water ozonation facilities was undertaken with approximately 50% of the treatment plants using ozone as part of a DBP-control program (McGuire et al., 2014). The ozonation step in most facilities was implemented as a pre- or intermediate process within the water treatment plant. The post-ozonation step is typically positioned after the filters (Méité et al., 2015). Since ozone is rapidly consumed under typical drinking water conditions, most ozonation treatment scenarios include either chlorine or chloramine for residual disinfection (Hua and Reckhow, 2013).
Some studies reported variable results of HAA precursor removal based on the location of the ozonation step in relation to coagulation (Chaiket et al., 2002; Méité et al., 2015; Lin et al., 2020). These differences indicate the effect of different raw water quality and operating parameters on treatment efficacy and their impact on other treatment processes located later in the treatment train. Singer et al. (2003) concluded in bench-scale experiments that the formation of HAA9 was lower for five of six source waters when ozone was applied prior to enhanced coagulation, in comparison to enhanced coagulation alone. Adjusting the pH to 6.5 prior to ozonation was an important factor in reducing HAA formation. Reduced HAA FP (by an average of 30.3%) was also observed for ozonation after enhanced coagulation (intermediate ozonation). Fifty percent of the samples had higher reduction in HAA FP for each of the pre-ozonation and intermediate ozonation approaches. However, the authors noted that biological filtration, commonly used with intermediate ozonation to remove additional HAA precursors, was not used on the settled waters.
Chaiket et al. (2002) did not find clear evidence to demonstrate a dependence of HAA precursor removal at the location of ozonation with respect to coagulation. The authors conducted a study at pilot scale to investigate the effectiveness of coagulation, ozonation, and biological filtration in controlling HAA9 FP in drinking water with a low SUVA. Though pre-ozonation appeared to be more effective than intermediate ozonation when evaluated as a singular process, the total reduction in HAA FP was similar for the overall treatment process between nine pilot scale runs. The removal of HAA precursors by biological filtration was greater when ozone was applied immediately prior to filtration.
In UFC experiments with low bromide waters (ranging from 3.5–25 µg/L) in Quebec, the average reduction of HAA6 was: 52% for DWTPs using pre-ozonation (3 treatment plants); 29% for DWTPs using intermediate ozonation (3 treatment plants), and 26% for DWTPs using post-ozonation (9 treatment plants) (Méité et al., 2015). In a study with high bromide concentrations in the raw water at a DWTP located in Zhejiang, China, treatment steps in the treatment train were pre-ozonation (O3 dosage: 0.5 -1.5 mg/L), coagulation, sedimentation, sand filtration, post-ozonation (O3 dosage: 0.5 - 3.0 mg/L), BAC filtration, and chlorination (Lin et al., 2020). The authors assessed the changes in HAA organic precursors at different locations of the treatment train. For example, HAA5 FP increased after pre-ozonation (by 27.33%) and post-ozonation (by 30.86%), whereas a decrease was observed in HAA5 FP after coagulation with sand filtration (by 14.02%) and after BAC filtration (by 36.64%). The authors attributed the increase in HAA5 FP after the ozonation steps to the increased formation of Br-HAAs (BCAA and DBAA).
The inorganic by-products produced by ClO2, such as chlorite (ClO2-) and chlorate (ClO3-), are harmful to human health (Health Canada, 2008, 2011). Water treatment plants using chlorine dioxide as primary disinfectant should not exceed a maximum feed dose of 1.2 mg/L to ensure that the chlorite and chlorate concentrations do not exceed their respective MAC (Health Canada, 2008).
Though ClO2 is an effective disinfectant, it is more often used as a pre-oxidant before chlorination or chloramination to keep its by-products at lower concentrations (Yang et al., 2013). Studies show that the ClO2 application before chloramines resulted in an increase in overall N-nitrosodimethylamine formation (McGuire et al., 2014).
Yang et al. (2013) investigated the formation of HAA9 at various ClO2 (from 2 mg/L to 10 mg/L) and bromide (from 0.1 mg/L to 2 mg/L) concentrations in sequential ClO2-chlorination and ClO2-chloramination processes. Without bromide in the simulated high SUVA water (Suwannee River NOM), there was no significant reduction in HAA formation (only TCAA and DCAA were detected) with ClO2 pre-oxidation (at 2 mg/L) for both chlorination and chloramination. In contrast, when testing Beijiang river water, the reduction in HAA formation after pre-oxidation was 30% and 20% for chlorination and chloramination, respectively. In the simulated water using chlorination, di-HAAs remained constant at various bromide concentrations, but tri-HAA concentrations increased with rising bromide concentrations. The reduction levels after ClO2 pretreatment remained constant for di-HAAs but varied for tri-HAAs. Bromine incorporation was higher in HAAs after pre-oxidation. When the ClO2 concentration was gradually increased from 2 mg/L to 10 mg/L, the total HAA9 formation reductions varied from 10% to 45%.
UV treatment alone does not generate DBPs. However, UV irradiation can have an impact on the formation of DBPs from subsequent secondary disinfection when using chlorine or chloramine. UV irradiation can be applied to drinking water in three different processes in relation to DBP formation: UV for primary disinfection; UV/H2O2 advanced oxidation process (AOP) to destroy organic contaminants; and UV/Cl2 AOP whereby UV is applied in the presence of chlorine to remove organic contaminants. Studies have shown that UV irradiation at typical drinking water disinfection doses (for example, 40-140 mJ/cm2) does not substantially alter the DBP precursors.
In a study by Reckhow et al. (2010), the raw water of Quabbin Reservoir in Massachusetts, U.S., and sand and GAC filter effluents of a DWTP in Ohio, U.S., were collected and treated with UV and chlorine treatment. In this study, the UV treatment did not show any significant effect on HAA formation from post-chlorination with an average HAA precursor destruction of 5% or less. The UV/H2O2 AOP pretreatment was shown to impact subsequent DBP-FP, depending on the UV dose. AOP UV doses in the order of 1000 mJ/cm2 often caused increases in HAA formation with subsequent chlorination (Dotson et al., 2010). However, higher AOP UV doses (3500–5000 mJ/cm2) led to reductions in HAA FP (Toor and Mohseni, 2007). During the UV/Cl2 AOP treatment, chlorine and reactive chlorine radical species produced from UV/chlorine photolysis can react with NOM to form chlorinated DBPs. Gao et al. (2019) indicated that the UV/Cl2 process for degradation of humic acids generated more HAAs than chlorination alone. Carra et al. (2020) evaluated HAA formation during UV/Cl2 treatment using a UV-LED reactor at 285 nm. A strong pH effect was not observed on HAA formation in comparison to THMs. The UV/Cl2 process greatly increased the HAA formation relative to THMs at a pH of 5.1 and pH of 6.5. An increase in HAA FP between 100% and 180% across the water samples was observed, while THM FP increased up to 30%. Wang et al. (2015) showed that pretreatment by both UV/Cl2 and UV/H2O2 AOPs resulted in a higher 24-hour HAA formation when compared to the controls (by 40%–110% in Cornwall water and 20%–90% in Lake Simcoe water).
Water treatment systems should be aware that all oxidants produce biodegradable products upon reacting with NOM. As a result, biologically active filtration may be necessary to stabilize treated water (Health Canada, 2020). Sarathy et al. (2011) concluded that the DBP FP did not change considerably after UV/H2O2 treatment. When a low-pressure UV/H2O2 process was followed by BAC treatment, HAA FP reduction was 75% after seven days and 51% after 10 days of the BAC run.
5.1.1.3 Biological filtration with and without pre-ozonation
Biological filtration is an operational practice of promoting and maintaining biological activity on granular media of a filter for enhancing the removal of organic (for example, biodegradation of organic HAA precursors) and inorganic constituents prior to the distribution system. Biofiltration systems enhance finished drinking water quality and are increasingly operated throughout North America by surface water facilities. A survey of 45 full-scale biofiltration facilities across the U.S. and Canada identified organic carbon reduction or DBP reduction as a goal. Twenty-eight (62%) of these facilities had ozonation upstream of biofiltration (Evans et al., 2019).
Granular media filters (that is, anthracite/sand or GAC) can be operated in biological mode without the maintenance of a disinfectant residual across the bed. Biological activity within the filters can be influenced by different factors, including filter media, water quality, temperature, oxidant dose and type, and backwashing methods (McGuire et al., 2014; Liu et al., 2017a; Evans et al., 2019; Health Canada, 2020). For example, GAC biofilters can demonstrate a superior performance than anthracite biofilters as microorganisms exhibit a better adhesion to GAC through their adsorption to its surface and pores, protecting microorganisms from detachment during backwashing (Liu et al., 2017a). In general, HAA precursors are more susceptible to removal by biological treatment than THM precursors (Miltner et al., 1992; Speitel et al., 1993). Since ozone oxidizes NOM to form biodegradable organic matter, biological filtration provides additional HAA precursor removal (Miltner et al., 1992; Speitel et al., 1993). It also helps to create biologically stable water after ozonation, minimizing regrowth of microorganisms in the distribution system (McGuire et al., 2014).
In a bench-scale study, biological filtration decreased HAA FP by 75% with and without pre-ozonation (Miltner et al., 1992). However, the batch bioreactors employed in the study utilized a five- to seven-day reaction time, which is very different from the minutes to hours of detention time typically used in full-scale systems. Therefore, this level of removal is higher than what may be attainable in full-scale processes. Speitel et al. (1993) demonstrated 25%–30% removal of HAA precursors by biodegradation in the absence of pre-ozonation, and 70% removal with pre-ozonation. The maximum biodegradation was observed at ozone doses of 2 to 3 mg/mg TOC. Only DCAA, TCAA and DBAA were monitored in this research with ozone doses ranging from 0.5 to 5 mg/mg TOC. However, at the highest ozone dose (5 mg/mg TOC), the additional biodegradation was unable to offset the DBP formation potential (for example, DCAA formation) produced during ozonation.
The effect of biofiltration with or without pre-ozonation on HAA9 formation was investigated by McKie et al. (2015) in pilot-scale studies using source waters from Lake Ontario and Otonabee River. The Lake Ontario pilot treatment plant influent had DOC between 1.5 and 2.5 mg/L with bromide concentration of 40 µg/L and was treated by anthracite and GAC biofilters preceded by ozonation, whereas Otonabee River influent (DOC: 4–6 mg/L, bromide: 0.5 µg/L) was treated by anthracite and biofilters without pre-ozonation. Higher biomass activity was observed on Otonabee River biofilters due to the higher DOC and nitrogen concentrations. Though HAA9 FP reduction was 0.7–1.5 times more effective than the DOC reduction by biofiltration of Otonabee River water, it was still relatively low (4.3%–10%). For Lake Ontario water, the best performance was demonstrated by GAC biofilters that received water treated with 0.8 mg/L PACl coagulant after pre-ozonation. Though ozonation itself did not impact HAA9 formation, GAC biofilters coupled with PACl achieved HAA9 FP reductions of 45% (16 min. empty bed contact time [EBCT]) and 54% (26 min. EBCT). Arnold et al. (2018) investigated ozone-biological filtration systems in relation to HAA5 FP. The pilot-scale system contained either a biological filtration column with BAC or anthracite. The ozonated BAC column was superior to the ozonated anthracite column with respect to TOC removal. A 51% reduction in HAA5 was achieved with the combination of ozone and BAC, whereas BAC alone was only able to achieve a 24% reduction in HAA5.
Two full-scale and two pilot-scale treatment plants with biologically active filters were evaluated in terms of reduction of DOC, THM FP and HAA9 FP in the states of Georgia, Texas and Florida, U.S. (Selbes et al., 2017). Both full-scale treatment plants employed an ozonation-coagulation-flocculation-biological filtration treatment train with anthracite as the filter media (water temperature ranged from 21 °C to 22 °C). The pilot-scale treatment plants had pre- and intermediate ozonation with GAC and anthracite as filter media. The observed reduction in DOC, THM FP and HAA9 FP in all selected biofilters were in the order of HAA9 FP > THM FP > DOC. For example, DOC was decreased by 5%–25%, while HAA9 FP by 18%–57%. The authors concluded that the removal of HAA precursors was more preferential than bulk NOM. The biofilters did not remove bromide, so the DOC removal increased the bromide-to-DOC ratio and the fraction of brominated THMs and HAAs in the treated water in comparison to the influent water. Delatolla et al. (2015) studied the potential of biological filtration to reduce the formation potential of DBPs at a DWTP located in Ottawa, Ontario. The HAA5 FP decreased by 78% and the highest decrease in HAA5 FP was observed immediately following a backwash event of a full-scale, biologically active filter, with anthracite and sand media. This suggests that a higher frequency of backwashing can reduce the formation of DBPs.
5.1.1.4 Granular activated carbon
The U.S. EPA identifies GAC adsorption as one of the best available technologies for removal of DOC from raw water. The GAC removal of organic precursors that form regulated DBPs, such as THMs and HAAs, has been widely studied in drinking water treatment applications (Erdem et al., 2020; Verdugo et al., 2020). Removal efficacy of GAC depends on EBCT, water temperature, GAC configuration, the type of carbon used, backwash frequency and DBP species being adsorbed. GAC adsorption capacity varies widely, depending on the quality of the source water (for example, HAA precursor characteristics) and the pretreatment of the raw water (for example, pre-chlorination). Two major challenges reported are the size exclusion effect of GAC pores for high MW NOM fractions (greater than 10 kDa) and its ineffectiveness for the removal of bromide and other inorganic DBP precursors (Jiang et al., 2017; Erdem et al., 2020).
Generally, chlorine should not be introduced before GAC filtration as chlorine oxidizes the carbon surface and reduces its ability to adsorb organic compounds. However, studies suggest that the addition of chlorine prior to GAC filtration may reduce subsequent DBP formation (Jiang et al., 2017, 2018; Erdem et al., 2020). It has been postulated that this is due to the formation of aromatic, halogenated DBPs acting as intermediate DBPs and further decomposing during chlorination to form other DBPs such as THMs and HAAs. These intermediate aromatic DBPs are smaller in size and may have better access to the micropores of activated carbon particles, thus making better use of GAC total pore volumes. Additionally, they are typically hydrophobic with a higher affinity toward GAC (Jiang et al., 2017). For high-bromide waters, chlorination before GAC treatment oxidizes the bromide, resulting in its subsequent incorporation into hydrophilic NOM molecules and making them more adsorbable (McGuire et al., 2014).
Jiang et al. (2017) conducted rapid small-scale tests to compare the results of two approaches: GAC adsorption prior to chlorination for NOM removal (traditional approach) vs. GAC adsorption during chlorination for intermediate aromatic DBP removal (novel approach) (Table 25). Chlorine was dosed before GAC to achieve primary disinfection chlorine levels. A chlorine residual was not detectable after the GAC treatment in the novel approach, so it is important that secondary disinfection is addressed after the GAC step to ensure that there is a disinfectant residual in the distribution system. With the novel approach, the bed volumes (BV) of 50% TOX breakthrough (BV50%) in the bromide-containing waters were substantially longer (5900 BVs) than those in the bromide-free waters (3350 BVs). This suggests an enhanced adsorption of brominated DBPs over chlorinated DBPs during the GAC adsorption.
| Simulated raw water | GAC characteristics | HAA removal | Process description |
|---|---|---|---|
|
|
Traditional approach
Novel approach
|
Traditional approach - Raw and treated waters were subjected to chlorination under the same CT values in both traditional and novel approach GAC adsorption prior to chlorination. Novel approach - GAC adsorption during chlorination. A 30-min. chlorination was conducted to simulate a typical disinfection scenario in water treatment systems. |
CaCO3 – calcium carbonate; Cl2 – chlorine; CT – the product of “C” (the residual concentration of disinfectant, measured in mg/L) and “T” (the disinfectant contact time, measured in minutes – typically calculated using a T10 value, which is defined as the detention time at which 90% of the water meets or exceeds the required contact time); EBCT – empty bed contact time; GAC – granular activated carbon; HAA – haloacetic acid; HAA5 – sum of MCAA, DCAA, TCAA, MBAA and DBAA; HAA9 – sum of HAA5 and BCAA, TBAA, CDBAA, BDCAA; KBr – potassium bromide; NaHCO3 – sodium bicarbonate; NaOCl – sodium hypochlorite; NOM – natural organic matter. Source: Jiang et al. (2017) |
|||
Jiang et al. (2018) also investigated the effect of different chlorine contact times (0.5, 1.0, 1.5, 2.0, 2.5, or 3.0 hours) on removal of TOX through the novel and traditional approaches in batch experiments with Suwannee River NOM and coconut-based GAC. A dose of 5 mg/L NaOCl as Cl2 was added to the simulated source water containing 1 mg/L KBr as bromide. The TOX level in the Suwannee River NOM sample with the traditional approach increased from 224 to 418 μg/L as Cl with an increase in chlorine contact time, whereas with the novel approach, the TOX level in the treated sample was kept relatively low and nearly constant (120–136 μg/L as Cl) with increased contact time (from 0.5 to 3.0 hours). In general, the TOX removals with the novel approach (up to 75%) were two to three times higher than those with the traditional approach (up to 36%) (Jiang et al., 2018).
Erdem et al. (2020) conducted a systematic study to investigate the effects of GAC characteristics and different NOM isolates on pre-chlorination efficacy and on the subsequent reduction of DBP formation (Table 26). The removal efficacy of HAA9 precursors of Suwannee River NOM by two activated carbon types was studied by conducting rapid small-scale column tests with 50 mg/L of each type of GAC. A lignite-based GAC (HD3000) exhibited a better precursor removal than a bituminous coal-based GAC. HD3000 was selected to evaluate the effect of NOM characteristics (that is, high SUVA254 vs. low SUVA254) in the presence of 200 µg bromide/L. The highest decrease was observed for brominated HAA precursors with pre-chlorination. At the same DOC level, without pre-chlorination, HAA formation decreased after lignite-based GAC treatment in all NOM solutions. However, pre-chlorination further decreased HAA formation only for Suwannee River NOM but not for the other NOM solutions. Erdem et al. (2020) concluded that pre-chlorination of low and high SUVA254 organic matter affects the GAC adsorption of HAA precursors differently. Water treatment plants with high raw water bromide concentrations can control DBP formation by applying chlorine before the GAC filters.
| Simulated raw water | GAC characteristics | HAA9 – UFC decrease | Process description |
|---|---|---|---|
1. Suwannee River NOM (SRNOM)
2. NOM extracted from raw water of a treatment plant in South Carolina (RWNOM)
3. NOM extracted from treated water of a treatment plant in South Carolina (TWNOM)
|
Bituminous coal-based GAC (F400) with microporous structure (pore size < 2 nm) Lignite-based GAC (HD3000) with mesoporous structure (that is, 2 nm < pore size < 50 nm) |
Suwannee River NOM Pre-chlorination:
Without pre-chlorination 10% for F400
Without pre-chlorination
Pre-chlorination
|
Experiments were conducted at bromide concentrations of 0, 200 and 800 µg/L. 2 mg/L HOCl was selected for 30-min. pre-chlorination. |
DOC – dissolved organic carbon; GAC – granular activated carbon; HAA9 – sum of MCAA, DCAA, TCAA, MBAA, DBAA, BCAA, TBAA, CDBAA and BDCAA; NOM – natural organic matter; SUVA – specific ultraviolet absorbance; UFC – uniform formation conditions. Source: Erdem et al (2020) |
|||
5.1.1.5 Ion exchange
Anionic ion exchange (AIX) is considered as an alternative process to coagulation/flocculation and activated carbon adsorption for DOM removal. AIX removes a wide range of DOM types, can be applied in different reactor configurations, and can be operated continuously or intermittently (Boyer, 2015). AIX systems use non-fixed bed technologies that utilize AIX resins in fluidized, suspended and magnetic forms (Metcalfe et al., 2015; Caltran et al., 2020). Small-bead magnetic ion exchange (MIEX) resins can be used in fluidized ion exchange processes because of its rapid settling, but also larger, typical resins can be used in this configuration, whereas suspended ion exchange uses only a typical strong base resin (Caltran et al., 2020). In comparison to the MIEX process, the suspended ion exchange process is a single-pass plug flow system. It limits resin fouling and provides more stable adsorption kinetics (Metcalfe et al., 2015). Generally, AIX treatment of drinking water has the potential to increase lead release due to the co-removal of sulfate with DOC and the stoichiometric release of chloride (Boyer, 2015). This phenomenon leads to an increase of the chloride-to-sulfate mass ratio, which plays a role in lead release due to galvanic corrosion (Health Canada, 2022). This side effect needs to be considered and addressed when using AIX as a technology. Additionally, decrease of pH occurs from freshly regenerated ion exchange resin due to removal of bicarbonate ions during the initial BVs of a run (Rubel, 2003; Clifford, 1999; Wang et al., 2010; Clifford et al., 2011). Mitigation strategies to address potential corrosion issues can be found elsewhere (Health Canada, 2022).
MIEX resin has been shown to control DBPs, in particular by controlling hydrophilic organic precursors. It has been used either as an alternative to coagulation or as an adjunct to reduce coagulant doses (Bond et al., 2011, Rajca et al., 2017 Health Canada, 2020). Additionally, the treatment combination of MIEX with coagulation has shown greater reductions in the fouling of microfiltration and ultrafiltration (UF) membranes because it removes both dissolved (low MW) and colloidal (high MW) fractions of organic matter (Boyer, 2015). Since MIEX resin is less effective for removal of bromide and other inorganic anions, selective ion exchange resins need to be used to achieve a potential reduction of Br-DBP formation (Soyluoglu et al., 2020).
In the studies of Singer and Bilyk (2002) and Boyer and Singer (2005) with raw waters from different water treatment systems across the United States, MIEX treatment showed better results for the removal of HAA9 FP in comparison to alum coagulation (Table 27). In a continuous-flow pilot treatment plant study conducted at four locations in the U.S., Singer et al. (2007) established that MIEX was effective at removing DOC and UV-absorbing materials in waters with a higher SUVA254 (greater than 3.0 L/mg∙m). No additional HAA9 FP removal was seen with the coagulation of MIEX-treated waters (Boyer and Singer, 2005).
| Treatment process | HAA9 FP percent removal under UFC | Process details | Reference |
|---|---|---|---|
Magnetic ion exchange |
59–80 |
Bench scale
|
Singer and Bilyk, 2002 |
Magnetic ion exchange |
50–70 |
Bench scale
|
Boyer and Singer, 2005 |
Magnetic ion exchange |
44–74 |
Pilot scale
|
Singer et al., 2007 |
Alum coagulation |
19–72 |
Bench scale
|
Singer and Bilyk, 2002 |
Alum coagulation |
17–35 |
Bench scale
|
Boyer and Singer, 2005 |
| DOC – dissolved organic carbon; FP – formation potential; HAA9 – sum of MCAA, DCAA, TCAA, MBAA, DBAA, BCAA, TBAA, CDBAA and BDCAA; MIEX – magnetic ion exchange; TOC – total organic carbon; UFC – uniform formation conditions. | |||
Singer et al. (2007) focused on the speciation of HAAs before and after treatment with MIEX resin. The treatment process decreased DCAA (around 60%) and TCAA (around 75%) concentrations, and HAA speciation shifted to more heavily brominated forms. For example, DBAA and BDCAA concentrations were higher in treated water than in raw water. These results can be explained by the decrease of DOC concentration in treated water and a lower chlorine dosage required for achieving desired chlorine residuals. As the bromide to chlorine ratio increased, the HAA speciation shifted to more brominated forms. Though MIEX can remove bromide to some degree, it removes DOC to a greater degree (Singer and Bilyk, 2002; Boyer and Singer, 2005; Singer et al., 2007). High sulfate and bicarbonate concentrations in water are expected to limit bromide removal by the MIEX resins. Singer et al. (2007) concluded that hydrophobic and transphilic acid fractions of DOM were better removed by the MIEX resins than hydrophilic fractions, which also included hydrophilic bases and neutral species. Transphilic acids are the DOM fraction that are more hydrophilic and less aromatic than fulvic acids. They also have a greater nitrogen and oxygen content (Brown et al., 2004). Similar conclusions were made by Gan et al. (2013) when drinking and effluent-impacted waters were treated by MIEX resins in batch experiments. The relatively low DOC removal in effluent-impacted waters with SUVA254 less than 3.0 L/mg∙m was due to the preferential removal of the hydrophobic fraction over the hydrophilic fraction by MIEX. The removal of HAA9 FP ranged from 42% to 87%, with lower removal achieved in effluent-impacted waters.
Metcalfe et al. (2015) compared DBP FPs of three United Kingdom surface waters (ranged from low to high DOC) treated by a full-scale conventional process that included pretreatment with powdered activated carbon and pilot-scale processes using a novel suspended ion exchange (SIX) process and inline aluminum coagulation followed by ceramic membrane filtration. The SIX process itself had similar HAA9 FP results with conventional treatment for the low and moderate DOC source waters and had lower performance results for the high DOC water. However, when SIX was combined with coagulation (with coagulant dose reduction greater than 50%), the HAA FP was very low for all the water sources. The combined process reduced the raw water DBP FP by 83%–97%. HAA FP was 62% lower than that achieved by conventional treatment (Metcalfe et al., 2015). Though no NOM was being removed directly by the membrane, the SIX/alum coagulation/ceramic membrane filtration process significantly reduced Br-DBP concentrations in comparison to conventional treatment. Removal of bromide by SIX was found to be related to bicarbonate alkalinity. The highest bromide removal was observed in the water with the lowest alkalinity (Metcalfe et al., 2015).
The addition of the AIX process at the beginning of the treatment train can influence other treatment processes outside of the reduced coagulation dose. For example, several DWTPs in the North Sea region considered AIX in non-fixed bed configurations for NOM removal (Caltran et al., 2020). Based on their pilot experiments at three different locations, the authors concluded that AIX did not have a beneficial influence on the ceramic membrane fouling in comparison to coagulation. However, AIX removed the precursors of assimilable organic carbon (that is, the fraction of DOC that is readily assimilated by microorganisms), which is formed during advanced oxidation with UV/H2O2. It also reduced energy consumption during UV/H2O2 treatment due to NOM and nitrate removal (Caltran et al., 2020).
Soyluoglu et al. (2020) compared the performance of different anion exchange resins, particularly two novel bromide selective resins, for the removal of bromide at 250 µg/L. The performance of bromide-selective resins (Purolite-Br and MIEX-Br) was evaluated against the performance of traditional anion exchange resins (IRA900, IRA910, MIEX-Gold and MIEX-DOC) in the presence of competing anions. Both typical and challenging background water conditions were designed for these batch experiments by varying the concentrations of anions and organic matter. Under all conditions, Purolite-Br resin exhibited the highest removal efficacies (up to 90%) for bromide, followed by MIEX-Br, IRA910, IRA900, MIEX-Gold and MIEX-DOC, respectively. The sulfate and chloride coexisting anions had the greatest influence in terms of decreasing the bromide removal efficacy for all resins. The performance of the Purolite-Br resin and the formation of HAA9 under UFC were assessed in two NOM solutions at two different DOC concentrations (Table 28). It was demonstrated that the NOM aromatic character had no effect on bromide removal by Purolite-Br resin, but an increased DOC concentration of 7.5 mg/L reduced the bromide removal.
| Simulated raw water DOC: 2.0 and 7.5 mg/L; Bromide 250 µg/L; pH 6 – 9 |
AIX characteristics | HAA9 – UFC |
|---|---|---|
1. Transphilic NOM
|
Bromide selective IX resin: Purolite Bromide Plus/9218
|
DOC = 2.0 mg/L Decrease in the formation of Br-HAAs (DBAA, TBAA, DBCAA, BCAA, and BDCAA) was more than 90% for both NOM solutions. The formation of DCAA and TCAA increased after the resin treatment, particularly for the hydrophobic NOM solution. DOC = 7.5 mg/L Bromide removal was reduced from 85% to 73%. After the resin treatment, the total HAA formation shifted to mostly TCAA and DCAA formation in both NOM solutions. |
AIX – anionic ion exchange; BCAA – bromochloroacetic acid; BDCAA – bromodichloroacetic acid; Br-HAAs – brominated HAAs; DBAA – dibromoacetic acid; DBCAA – dibromochloroacetic acid; DCAA – dichloroacetic acid; DOC – dissolved organic carbon; HAAs – haloacetic acids; HAA9 – sum of MCAA, DCAA, TCAA, MBAA, DBAA, BCAA, TBAA, CDBAA and BDCAA; IX – ion exchange; NOM – natural organic matter; SUVA – specific ultraviolet absorbance; TBAA – tribromoacetic acid; TCAA – trichloroacetic acid; UFC – uniform formation conditions. Source: Soyluoglu et al. (2020) |
||
The AIX process requires frequent regenerations, producing large volumes of high-concentration spent brine that creates disposal issues (Amini et al., 2018; Wright, 2022). The management and shipment of regenerant chemicals may also be an issue for small and/or remote drinking water treatment systems (Amini et al., 2018). Biological ion exchange (BIEX), on the other hand, uses a naturally developing biofilm, formed by microbes in the raw water source, that consumes the attached DOC (Zimmermann et al., 2021). The BIEX technology has fewer regeneration cycles during drinking water treatment (months rather than days), thus resulting in less spent brine. Several bench- and pilot-scale studies evaluated BIEX and the factors that affect performance and demonstrated successful removal of DOC and DBP precursors (Amini et al., 2018; Liu et al., 2020b, 2022; Edgar and Boyer, 2021; Zimmermann et al., 2021, 2023; Wright, 2022; Lee et al., 2023).
5.1.1.6 Membrane separation
Membrane processes (UF and nanofiltration [NF]) were widely examined in drinking water treatment as an effective technology for removing DBP precursors. These processes can enhance or potentially replace conventional treatment (Lee and Cho, 2004; Ates et al., 2009). The predominant DBP precursor removal mechanisms by membranes are size exclusion and charge repulsion in higher pH levels (Lee and Cho, 2004; Zazouli and Kalankesh, 2017; Health Canada, 2020). In general, HAA precursors have a MW of less than 10 kDa, and membrane processes that can reduce HAA FP include UF, NF and reverse osmosis (RO) (Health Canada, 2020). Charged UF membranes usually achieve higher removals of hydrophobic NOM in comparison to uncharged UF membranes (Cho et al., 2000; Zazouli and Kalankesh, 2017). However, charged UF membranes are ineffective for the removal of hydrophilic NOM. NF is a pressure-driven membrane process that can successfully remove organic HAA precursors (Lamsal et al., 2012), and RO can remove both organic and inorganic DBP precursors simultaneously (Zazouli and Kalankesh, 2017). UF is suitable for the pretreatment step required by both NF and RO. The main limitation of NF and RO membranes in drinking water treatment is their organic and biological surface fouling and scaling (Mallya et al., 2023). RO also remains relatively expensive, and the disposal of the generated concentrate restricts the widespread application of this technique in DWTPs (Zazouli and Kalankesh, 2017). Since RO completely removes alkalinity in water, it continually lowers treated water pH and increases its corrosivity. Therefore, the treated water pH must be adjusted, and alkalinity may need to be increased to avoid corrosion issues in the distribution system, such as the leaching of lead and copper (Schock and Lytle, 2011; U.S. EPA, 2012).
Ates et al. (2009) evaluated the performances of lab-scale NF and UF membrane systems on DBP precursor removal in a surface water with low to medium DOC (3.4 mg/L) and SUVA254 (2.5 L/mg∙m) levels. The concentration of bromide in the water was 50 ± 10 µg/L. A total of four polymeric UF and NF membranes with different MW cut-off (MWCO) were tested in this study. Two NF membranes were negatively charged with a proprietary active nanopolymer layer. The HAA9 formation was examined according to the UFC protocol. The raw water had two different organic fractions with average MWs of 12 216 (28%) and 1 822 (72%) Da. All membranes removed high MW NOM fractions (89%–98% removal), but, for low MW fractions, the membrane rejection was inadequate, even for the NF membranes (30%). The highest reduction (89%) in HAA9 formation was achieved by one of the NF membranes, whereas the highest reduction achieved by UF membrane was 38%. The predominant species of HAAs in the untreated water were TCAA (42%) and DCAA (21%). After UF and NF membrane treatment, the HAA speciation shifted to the brominated species. The increase in bromine incorporation indicated that the tested membranes rejected DOC to a greater extent than bromide ion. In general, the reduction in HAA9 formation was lower than that of UVA254 and DOC. This difference indicated the higher association of HAA formation with low MW fractions and that the reduction of UVA254 and DOC may not be directly linked to DBP formation reduction in membrane processes (Ates et al., 2009).
The effect of UF treatment on HAA precursor removal at a full-scale treatment plant in Nova Scotia, Canada was evaluated by Lamsal et al. (2012). The treatment plant consists of an integrated membrane design with UF followed by NF. The DOC of the raw water (French River water) was 5.5 mg/L with large percentages of hydrophilic neutral (50.4%) and hydrophobic acid (35.3%). The HAA formation was examined according to the UFC protocol. In this study, the UF treatment provided approximately 66% DOC removal, while the NF removed 83% of the remaining DOC. The authors indicated that the UF pretreatment led to very low fouling conditions for the NF membrane, which only required cleaning once in a two-year period. The overall reduction in HAA formation with UF treatment was 77%. The UF treatment decreased the hydrophobic acid fraction of NOM by 93%. In this source water, this fraction was the most important driver for DBP formation. The HAA formation was 10 times higher from the hydrophobic acid fraction than from the hydrophilic neutral fraction, confirming that the UF system was effective for this source water.
Ceramic membranes (for example, titanium dioxide membrane) can be used for longer periods than polymeric membranes owing to their resistance to harsh chemical environments and their superior physical properties. Lee and Cho (2004) compared the performances of the tight ceramic UF membrane (T-1000) and the polymeric NF membrane (labelled ESNA) with an MWCO of 1 000 Da and 250 Da, respectively. The experiments were performed using a bench-scale membrane unit. Both membranes exhibited similar NOM removal trends. The T-1000 membrane removed larger amounts of the hydrophobic and transphilic NOM than expected. Even the hydrophilic NOM (with an average MW of 820 Da) was effectively removed (around 70%) by T-1000 (MWCO of 1000 Da). The authors attributed these results to the higher membrane surface charge of the ceramic UF membrane and to hydrodynamically induced back diffusion from its membrane surface. In relation to the reduction in HAA6 FP and HAA9 FP, both membranes showed similar efficacies. For HAA6 FP, both tested membranes had a removal of 77.1%. For HAA9 FP, the reduction was 79.3% and 80.9% for T-1000 and ESNA, respectively. The tight ceramic UF membranes, with their higher permeability, are good candidates for the removal of HAA precursors.
5.1.2 Removal of formed HAAs
Minimizing the formation of HAAs is the preferred strategy in order to control their drinking water concentrations. However, in some cases, pre-chlorination prior to precursor removal may be required (for example, for biofilm or zebra mussel control). Additionally, large distribution systems and consecutive systems may have locations with high levels of HAAs. In these cases, formed HAAs may be reduced through treatment processes (GAC, BAC or membrane separation), but aeration is not effective in removing HAAs (Johnson et al., 2009; McGuire et al., 2014). GAC treatment can be used in the treatment train as filter-adsorbers, which are usually retrofitted rapid filters (EBCT3–9 minutes) or as postfilter-adsorbers (EBCT 15–20 minutes). GAC filter-adsorbers are often used for controlling episodic DBP issues (for example, spring runoff) similar to powdered activated carbon (McGuire et al., 2014). NF and RO have also been examined for HAA removal (Chalatip et al., 2009; Yang et al., 2017; Wang et al., 2018). Some water treatment systems also consider the installation of localized GAC or BAC treatment to control areas of high HAAs in distribution systems. It is important to note that HAAs will continue to form after any of these treatment options as any remaining NOM and chlorine continue to react.
5.1.2.1 GAC and BAC
Pilot-plant experiments were conducted at the water treatment plant of Galatsi, Athens, Greece with a GAC filter-adsorber (EBCT 9.5 minutes) (Babi et al., 2003) and a GAC postfilter-adsorber (EBCT 14 minutes) (Babi et al., 2007). It is a conventional treatment plant with pre-chlorination. The GAC postfilter-adsorber showed a significantly higher breakthrough capacity (breakthrough at 20% removal) than the GAC filter-adsorber. The breakthrough capacity was found to be 2.7 times higher for HAA9 and 4.1 times higher for DOC (Babi et al., 2007). The authors observed that the remaining DOC concentrations after both filtrations were still relatively high. They concluded that, when evaluating breakthrough, both the DOC and HAA concentrations in the GAC effluent should be monitored, and GAC should be replaced when the first parameter reaches its breakthrough.
Water temperature and EBCT are two major factors that affect BAC design and operation. In the study by Lou et al. (2016), the removal of the HAA5 from treated drinking water by a pilot-scale BAC treatment system was investigated at various pH levels and EBCTs at 22.0 ± 2 °C. The treatment system reduced HAAs by approximately 80% at neutral pH. The EBCT ranged from 30–50 minutes, and the HAA removal increased from 80% to 83% with longer EBCT. Among five HAA species, the TCAA was not easily removed by the biological filter.
Wu and Xie (2005) investigated the effects of EBCT and water temperature on HAA6 removal in BAC columns. BAC samples were obtained from a local surface water treatment plant from GAC filters that had been online for 2.5 to 3.0 years. Experiments were conducted at different temperatures and EBCTs. The results of this study indicated that water temperature, EBCT, and HAA speciation affected the HAA removal in BAC columns (Table 29). In general, increasing water temperature or EBCT increased the removal of HAAs. However, at 20 °C and higher, increasing EBCT beyond five minutes yielded little benefit in HAA removal. It was concluded that a longer EBCT could be used to compensate for the effect of low water temperature. Biodegradation was found to be less effective for removal of brominated compounds (Miltner et al., 1992).
| Temperature (°C) | HAA species | Average HAA removal (%) |
|---|---|---|
| 4 | MCAA | 39 |
| 4 | DCAA | 27 |
| 4 | TCAA | 7 |
| 10 | MCAA | 79 |
| 10 | DCAA | 56 |
| 10 | TCAA | 23 |
| 20 | MCAA | 99 |
| 20 | DCAA | 96 |
| 20 | TCAA | 56 |
DCAA – dichloroacetic acid; HAA – haloacetic acids; MCAA – monochloroacetic acid; TCAA – trichloroacetic acid. Source: Wu and Xie (2005). |
||
A pilot-scale study was conducted in a reservoir/pump station to evaluate the removal of HAA5 by GAC/BAC (Johnson et al., 2009). The removal of HAA5 by GAC decreased from 100% to 70% after 20 000 BVs. When GAC transitioned to BAC, the HAA5 removal increased back to 100%at 30 000 BVs and remained at this level for the remainder of the pilot plant operation (52 000 BVs). When considering DBP reformation in the distribution system after rechlorination, the authors demonstrated that treating 50% of the distribution system water with BAC resulted in a reduction of HAA5 by at least half. The localized BAC treatment also resulted in concentrations below 60 µg/L for HAA5 for an additional 170 hours of contact time following rechlorination. The results of this study demonstrated that a localized treatment approach can be a practical alternative to the centralized DBP treatment.
5.1.2.2 Membrane separation
Though RO and NF have been widely used for the treatment of trace organic compounds in water, only a limited number of studies have evaluated the effectiveness of HAA5 rejection by NF/RO membranes (Yang et al., 2017). Chalatip et al. (2009) conducted a series of batch experiments to examine HAA5 removal efficacies of three NF membranes (Table 30). Since the MWs of HAA5 range from 94.5 to 163.5 Da, the authors concluded that electrostatic interaction between anions of HAA5 (at pH 6) and membrane surface charge also occurred. An increased operating pressure resulted in a performance decrease of the two negatively charged membranes. It was probably due to the increased permeate flux, which enhanced the concentration polarization across the membrane, resulting in the decrease in HAA5 rejection. Only the neutral membrane positively responded to the increased pressure. The authors speculated that with the operating pressure increase, more HAA5 anions would be trapped, forming a negative surface charge layer, which would repel other anions. The larger HAA species (for example, DBAA and TCAA) were retained less than the smaller HAAs. These results are correlated with the pKa values of individual species (for example, higher pKa represented higher reduction percentage). Chalatip et al. (2009) explained this phenomenon by HAA hydrogen bonding with water molecules. For example, TCAA has the lowest pKa and the highest hydrogen bonding potential. Therefore, TCAA would be more soluble than other species, and this would enhance TCAA movement through the membrane pores.
| NF membrane | Effect of operating pressure (1 x 10⁵ to 5 x 10⁵ Pa) |
Effect of HAA5 concentration (60 to 120 μg/L) |
|---|---|---|
ES 10:
|
Decrease in HAA5 reduction with the increase in operating pressure. HAA5 reduction between 90% and 100%. |
No clear changes in HAA5 reduction as it is likely that electrostatic repulsion, which was enhanced at a high feed concentration, would counterbalance the sieving effect at the membrane surface. |
NTR 7410:
|
Decrease in HAA5 reduction with the increase in operating pressure. HAA5 reduction between 75% and 90%. |
No clear changes in HAA5 reduction as it is likely that electrostatic repulsion, which was enhanced at a high feed concentration, would counterbalance the sieving effect at the membrane surface. |
NTR 729HF:
|
Increase in HAA5 reduction with the increase in operating pressure. HAA5 reduction between 65% and 90%. |
HAA5 reduction percentage lowered from about 85% to 55% when feed concentration was increased. |
HAA – haloacetic acid; HAA5 – sum of MCAA, DCAA, TCAA, MBAA and DBAA; MWCO – molecular weight cut-off; NF – nanofiltration. Source: Chalatip et al. (2009) |
||
High energy consumption and low water recovery are serious limitations for extensive adoption of RO. Wang et al. (2018) evaluated an innovative, multi-stage RO system for rejection of seven HAAs including MIAA. The RO membrane was a commercial low-pressure membrane in spiral form made with cross-linked polyamide and microporous polysulfone. The system had five sequential RO stages. Every following stage was fed with the concentrate from the previous one. At the end of the treatment, the water recovery was 87%. In general, the ultimate rejection efficacy ranged from 74.6%–98.0% for all HAAs. The HAA rejections were ranked as follows: tri-HAAs > di-HAAs > mono-HAAs. The authors stated that if the compounds had equal halogenation degrees, their rejection by RO would be similar. Though the MW of MIAA was greater than those of BCAA and TCAA, MIAA rejection using the multi-stage RO process was 17.7% and 23.1% lower than BCAA and TCAA, respectively. It was concluded that the HAA MW alone was poorly correlated with the HAA rejection for this system. The hydrophobic interaction and charge repulsion were additional factors that affected the HAA removal. Additionally, the increased pH (from 6.5 to 8.5) and the membrane age (from virgin to used) led to improved HAA rejections.
5.1.3 Waste residuals
Treatment technologies may produce a variety of residuals (for example, backwash water, reject water/concentrate, media waste, off-gases). The appropriate authorities should be consulted to ensure that the disposal of all waste residuals from the treatment of drinking water meet applicable regulations. Guidance can be found elsewhere (CCME, 2003, 2007).
5.2 Residential-scale treatment
For households that obtain drinking water from a private well that does not use chlorine to disinfect, HAAs would not be a concern. Systems classified as residential scale may have a rated capacity to treat volumes greater than that needed for a single residence, and thus may also be used in small systems.
Before a treatment unit is installed, the water should be tested to determine the general water chemistry and HAA concentration and speciation in the chlorinated source water. Periodic testing by an accredited laboratory should be conducted on both the water entering the treatment unit and the treated water to verify that the treatment unit is effective. Units can lose removal capacity through use and time and need to be maintained and/or replaced. Consumers should verify the expected longevity of the components in the treatment unit in accordance with the manufacturer’s recommendations and service it, when required. Choosing a unit with a warning (for example, alarm, light indicator) will indicate when servicing is required.
Health Canada does not recommend specific brands of drinking water treatment units, but it strongly recommends that consumers use units that have been certified by an accredited certification body as meeting the appropriate NSF International Standard/American National Standard Institute (NSF/ANSI) for drinking water treatment units. The purpose of these standards is to establish minimum requirements for the materials, design and construction of drinking water treatment units that can be tested by a third party. This ensures that materials in the unit do not leach contaminants into the drinking water (that is, material safety). In addition, the standards include performance requirements that specify the removal that must be achieved for specific contaminants (for example, reduction claim) that may be present in water supplies.
Certification organizations (that is, third parties) provide assurance that a product conforms to applicable standards and must be accredited by the Standards Council of Canada. The following organizations have been accredited in Canada (SCC, 2025):
- CSA Group
- NSF International
- Water Quality Association
- UL LLC
- Bureau de normalisation du Québec (available in French only)
- International Association of Plumbing and Mechanical Officials
- Truesdail Laboratories Inc
An up-to-date list of accredited certification organizations can be obtained from the Standards Council of Canada.
Point-of-use and point-of-entry filtration systems, as well as some pour-through filters that use activated carbon filters, may be able to remove HAAs, since they can effectively remove THMs. However, there are no certified devices for the removal of HAAs from drinking water that rely on an adsorption (activated carbon) technology. HAAs are not included in the performance requirements of NSF/ANSI Standard 53 (Drinking Water Treatment Units – Health Effects). This standard includes criteria for the reduction of TBAA as part of the Volatile Organic Chemicals certification. For certification, the device must be capable of reducing an average influent TBAA concentration of 0.042 mg/L (42 μg/L) to a maximum effluent concentration of 0.001 mg/L (1 μg/L) (NSF International, 2023a). The performance of filters is dependent on several factors, including filter type, media type, flow rate, water quality and age of the filter. The use of filters in areas of high turbidity may cause filters to clog up very quickly without pretreatment.
RO treatment devices may be able to remove HAAs, but no certified devices are available for the removal of HAAs from drinking water that rely on RO technology. HAAs are not included in the performance requirements for NSF/ANSI Standard 58 (Reverse Osmosis Drinking Water Treatment Systems). This standard includes criteria for the reduction of TBAA as part of the Volatile Organic Chemicals certification. For certification, the device must be capable of reducing an average influent TBAA concentration of 0.042 mg/L (42 μg/L) to a maximum effluent concentration of 0.001 mg/L (1 μg/L) (NSF International, 2023b). In RO systems, membranes can be easily damaged by chlorine in the feed water. This damage can lead to lower removals and to the need for membrane replacement. Water that has been treated using RO may be corrosive to internal plumbing components. Therefore, these devices should be installed only at the point-of-use. Also, as large quantities of influent water are needed to obtain the required volume of treated water, these devices are generally not practical for point-of-entry installation.
Chowdhury et al. (2019) studied the filtration of synthetic water with THMs and HAA9 mixtures through point-of-use GAC filters. The GAC filtration reduced THMs in the range of 77.3%–92.8%, while HAA9 were reduced in the range of 64.7%–69.8%.
5.2.1 Alternative disinfection strategies for small or residential-scale systems
As with municipal scale, UV irradiation is an alternative disinfection technology that can be installed for small or residential-scale treatment systems. The responsible drinking water authority in the affected jurisdiction should be contacted to confirm the regulatory requirements that may apply for small systems.
UV disinfection is dependent on light transmission to the microbes through the raw water. Decreasing TOC will also reduce potential for UV lamp scaling. For this reason, some pretreatment of the raw water may be required to ensure the effectiveness of the UV disinfection.
The NSF/ANSI Standard 55 (Ultraviolet Microbiological – Water Treatment Systems) covers the certification requirements for UV disinfection systems. It addresses the Class A systems that are designed to inactivate and/or remove microorganisms, including bacteria, viruses, Cryptosporidium oocysts, and Giardia cysts from water. The Class A systems are not designed to treat wastewater or water contaminated with raw sewage and should be installed in visually clear water (NSF International, 2024).
6.0 Distribution system and other considerations
Within the distribution system, HAA concentrations can vary temporally and spatially. These changes depend on numerous factors, such as treatment processes, type(s) and dose(s) of oxidant and disinfectant, temperature, pH, type and quantity of NOM, inorganic precursors and microorganisms, presence of biofilms, pipe materials, corrosion, presence of sediments, hydraulic conditions, water age and distribution system operation and maintenance (Baribeau et al., 2006). For example, higher water demand reduces water residence time, minimizes water stagnation, and, consequently, reduces DBP formation in distribution systems (Scheili et al., 2015). Distribution systems are complex, and dynamic systems and more detailed information can be found with Health Canada (2020, 2022).
6.1 Seasonal variations
The seasonal variation of HAAs in a drinking water distribution system is based on the understanding of seasonal changes in water quality and operational water treatment strategies. For example, TOC levels are higher in summer than in winter (Rodriguez et al., 2004; Al-Tmemy et al., 2018). Chlorine dosage is also often increased in summer to maintain a proper disinfectant residual in the distribution system as high temperature conditions promote the accelerated depletion of residual chlorine. The kinetics of reactions between disinfectants and NOM are faster in warmer months, and HAA concentrations in a distribution system are typically lower in colder months (Lebel et al., 1997; Rodriguez et al., 2004; Baribeau et al., 2006; Al-Tmemy et al., 2018; Zhang et al., 2020). Chen and Weisel (1998) measured DBP concentrations, including HAAs, in a central New Jersey water distribution system for one year. They concluded that temperature and chlorine residual were the most important parameters controlling DBP concentrations. Scheili et al. (2015) concluded that the most significant variables for HAA formation in small distribution systems were TOC and temperature. The highest HAA5 levels were observed during summer and fall.
In a bench-scale experiments with post-filtration water collected from a water treatment plant, the increase in water temperature from 10 °C to 30 °C resulted in a two-fold increase of HAA5 concentration (Zhang et al., 2020). Al-Tmemy et al. (2018) sampled tap water at various residential areas fed by five water treatment plants during each season in Wassit Province, Iraq. The authors concluded that the total HAA9 concentrations in summer were approximately 1.5 times higher than those in winter. In a case study conducted by Rodriguez et al. (2004) at a treatment plant in the Quebec City region, the seasonal variation of HAAs in the distribution system was studied over wide temperature changes during a one-year period. Of the HAA5 group, only DCAA and TCAA were present, and the highest concentrations were observed during spring (about four times higher than in winter). It was also observed that DCAA levels were higher than TCAA levels in winter and spring, whereas TCAA levels were higher than DCAA in summer and fall.
6.2 HAA speciation
In a number of chlorinated and chloraminated distribution systems with low levels of bromide ions, the main HAA species detected at the highest concentrations were DCAA and TCAA (Rodriguez et al., 2004; Baribeau et al., 2006; Tian et al., 2017; Zhang et al., 2020). Rodriguez et al. (2004) found that DCAA and TCAA were identified in 51% and 49%, respectively, of all samples combined. In systems with high source water bromide concentrations, the fraction of Br-HAAs were found to be similar to the fraction of chlorine-containing HAAs (Baribeau et al., 2006). In the study by Al-Tmemy et al. (2018), the bromide levels ranged from 0.067 to 0.65 mg/L in the source waters of five water treatment plants. The authors found that, generally, the distribution of HAA species in tap water was: TCAA 28.5% ˃ DCAA 21.1% ˃ MCAA16.1% ˃ BCAA 8.7% ˃ BDCAA 8.40% ˃ MBAA 8.1% ˃ DBAA 7.70% ˃ TBAA 1.5%.
6.3 Residence time and HAA degradation
Studies have demonstrated that HAA concentrations reach a maximum value and gradually decrease at the maximum residence time locations (MRTL) in distribution systems (Chen and Weisel, 1998; Rodriguez et al., 2004; Speight and Singer, 2005; Tung and Xie, 2009; Scheili et al., 2015; Tian et al., 2017; Behbahani et al., 2018; Al-Tmemy et al., 2018). The MRTL typically had low levels of free chlorine and high heterothropic plate counts (HPCs), particularly during warmer temperatures. Studies have found a possible correlation between biological activity and HAA degradation in distribution systems (Meyer et al., 1993; Landmeyer et al., 2000; Rodriguez et al., 2004; Speight and Singer, 2005; Baribeau et al., 2005, 2006; Tung and Xie, 2009).
Baribeau et al. (2005) studied the biostability of HAA9 in simulated distribution systems (annular reactors) in both cold (12 °C to 14 °C) and warm (17 °C to 22 °C) waters. Two parallel reactor trains were used, with chlorinated or chloraminated water consisting of two annular reactors in series. The upstream reactor received water with a disinfectant residual, while the downstream reactor received dechlorinated or dechloraminated water. A reconditioning period was required for biofilm formation and to achieve pseudo-steady-state conditions in water with a residual disinfectant. Observations are described in Table 31. The authors speculated that the increased tri-HAA levels in the dechlorinated reactor may have resulted from the breakdown of other DBPs. It was noted that the experimental setup allowed only an approximate 12-hour retention time in the presence or absence of a disinfectant. Longer retention times may allow degradation of the di-HAAs in cold water or degradation of THAAs. Furthermore, different species of HAAs can be expected to peak at different locations of distribution system because of differences in formation kinetics and biodegradability.
| Disinfectant | Upstream reactor (cold water) | Downstream reactorTable 31 Footnote a (cold water) | Upstream reactor (warm water) | Downstream reactorTable 31 Footnote a (warm water) |
|---|---|---|---|---|
| Chlorine | Increase in HAA levels (for example, 46% for DCAA). | Unchanged levels for most species with a significant increase for TCAA and BDCAA. | Increase in HAA levels (for example, 95% for DCAA, 46% for TCAA). | Decrease in di-HAA levels (for example, ∼ 75% for DCAA). Tri-HAA levels remained constant or increased. |
| Chloramine | HAA levels relatively unchanged with an increase in DCAA levels. | HAA levels relatively unchanged. | Increase in DCAA levels. | Decrease in DHAA levels (for example, ∼ 60% for DCAA). Tri-HAA levels unchanged. |
BDCAA – bromodichloroacetic acid; DCAA – dichloroacetic acid; Di-HAAs – dihaloacetic acids; HAAs – haloacetic acids; TCAA – trichloroacetic acid; Tri-HAAs – trihaloacetic acids. Source: Baribeau et al. (2005)
|
||||
In addition to biodegradation of HAAs in the distribution systems, the presence of iron corrosion products from unlined cast iron pipes can degrade HAAs. Chun et al. (2007) demonstrate that Br-HAAs reacted more rapidly with carbonate green rust than their chlorinated analogues. Tri-HAAs can also undergo a self-decomposition process leading to the formation of corresponding THMs. The decomposition rates of tri-HAAs ranked as TBAA > CDBAA > BDCAA > TCAA (Zhang and Minear, 2002). Di-HAAs can be formed by base-catalyzed hydrolysis of dihaloacetonitriles and intermediate halogenated compounds (UTOX compounds) in the absence of chlorine residuals. The release of di-HAAs from the degradation of these halogenated compounds is enhanced at high pH conditions (Hua and Reckhow, 2012).
Several studies examined HAA changes between the point-of-entry and other points within the distribution system (Table 32). Scheili et al. (2015) sampled 25 small municipal systems located in two Canadian provinces, Quebec and Newfoundland and Labrador. The authors found that HAAs formed up to the middle of the distribution system and then further decreased in both spring and winter, with the exception of the winter samples in Quebec. During the summer and fall, degradation was observed more frequently and occurred from the beginning of the distribution system. The authors concluded that the HAA degradation was more significant in small systems than in medium or large distribution systems reported in the literature.
Baribeau et al. (2006) investigated the formation and decay of HAA9 in full-scale distribution systems. Five conventional water treatment systems were selected based on specific finished water characteristics with free chlorine or monochloramine as the secondary disinfectant. In the free chlorine systems, HAA9 concentrations generally increased or remained constant with increased residence time, except at the MRTLs (Table 32). In the chloraminated systems, HAA9 concentrations were relatively constant throughout the system, except at MRTLs, with the exception of one utility. In Utility D, HAA9 concentrations were constant and did not decrease at MRTLs in the absence of nitrification, lower HPCs, and stable chlorine residual. The decrease in HAA concentrations was most noticeable during the warmer months and when the free chlorine residual was low, which are the preferred conditions for biodegradation to occur.
Rodriguez et al. (2004) found that re-chlorination of distributed water, followed by a 22-hour residence time in a storage tank, resulted in a significant increase of DCAA and TCAA (only two HAA species detected). This result identified the need for an improved disinfection strategy for storage facilities.
| DWDS Disinfectant | DWDS location | Parameter | Impact | Reference |
|---|---|---|---|---|
Chlorine Chloramine |
Beginning |
Annual average HAA5 with free Cl levels ≤ 1.19 mg/L at beginning |
> 110.4 μg/L for NL; > 29.5 μg/l for QC |
Scheili et al. (2015) |
Chlorine Chloramine |
Middle |
Annual average HAA5 with free Cl levels ≤ 1.19 mg/L at beginning |
145.4 μg/L for NL; 52.9 μg/l for QC |
Scheili et al. (2015) |
Chlorine Chloramine |
Extremity |
Annual average HAA5 with free Cl levels ≤ 1.19 mg/L at beginning |
134.6 μg/L for NL; 51.7 μg/l for QC |
Scheili et al. (2015) |
Chlorine |
MRTL |
HAA9 |
Decrease of 41% – Utility A |
Baribeau et al. (2006) |
Chlorine |
MRTL |
HAA9 |
Decrease of 11%–26% (greater stability of chlorine and lower water age): Utility B |
Baribeau et al. (2006) |
Chlorine |
5-hour residence |
Annual average HAA2 |
1.5-fold increase (53.7 μg/L based on the samples with the highest concentration) |
Rodriguez et al. (2004) |
Chlorine |
14-hour residence |
Annual average HAA2 |
Significant decrease (29.9 μg/L based on the samples with the highest concentration) |
Rodriguez et al. (2004) |
Chlorine |
Downstream of re-chlorination reservoir |
Annual average HAA2 |
Significant increase (73.8 μg/L based on the samples with the highest concentration) |
Rodriguez et al. (2004) |
Chloramine |
MRTL |
HAA9 |
Decrease of 23%–85% (high HPCs and nitrification): Utility C |
Baribeau et al. (2006) |
Chloramine |
MRTL |
HAA9 |
Decrease of 59%–78% (high HPCs and nitrification): Utility D |
Baribeau et al. (2006) |
Chloramine and periods of chlorination |
MRTL |
HAA9 |
No clear decrease observed during the free chlorination nor chloramination periods: Utility E |
Baribeau et al. (2006) |
| DWDS – drinking water distribution system; HAAs – haloacetic acids; HAA2 – sum of DCAA and TCAA; HAA5 – sum of MCAA, DCAA, TCAA, MBAA and DBAA; HAA9 – sum of HAA5 and BCAA, TBAA, CDBAA, BDCAA; HPCs – high heterotrophic plate counts; MRTL – maximum residence time location; NL – Newfoundland and Labrador; QC – Quebec | ||||
6.4 Pipe diameter and material impacts
Distribution pipe diameter and material impacts on HAA concentrations in distribution systems were discussed in different papers (Baribeau et al., 2006; Chen et al., 2020; Zhang et al., 2020). No significant effects on HAA9 concentrations of the pipe material and diameter were observed in the five distribution systems studied by Baribeau et al. (2006). Other studies mentioned that a smaller pipe diameter increases the impact of biofilm on HAA degradation, particularly for di-HAA, at warm water temperatures (Rodriguez et al., 2004; Scheili et al., 2015). The pipe material can affect the HAA formation as the reaction of residual chlorine with pipe materials and attached microorganisms will also result in depletion of residual chlorine. The outcome of this reaction varies with the change of pipe materials. Zhang et al. (2020) observed that the HAA formation levels followed the order of plastic steel pipe > ductile iron pipe > polyethylene pipe. There was no significant difference in total HAA5 concentrations between copper and glass pipe (control); however, the distribution of HAA5 species was different between the pipes (Li et al., 2008a). The accelerative effect of copper on the depletion of chlorine restricted the formation of TCAA, and relatively less TCAA and more MCAA, DCAA, and DBAA were produced in copper piping than in glass.
I-DBPs can also form in pipes in the distribution system. Pb2O and MnO2 as part of mineral scale can provide an oxidant reservoir for I-DBP formation in distributions systems. For example, MnO2 can act as a catalyst in the electrophilic iodination of organic compounds through the activation of the iodine molecule. This can lead to the formation of iodinated organic compounds such as I-HAAs (Ye et al., 2012; Dong et al., 2019).
6.5 Other considerations
Many chloraminated drinking water systems periodically apply free chlorine for secondary disinfection during several weeks (also called chlorine burns) for nitrification and biofilm control. This application of free chlorine can substantially increase the DBP concentrations. Allen et al. (2022) evaluated DBP formation in two United States DWTPs during chlorine burns and found that THMs and HAAs reached concentrations of 249 and 271 μg/L, respectively.
The fate of HAAs in residential hot water heating is impacted by factors such as pH, temperature, free chlorine residual and reaction time. Therefore, it is difficult to provide certain conclusions about impacts on HAA formation and decay. In general, average DCAA levels increased due to residential water heating, while there was no big difference in TCAA concentrations between hot and cold tap water (Liu and Reckhow, 2013, 2015; Legay et al., 2019). Dion-Fortier et al. (2009) found a minor increase in HAA9 in comparison to THMs during cold water stagnation. DCAA and TCAA were the species found in the largest quantities in both the distribution system and in cold water stagnation in plumbing pipes. During the water transit in a hot water tank, DCAA concentrations increased, yet there was no apparent impact on TCAA concentrations. BDCAA and BCAA were found in lower concentrations in hot water than in cold (Liu and Reckhow, 2015).
7.0 Management strategies
All water treatment systems should implement a comprehensive, up-to-date risk management water safety plan. A source-to-tap approach should be taken to ensure water safety is maintained (CCME, 2004; WHO, 2012, 2017b). These approaches require a system assessment to characterize the source water; describe the treatment barriers that prevent or reduce contamination; identify the conditions that can result in contamination; and implement control measures. Operational monitoring is then established, and operational/management protocols are instituted (for example, standard operating procedures, corrective actions, and incident responses). Compliance monitoring is determined, and other protocols to validate the water safety plan are implemented (for example, record keeping, consumer satisfaction). Operator training is also required to ensure the effectiveness of the water safety plan (Smeets et al., 2009).
Management of HAAs is generally focused on minimizing their formation. Changes implemented to address HAAs should be considered holistically to ensure that they do not increase other DBPs (for example, THMs) or cause other water quality issues.
Kastl et al. (2016) reported that NOM removal requirements should be linked to distribution system conditions. Distribution system variations in residence times and temperatures will require different levels of NOM removal to meet DBP guidelines (for examples, see Rodriguez and Sérodes, 2001; Kastl et al., 2016).
7.1 Control strategies
The preferred control strategies should include methods to minimize HAA formation during treatment and within the distribution system. Effective management of HAAs requires a good understanding of the disinfectant demand/decay vs. HAA formation, temperature effects, and pH. Treatment facilities and distribution systems can differ significantly, necessitating system-specific control strategies.
Water treatment systems must balance effective disinfection against the creation of HAAs because drinking water must be microbiologically safe to prevent waterborne disease. Impacts to the distribution system from any control strategy implementation should be considered. Pilot-testing using harvested pipe specimens should be done to assess impacts of strategy implementation and methods to mitigate any adverse responses (Giani and Hill, 2017).
7.1.1 Source water control options
Source water control options for HAA formation are presented in Table 33 along with associated advantages and disadvantages. Water quality should be characterized, and seasonal and temporal changes should be monitored. It is important to assess the impact of using any of these control options to ensure other water quality issues do not arise, including potential impacts (for example, corrosion) to the distribution system. Any change to source water may have an impact on water quality (for example, pH, alkalinity), which may impact treatment, and has the potential to result in corrosion issues within the distribution system.
Source control strategy |
Advantages |
Disadvantages |
Comments |
Source water change or blending of source waters |
|
|
Groundwater incorporation may result in greatest reduction of organic precursors. |
Choose source water with no bromide |
|
|
Bromide can be oxidized to HOBr and is a significant factor in Br-HAA formation. |
Modifications of reservoir operations |
|
|
If easy to switch between water sources, can use reservoir preferentially based on water quality. Can also fill off-line reservoir when water is at the highest water quality. |
Purchase water |
|
|
Purchase water to blend or replace source water during periods of high TOC. |
Aquifer storage and recovery |
|
|
Store high-quality treated water in the subsurface when available. Stored water is later withdrawn when source water quality is poor. Minor additional treatment required. |
| Br-HAAs – brominated HAAs; Cl-HAAs – chlorinated HAAs; DBP – disinfection by-product; HAAs – haloacetic acids; HOBr – hypobromous acid; TOC – total organic carbon. | |||
7.1.2 Distribution system control options
HAAs continue to form within the distribution system as chlorine will continue to react with remaining NOM in the treated water. Water age within a distribution system is dynamic and can vary throughout the day, as well as from season to season. Implementation of practices such as water saving measures/campaigns can also impact water age. The reader is referred to Table 34 of this document and to Section B.5 of Health Canada’s Guidance on Monitoring the Biological Stability of Drinking Water in Distribution Systems for more details on distribution systems and management strategies (Health Canada, 2022). This section covers management of the distribution system, including management of storage facilities, water age (for example, dead ends), and watermain cleaning. Some key best management practices in the distribution system include to:
- manage water age (for example, minimize dead ends)
- manage water temperature impact
- maintain pH to ± 0.2 units
Before any of these strategy options are implemented, bench- and pilot-scale tests should be conducted and repeated regularly to understand source water changes, seasonal variability and the impact of climate changes. This includes using harvested pipe specimens to optimize the approach. Water distribution system models can be used as a tool to provide water age and simulate chlorine decay and HAA formation (Fisher et al., 2018). It is also important to ensure that no other water quality issues will occur as a result of changes made to address HAAs.
| Distribution system control strategy | Advantages | Disadvantages | Comments |
|---|---|---|---|
Optimize distribution system chlorination |
|
|
Adjust chlorine residual targets to address seasonal variations. Allows for lower chlorine residuals at times and decreased HAA formation. |
Booster chlorination |
|
|
Booster chlorination allows for adequate disinfectant residual in targeted locations without increasing chlorine levels throughout the entire distribution system. |
Optimize distribution system: limit water age in distribution system |
|
|
Can be done by looping dead ends, evaluating the status of valves (open or closed). Optimizing length of time water remains in distribution system can reduce HAAs. |
Optimize distribution system: limit water age in storage tanks |
|
|
Can be done through tank cycling and tank mixing. |
Distribution system modelling |
|
|
Models can accurately predict free chlorine and by-product formation in distribution system if well developed, calibrated, and maintained. |
System flushing |
|
|
Periodic flushing of distribution system in sections prone to long retention time can reduce water age. Best practices for proper flow rate and duration needed in order to be followed. In general, unidirectional flushing is best practice. |
| HAAs – haloacetic acids. | |||
7.2 Monitoring
Accurate control of the treatment process is important to ensure good water quality and to minimize HAA formation. Monitoring programs should be designed to consider risk factors that contribute to HAA formation and should verify that control strategies are operating as intended. Trend analyses will allow for forecasting water quality changes in advance and provide early warning signals. This monitoring will allow for the undertaking of control and/or proactive measures (Tomperi et al., 2016).
7.2.1 Source water monitoring
Source water characterization should be part of routine system assessments. This characterization should include an understanding of NOM concentrations and character, as well as bromide and iodide concentrations (Health Canada, 2018, 2020). Parameters such as iron and manganese that impact disinfectant stability should be monitored. NOM varies seasonally, meaning that routine analysis is necessary. To aid in establishing a monitoring plan, a list of parameters is presented in Appendix G (Table G1). It suggests a monitoring frequency for variable and stable source water parameters, as well as an ideal monitoring frequency for NOM. Parameters such as UV absorbance (at 254 nm) or UV transmittance, DOC or TOC, SUVA, and various inorganic precursors are noted (Appendix G). Other parameters to consider in a monitoring program include disinfectant residual, water temperature, pH, bromide, iodide, and ammonia (AWWA, 2017). A good understanding of water quality and changes based on seasonal, temporal, anthropogenic activities, and climate impacts is important in managing treatment operations.
Information on bromide concentrations in source water is important to assess potential for Br-HAA formation. Westerhoff et al. (2022) recommend that source water that may experience changes in bromide levels should be monitored on a weekly basis. The authors also recommend pairing bromide concentrations with streamflow to better understand site-specific events.
I-HAAs are formed when iodide is present in the water. Although I-HAAs do not form part of the MAC, understanding iodide concentrations is important when evaluating control options.
7.2.2 Operational monitoring
Operational monitoring in the context of HAAs consists of parameters that are useful in understanding the entire drinking water treatment system and managing the formation of these DBPs. Parameters identified for source water characterization can also be monitored within treated water (Table G1) (Health Canada, 2020). The table includes sampling locations and frequencies that can form the basis of a comprehensive monitoring program and good understanding of NOM (Health Canada, 2020). Suggested monitoring frequency for parameters that impact coagulation, such as coagulant demand and zeta potential, are noted. Any changes between treated and source water for these parameters can be used to guide changes to treatment that will reduce HAA formation. The parameters that form the basis of the monitoring program are designed to assess performance and make changes as needed, and they will depend on the chosen strategy(ies) to minimize HAA formation.
7.2.3 Distribution system monitoring
HAAs are formed through treatment and continue to form within the distribution system. Monitoring should be conducted at locations throughout the distribution system. Monitoring at entry points to the distribution system will provide a baseline for comparison. Within the distribution system, monitoring should be where HAA concentrations would be expected to be the highest. These can include locations such as those with longest contact time, highest water age, after booster chlorination, or dead ends. However, where HAA concentration is the highest in the distribution system differs among HAA species (for example, di-HAAs vs. tri-HAAs). Therefore, using total HAA concentrations to select sampling locations for HAA monitoring may not be sufficient to capture the highest concentration of some HAA species (Marcoux et al., 2017). A greater number of monitoring locations can enable better characterization of HAA species variability within the distribution system network (for example, entry to or midpoint of distribution system). When a location has a high HAA concentration, this may guide the management of the distribution system in determining where flushing and cleaning activities should be focused or whether changes in distribution system operation should be considered. These practices will help reduce water age and locations with high HAA concentrations.
7.2.4 Compliance monitoring
A locational running annual average of a minimum of quarterly samples, taken in the distribution system, should be calculated for total HAA6 and for BCAA. The calculated values should be compared against the MAC of 80 µg/L for total HAA6 and against 10 µg/L for BCAA. Sampling should be at points in the distribution system where HAA concentrations are expected to be the highest. The selection of locations should consider the kinetics of formation for the various HAA species. The locations of high concentrations may vary seasonally and temporally. Increased frequency may be required for facilities using surface water sources (including groundwater sources that are under the direct influence of surface water) during peak HAA formation periods.
8.0 International considerations
Other national and international organizations have drinking water guidelines, standards and/or guidance values for individual and total HAA in drinking water. Variations in these values can be attributed to the age of the assessments or to differing policies and approaches, including the choice of key study and the use of different drinking water intake rates, body weights and source allocation factors (Table 35).
The U.S. EPA derived a maximum contaminant level of 60 µg/L for HAA5. The European Union has a parametric value of 60 µg/L for HAA5 to be used to assess the quality of water intended for human consumption. Australia’s National Health and Medical Research Council and the World Health Organization established values for individual HAAs in drinking water (MCAA, DCAA, TCAA).
| AgencyYear | HAA | Value (µg/L) |
Basis (Reference) |
POD (mg/kg bw per day) |
UFT orCSF | BW kg | DW intake (L/day) |
AF (%) |
|---|---|---|---|---|---|---|---|---|
| Health Canada Proposed (2025) |
HAA6 | 80MAC | Exposure, health effects, treatment technology and achievability | n/a | n/a | n/a | n/a | n/a |
| U.S. EPA (2006; 2018) |
HAA5 | 60MCL | Best available technology | n/a | n/a | n/a | n/a | n/a |
| EU (2020) |
HAA5 | 60 | Not available | n/a | n/a | n/a | n/a | n/a |
| WHO (2004a, 2017b) |
MCAA | 20 | Increased spleen weight (DeAngelo et al., 1997) | 3.5LOAEL | 1 000 UFT | 60 | 2 | 20 |
| WHO (2005, 2017b) |
DCAA | 50Table 35 Footnote a | Tumours (DeAngelo et al., 1999) | n/a | 0.0075 CSF | 60 | 2 | n/a |
| WHO (2004b, 2017b) |
TCAA | 200 | Liver histopathology (DeAngelo et al., 1997) | 32.5NOAEL | 1 000 UFT | 60 | 2 | 20 |
| Australia NHMRC, NRMMC (2011) |
MCAA | 150 | Decreased survival (NTP, 1992) | 15LOAEL | 500 UFT | 70 | 2 | 20 |
| Australia NHMRC, NRMMC (2011) |
DCAA | 100 | Tumours (DeAngelo et al., 1991) | 7.6NOAEL | 500 UFT | 70 | 2 | 20 |
| Australia NHMRC, NRMMC (2011) |
TCAA | 100 | Increased liver peroxisomal activity (Mather et al., 1990) | 36NOAEL | 2 000 UFT | 70 | 2 | 20 |
AF – allocation factor; BW – body weight; CSF – cancer slope factor; DCAA – dichloroacetic acid; DW – drinking water; EU – European Union; H – human equivalent dose; HAA5 – sum of MCAA, DCAA, TCAA, monobromoacetic acid and dibromoacetic acid; HAA6 – HAA5 plus bromochloroacetic acid; LOAEL – lowest observed adverse effect level; MAC – maximum acceptable concentration; MCAA – monochloroacetic acid; MCL – maximum contaminant level; NOAEL – no observed adverse effect level; n/a – not applicable; POD – point of departure; TCAA – trichloroacetic acid; UFT – uncertainty factor total; WHO – World Health Organization.
|
||||||||
9.0 Rationale
HAAs are formed in drinking water primarily because of the reaction of chlorine—which is added during treatment for disinfection—with organic matter present in raw water supplies. Due to its ability to kill or inactivate most enteric pathogenic microorganisms, the use of chlorine has virtually eliminated waterborne microbial diseases. Consequently, efforts to manage HAA levels in drinking water must not compromise the effectiveness of water disinfection.
Most available Canadian drinking water monitoring data are focused on HAA5. The HAA species consistently found at the highest concentrations in Canadian distribution systems were DCAA and TCAA. These two species commonly represented greater than 95% of the total HAA5 concentration with similar detection frequencies (Table 2). For Br-HAAs included in HAA5, MBAA was generally below DLs, while DBAA made up less than 5% of the total HAA5 concentration. However, among all the Br-HAAs monitored in Canadian drinking water, BCAA and BDCAA had the highest occurrence and concentrations (but at much lower concentrations than DCAA and TCAA). Similar results were observed under the U.S. EPA’s fourth unregulated contaminant monitoring rule (UCMR4) nationwide HAA survey.
Since HAAs are a large group of DBPs with at least 13 distinct chemicals detected in disinfected drinking water and there is not enough scientific data available to derive HBVs for all HAAs, a mixture analysis was performed. After analysis of all integrated key information, the mixture analysis recommended grouping the HAAs based on their carcinogenic MOA (non-direct DNA-reactive or direct DNA-reactive) and then using the HBV of the most potent IC for each subgroup:
- Subgroup – Non-direct DNA-reactive MOA (Cl-HAAs: MCAA, DCAA, TCAA): The HBV of the IC (DCAA) is 0.07mg/L (70 µg/L), based on liver tumours in both mice and rats
- Subgroup – Direct DNA-reactive MOA (Br-HAAs: MBAA, DBAA, TBAA, BCAA, CDBAA, BDCA): The HBV of the IC (DBAA) is 0.003 mg/L (3 µg/L), based on tumours in several organs in both mice and rats at the risk level of 1 x 10⁻⁵
Health Canada, in collaboration with the Federal-Provincial-Territorial Committee on Drinking Water, is proposing a MAC of 0.08 mg/L (80 µg/L) for HAA6 (three Br-HAAs: MBAA, DBAA, and BCAA, and three Cl-HAAs: MCAA, DCAA, and TCAA) in drinking water rather than guidelines for individual HAAs. The MAC is based on a running annual average of quarterly samples taken in the distribution system. It is recommended that water treatment system operators strive to maintain HAA levels as low as reasonably achievable (ALARA) without compromising the effectiveness of disinfection. The proposed MAC is based on the following considerations:
- The technological limitations associated with reducing individual HAA levels in drinking water while maintaining effective disinfection.
- The mixture analysis recommendation to evaluate HAAs as subgroups.
- 70 µg/L is the lowest calculated HBV for the HAA found in the highest proportion of the HAA mixture (DCAA). This HBV would be protective of HAAs with a similar MOA. Meeting a guideline of 70 μg/L for HAA6 in drinking water can present significant financial and operational challenges for treatment plants. As the increase in health risks from exposure to HAAs at average levels up to 80 μg/L is not expected to be significant, a MAC of 0.80 mg/L (80 μg/L) is proposed for HAA6 in drinking water, based on an annual running average.
- It is important to include BCAA in the total HAA6 measurement, because the brominated HAAs are more potent and can potentially cause health effects at lower concentrations than chlorinated HAAs.
- Although the HBV for DBAA is the lowest value calculated for Br-HAAs, it makes up less than 5% of the total HAA5 concentration. As such, it is not considered to be the appropriate indicator for total Br-HAAs.
- BCAA monitoring results are the best available indicator of locations with elevated occurrence and concentrations of Br-HAAs since:
- Monitoring results show that the mixed bromochloro species (which include BCAA) are a better indicator of the occurrence of Br-HAAs.
- BCAA was the Br-HAA compound with the highest occurrence and concentrations that also had data available on potential health effects, which provided sufficient exposure and health effect data for a risk assessment.
- The addition of BCAA to the measure of total HAAs is unlikely to impact most water treatment systems as BCAA concentrations are approximately ten times lower than the combined DCAA and TCAA concentrations in most systems. However, for those systems with Br-HAAs present, measuring BCAA and acting on the results is important to address the potential health effects from these substance.
- If the HAA monitoring profile shows that the concentration of the locational running annual average of quarterly samples for BCAA is equal to or greater than 10µg/L, measures should be taken to control the formation of the Br-HAA compounds at the treatment plant and within the distribution system:
- Monitoring campaigns with sufficient sample size (N greater than 100) for BCAA indicate 90th percentile concentrations in Canadian distribution systems that are generally less than 10 µg/L. In the United States, the UCMR4 indicates 98th percentile concentrations of BCAA of approximately 9 μg/L (Peterson et al., 2023). Therefore, 10 µg/L is achievable for BCAA, while maintaining very low concentrations of MBAA and DBAA.
- The capability of laboratories to routinely measure HAA6 within reasonable limits of the stated precision and accuracy are well below the proposed MAC.
Many types of DBPs may be found in drinking water. HAAs and THMs are the two major groups of DBPs that are generally found at the highest levels. The concentrations of these contaminants can be used as indicators of the total loading of all DBPs that may be found in treated drinking water. In the absence of information on other DBPs, control and management of HAAs and THMs are expected to reduce exposure to and risk from other DBPs.
As part of its ongoing guideline review process, Health Canada will continue to monitor new research in this area and recommend any change to this guideline technical document that it deems necessary.
10.0 References
- Abbas, R., and Fisher, J. W. (1997). A physiologically based pharmacokinetic model for trichloroethylene and its metabolites, chloral hydrate, trichloroacetate, dichloroacetate, trichloroethanol, and trichloroethanol glucuronide in B6C3F1 mice. Toxicol. Appl. Pharmacol., 147(1), 15–30. https://doi.org/10.1006/taap.1997.8190
- AGAT Laboratories. (2020). Personal communication with P. Reyno, Dartmouth, NS.
- Aitkenhead-Peterson, J., McDowell, W. H., and Neff, J. C. (2003). Sources, production, and regulation of allochthonous dissolved organic matter inputs to surface waters. Aquatic ecosystems: Interactivity of dissolved organic matter, 25–70. Elsevier, Amsterdam, Netherlands. https://doi.org/10.1016/B978-012256371-3/50003-2
- Alexander, M. T., Dugan, A. G., and Wahman, D. G. (2019). Use a hold study to assess distribution system influent water quality. Opflow, 45(5), 16–19. https://doi.org/10.1002/opfl.1187
- Ali, A., Kurzawa-Zegota, M., Najafzadeh, M., Gopalan, R. C., Plewa, M. J., and Anderson, D. (2014). Effect of drinking water disinfection by-products in human peripheral blood lymphocytes and sperm. Mutant. Res., 770, 136–143. https://doi.org/10.1016/j.mrfmmm.2014.08.003
- Ali, S., Arnold, M., Liesner, F., and Fesselet, J. (2019). Characterization of disinfection by-products levels at an emergency surface water treatment plant in a refugee settlement in northern Uganda. Water, 11(4), 647. https://doi.org/10.3390/w11040647
- Allard, S., Nottle, C. E., Chan, A., Joll, C., and von Gunten, U. (2013). Ozonation of iodide-containing waters: Selective oxidation of iodide to iodate with simultaneous minimization of bromate and I-THMs. Water Res., 47(6), 1953–1960. https://doi.org/10.1016/j.watres.2012.12.002
- Allard, S., Tan, J., Joll, C. A., and von Gunten, U. (2015). Mechanistic study on the formation of Cl-/Br-/I-Trihalomethanes during chlorination/chloramination combined with a theoretical cytotoxicity evaluation. Environ. Sci. Technol., 49(18), 11105–11114. https://doi.org/10.1021/acs.est.5b02624
- Allen, B. C., and Fisher, J. W. (1993). Pharmacokinetic modeling of trichloroethylene and trichloroacetic acid in humans. Risk Analysis, 13(1), 71–86. https://doi.org/10.1111/j.1539-6924.1993.tb00730.x
- Allen, J. M., Plewa, M. J., Wagner, E. D., Wei, X., Bokenkamp, K., Hur, K., Jia, A., Liberatore, H. K., Lee, C. T., Shirkhani, R., Krasner, S. W., and Richardson, S. D. (2022). Feel the burn: Disinfection byproduct formation and cytotoxicity during chlorine burn events. Environ. Sci. Technol., 56(12), 8245–8254. https://doi.org/10.1021/acs.est.2c02002
- Al-Tmemy, W., Alfatlawy, Y. F., and Khudair, S. H. (2018). Evaluation of human health risks associated with exposure to disinfection by-products (Dbps) in drinking water of Wassit Province southeast Iraq. Baghdad Sci. J., 15(3), 0270. https://doi.org/10.21123/bsj.2018.15.3.0270
- Amini, N., Papineau, I., Storck, V., Bérubé, P. R., Mohseni, M., and Barbeau, B. (2018). Long-term performance of biological ion exchange for the removal of natural organic matter and ammonia from surface waters. Water Res., 146, 1–9. https://doi.org/10.1016/j.watres.2018.07.057
- Amy, G. L., Westerhoff, P., Minear, R. A., and Song, R. (1997). Formation and Control of Brominated Ozone By-Products. Water Research Foundation, Denver, Colorado.
- Anderson, L. E., DeMont, I., Dunnington, D. D., Bjorndahl, P., Redden, D. J., Brophy, M. J., and Gagnon, G. A. (2023). A review of long-term change in surface water natural organic matter concentration in the northern hemisphere and the implications for drinking water treatment. Sci. Total Environ., 858, 159699. https://doi.org/10.1016/j.sc itotenv.2022.159699
- Anderson, W. B., Board, P. G., Gargano, B., and Anders, M. W. (1999). Inactivation of glutathione transferase zeta by dichloroacetic acid and other fluorine-lacking alpha-haloalkanoic acids. Chem. Res. Toxicol., 12(12), 1144–1149. https://doi.org/10.1021/tx990085l
- Andrews, J. E., Nichols, H. P., Schmid, J. E., Mole, L. M., Hunter, E. S. 3., and Klinefelter, G. R. (2004). Developmental toxicity of mixtures: The water disinfection by-products dichloro-, dibromo- and bromochloro acetic acid in rat embryo culture. Reprod. Toxicol. (Elmsford, N.Y.), 19(1), 111–116. https://doi.org/10.1016/j.reprotox.2004.06.005
- Andrews, J. E., Schmidt, J., Nichols, H., Hunter, E. S., and Klinefelter, G. (1999). Developmental toxicity of structurally related disubstituted haloacetic acids in embryo culture. The Toxicologist, 48(1-S).
- Anna, C. H., Maronpot, R. R., Pereira, M. A., Foley, J. F., Malarkey, D. E., and Anderson, M. W. (1994). Ras proto-oncogene activation in dichloroacetic acid-, trichloroethylene- and tetrachloroethylene-induced liver tumors in B6C3F1 mice. Carcinogenesis, 15(10), 2255–2261.
- [APHA, AWWA, and WEF] American Public Health Association, American Water Works Association, Water Environment Federation. (2023). Standard methods for the examination of water and wastewater (24th Ed.). American Public Health Association; American Water Works Association; Water Environment Federation. https://www.standardmethods.org/
- Arnold, M., Batista, J., Dickenson, E., and Gerrity, D. (2018). Use of ozone-biofiltration for bulk organic removal and disinfection byproduct mitigation in potable reuse applications. Chemosphere, 202, 228–237. https://doi.org/10.1016/j.chemosphere.2018.03.085
- Ates, N., Yilmaz, L., Kitis, M., and Yetis, U. (2009). Removal of disinfection by-product precursors by UF and NF membranes in low-SUVA waters. J. Membr. Sci., 328(1), 104–112. https://doi.org/10.1016/j.memsci.2008.11.044
- Attene-Ramos, M. S., Wagner, E. D., and Plewa, M. J. (2010). Comparative human cell toxicogenomic analysis of monohaloacetic acid drinking water disinfection byproducts. Environ. Sci. Technol., 44(19), 7206–7212. https://doi.org/10.1021/es1000193
- Atwood, S. T., Lunn, R. M., Garner, S. C., and Jahnke, G. D. (2019). New perspectives for cancer hazard evaluation by the report on carcinogens: A case study using read-across methods in the evaluation of haloacetic acids found as water disinfection by-products. Environ. Health Perspect., 127(12), 125003. https://doi.org/10.1289/EHP5672
- Austin, E. W., and Bull, R. J. (1997). Effect of pretreatment with dichloroacetate or trichloroacetate on the metabolism of bromodichloroacetate. J. Toxicol. Environ. Health, 52(4), 367–383. https://doi.org/10.1080/00984109708984071
- Austin, E. W., Parrish, J. M., Kinder, D. H., and Bull, R. J. (1996). Lipid peroxidation and formation of 8-hydroxydeoxyguanosine from acute doses of halogenated acetic acids. Fundam. Appl. Toxicol., 31(1), 77–82. https://doi.org/10.1006/faat.1996.0078
- [AWWA] American Water Works Association. (2011). Water quality and treatment: A handbook of community water supplies (6th ed.). Edzwald J. K. (Ed.), McGraw-Hill, New York, New York.
- [AWWA] American Water Works Association. (2017). Water quality in distribution systems - Manual of Water Supply Practices, M68. American Water Works Association (AWWA). Denver, Colorado.
- Babi, K., Koumenides, K., Nikolaou, A. D., Mihopoulos, N., Tzoumerkas, F., Makri, C. A., and Lekkas, T. (2003). Pilot - Plant experiments for the removal of THMs, HAAs and DOC from drinking water by GAC adsorption - Galatsi Water Treatment Plant, Athens. The Int. J., 5(3), 177–184.
- Babi, K. G., Koumenides, K. M., Nikolaou, A. D., Makri, C. A., Tzoumerkas, F. K., and Lekkas, T. D. (2007). Pilot study of the removal of THMs, HAAs and DOC from drinking water by GAC adsorption. Desalination, 210(1), 215–224. https://doi.org/10.1016/j.desal.2006.05.046
- Bader, E. L., Hrudey, S. E., and Froese, K. L. (2004). Urinary excretion half life of trichloroacetic acid as a biomarker of exposure to chlorinated drinking water disinfection by-products. Occup. Environ. Med., 61(8), 715–716. https://doi.org/10.1136/oem.2003.008698
- Bailey, G. W., and White, J. L. (1965). Herbicides: A compilation of their physical, chemical, and biological properties. Residue Rev., 10, 97–122. https://doi.org/10.1007/978-1-4615-8398-1_5
- Baribeau, H., Boulos, L., Haileselassie, H., Crozes, G., Singer, P. C., Nichols, C., Schlesinger, S. A., Gullick, R. W., Williams, S. L., Williams, R. L., Fountleroy, L., Andrews, S. A., and Moffat, E. (2006). Formation and decay of disinfection by-products in the distribution system. Water Research Foundation, Denver, Colorado.
- Baribeau, H., Krasner, S. W., Chinn, R., and Singer, P. C. (2005). Impact of biomass on the stability of HAAs and THMs in a simulated distribution system. J. Am. Water Works Assoc., 97(2), 69–81. https://doi.org/10.1002/j.1551-8833.2005.tb10826.x
- Barry, M., Chiu, C., and Westerhoff, P. (2016). Severe weather effects on water quality in central Arizona. J. Am. Water Works Assoc., 108(4), E221–E231. https://doi.org/10.5942/jawwa.2016.108.0027
- Barton, H. A., Bull, R., Schultz, I., and Andersen, M. E. (1999). Dichloroacetate (DCA) dosimetry: Interpreting DCA-induced liver cancer dose response and the potential for DCA to contribute to trichloroethylene-induced liver cancer. Toxicol. Lett., 106(1), 9–21. https://doi.org/10.1016/s0378-4274(99)00016-8
- Beauchamp, N., Laflamme, O., Simard, S., Dorea, C., Pelletier, G., Bouchard, C., and Rodriguez, M. (2018). Relationships between DBP concentrations and differential UV absorbance in full-scale conditions. Water Res., 131, 110–121. https://doi.org/10.1016/j.watres.2017.12.031
- Becalski, A., Lau, B. P., Schrader, T. J., Seaman, S. W., and Sun, W. F. (2006). Formation of iodoacetic acids during cooking: Interaction of iodized table salt with chlorinated drinking water. Food Addit. Contam., 23(10), 957–962. https://doi.org/10.1080/02652030600838407
- Becker, W., Stanford, B., and Rosenfldt, E. J. (2013). Guidance on complying with stage 2 D/DBP Regulation. Water Research Foundation, Denver, Colorado.
- Behbahani, M., Lin, B., Phares, T. L., and Seo, Y. (2018). Understanding the impact of water distribution system conditions on the biodegradation of haloacetic acids and expression of bacterial dehalogenase genes. J. Hazard. Mater., 351, 293–300. https://doi.org/10.1016/j.jhazmat.2018.02.047
- Bhat, H. K., Ahmed, A. E., and Ansari, G. A. (1990). Toxicokinetics of monochloroacetic acid: A whole-body autoradiography study. Toxicology, 63(1), 35–43. https://doi.org/10.1016/0300-483x(90)90066-p
- Bichsel, Y., and von Gunten, U. (1999). Oxidation of iodide and hypoiodous acid in the disinfection of natural waters. Environ. Sci. Technol., 33(22), 4040–4045. https://doi.org/10.1021/es990336c
- Board, P. G., and Anders, M. W. (2005). Human glutathione transferase zeta. Methods Enzymol., 401, 61–77. https://doi.org/10.1016/S0076-6879(05)01004-9
- Board, P. G., and Anders, M. W. (2011). Glutathione transferase zeta: Discovery, polymorphic variants, catalysis, inactivation, and properties of Gstz1-/- mice. Drug Metab. Rev., 43(2), 215–225. https://doi.org/10.3109/03602532.2010.549132
- Bond, T., Goslan, E. H., Parsons, S. A., and Jefferson, B. (2011). Treatment of disinfection by‐product precursors. Environ. Technol., 32(1), 1–25. https://doi.org/10.1080/09593330.2010.495138
- Bond, T., Huang, J., Graham, N. J. D., and Templeton, M. R. (2014). Examining the interrelationship between DOC, bromide and chlorine dose on DBP formation in drinking water — A case study. Sci. Total Environ., 470-471, 469–479. https://doi.org/10.1016/j.scitotenv.2013.09.106
- Boyer, T. H. (2015). Removal of dissolved organic matter by magnetic ion exchange resin. Curr. Pollut. Rep., 1(3), 142–154. https://doi.org/10.1007/s40726-015-0012-2
- Boyer, T. H., and Singer, P. C. (2005). Bench-scale testing of a magnetic ion exchange resin for removal of disinfection by-product precursors. Water Res., 39(7), 1265–1276. https://doi.org/10.1016/j.watres.2005.01.002
- Bridgeman, J., Bieroza, M., and Baker, A. (2011). Application of fluorescence spectroscopy to organic matter characterisation in drinking water treatment. Rev. Environ. Sci. Biotechnol., 10(3), 277–290. https://doi.org/10.1007/s11157-011-9243-x
- Brown, A., McKnight, D. M., Chin, Y., Roberts, E. C., and Uhle, M. (2004). Chemical characterization of dissolved organic material in Pony Lake, a saline coastal pond in Antarctica. Mar. Chem., 89(1), 327–337. https://doi.org/10.1016/j.marchem.2004.02.016
- Bryant, B. J., Jokinen, M. P., Eustis, S. L., Thompson, M. B., and Abdo, K. M. (1992). Toxicity of monochloroacetic acid administered by gavage to F344 rats and B6C3F1 mice for up to 13 weeks. Toxicology, 72(1), 77–87. https://doi.org/10.1016/0300-483x(92)90087-u
- Bull, R. J., Orner, G. A., Cheng, R. S., Stillwell, L., Stauber, A. J., Sasser, L. B., Lingohr, M. K., and Thrall, B. D. (2002). Contribution of dichloroacetate and trichloroacetate to liver tumor induction in mice by trichloroethylene. Toxicol. Appl. Pharmacol., 182(1), 55–65. https://doi.org/10.1006/taap.2002.9427
- Bull, R. J., Sanchez, I. M., Nelson, M. A., Larson, J. L., and Lansing, A. J. (1990). Liver tumor induction in B6C3F1 mice by dichloroacetate and trichloroacetate. Toxicology, 63(3), 341–359.
- Caltran, I., Heijman, S. G. J., Shorney-Darby, H., and Rietveld, L. C. (2020). Impact of removal of natural organic matter from surface water by ion exchange: A case study of pilots in Belgium, United Kingdom and the Netherlands. Sep. Purif. Technolo., 247, 1–12. https://doi.org/10.1016/j.seppur.2020.116974
- Cardador, M. J., and Gallego, M. (2012). Effect of the chlorinated washing of minimally processed vegetables on the generation of haloacetic acids. J. Agric. Food. Chem., 60(29), 7326–7332. https://doi.org/10.1021/jf302591u
- Cardador, M. J., and Gallego, M. (2015). Haloacetic acids content of fruit juices and soft drinks. Food Chem., 173, 685–693. https://doi.org/10.1016/j.foodchem.2014.10.105
- Cardador, M. J., and Gallego, M. (2016). Origin of haloacetic acids in milk and dairy products. Food Chem., 196, 750–756. https://doi.org/10.1016/j.foodchem.2015.10.011
- Cardador, M. J., and Gallego, M. (2017). Control of disinfection by-products in canned vegetables caused by water used in their processing. Food Addit Contam Part A Chem Anal Control Expo Risk Assess, 34(1), 10–23. https://doi.org/10.1080/19440049.2016.1241897
- Cardador, M. J., and Gallego, M. (2018). Determination of several common disinfection by-products in frozen foods. Food Addit Contam Part A Chem Anal Control Expo Risk Assess, 35(1), 56–65. https://doi.org/10.1080/19440049.2017.1382731
- Carra, I., Fernandez Lozano, J., Autin, O., Bolton, J. R., and Jarvis, P. (2020). Disinfection by-product formation during UV/Chlorine treatment of pesticides in a novel UV-LED reactor at 285 nm and the mitigation impact of GAC treatment. Sci. Total Environ., 712, 136413. https://doi.org/10.1016/j.scitotenv.2019.136413
- Carstea, E. M., Popa, C. L., Baker, A., and Bridgeman, J. (2020). In situ fluorescence measurements of dissolved organic matter: A review. Sci. Total Environ., 699, 134361. https://doi.org/10.1016/j.scitotenv.2019.134361
- Cattley, R. C., DeLuca, J., Elcombe, C., Fenner-Crisp, P., Lake, B. G., Marsman, D. S., Pastoor, T. A., Popp, J. A., Robinson, D. E., Schwetz, B., Tugwood, J., and Wahli, W. (1998). Do peroxisome proliferating compounds pose a hepatocarcinogenic hazard to humans? Regul. Toxicol. Pharm., 27(1 Pt 1), 47–60.
- [CCME] Canadian Council of Ministers of the Environment. (2003). Guidance on the site-specific application of water quality guidelines in Canada: Procedures for deriving numerical water quality objectives. Canadian Council of Ministers of the Environment.
- [CCME] Canadian Council of Ministers of the Environment. (2004). From source to tap: Guidance on the multi-barrier approach to safe drinking water. Canadian Council of Ministers of the Environment.
- [CCME] Canadian Council of Ministers of the Environment. (2007). A protocol for the derivation of water quality guidelines for the protection of aquatic life 2007. Canadian Council of Ministers of the Environment.
- Chaiket, T., Singer, P. C., Miles, A., Moran, M., and Pallotta, C. (2002). Effectiveness of coagulation, ozonation, and biofiltration in controlling DBPs. J. Am. Water Works Assoc., 94(12), 81–95. https://doi.org/10.1002/j.1551-8833.2002.tb10251.x
- Chalatip, R., Chawalit, R., and Nopawan, R. (2009). Removal of haloacetic acids by nanofiltration. J. Environ. Sci., 21(1), 96–100. https://doi.org/10.1016/S1001-0742(09)60017-6
- Chang, C., Hsieh, Y., Lin, Y., Hu, P., Liu, C., and Wang, K. (2001). The organic precursors affecting the formation of disinfection by-products with chlorine dioxide. Chemosphere, 44(5), 1153–1158. https://doi.org/10.1016/S0045-6535(00)00285-X
- Channel, S. R., Latendresse, J. R., Kidney, J. K., Grabau, J. H., Lane, J. W., Steel-Goodwin, L., and Gothaus, M. C. (1998). A subchronic exposure to trichloroethylene causes lipid peroxidation and hepatocellular proliferation in male B6C3F1 mouse liver. Toxicol. Sci., 43(2), 145–154. https://doi.org/10.1006/toxs.1998.2456
- Chen, B., Nam, S., Westerhoff, P. K., Krasner, S. W., and Amy, G. (2009). Fate of effluent organic matter and DBP precursors in an effluent-dominated river: A case study of wastewater impact on downstream water quality. Water Res., 43(6), 1755–1765. https://doi.org/10.1016/j.watres.2009.01.020
- Chen, H., Wei, Z., Sun, G., Su, H., Liu, J., Hu, B., Zhou, X., and Lou, L. (2020). Formation of biofilms from new pipelines at both ends of the drinking water distribution system and comparison of disinfection by-products formation potential. Environ. Res., 182, 109150. https://doi.org/10.1016/j.envres.2020.109150
- Chen, W. J., and Weisel, C. P. (1998). Halogenated DBP concentrations in a distribution system. J. Am. Water Works Assoc., 90(4), 151–163. https://doi.org/10.1002/j.1551-8833.1998.tb08418.x
- Chiu, W. A., and Ginsberg, G. L. (2011). Development and evaluation of a harmonized physiologically based pharmacokinetic (PBPK) model for perchloroethylene toxicokinetics in mice, rats, and humans. Toxicol. Appl. Pharmacol., 253(3), 203–234. https://doi.org/10.1016/j.taap.2011.03.020
- Cho, J., Amy, G., and Pellegrino, J. (2000). Membrane filtration of natural organic matter: Factors and mechanisms affecting rejection and flux decline with charged ultrafiltration (UF) membrane. J. Membr. Sci.. https://doi.org/10.1016/s0376-7388(99)00176-3
- Chowdhury, S. (2013). Trihalomethanes in drinking water: Effect of natural organic matter distribution. Water SA, 39(1), 1–8. https://doi.org/10.4314/wsa.v39i1.1
- Chowdhury, S. (2018). Occurrences and changes of disinfection by-products in small water supply systems. Environ. Monit. Assess., 190(1), 32. https://doi.org/10.1007/s10661-017-6410-8
- Chowdhury, F. L., Bérubé, P. R., and Mohseni, M. (2008). Characteristics of natural organic matter and formation of chlorinated disinfection by-products from two source waters that respond differently to ozonation. Ozone: Sci. Eng., 30(5), 321–331. https://doi.org/10.1080/01919510802169272
- Chowdhury, S., Mazumder, M. A. J., Alhooshani, K., and Al-Suwaiyan, M. (2019). Reduction of DBPs in synthetic water by indoor techniques and its implications on exposure and health risk. Sci. Total Environ., 691, 621–630. https://doi.org/10.1016/j.scitotenv.2019.07.185
- Christian, M. S., York, R. G., Hoberman, A. M., Diener, R. M., Fisher, L. C., and Gates, G. A. (2001). Biodisposition of dibromoacetic acid (DBA) and bromodichloromethane (BDCM) administered to rats and rabbits in drinking water during range-finding reproduction and developmental toxicity studies. Int. J. Toxicol., 20(4), 239–253.
- Christian, M. S., York, R. G., Hoberman, A. M., Frazee, J., Fisher, L. C., Brown, W. R., and Creasy, D. M. (2002). Oral (drinking water) two-generation reproductive toxicity study of dibromoacetic acid (DBA) in rats. Int. J. Toxicol., 21(4), 237–276. https://doi.org/10.1080/10915810290096432
- Chu, H. P., Wong, J. H. C., and Li, X. Y. (2002). Trihalomethane formation potentials of organic pollutants in wastewater discharge. Water Sci. Technol., 46(11-12), 401–406. https://doi.org/10.2166/wst.2002.0769
- Chun, C. L., Hozalski, R. M., and Arnold, W. A. (2007). Degradation of disinfection byproducts by carbonate green rust. Environ. Sci. Technol., 41(5), 1615–1621. https://doi.org/10.1021/es061571f
- Cicmanec, J. L., Condie, L. W., Olson, G. R., and Wang, S. R. (1991). 90-Day toxicity study of dichloroacetate in dogs. Fundam. Appl. Toxicol., 17(2), 376–389. https://doi.org/10.1016/0272-0590(91)90227-u
- City of Winnipeg. (2020). Personal communication with G. Levesque, Winnipeg, MB7.
- Clark, J. M., Lane, S. N., Chapman, P. J., and Adamson, J. K. (2007). Export of dissolved organic carbon from an upland peatland during storm events: Implications for flux estimates. J. Hydrol., 347(3), 438–447. https://doi.org/10.1016/j.jhydrol.2007.09.030
- Clifford, D. A. (1999). Ion exchange and inorganic adsorption. In R. D. Letterman (Ed.), Water quality and treatment: A handbook of community water supplies (5th ed.). American Water Works Association, Denver, Colorado.
- Clifford, D. A., Sorg, T., and Ghurye, G. (2011). Ion exchange and adsorption of inorganic contaminants. In J. K. Edzwald (Ed.), Water quality and treatment: A handbook of community water supplies (6th ed.). American Water Works Association, Denver, Colorado.
- Colell, A., Green, D. R., and Ricci, J. (2009). Novel roles for GAPDH in cell death and carcinogenesis. Cell Death Differ., 16(12), 1573–1581. https://doi.org/10.1038/cdd.2009.137
- Cornett, R., James, M. O., Henderson, G. N., Cheung, J., Shroads, A. L., and Stacpoole, P. W. (1999). Inhibition of glutathione S-transferase zeta and tyrosine metabolism by dichloroacetate: A potential unifying mechanism for its altered biotransformation and toxicity. Biochem. Biophys. Res. Commun., 262(3), 752–756. https://doi.org/10.1006/bbrc.1999.1287
- Corton, J. C., (2008). Evaluation of the role of peroxisome proliferator-activated receptor α (PPARα in mouse liver tumor induction by trichloroethylene and metabolites. Crit. Rev. Toxicol., 38(10), 857–875.
- Corton, J. C., Cunningham, M. L., Hummer, B. T., Lau, C., Meek, B., Peters, J. M., Popp, J. A., Rhomberg, L., Seed, J., and Klaunig, J. E. (2014). Mode of action framework analysis for receptor-mediated toxicity: The peroxisome proliferator-activated receptor alpha (PPARα) as a case study. Crit. Rev. Toxicol., 44(1), 1–49. https://doi.org/10.3109/10408444.2013.835784
- Costet, N., Garlantézec, R., Monfort, C., Rouget, F., Gagnière, B., Chevrier, C., and Cordier, S. (2012). Environmental and urinary markers of prenatal exposure to drinking water disinfection by-products, fetal growth, and duration of gestation in the PELAGIE birth cohort (Brittany, France, 2002–2006). Am. J. Epidemiol., 175(4), 263–275. https://doi.org/10.1093/aje/kwr419
- Cowman, G. A., and Singer, P. C. (1996). Effect of bromide ion on haloacetic acid speciation resulting from chlorination and chloramination of aquatic humic substances. Environ. Sci. Technol., 30(1), 16–24. https://doi.org/10.1021/es9406905
- Criquet, J., and Allard, S. (2021). Chapter five: Influence of bromide and iodide on the formation of disinfection by-products in drinking water treatment. In J. L. Boudenne and T. Manasfi. (Eds.), Comprehensive analytical chemistry volume 92: Analysis and formation of disinfection byproducts in drinking water, 117–138. Elsevier, Amsterdam, Netherlands.
- Cummings, A. M., and Hedge, J. M. (1998). Dibromoacetic acid does not adversely affect early pregnancy in rats. Reprod. Toxicol., 12(4), 445–448. https://doi.org/10.1016/s0890-6238(98)00025-2
- Cuthbertson, A. A., Kimura, S. Y., Liberatore, H. K., Summers, R. S., Knappe, D. R. U., Stanford, B. D., Maness, J. C., Mulhern, R. E., Selbes, M., and Richardson, S. D. (2019). Dose granular activated carbon with chlorination produce safer drinking water? From disinfection byproducts and total organic halogen to calculated toxicity. Environ. Sci. Technol., 53, 5987–5999.
- Dad, A., Jeong, C. H., Pals, J. A., Wagner, E. D., and Plewa, M. J. (2013). Pyruvate remediation of cell stress and genotoxicity induced by haloacetic acid drinking water disinfection by-products. Environ. Mol. Mutagen., 54(8), 629–637. https://doi.org/10.1002/em.21795
- Dad, A., Jeong, C. H., Wagner, E. D., and Plewa, M. J. (2018). Haloacetic acid water disinfection byproducts affect pyruvate dehydrogenase activity and disrupt cellular metabolism. Environ. Sci. Technol., 52(3), 1525–1532. https://doi.org/10.1021/acs.est.7b04290
- Daniel, F. B., DeAngelo, A. B., Stober, J. A., Olson, G. R., and Page, N. P. (1992). Hepatocarcinogenicity of chloral hydrate, 2-chloroacetaldehyde, and dichloroacetic acid in the male B6C3F1 mouse. Fundam. Appl. Toxicol., 19(2), 159–168.
- Daniel, F. B., Robinson, M., Stober, J. A., Page, N. P., and Olson, G. R. (1991). Ninety-day toxicity study of sodium monochloroacetate in Sprague-Dawley rats. Toxicology, 67(2), 171–185. https://doi.org/10.1016/0300-483x(91)90141-m
- DeAngelo, A. B., Daniel, F. B., Stober, J. A., and Olson, G. R. (1991). The carcinogenicity of dichloroacetic acid in the male B6C3F1 mouse. Fundam. Appl. Toxicol., 16(2), 337–347. https://doi.org/10.1016/0272-0590(91)90118-n
- DeAngelo, A. B., Daniel, F. B., Most, B. M., and Olson, G. R. (1996). The carcinogenicity of dichloroacetic acid in the male Fischer 344 rat. Toxicology, 114(3), 207–221. https://doi.org/10.1016/s0300-483x(96)03510-x
- DeAngelo, A. B., Daniel, F. B., Most, B. M., and Olson, G. R. (1997). Failure of monochloroacetic acid and trichloroacetic acid administered in the drinking water to produce liver cancer in male F344/N rats. J. Toxicol. Environ. Health, 52(5), 425–445. https://doi.org/10.1080/00984109708984074
- DeAngelo, A. B., Daniel, F. B., Wong, D. M., and George, M. H. (2008). The induction of hepatocellular neoplasia by trichloroacetic acid administered in the drinking water of the male B6C3F1 mouse. J. Toxicol. Environ. Health Part A, 71(16), 1056–1068. https://doi.org/10.1080/15287390802111952
- DeAngelo, A. B., George, M. H., and House, D. E. (1999). Hepatocarcinogenicity in the male B6C3F1 mouse following a lifetime exposure to dichloroacetic acid in the drinking water: Dose-response determination and modes of action. J. Toxicol. Environ. Health Part A, 58(8), 485–507. https://doi.org/10.1080/009841099157115
- Dees, C., and Travis, C. (1994). Trichloroacetate stimulation of liver DNA synthesis in male and female mice. Toxicol. Lett., 70(3), 343–355. https://doi.org/10.1016/0378-4274(94)90129-5
- Delatolla, R., Séguin, C., Springthorpe, S., Gorman, E., Campbell, A., and Douglas, I. (2015). Disinfection byproduct formation during biofiltration cycle: Implications for drinking water production. Chemosphere, 136, 190–197. https://doi.org/10.1016/j.chemosphere.2015.05.001
- Delpla, I., and Rodriguez, M. J. (2016). Experimental disinfection by-product formation potential following rainfall events. Water Res., 104, 340–348. https://doi.org/10.1016/j.watres.2016.08.031
- Delpla, I., and Rodriguez, M. J. (2017). Variability of disinfection by-products at a full-scale treatment plant following rainfall events. Chemosphere, 166, 453–462. https://doi.org/10.1016/j.chemosphere.2016.09.096
- Deng, Y., Liu, C., Yuan, X., Luo, Q., Miao, Y., Chen, P., Cui, F., Zhang, M., Zeng, J., Shi, T., Lu, T., Li, Y., Lu, W., and Zeng, Q. (2023). Associations between urinary concentrations of disinfection byproducts and in vitro fertilization outcomes: A prospective cohort study in China. Environ. Health Perspect., 131(9), 97003. https://doi.org/10.1289/EHP12447
- Deuse, T., Hua, X., Wang, D., Maegdefessel, L., Heeren, J., Scheja, L., Bolaños, J. P., Rakovic, A., Spin, J. M., Stubbendorff, M., Ikeno, F., Länger, F., Zeller, T., Schulte-Uentrop, L., Stoehr, A., Itagaki, R., Haddad, F., Eschenhagen, T., Blankenberg, S., Kiefmann, R., Reichenspurner, H., Velden, J., Klein, C., Yeung, A. and Schrepfer, S. (2014). Dichloroacetate prevents restenosis in preclinical animal models of vessel injury. Nature, 509(7502), 641–644. https://doi.org/10.1038/nature13232
- Dion-Fortier, A., Rodriguez, M. J., Sérodes, J., and Proulx, F. (2009). Impact of water stagnation in residential cold and hot water plumbing on concentrations of trihalomethanes and haloacetic acids. Water Res., 43(12), 3057–3066. https://doi.org/10.1016/j.watres.2009.04.019
- Dong, F., Lin, Q., Li, C., He, G., and Deng, Y. (2021). Impacts of pre-oxidation on the formation of disinfection byproducts from algal organic matter in subsequent chlor(am)ination: A review. Sci. Total Environ., 754, 141955. https://doi.org/10.1016/j.scitotenv.2020.141955
- Dong, H., Qiang, Z., and Richardson, S. D. (2019). Formation of iodinated disinfection byproducts (I-DBPs) in drinking water: Emerging concerns and current issues. Acc. Chem. Res., 52(4), 896–905. https://doi.org/10.1021/acs.accounts.8b00641
- Dotson, A. D., Keen, V. S., Metz, D., and Linden, K. G. (2010). UV/H2O2 treatment of drinking water increases post-chlorination DBP formation. Water Res., 44(12), 3703–3713. https://doi.org/10.1016/j.watres.2010.04.006
- [EC] European Commission. (2003). Monochloroacetic acid (MCAA) environmental part. Scientific Committee on Toxicity, Ecotoxicity and the Environment, Health and Consumer Protection Directorate-General. European Commission.
- [ECB] European Chemicals Bureau. (2005). European union risk assessment report. Monochloroacetic acid (MCAA). CAS No.: 79-11-8. EINECS No.: 201-178-4. (Vol. 52). European Chemicals Bureau. https://echa.europa.eu/documents/10162/fb9a3c57-d7c8-41cd-b2b7-91469d6029d8
- Edgar, M., and Boyer, T. H. (2021). Removal of natural organic matter by ion exchange: Comparing regenerated and non-regenerated columns. Water Res., 189, 116661. https://doi.org/10.1016/j.watres.2020.116661
- EFSA Scientific Committee, More, S. J., Bampidis, V., Benford, D., Bennekou, S. H., Bragard, C., Halldorsson, T.I., Hernández-Jerez, A.F., Koutsoumanis, K., Naegeli, H., Schlatter, J.R., Silano, V., Nielsen, S.S., Schrenk, D., Turck, D., Younes, M., Benfenati, E., Castle, L., Cedergreen, N., Hardy, A., Laskowsk, R., Leblanc, J.C., Kortenkamp, A., Raga, A., Posthuma, L., Svvendsen, C., Solecki, R., Testai, E., Dujardin, B., Kass, G.E.N., Manini, P., Jeddi, M.Z., Dorne, J.-L.C.M., and Hogstrand, C. (2019). Guidance on harmonised methodologies for human health, animal health and ecological risk assessment of combined exposure to multiple chemicals. EFSA Journal, 17(3), e05634. https://doi.org/10.2903/j.efsa.2019.5634
- Epstein, D. L., Nolen, G. A., Randall, J. L., Christ, S. A., Read, E. J., Stober, J. A., and Smith, M. K. (1992). Cardiopathic effects of dichloroacetate in the fetal Long-Evans rat. Teratology, 46(3), 225–235. https://doi.org/10.1002/tera.1420460306
- Erdem, C. U., Ateia, M., Liu, C., and Karanfil, T. (2020). Activated carbon and organic matter characteristics impact the adsorption of DBP precursors when chlorine is added prior to GAC contactors. Water Res., 184, 116146. https://doi.org/10.1016/j.watres.2020.116146
- Ersan, M. S., Liu, C., Amy, G., Karanfi, T. (2019). The interplay between natural organic matter and bromide on bromine substitution. Sci. Total Environ., 646, 1172–1181. https://doi.org/10.1016/j.scitotenv.2018.07.384
- Escobar-Hoyos, L. F., Hoyos-Giraldo, L. S., Londoño-Velasco, E., Reyes-Carvajal, I., Saavedra-Trujillo, D., Carvajal-Varona, S., Sánchez-Gómez, A., Wagner, E. D., and Plewa, M. J. (2013). Genotoxic and clastogenic effects of monohaloacetic acid drinking water disinfection by-products in primary human lymphocytes. Water Res., 47(10), 3282–3290. https://doi.org/10.1016/j.watres.2013.02.052
- [EU] European Union. (2020). Directive (EU) 2020/2184 of the European parliament and of the council of 16 December 2020 on the quality of water intended for human consumption. Official Journal of the European Union.
- Evans, A. N., Carter, J. T., Brown, J., and Lauderdale, C. (2019). North American biofiltration practices. AWWA Water Sci., 1(4), n/a. https://doi.org/10.1002/aws2.1152
- Evans, S., Campbell, C., and Naidenko, O. V. (2020). Analysis of cumulative cancer risk associated with disinfection byproducts in United States drinking water. Int. J. Environ. Res. Public Health, 17(6). https://doi.org/10.3390/ijerph17062149
- Evans, O. B., and Stacpoole, P. W. (1982). Prolonged hypolactatemia and increased total pyruvate dehydrogenase activity by dichloroacetate. Biochem. Pharmacol., 31(7), 1295–1300. https://doi.org/10.1016/0006-2952(82)90019-3
- Fang, J., Yang, X., Ma, J., Shang, C., and Zhao, Q. (2010). Characterization of algal organic matter and formation of DBPs from chlor(am)ination. Water Res., 44(20), 5897–5906. https://doi.org/10.1016/j.watres.2010.07.009
- Fernández-Pascual, E., Droz, B., O’Dwyer, J., O’Driscoll, C., Goslan, E. H., Harrison, S., and Weatherill, J. (2023). Fluorescent dissolved organic matter components as surrogates for disinfection byproduct formation in drinking water: A critical review. ACS ES and T Water, 3(8), 1997–2008. https://doi.org/10.1021/acsestwater.2c00583
- Ferreira-Gonzalez, A., DeAngelo, A. B., Nasim, S., and Garrett, C. T. (1995). Ras oncogene activation during hepatocarcinogenesis in B6C3F1 male mice by dichloroacetic and trichloroacetic acids. Carcinogenesis, 16(3), 495–500.
- Foundation Instruments. (2025). Datasheet: HAA-RR™ Rapid Response Benchtop HAA Analyzer. Foundation Instruments, Collierville, Tennessee. Available at https://www.foundationinstruments.com/haa-rr
- Fisher, I., Kastl, G., Shang, F., and Sathasivan, A. (2018). Framework for optimizing chlorine and byproduct concentrations in drinking water distribution systems. J. Am. Water Works Assoc., 110(11), 38–49. https://doi.org/10.1002/awwa.1183
- Francis, R. A., Vanbrisen, J. M., and Small, M. J. (2010). Bayesian statistical modeling of disinfection byproduct (DBP) bromine incorporation in the ICR database. Environ. Sci. Technol., 44(4), 1232–1239. https://doi.org/10.1021/es9028606
- Fuhrman, F. A., Field, J., Wilson, R. H., and Deeds, F. (1955). Monochloroacetate: Effects of chronic administration to rats on growth, activity and tissue metabolism and inhibitory effects in vitro compared with monoiodoacetate and monobromoacetate. Arch. Int. Pharmacodyn, Ther., 102(1-2), 113–125.
- Gallard, H., Allard, S., Nicolau, R., von Gunten, U., and Croué, J. P. (2009). Formation of iodinated organic compounds by oxidation of iodide-containing waters with manganese dioxide. Environ. Sci. Technol., 43(18), 7003–7009. https://doi.org/10.1021/es9010338
- Gan, X., Karanfil, T., Kaplan Bekaroglu, S. S., and Shan, J. (2013). The control of N-DBP and C-DBP precursors with MIEX. Water Res., 47(3), 1344–1352. https://doi.org/10.1016/j.watres.2012.11.049
- Gang, D. D., Segar Jr, R. L., Clevenger, T. E., and Banerji, S. K. (2002). Using chlorine demand to predict TTHM and HAA9 formation. J. Am. Water Works Assn., 94(10), 76–86.
- Gao, Z., Lin, Y., Xu, B., Xia, Y., Hu, C., Zhang, T., Cao, T., Chu, W., and Gao, N. (2019). Effect of UV wavelength on humic acid degradation and disinfection by-product formation during the UV/chlorine process. Water Res., 154, 199–209. https://doi.org/10.1016/j.watres.2019.02.004
- Ge, R., Yang, S., Kramer, P. M., Tao, L., and Pereira, M. A. (2001). The effect of dichloroacetic acid and trichloroacetic acid on DNA methylation and cell proliferation in B6C3F1 mice. J. Biochem. Mol. Toxicol., 15(2), 100–106. https://doi.org/10.1002/jbt.5
- Gennaro, A. R. (2000). Remington: The science and practice of pharmacy. 20th. Lippincott Williams and Wilkins.
- Giani, R. E., and Hill, C. P. (2017). M58 - Internal corrosion control in water distribution systems. American Water Works Association, Denver, Colorado.
- Gilca, A. F., Teodosiu, C., Fiore, S., and Musteret, C. P. (2020). Emerging disinfection byproducts: A review on their occurrence and control in drinking water treatment processes. Chemosphere, 259.
- Giller, S., Le Curieux, F., Erb, F., and Marzin, D. (1997). Comparative genotoxicity of halogenated acetic acids found in drinking water. Mutagenesis, 12(5), 321–328. https://doi.org/10.1093/mutage/12.5.321
- Gonsioroski, A., Meling, D. D., Gao, L., Plewa, M. J., and Flaws, J. A. (2020). Iodoacetic acid inhibits follicle growth and alters expression of genes that regulate apoptosis, the cell cycle, estrogen receptors, and ovarian steroidogenesis in mouse ovarian follicles. Reprod. Toxicol. (Elmsford, N.Y.), 91, 101–108. https://doi.org/10.1016/j.reprotox.2019.10.005
- Gonsioroski, A., Meling, D. D., Gao, L., Plewa, M. J., and Flaws, J. A. (2021). Iodoacetic acid affects estrous cyclicity, ovarian gene expression, and hormone levels in mice. Biol. Reprod., 105(4), 1030–1042. https://doi.org/10.1093/biolre/ioab108
- Gonsioroski, A., Plewa, M. J., and Flaws, J. A. (2022). Effects of prenatal and lactational exposure to iodoacetic acid on the F1 generation of mice dagger. Biol. Reprod., 107(2), 650–663. https://doi.org/10.1093/biolre/ioac079
- Gonzalez-Leon, A., Merdink, J. L., Bull, R. J., and Schultz, I. R. (1999). Effect of pre-treatment with dichloroacetic or trichloroacetic acid in drinking water on the pharmacokinetics of a subsequent challenge dose in B6C3F1 mice. Chem. Biol. Interact., 123(3), 239–253. https://doi.org/10.1016/s0009-2797(99)00140-4
- Gonzalez-Leon, A., Schultz, I. R., Xu, G., and Bull, R. J. (1997). Pharmacokinetics and metabolism of dichloroacetate in the F344 rat after prior administration in drinking water. Toxicol. Appl. Pharmacol., 146(2), 189–195. https://doi.org/10.1006/taap.1997.8232
- Government of Canada. (2023). Human biomonitoring of environmental chemicals. Health Canada. https://www.canada.ca/en/health-canada/services/environmental-workplace-health/environmental-contaminants/human-biomonitoring-environmental-chemicals.html
- Grellier, J., Bennett, J., Patelarou, E., Smith, R. B., Toledano, M. B., Rushton, L., Briggs, D. J., and Nieuwenhuijsen, M. J. (2010). Exposure to disinfection by-products, fetal growth, and prematurity: A systematic review and meta-analysis. Epidemiology, 21(3), 300–313. https://doi.org/10.1097/EDE.0b013e3181d61ffd
- Guilherme, S., and Dorea, C. (2020). Real-time estimation of disinfection by-products through differential UV absorbance. Water (Basel), 12(9). https://doi.org/10.3390/w12092536
- Han, Z., Berendzen, K., Zhong, L., Surolia, I., Chouthai, N., Zhao, W., Maina, N., Srivastava, A., and Stacpoole, P. W. (2008). A combined therapeutic approach for pyruvate dehydrogenase deficiency using self-complementary adeno-associated virus serotype-specific vectors and dichloroacetate. Mol. Genet. Metab., 93(4), 381–387. https://doi.org/10.1016/j.ymgme.2007.10.131
- Harvey, J. B., Hong, H. L., Bhusari, S., Ton, T., Wang, Y., Foley, J. F., Peddada, S. D., Hooth, M., DeVito, M., Nyska, A., Pandiri, A. R., and Hoenerhoff, M. J. (2016). F344/NTac rats chronically exposed to bromodichloroacetic acid develop mammary adenocarcinomas with mixed luminal/basal phenotype and Tgfbeta dysregulation. Vet. Pathol., 53(1), 170–181. https://doi.org/10.1177/0300985815571680
- Hassoun, E. A., Cearfoss, J., and Spildener, J. (2010a). Dichloroacetate- and trichloroacetate-induced oxidative stress in the hepatic tissues of mice after long-term exposure. J. Appl. Toxicol., 30(5), 450–456. https://doi.org/10.1002/jat.1516
- Hassoun, E. A., Cearfoss, J., Musser, B., Krispinsky, S., Al-Hassan, N., and Liu, M. (2013). The induction of phagocytic activation by mixtures of the water chlorination by-products, dichloroacetate- and trichloroacetate, in mice after subchronic exposure. J. Biochem. Mol. Toxicol., 27(4), 237–242. https://doi.org/10.1002/jbt.21476
- Hassoun, E., Cearfoss, J., Mamada, S., Al-Hassan, N., Brown, M., Heimberger, K., and Liu, M. (2014). The effects of mixtures of dichloroacetate and trichloroacetate on induction of oxidative stress in livers of mice after subchronic exposure. J. Toxicol. Environ. Health Part A, 77(6), 313–323. https://doi.org/10.1080/15287394.2013.864576
- Hassoun, E. A., Spildener, J., and Cearfoss, J. (2010b). The induction of tumor necrosis factor-alpha, superoxide anion, myeloperoxidase, and superoxide dismutase in the peritoneal lavage cells of mice after prolonged exposure to dichloroacetate and trichloroacetate. J. Biochem. Mol. Toxicol., 24(2), 136–144. https://doi.org/10.1002/jbt.20322
- Hayes, F. D., Short, R. D., and Gibson, J. E. (1973). Differential toxicity of monochloroacetate, monofluoroacetate and monoiodoacetate in rats. Toxicol. Appl. Pharmacol., 26(1), 93–102. https://doi.org/10.1016/0041-008x(73)90089-6
- Health Canada. (2008). Guidelines for Canadian drinking water quality: Guideline technical document - Chlorite and Chlorate. Water, Air and Climate Change Bureau, Healthy Environments and Consumer Safety Branch, Health Canada, Ottawa, Ontario. Available at: https://www.canada.ca/en/health-canada/services/publications/healthy-living/guidelines-canadian-drinking-water-quality-guideline-technical-document-chlorite-chlorate.html
- Health Canada. (2011). Guidelines for Canadian drinking water quality: Guideline technical document - N-Nitrosodimethylamine. Water, Air and Climate Change Bureau, Healthy Environments and Consumer Safety Branch, Health Canada, Ottawa, Ontario. Available at: https://www.canada.ca/en/health-canada/services/publications/healthy-living/guidelines-canadian-drinking-water-quality-guideline-technical-document-n-nitrosodimethylamine-ndma.html
- Health Canada. (2017). National drinking water survey. Personal communication with Anca-Maria Tugulea, Environmental and Health Sciences Research Bureau.
- Health Canada. (2018). Guidelines for Canadian drinking water quality: Guideline technical document - Bromate. Water and Air Quality Bureau, Healthy Environments and Consumer Safety Branch, Health Canada, Ottawa, Ontario. Available at: https://www.canada.ca/en/health-canada/services/publications/healthy-living/guidelines-canadian-drinking-water-quality-guideline-technical-document-bromate/guidance-document.html
- Health Canada. (2020). Guidance on natural organic matter in drinking water. Water and Air Quality Bureau, Healthy Environments and Consumer Safety Branch, Health Canada, Ottawa, Ontario. Available at: https://www.canada.ca/en/health-canada/services/environmental-workplace-health/reports-publications/water-quality.html
- Health Canada. (2021a). Quantitative in vitro to in vivo extrapolation of iodinated chemicals using high throughput toxicokinetics. (Available upon request).
- Health Canada. (2021b). Canadian exposure factors used in human health risk assessments. Fact sheet. Available at: https://www.canada.ca/en/health-canada/services/chemical-substances/fact-sheets/canadian-exposure-factors-human-health-risk-assessments.html
- Health Canada. (2022). Guidance on monitoring the biological stability of drinking water in distribution systems. Water and Air Quality Bureau, Healthy Environments and Consumer Safety Branch, Health Canada, Ottawa, Ontario. Available at: https://www.canada.ca/en/health-canada/programs/consultation-guidance-biological-stability-water-distribution-systems/document.html
- Heller-Grossman, L., Manka, J., Limoni-Relis, B., and Rebhun, M. (1993). Formation and distribution of haloacetic acids, THM and tox in chlorination of bromide-rich lake water. Water Res., 27(8), 1323–1331. https://doi.org/10.1016/0043-1354(93)90219-8
- Hermanson, G. T. (2013). Liposome conjugates and derivatives. 21, 921–949.
- Hernández-Fonseca, K., Cárdenas-Rodríguez, N., Pedraza-Chaverri, J., and Massieu, L. (2008). Calcium-dependent production of reactive oxygen species is involved in neuronal damage induced during glycolysis inhibition in cultured hippocampal neurons. J. Neurosci. Res., 86(8), 1768–1780. https://doi.org/10.1002/jnr.21634
- Herren-Freund, S. L., Pereira, M. A., Khoury, M. D., and Olson, G. (1987). The carcinogenicity of trichloroethylene and its metabolites, trichloroacetic acid and dichloroacetic acid, in mouse liver. Toxicol. Appl. Pharmacol., 90(2), 183–189. https://doi.org/10.1016/0041-008x(87)90325-5
- Hinckley, A. F., Bachand, A. M., and Reif, J. S. (2005). Late pregnancy exposures to disinfection by-products and growth-related birth outcomes. Environ. Health Perspect., 113(12), 1808–1813. https://doi.org/10.1289/ehp.8282
- Hobara, T., Kobayashi, H., Kawamoto, T., Iwamoto, S., and Sakai, T. (1988). The absorption of trichloroethylene and its metabolites from the urinary bladder of anesthetized dogs. Toxicology, 48(2), 141–153. https://doi.org/10.1016/0300-483x(88)90096-0
- Hoffman, C. S., Mendola, P., Savitz, D. A., Herring, A. H., Loomis, D., Hartmann, K. E., Singer, P. C., Weinberg, H. S., and Olshan, A. F. (2008a). Drinking water disinfection by-product exposure and duration of gestation. Epidemiology, 19(5), 738–746. https://doi.org/10.1097/EDE.0b013e3181812beb
- Hoffman, C. S., Mendola, P., Savitz, D. A., Herring, A. H., Loomis, D., Hartmann, K. E., Singer, P. C., Weinberg, H. S., and Olshan, A. F. (2008b). Drinking water disinfection by-product exposure and fetal growth. Epidemiology, 19(5), 729–737. https://doi.org/10.1097/EDE.0b013e3181812bd4
- Holmes, M., Suarez, J. D., Roberts, N. L., Mole, M. L., Murr, A. S., and Klinefelter, G. R. (2001). Dibromoacetic acid, a prevalent by-product of drinking water disinfection, compromises the synthesis of specific seminiferous tubule proteins following both in vivo and in vitro exposures. J. Androl., 22(5), 878–890.
- Hong, H., Xiong, Y., Ruan, M., Liao, F., Lin, H., and Liang, Y. (2013). Factors affecting THMs, HAAs and HNMs formation of Jin Lan Reservoir water exposed to chlorine and monochloramine. Sci. Total Environ., 444, 196–204. https://doi.org/10.1016/j.scitotenv.2012.11.086
- Horton, B. J., Luben, T. J., Herring, A. H., Savitz, D. A., Singer, P. C., Weinberg, H. S., and Hartmann, K. E. (2011). The effect of water disinfection by-products on pregnancy outcomes in two southeastern US communities. Journal of Occup. Environ. Med., 53(10), 1172–1178. https://doi.org/10.1097/JOM.0b013e31822b8334
- Hua, L.C., Cai, P., Huang, C., and Huang, C. (2021). Tracking Br-DBPs and bromine substitution factors by two-stage differential characterization of water matrix and NOM during chlorination. Sci. Total Environ., 782, 146836. https://doi.org/10.1016/j.scitotenv.2021.146836
- Hua, G., and Reckhow, D. A. (2007a). Characterization of disinfection byproduct precursors based on hydrophobicity and molecular size. Environ. Sci. Technol., 41(9), 3309–3315. https://doi.org/10.1021/es062178c
- Hua, G., and Reckhow, D. A. (2007b). Comparison of disinfection byproduct formation from chlorine and alternative disinfectants. Water Res., 41(8), 1667–1678. https://doi.org/10.1016/j.watres.2007.01.032
- Hua, G., and Reckhow, D. A. (2008). DBP formation during chlorination and chloramination: Effect of reaction time, pH, dosage, and temperature. J. Am. Water Works Assoc., 100(8), 82–95. https://doi.org/10.1002/j.1551-8833.2008.tb09702.x
- Hua, G., and Reckhow, D. A. (2012). Effect of alkaline pH on the stability of halogenated DBPs. J. Am. Water Works Assoc., 104(2), E107–E120. https://doi.org/10.5942/jawwa.2012.104.0025
- Hua, G., and Reckhow, D. A. (2013). Effect of pre-ozonation on the formation and speciation of DBPs. Water Res., 47(13), 4322–4330. https://doi.org/10.1016/j.watres.2013.04.057
- Hua, G., Reckhow, D. A., and Kim, J. (2006). Effect of bromide and iodide ions on the formation and speciation of disinfection byproducts during chlorination. Environ. Sci. Technol., 40(9), 3050–3056. https://doi.org/10.1021/es0519278
- Hua, G., Reckhow, D. A., and Abusallout, I. (2015). Correlation between SUVA and DBP formation during chlorination and chloramination of NOM fractions from different sources. Chemosphere, 130, 82–89. https://doi.org/10.1016/j.chemosphere.2015.03.039
- Huang, J., Graham, N., Templeton, M. R., Zhang, Y., Collins, C., and Nieuwenhuijsen, M. (2009). A comparison of the role of two blue-green algae in THM and HAA formation. Water Res., 43(12), 3009–3018. https://doi.org/10.1016/j.watres.2009.04.029
- Huang, W., and Yeh, H. (1997). The effect of organic characteristics and bromide on disinfection by-products formation by chlorination. J. Environ. Sci. Health., Part A Envion. Sci. Eng. Toxic Hazard. Subst. Control, 32(8), 2311–2336. https://doi.org/10.1080/10934529709376684
- Hunter, E. S. 3., Rogers, E. H., Schmid, J. E., and Richard, A. (1996). Comparative effects of haloacetic acids in whole embryo culture. Teratology, 54(2), 57–64. https://doi.org/10.1002/(SICI)1096-9926(199606)54:2
- Hunter, E. S. 3., Rogers, E., Blanton, M., Richard, A., and Chernoff, N. (2006). Bromochloro-haloacetic acids: Effects on mouse embryos in vitro and QSAR considerations. Reprod. Toxicol., 21(3), 260–266. https://doi.org/10.1016/j.reprotox.2005.09.012
- [IARC] International Agency for Research on Cancer. (2012). IARC monographs on the evaluation of carcinogenic risks to humans: Some chemicals present in industrial and consumer products, food and drinking-water. International Agency for Research on Cancer.
- [IARC] International Agency for Research on Cancer. (2013). Some chemicals present in industrial and consumer products, food and drinking-water. IARC monographs on the evaluation of carcinogenic risks to humans, no.101. International Agency for Research on Cancer. https://www.ncbi.nlm.nih.gov/books/NBK373181/
- [IARC] International Agency for Research on Cancer. (2014). IARC monographs on the evaluation of carcinogenic risks to humans: Trichloroethylene, tetrachloroethylene, and some other chlorinated agents. (No. 106). International Agency for Research on Cancer.
- Indigenous Services Canada. (2019). Occurrence of HAAs in distribution system. Personal communication with X. Redhead.
- James, M. O., Cornett, R., Yan, Z., Henderson, G. N., and Stacpoole, P. W. (1997). Glutathione-dependent conversion to glyoxylate, a major pathway of dichloroacetate biotransformation in hepatic cytosol from humans and rats, is reduced in dichloroacetate-treated rats. Drug Metab. Dispos., 25(11), 1223–1227.
- James, M. O., Jahn, S. C., Zhong, G., Smeltz, M. G., Hu, Z., and Stacpoole, P. W. (2017). Therapeutic applications of dichloroacetate and the role of glutathione transferase zeta-1. Pharmacol. Ther., 170, 166–180. https://doi.org/10.1016/j.pharmthera.2016.10.018
- James, M. O., Yan, Z., Cornett, R., Jayanti, V. M., Henderson, G. N., Davydova, N., Katovich, M. J., Pollock, B., and Stacpoole, P. W. (1998). Pharmacokinetics and metabolism of [14C]dichloroacetate in male Sprague- Dawley rats. Identification of glycine conjugates, including hippurate, as urinary metabolites of dichloroacetate. Drug Metab. Dispos., 26(11), 1134–1143.
- Jia, M., Coats, B., Chadha, M., Frentzen, B., Perez-Rodriguez, J., Chadik, P. A., Yost, R. A., Henderson, G. N., and Stacpoole, P. W. (2006). Human kinetics of orally and intravenously administered low-dose 1,2-(13)C-dichloroacetate. J. Clin. Pharmacol., 46(12), 1449–1459. https://doi.org/10.1177/0091270006292627
- Jiang, J., Li, W., Zhang, X., Liu, J., and Zhu, X. (2018). A new approach to controlling halogenated DBPs by GAC adsorption of aromatic intermediates from chlorine disinfection: Effects of bromide and contact time. Separation and Purification Technology, 203, 260–267. https://doi.org/10.1016/j.seppur.2018.04.050
- Jiang, J., Zhang, X., Zhu, X., and Li, Y. (2017). Removal of intermediate aromatic halogenated DBPs by activated carbon adsorption: A new approach to controlling halogenated DBPs in chlorinated drinking water. Environ. Sci. Technol., 51(6), 3435–3444. https://doi.org/10.1021/acs.est.6b06161
- Johnson, B. A., Lin, J. C., Chan, J., Fang, M., Jacobsen, L., Rexing, D., and Sampson, P. (2009). Localized treatment for disinfection by-products. Proc. Water Environ. Fed., 2009(1), 381–387. https://doi.org/10.2175/193864709793848077
- Johnson, P. D., Dawson, B. V., and Goldberg, S. J. (1998). Cardiac teratogenicity of trichloroethylene metabolites. J. Am. Coll. Cardiol., 32(2), 540–545. https://doi.org/10.1016/s0735-1097(98)00232-0
- Jones, R. R., DellaValle, C. T., Weyer, P. J., Robien, K., Cantor, K. P., Krasner, S., Beane Freeman, L. E., and Ward, M. H. (2019). Ingested nitrate, disinfection by-products, and risk of colon and rectal cancers in the Iowa Women's Health Study cohort. Environ. Int., 126, 242–251. https://doi.org/10.1016/j.envint.2019.02.010
- Jones, R. R., Weyer, P. J., DellaValle, C. T., Robien, K., Cantor, K. P., Krasner, S., Beane Freeman, L. E., and Ward, M. H. (2017). Ingested nitrate, disinfection by-products, and kidney cancer risk in older women. Epidemiology, 28(5), 703–711. https://doi.org/10.1097/EDE.0000000000000647
- Jung, C., and Son, H. (2008). The relationship between disinfection by-products formation and characteristics of natural organic matter in raw water. Korean J. Chem. Eng., 25(4), 714–720. https://doi.org/10.1007/s11814-008-0117-z
- Kan, L. (2013). Animal models of bone diseases-A. In: Animal models for the study of human disease, 353–390. Elsevier, Amsterdam, Netherlands
- Kaphalia, B. S., Bhat, H. K., Khan, M. F., and Ansari, G. A. (1992). Tissue distribution of monochloroacetic acid and its binding to albumin in rats. Toxicol. Ind. Health, 8(1-2), 53–61. https://doi.org/10.1177/074823379200800105
- Kargalioglu, Y., McMillan, B. J., Minear, R. A., and Plewa, M. J. (2002). Analysis of the cytotoxicity and mutagenicity of drinking water disinfection by-products in Salmonella typhimurium. Teratog., Carcinog., Mutagen., 22(2), 113–128. https://doi.org/10.1002/tcm.10010
- Kastl, G., Sathasivan, A., and Fisher, I. (2016). A selection framework for NOM removal process for drinking water treatment. Desalin. Water Treat., 57(17), 7679–7689. https://doi.org/10.1080/19443994.2015.1044476
- Kato-Weinstein, J., Stauber, A. J., Orner, G. A., Thrall, B. D., and Bull, R. J. (2001). Differential effects of dihalogenated and trihalogenated acetates in the liver of B6C3F1 mice. J. Appl. Toxicol., 21(2), 81–89. https://doi.org/10.1002/jat.717
- Katz, R., Tai, C. N., Diener, R. M., McConnell, R. F., and Semonick, D. E. (1981). Dichloroacetate, sodium: 3-month oral toxicity studies in rats and dogs. Toxicol. Appl. Pharmacol., 57(2), 273–287. https://doi.org/10.1016/0041-008x(81)90289-1
- Kaufman, J. A., Wright, J. M., Evans, A., Rivera-Núñez, Z., Meyer, A., and Narotsky, M. G. (2018). Associations between disinfection by-product exposures and craniofacial birth defects. J. Occup. Environ. Med., 60(2), 109–119. https://doi.org/10.1097/JOM.0000000000001191
- Kaufman, J. A., Wright, J. M., Evans, A., Rivera-Núñez, Z., Meyer, A., and Narotsky, M. G. (2020). Disinfection by-product exposures and the risk of musculoskeletal birth defects. Environmental Epidemiology, 4(1), e081. https://doi.org/10.1097/EE9.0000000000000081
- Kaydos, E. H., Suarez, J. D., Roberts, N. L., Bobseine, K., Zucker, R., Laskey, J., and Klinefelter, G. R. (2004). Haloacid induced alterations in fertility and the sperm biomarker SP22 in the rat are additive: Validation of an ELISA. Toxicol. Sci., 81(2), 430–442. https://doi.org/10.1093/toxsci/kfh218
- Keys, D. A., Schultz, I. R., Mahle, D. A., and Fisher, J. W. (2004). A quantitative description of suicide inhibition of dichloroacetic acid in rats and mice. Toxicol. Sci., 82(2), 381–393. https://doi.org/10.1093/toxsci/kfh276
- Kim, H., Haltmeier, P., Klotz, J. B., and Weisel, C. P. (1999). Evaluation of biomarkers of environmental exposures: Urinary haloacetic acids associated with ingestion of chlorinated drinking water. Environ. Res., 80(2 Pt 1), 187–195. https://doi.org/10.1006/enrs.1998.3896
- Kim, H., Shim, J., and Lee, S. (2002). Formation of disinfection by-products in chlorinated swimming pool water. Chemosphere, 46(1), 123–130. https://doi.org/10.1016/s0045-6535(00)00581-6
- Kimura, S.Y., Zheng, W., Hipp, T. N., Allen, J. M., and Richardson, S. D. (2017). Total organic halogen (TOX) in human urine: A halogen-specific method for human exposure studies. J. Environ. Sci., 58, 285–295.
- King, W. D., Dodds, L., Allen, A. C., Armson, B. A., Fell, D., and Nimrod, C. (2005). Haloacetic acids in drinking water and risk for stillbirth. Occup. Environ. Med., 62(2), 124–127. https://doi.org/10.1136/oem.2004.013797
- Klinefelter, G. R., Strader, L. F., Suarez, J. D., and Roberts, N. L. (2002). Bromochloroacetic acid exerts qualitative effects on rat sperm: Implications for a novel biomarker. Toxicol. Sci., 68(1), 164–173. https://doi.org/10.1093/toxsci/68.1.164
- Klinefelter, G. R., Strader, L. F., Suarez, J. D., Roberts, N. L., Goldman, J. M., and Murr, A. S. (2004). Continuous exposure to dibromoacetic acid delays pubertal development and compromises sperm quality in the rat. Toxicol. Sci., 81(2), 419–429. https://doi.org/10.1093/toxsci/kfh217
- Koch, B., Krasner, S. W., Sclimenti, M. J., and Schimpff, W. K. (1991). Predicting the formation of DBPs by the simulated distribution system. J. Am. Water Works Assoc., 83(10), 62–70. https://doi.org/10.1002/j.1551-8833.1991.tb07233.x
- Komaki, Y., Pals, J., Wagner, E. D., Mariñas, B. J., and Plewa, M. J. (2009). Mammalian cell DNA damage and repair kinetics of monohaloacetic acid drinking water disinfection by-products. Environ. Sci. Technol., 43(21), 8437–8442. https://doi.org/10.1021/es901852z
- Korshin, G. V., Wu, W. W., Benjamin, M. M., and Hemingway, O. (2002). Correlations between differential absorbance and the formation of individual DBPs. Water Res., 36(13), 3273–3282. https://doi.org/10.1016/S0043-1354(02)00042-8
- Krasner, S. W., Lee, T. C. F., Westerhoff, P., Fischer, N., Hanigan, D., Karanfil, T., Beita-Sandi, W., Taylor-Edmonds, L., and Andrews, R. C. (2016). Granular activated carbon treatment may result in higher predicted genotoxicity in the presence of bromide. Environ. Sci. Technol., 50(17), 9583–9591. https://doi.org/10.1021/acs.est.6b02508
- Krasner, S. W., Sclimenti, M. J., Chinn, R., Chowdhury, Z. K., and Owen, D. M. (1996). The impact of TOC and bromide on chlorination by-product formation. In: Minear, R. A. and Amy, G. L. (Eds). Disinfection By-Products in Water Treatment: The Chemistry of their Formation and Control, (pp 59-90). CRC-Lewis Publishers: New York.
- Krasner, S. W., Weinberg, H. S., Richardson, S. D., Pastor, S. J., Chinn, R., Sclimenti, M. J., Onstad, G. D., and Thruston, A. D. J. (2006). Occurrence of a new generation of disinfection byproducts. Environ. Sci. Technol., 40(23), 7175–7185. https://doi.org/10.1021/es060353j
- Krishnan, K., and Carrier, R. (2008). Approaches for evaluating the relevance of multiroute exposures in establishing guideline values for drinking water contaminants. J. Environ. Sci. Health C Environ. Carcinog. Ecotoxicol. Rev., 26(3), 300–316. https://doi.org/10.1080/10590500802343974
- Krishnan, K., and Carrier, R. (2013). The use of exposure source allocation factor in the risk assessment of drinking-water contaminants. J. Toxicol. Environ. Health Part B, Crit. Rev, 16(1), 39–51. https://doi.org/10.1080/10937404.2013.769419
- Kristiana, I., Gallard, H., Joll, C., and Croué, J. (2009). The formation of halogen-specific TOX from chlorination and chloramination of natural organic matter isolates. Water Res., 43(17), 4177–4186. https://doi.org/10.1016/j.watres.2009.06.044
- Lamsal, R., Montreuil, K. R., Kent, F. C., Walsh, M. E., and Gagnon, G. A. (2012). Characterization and removal of natural organic matter by an integrated membrane system. Desalination, 303, 12–16. https://doi.org/10.1016/j.desal.2012.06.025
- Landmeyer, J. E., Bradley, P. M., and Thomas, J. M. (2000). Biodegradation of disinfection byproducts as a potential removal process during aquifer storage recovery. J. Am. Water Resour. Assoc., 36(4), 861–867. https://doi.org/10.1111/j.1752-1688.2000.tb04312.x
- Lapointe, M., Papineau, I., Peldszus, S., Peleato, N., and Barbeau, B. (2021). Identifying the best coagulant for simultaneous water treatment objectives: Interactions of mononuclear and polynuclear aluminum species with different natural organic matter fractions. J. Water Process Eng., 40, 1–12. https://doi.org/10.1016/j.jwpe.2020.101829
- Larranaga, M. D., Lewis, R., and Lewis, R. A. (2016). https://onlinelibrary.wiley.com/doi/book/10.1002/9781119312468 Hawley's condensed chemical dictionary. John Wiley and Sons, Inc.
- Larson, J. L., and Bull, R. J. (1992). Metabolism and lipoperoxidative activity of trichloroacetate and dichloroacetate in rats and mice. Toxicol. Appl. Pharmacol., 115(2), 268–277. https://doi.org/10.1016/0041-008x(92)90332-m
- Lebel, G. L., Benoit, F. M., and Williams, D. T. (1997). A one-year survey of halogenated disinfection by-products in the distribution system of treatment plants using three different disinfection processes. Chemosphere, 34(11), 2301–2317. https://doi.org/10.1016/s0045-6535(97)00042-8
- Lee, S., and Cho, J. (2004). Comparison of ceramic and polymeric membranes for natural organic matter (NOM) removal. Desalination, 160(3), 223–232. https://doi.org/10.1016/s0011-9164(04)90025-2
- Lee, W., Huang, C., and Zhu, G. (2018). Analysis of 40 conventional and emerging disinfection by-products in fresh-cut produce wash water by modified EPA methods. Food Chem., 256, 319–326. https://doi.org/10.1016/j.foodchem.2018.02.134
- Lee, W., Huang, C., and Zhu, G. (2019). Analytical methods for conventional and emerging disinfection by-products in fresh-cut produce. Food Chem., 291, 30–37.
- Lee, Y., Noh, J., Park, J., Yoon, S., Kim, S., Son, H. J., Lee, W., and Maeng, S. K. (2023). Integrating biological ion exchange with biological activated carbon treatment for drinking water: A novel approach for NOM removal, trihalomethane formation potential, and biological stability. Water Res., 245, 120598. https://doi.org/10.1016/j.watres.2023.120598
- Legay, C., Leduc, S., Dubé, J., Levallois, P., and Rodriguez, M. J. (2019). Chlorination by-product levels in hot tap water: Significance and variability. Sci. Total Environ., 651(2), 1735–1741. https://doi.org/10.1016/j.scitotenv.2018.10.075
- Levallois, P., Giguère, Y., Nguile-Makao, M., Rodriguez, M., Campagna, C., Tardif, R., and Bureau, A. (2016). Disinfection by-products exposure and intra-uterine growth restriction: Do genetic polymorphisms of CYP2E1or deletion of GSTM1 or GSTT1 modify the association? Environ. Int., 92-93, 220–231. https://doi.org/10.1016/j.envint.2016.03.033
- Levallois, P., Gingras, S., Marcoux, S., Legay, C., Catto, C., Rodriguez, M., and Tardif, R. (2012). Maternal exposure to drinking-water chlorination by-products and small-for-gestational-age neonates. Epidemiology, 23(2), 267–276. https://doi.org/10.1097/EDE.0b013e3182468569
- Li, B., Liu, R., Liu, H., Gu, J., and Qu, J. (2008a). The formation and distribution of haloacetic acids in copper pipe during chlorination. J. Hazard. Mater., 152(1), 250–258. https://doi.org/10.1016/j.jhazmat.2007.06.090
- Li, T., Schultz, I., Keys, D. A., Campbell, J. L., and Fisher, J. W. (2008b). Quantitative evaluation of dichloroacetic acid kinetics in human--a physiologically based pharmacokinetic modeling investigation. Toxicology, 245(1-2), 35–48. https://doi.org/10.1016/j.tox.2007.12.010
- Li, X., and Mitch, W. A. (2018). Drinking water disinfection byproducts (DBPs) and human health effects: multidisciplinary challenges and opportunities. Environ. Sci. Technol., 52(4), 1681–1689. https://doi.org/10.1021/acs.est.7b05440
- Liang, L., and Singer, P. C. (2003). Factors influencing the formation and relative distribution of haloacetic acids and trihalomethanes in drinking water. Environ. Sci. Technol., 37(13), 2920–2928. https://doi.org/10.1021/es026230q
- Lifongo, L. L., Bowden, D. J., and Brimblecombe, P. (2010). Thermal degradation of haloacetic acids in water. Int J. Phys. Sci., 5(6), 738–747.
- Lin, E. L., Mattox, J. K., and Daniel, F. B. (1993). Tissue distribution, excretion, and urinary metabolites of dichloroacetic acid in the male Fischer 344 rat. J. Toxicol. Environ. Health, 38(1), 19–32. https://doi.org/10.1080/15287399309531697
- Lin, J., and Ika, A. R. (2020). Minimization of halogenated DBP precursors by enhanced PACl coagulation: The impact of organic molecule fraction changes on DBP precursors destabilization with Al hydrates. Sci. Total Environ., 703, 134936. https://doi.org/10.1016/j.scitotenv.2019.134936
- Lin, Q., Dong, F., Miao, Y., Li, C., and Fei, W. (2020). Removal of disinfection by‐products and their precursors during drinking water treatment processes. Water Environ. Res., 92(5), 698–705. https://doi.org/10.1002/wer.1263
- Linder, R. E., Klinefelter, G. R., Strader, L. F., Suarez, J. D., and Dyer, C. J. (1994a). Acute spermatogenic effects of bromoacetic acids. Fundam. Appl. Toxicol., 22(3), 422–430. https://doi.org/10.1006/faat.1994.1048
- Linder, R. E., Klinefelter, G. R., Strader, L. F., Suarez, J. D., Roberts, N. L., and Dyer, C. J. (1994b). Spermatotoxicity of dibromoacetic acid in rats after 14 daily exposures. Reprod. Toxicol., 8(3), 251–259. https://doi.org/10.1016/0890-6238(94)90009-4
- Linder, R. E., Klinefelter, G. R., Strader, L. F., Narotsky, M. G., Suarez, J. D., Roberts, N. L., and Perreault, S. D. (1995). Dibromoacetic acid affects reproductive competence and sperm quality in the male rat. Fundam. Appl. Toxicol., 28(1), 9–17. https://doi.org/10.1006/faat.1995.1140
- Linder, R. E., Klinefelter, G. R., Strader, L. F., Suarez, J. D., and Roberts, N. L. (1997a). Spermatotoxicity of dichloroacetic acid. Reprod. Toxicol., 11(5), 681–688. https://doi.org/10.1016/s0890-6238(97)00031-2
- Linder, R. E., Klinefelter, G. R., Strader, L. F., Veeramachaneni, D. N., Roberts, N. L., and Suarez, J. D. (1997b). Histopathologic changes in the testes of rats exposed to dibromoacetic acid. Reprod. Toxicol., 11(1), 47–56. https://doi.org/10.1016/s0890-6238(96)00196-7
- Liu, B., and Reckhow, D. A. (2013). DBP formation in hot and cold water across a simulated distribution system: Effect of incubation time, heating time, pH, chlorine dose, and incubation temperature. Environ. Sci. Technol., 47(20), 11584–11591. https://doi.org/10.1021/es402840g
- Liu, B., and Reckhow, D. A. (2015). Disparity in disinfection byproducts concentration between hot and cold tap water. Water Res., 70, 196–204. https://doi.org/10.1016/j.watres.2014.11.045
- Liu, C., Ersan, M. S., Wagner, E., Plewa, M. J., Amy, G., and Karanfil, T. (2020a). Toxicity of chlorinated algal-impacted waters: Formation of disinfection byproducts vs. reduction of cyanotoxins. Water Res., 184, 116145. https://doi.org/10.1016/j.watres.2020.116145
- Liu, C., Olivares, C. I., Pinto, A. J., Lauderdale, C. V., Brown, J., Selbes, M., and Karanfil, T. (2017a). The control of disinfection byproducts and their precursors in biologically active filtration processes. Water Res., 124, 630–653. https://doi.org/10.1016/j.watres.2017.07.080
- Liu, J., Li, X., Xie, Y., and Tang, H. (2014). Characterization of soluble microbial products as precursors of disinfection byproducts in drinking water supply. Sci. Total Environ., 472, 818–824. https://doi.org/10.1016/j.scitotenv.2013.11.139
- Liu, S., Li, Z., Dong, H., Goodman, B. A., and Qiang, Z. (2017b). Formation of iodo-trihalomethanes, iodo-acetic acids, and iodo-acetamides during chloramination of iodide-containing waters: Factors influencing formation and reaction pathways. J. Hazard. Mater., 321, 28–36. https://doi.org/10.1016/j.jhazmat.2016.08.071
- Liu, Z., Lompe, K. M., Mohseni, M., Bérubé, P. R., Sauvé, S., and Barbeau, B. (2020b). Biological ion exchange as an alternative to biological activated carbon for drinking water treatment. Water Res., 168, 115148. https://doi.org/10.1016/j.watres.2019.115148
- Liu, Z., Mills, E. C., Mohseni, M., Barbeau, B., and Bérubé, P. R. (2022). Biological ion exchange as an alternative to biological activated carbon for natural organic matter removal: Impact of temperature and empty bed contact time (EBCT). Chemosphere, 288, 132466. https://doi.org/10.1016/j.chemosphere.2021.132466
- Liu, Z., Xu, B., Zhang, T., Hu, C., Tang, Y., Dong, Z., Cao, T., and El-Din, M. (2021). Formation of disinfection by-products in a UV-activated mixed chlorine/chloramine system. J. Hazard. Mater., 407, 124373. https://doi.org/10.1016/j.jhazmat.2020.124373
- Long, K., Sha, Y., Mo, Y., Wei, S., Wu, H., Lu, D., Xia, Y., Yang, Q., Zheng, W., and Wei, X. (2021). Androgenic and teratogenic effects of iodoacetic acid drinking water disinfection byproduct in vitro and in vivo. Environ. Sci. Technol., 55(6), 3827-3835. https://doi.org/10.1021/acs.est.0c06620
- Lou, J., Chan, H., Han, J., and Yang, C. (2016). High removal of haloacetic acids from treated drinking water using bio-activated carbon method. Desalin. Water Treat., 57(53), 25627–25638. https://doi.org/10.1080/19443994.2016.1154896
- Lu, J., Tan, M., and Cai, Q. (2015). The Warburg effect in tumor progression: mitochondrial oxidative metabolism as an anti-metastasis mechanism. Cancer Lett., 356(2 Pt A), 156–164. https://doi.org/10.1016/j.canlet.2014.04.001
- Luben, T. J., Nuckols, J. R., Mosley, B. S., Hobbs, C., and Reif, J. S. (2008). Maternal exposure to water disinfection by-products during gestation and risk of hypospadias. Occup. Environ. Med., 65(6), 420–429. https://doi.org/10.1136/oem.2007.034256
- Luben, T. J., Olshan, A. F., Herring, A. H., Jeffay, S., Strader, L., Buus, R. M., Chan, R. L., Savitz, D. A., Singer, P. C., Weinberg, H. S., and Perreault, S. D. (2007). The healthy men study: an evaluation of exposure to disinfection by-products in tap water and sperm quality. Environ. Health Perspect., 115(8), 1169–1176. https://doi.org/10.1289/ehp.10120
- Lukas, G., Vyas, K. H., Brindle, S. D., Le Sher, A. R., and Wagner, W. E. J. (1980). Biological disposition of sodium dichloroacetate in animals and humans after intravenous administration. J. Pharm. Sci., 69(4), 419–421. https://doi.org/10.1002/jps.2600690415
- Lumpkin, M. H., Bruckner, J. V., Campbell, J. L., Dallas, C. E., White, C. A., and Fisher, J. W. (2003). Plasma binding of trichloroacetic acid in mice, rats, and humans under cancer bioassay and environmental exposure conditions. Drug Metab. Dispos., 31(10), 1203–1207. https://doi.org/10.1124/dmd.31.10.1203
- Mackeown, H., Gyamfi, J.A., Schoutteten, V.K.M., Dumoulin, D., Verdickt, L., Ouddane, B., and Criquet, J. (2020). Formation and removal of disinfection by-products in full scale drinking water treatment plant. Sci. Total Environ., 704, 135280. https://doi.org/10.1016/j.scitotenv.2019.135280
- MacLehose, R. F., Savitz, D. A., Herring, A. H., Hartmann, K. E., Singer, P. C., and Weinberg, H. S. (2008). Drinking water disinfection by-products and time to pregnancy. Epidemiology, 19(3), 451–458. https://doi.org/10.1097/EDE.0b013e31816a23eb
- Maisenbacher, H. W. 3., Shroads, A. L. 3., Zhong, G., Daigle, A. D., Abdelmalak, M. M., Samper, I. S., Mincey, B. D., James, M. O., and Stacpoole, P. W. (2013). Pharmacokinetics of oral dichloroacetate in dogs. J. Biochem. Mol. Toxicol., 27(12), 522–525. https://doi.org/10.1002/jbt.21518
- Majidzadeh, H., Uzun, H., Chen, H., Bao, S., Tsui, M. T., Karanfil, T., and Chow, A. T. (2020). Hurricane resulted in releasing more nitrogenous than carbonaceous disinfection byproduct precursors in coastal watersheds. Sci. Total Environ., 705, 135785. https://doi.org/10.1016/j.scitotenv.2019.135785
- Maksimov, G., and Dubinina, O. (1974). Empirical determination with materials of experimental substantiation of the maximally permissible concentration (MAC) value for monochloroacetic acid in the air of production area. Gig Truda Prof Zabol, 9, 32–35.
- Mallya, D. S., Abdikheibari, S., Dumée, L. F., Muthukumaran, S., Lei, W., and Baskaran, K. (2023). Removal of natural organic matter from surface water sources by nanofiltration and surface engineering membranes for fouling mitigation – A review. Chemosphere, 321, 138070. https://doi.org/10.1016/j.chemosphere.2023.138070
- Manitoba Sustainable Development. (2019). Occurrence of HAAs in distribution system. Personal communication with K. Phillip, Office of Drinking Water.
- Marcoux, A., Pelletier, G., Legay, C., Bouchard, C., and Rodriguez, M. J. (2017). Behavior of non-regulated disinfection by-products in water following multiple chlorination points during treatment. Sci. Total Environ., 586, 870–878. https://doi.org/10.1016/j.scitotenv.2017.02.066
- Mashau, F., Ncube, E. J., and Voyi, K. (2018). Drinking water disinfection by-products exposure and health effects on pregnancy outcomes: A systematic review. J. Water Health, 16(2), 181–196. https://doi.org/10.2166/wh.2018.167
- Mashau, F., Ncube, E. J., and Voyi, K. (2019). Maternal urinary levels of trichloroacetic acid and association with adverse pregnancy outcomes. J. Water Health, 17(6), 884–895. https://doi.org/10.2166/wh.2019.109
- Mather, G. G., Exon, J. H., and Koller, L. D. (1990). Subchronic 90 day toxicity of dichloroacetic and trichloroacetic acid in rats. Toxicology, 64(1), 71–80. https://doi.org/10.1016/0300-483x(90)90100-u
- Matthews, J. L., Schultz, I. R., Easterling, M. R., and Melnick, R. L. (2010). Physiologically based pharmacokinetic modeling of dibromoacetic acid in F344 rats. Toxicol. Appl. Pharmacol., 244(2), 196–207. https://doi.org/10.1016/j.taap.2009.12.033
- McGuire, M. J., Karanfil, T., Krasner, S. W., Reckhow, D. A., Roberson, J. A., Summers, R. S., Westerhoff, P., and Xie, Y. (2014). Not your granddad's disinfection by-product problems and solutions. J. Am. Water Works Assoc., 106(8), 54–73. https://doi.org/10.5942/jawwa.2014.106.0128
- McKie, M. J., Taylor-Edmonds, L., Andrews, S. A., and Andrews, R. C. (2015). Engineered biofiltration for the removal of disinfection by-product precursors and genotoxicity. Water Res., 81, 196–207. https://doi.org/10.1016/j.watres.2015.05.034
- Medgyesi, D. N., Trabert, B., Sampson, J., Weyer, P. J., Prizment, A., Fisher, J. A., Beane Freeman, L. E., Ward, M. H., and Jones, R. R. (2022). Drinking water disinfection byproducts, ingested nitrate, and risk of endometrial cancer in postmenopausal women. Environ. Health Perspect., 130(5), 57012. https://doi.org/10.1289/EHP10207
- Meek, M. E., Boobis, A., Cote, I., Dellarco, V., Fotakis, G., Munn, S., Seed, J., and Vickers, C. (2014a). New developments in the evolution and application of the WHO/IPCS framework on mode of action/species concordance analysis. J. Appl. Toxicol.–34(1), 1–18.
- Meek, M. E. B., Palermo, C. M., Bachman, A. N., North, C. M., and Jeffrey Lewis, R. (2014b). Mode of action human relevance (species concordance) framework: Evolution of the Bradford Hill considerations and comparative analysis of weight of evidence. J. Appl. Toxicol.–34(6), 595–606. https://doi.org/10.1002/jat.2984
- Méité, L., Fotsing, M., and Barbeau, B. (2015). Efficacy of ozone to reduce chlorinated disinfection by-products in Quebec (Canada) drinking water facilities. Ozone: Sci. Eng., 37(3), 294–305. https://doi.org/10.1080/01919512.2014.946592
- Melnick, R. L., Nyska, A., Foster, P. M., Roycroft, J. H., and Kissling, G. E. (2007). Toxicity and carcinogenicity of the water disinfection byproduct, dibromoacetic acid, in rats and mice. Toxicology, 230(2-3), 126–136. https://doi.org/10.1016/j.tox.2006.11.006
- Merdink, J. L., Bull, R. J., and Schultz, I. R. (2000). Trapping and identification of the dichloroacetate radical from the reductive dehalogenation of trichloroacetate by mouse and rat liver microsomes. Free Radical Biol. Med., 29(2), 125–130. https://doi.org/10.1016/s0891-5849(00)00330-0
- Merdink, J. L., Bull, R. J., and Schultz, I. R. (2001). Toxicokinetics of bromodichloroacetate in B6C3F1 mice. J. Appl. Toxicol., 21(1), 53–57. https://doi.org/10.1002/jat.732
- Metcalfe, D., Rockey, C., Jefferson, B., Judd, S., and Jarvis, P. (2015). Removal of disinfection by-product precursors by coagulation and an innovative suspended ion exchange process. Water Res., 87, 20–28. https://doi.org/10.1016/j.watres.2015.09.003
- Metro Vancouver Laboratory. (2020). Personal communication with H. Neumann, Vancouver, British Columbia
- Meyer, I., Français, T., Lykins, B., Dutang, M., and Hartemann, P. (1993). Influence of biofilm on disinfection by-products in a distribution network. Water Supply, 11(3/4), 355–364. https://search.proquest.com/docview/13687768
- Miltner, R. J., Shukairy, H. M., and Summers, R. S. (1992). Disinfection by-product formation and control by ozonation and biotreatment. J. Am. Water Works Assoc., 84(11), 53–62. https://doi.org/10.1002/j.1551-8833.1992.tb05882.x
- Ministère du Développement durable, de l’Environnement et de la Lutte contre les changements climatiques du Québec. (2019). Occurrence of paired HAAs in water. Personal communication with P. Cantin, Division de l’eau potable.
- Miyagawa, M., Takasawa, H., Sugiyama, A., Inoue, Y., Murata, T., Uno, Y., and Yoshikawa, K. (1995). The in vivo-in vitro replicative DNA synthesis (RDS) test with hepatocytes prepared from male B6C3F1 mice as an early prediction assay for putative nongenotoxic (Ames-negative) mouse hepatocarcinogens. Mutat. Res., 343(2-3), 157–183. https://doi.org/10.1016/0165-1218(95)90082-9
- Morris, E. D., and Bost, J. C. (2002). Acetic acid, halogenated derivatives. Kirk‐Othmer encyclopedia of chemical technology. Acetic acid, halogenated derivatives. 5th (pp. 136–146). John Wiley and Sons, Inc.
- Morrison, J. L. (1946). Toxicity of certain halogen substituted aliphatic acids for white mice. J. Pharmacol. Exp. Ther., 86(4), 336–338.
- Morten, K. J., Caky, M., and Matthews, P. M. (1998). Stabilization of the pyruvate dehydrogenase E1alpha subunit by dichloroacetate. Neurology, 51(5), 1331–1335. https://doi.org/10.1212/wnl.51.5.1331
- Moser, V. C., Phillips, P. M., Levine, A. B., McDaniel, K. L., Sills, R. C., Jortner, B. S., and Butt, M. T. (2004). Neurotoxicity produced by dibromoacetic acid in drinking water of rats. Toxicol. Sci., 79(1), 112–122. https://doi.org/10.1093/toxsci/kfh081
- Muellner, M. G., Attene-Ramos, M. S., Hudson, M. E., Wagner, E. D., and Plewa, M. J. (2010). Human cell toxicogenomic analysis of bromoacetic acid: a regulated drinking water disinfection by-product. Environ. Mol. Mutagen., 51(3), 205–214. https://doi.org/10.1002/em.20530
- Narotsky, M. G., Best, D. S., McDonald, A., Godin, E. A., Hunter, E. S. 3., and Simmons, J. E. (2011). Pregnancy loss and eye malformations in offspring of F344 rats following gestational exposure to mixtures of regulated trihalomethanes and haloacetic acids. Reprod. Toxicol. (Elmsford, N.Y.), 31(1), 59–65. https://doi.org/10.1016/j.reprotox.2010.08.002
- Narotsky, M. G., Hamby, B. T., Best, D. S., and Hunter, E. S. (1996). In vivo developmental effects of dibromoacetic acid (DBA) and dichloroacetic acid (DCA) in mice (Abstract). Teratology, 53(2), 96–97.
- Narotsky, M. G., Hamby, B. T., and Best, D. S. (1997). Developmental effects of dibromoacetic acid (DBA) in a Segment II study in mice (Abstract). Teratology, 55(1).
- Narotsky, M. G., Klinefelter, G. R., Goldman, J. M., DeAngelo, A. B., Best, D. S., McDonald, A., Strader, L. F., Murr, A. S., Suarez, J. D., George, M. H., Hunter, E. S., and Simmons, J. E. (2015). Reproductive toxicity of a mixture of regulated drinking-water disinfection by-products in a multigenerational rat bioassay. Environ. Health Perspect., 123(6), 564–570. https://doi.org/10.1289/ehp.1408579
- New Brunswick Department of Environment and Local Government. (2019). Occurrence of HAAs in distribution system. Personal communication with K. Gould, Healthy Environment Branch.
- Newfoundland and Labrador Department of Municipal Affairs and Environment. (2019). Occurrence and concentration of HAAs in surface water and groundwater. Personal communication with H. Khan, Water Resources Management Division.
- [NHMRC, NRMMC] National Health and Medical Research Council, National Resource Management Ministerial Council. (2011). Australian Drinking Water Guidelines Paper 6 National Water Quality Management Strategy. National Health and Medical Research Council, National Resource Management Ministerial Council, Commonwealth of Australia, Canberra.
- Niu, X., Harir, M., Schmitt-Kopplin, P., and Croué, J. (2019). Sunlight-induced phototransformation of transphilic and hydrophobic fractions of Suwannee River dissolved organic matter. Sci. Total Environ., 694, 133737. https://doi.org/10.1016/j.scitotenv.2019.133737
- Nova Scotia Environment. (2019). Occurrence of HAAs in distribution system. Personal communication with A. Polega, Drinking Water Management Unit.
- NSF International. (2023a). NSF/ANSI standard 53: Drinking water treatment units - health effects. NSF International/American National Standards Institute. NSF International, Ann Arbor, Michigan.
- NSF International. (2023b). NSF/ANSI standard 58: Reverse osmosis drinking water treatment systems. NSF International/American National Standards Institute. NSF International, Ann Arbor, Michigan.
- NSF International. (2024). NSF/ANSI standard 55: Ultraviolet microbiological water treatment systems. NSF International/American National Standards Institute. NSF International, Ann Arbor, Michigan.
- [NTP] National Toxicology Program. (1992). NTP Toxicology and Carcinogenesis Studies of Monochloroacetic Acid (CAS No. 79-11-8) in F344/N Rats and B6C3F1 Mice (Gavage Studies). National Toxicology Program Technical Report Series, 396, 1-245.
- [NTP] National Toxicology Program. (1998b). Final report on the short term reproductive and developmental toxicity of bromochloroacetic acid (CAS No. 5589-96-8) administered in drinking water to Sprague-Dawley rats. National Toxicology Program, National Institute of Environmental Health Sciences, Research Triangle Park, North Carolina.
- [NTP] National Toxicology Program. (1998a). Reproductive and developmental toxicity study of tribromoacetic acid administered in drinking water to Sprague Dawley rats. National Toxicology Program, National Institute of Environmental Health Sciences, Research Triangle Park, North Carolina.
- [NTP] National Toxicology Program. (2000). Final report on the short term reproductive and developmental toxicity of dibromochloro-acetic acid (CAS No. 5278-95-5) administered in drinking water to Sprague-Dawley rats. NTIS Technical Report (NTIS/PB2000-103420). National Toxicology Program, National Institutes of Health, Public Health Service, U.S. Department of Health and Human Services. Research Triangle Park, North Carolina.
- [NTP] National Toxicology Program. (2007a). NTP technical report on the toxicology and carcinogenesis studies of dibromoacetic acid (CAS No. 631-64-1) in F344/N rats and B6C3F1 mice drinking water studies. NTP TR 537. NIH Publication No. 07-4475. National Toxicology Program, U.S. Department of Health and Human Services. Research Triangle Park, North Carolina.
- [NTP] National Toxicology Program. (2007b). NTP report on the toxicology studies of dichloroacetic acid (CAS No. 79-43-6) in genetically modified (FVB Tg.AC hemizygous) mice (dermal and drinking water studies) and carcinogenicity studies of dichloroacetic acid in genetically modified [B6.129-Trp53(tm1Brd) (N5) haploinsufficient] mice (drinking water studies). National Toxicology Program Genetically Modified Model Report, (11), 1-168. National Toxicology Program, National Institute of Environmental Health Sciences, Research Triangle Park, North Carolina.
- [NTP] National Toxicology Program. (2009). Toxicology and carcinogenesis studies of bromochloroacetic acid (CAS No. 5589-96-8) in F344/N rats and B6C3F1 mice (drinking water studies). National Toxicology Program Technical Report Series, (549), 1-269. National Toxicology Program, National Institute of Environmental Health Sciences, Research Triangle Park, North Carolina.
- [NTP] National Toxicology Program. (2015). Toxicology studies of bromodichloroacetic acid in F344/N rats and B6C3F1/N mice and toxicology and carcinogenesis studies of bromodichloroacetic acid in F344/NTac rats and B6C3F1/N mice (drinking water studies). National Toxicology Program Technical Report Series, (583). pii: NTP-TR-583. National Toxicology Program, National Institute of Environmental Health Sciences, Research Triangle Park, North Carolina. Available at: https://doi.org/10.22427/ntp-tr-583
- [NTP] National Toxicology Program. (2018). Report on carcinogens monograph on haloacetic acids found as water disinfection by-products: RoC monograph 12. National Toxicology Program. Public Health Service. U.S. Department of Health and Human Services, Research Triangle Park, North Carolina. Available at: https://ntp.niehs.nih.gov/ntp/roc/monographs/haafinal_508.pdf
- [NTP] National Toxicology Program. (2021). 15th Report on Carcinogens. National Toxicology Program, National Institute of Environmental Health Sciences, Research Triangle Park, North Carolina. Available at: https://ntp.niehs.nih.gov/whatwestudy/assessments/cancer/roc
- Nunavut Department of Health. (2019). Occurrence of HAAs in distribution system. Personal communication with M. LeBlanc, Health Specialist.
- [OEHHA] Office of Environmental Health Hazard Assessment. (2022). Haloacetic acids in drinking water: Monochloroacetic acid, dichloroacetic acid, trichloroacetic acid, monobromoacetic acid, dibromoacetic acid. Office of Environmental Health Hazard Assessment. California Environmental Protection Agency, Pesticide and Environmental Toxicology Branch, Sacramento, California.
- O'Neil, M. J. (2006). The Merck Index: An encyclopedia of chemicals, drugs, and biologicals. Merck and Co., Inc.
- Ontario Ministry of the Environment, Conservation and Parks. (2019). Occurrence and concentration of HAAs in surface water and groundwater. Personal communication with S. Deshpande, Water Standards Section.
- Ontario Ministry of the Environment, Conservation and Parks. (2020). Personal communication with M. Robson, Toronto, ON.
- Ontario Ministry of the Environment, Conservation and Parks. (2023). Strategies for minimizing the disinfection By-products trihalomethanes and haloacetic acids. Available at: https://www.ontario.ca/page/strategies-minimizing-disinfection-products-trihalomethanes-and-haloacetic-acids
- Pagano, T., Bida, M., and Kenny, J. (2014). Trends in levels of allochthonous dissolved organic carbon in natural water: A review of potential mechanisms under a changing climate. Water, 6(10), 2862–2897. https://doi.org/10.3390/w6102862
- Pals, J. A., Ang, J. K., Wagner, E. D., and Plewa, M. J. (2011). Biological mechanism for the toxicity of haloacetic acid drinking water disinfection byproducts. Environ. Sci. Technol., 45(13), 5791–5797. https://doi.org/10.1021/es2008159
- Pals, J., Attene-Ramos, M. S., Xia, M., Wagner, E. D., and Plewa, M. J. (2013). Human cell toxicogenomic analysis linking reactive oxygen species to the toxicity of monohaloacetic acid drinking water disinfection byproducts. Environ. Sci. Technol., 47(21), 12514–12523. https://doi.org/10.1021/es403171b
- Pals, J. A., Wagner, E. D., and Plewa, M. J. (2016). Energy of the lowest unoccupied molecular orbital, thiol reactivity, and toxicity of three monobrominated water disinfection byproducts. Environ. Sci. Technol., 50(6), 3215–3221. https://doi.org/10.1021/acs.est.5b05581
- Parrish, J. M., Austin, E. W., Stevens, D. K., Kinder, D. H., and Bull, R. J. (1996). Haloacetate-induced oxidative damage to DNA in the liver of male B6C3F1 mice. Toxicology, 110(1-3), 103–111. https://doi.org/10.1016/0300-483x(96)03342-2
- Parvez, S., Ashby, J. L., Kimura, S. Y., and Richardson, S. D. (2019). Exposure characterization of haloacetic acids in humans for exposure and risk assessment applications: An exploratory study. Int. J. Environ. Res. Public Health, 16(3), 471. https://doi.org/10.3390/ijerph16030471
- Paykoc, Z. V., and Powell, J. F. (1945). The excretion of sodium trichloracetate. J. Pharmacol. Exp. Ther., 85, 289–293.
- Pearce, R. G., Setzer, R. W., Strope, C. L., Wambaugh, J. F., and Sipes, N. S. (2017). R Package for High-Throughput Toxicokinetics. Journal of Statistical Software, 79(4), 1–26. https://doi.org/10.18637/jss.v079.i04
- Pereira, M. A. (1996). Carcinogenic activity of dichloroacetic acid and trichloroacetic acid in the liver of female B6C3F1 mice. Fundam. Appl. Toxicol., 31(2), 192–199. https://doi.org/10.1006/faat.1996.0091
- Pereira, M. A., Kramer, P. M., Conran, P. B., and Tao, L. (2001). Effect of chloroform on dichloroacetic acid and trichloroacetic acid-induced hypomethylation and expression of the c-myc gene and on their promotion of liver and kidney tumors in mice. Carcinogenesis, 22(9), 1511–1519. https://doi.org/10.1093/carcin/22.9.1511
- Pereira, M. A., Li, K., and Kramer, P. M. (1997). Promotion by mixtures of dichloroacetic acid and trichloroacetic acid of N-methyl-N-nitrosourea-initiated cancer in the liver of female B6C3F1 mice. Cancer Lett., 115(1), 15–23. https://doi.org/10.1016/s0304-3835(97)04699-5
- Pereira, M. A., and Phelps, J. B. (1996). Promotion by dichloroacetic acid and trichloroacetic acid of N-methyl-N-nitrosourea-initiated cancer in the liver of female B6C3F1 mice. Cancer Lett., 102(1), 133–141.
- Perez-Albaladejo, E., Pinteno, R., Aznar-Luque, M. D. C., Casado, M., Postigo, C., and Porte, C. (2023). Genotoxicity and endocrine disruption potential of haloacetic acids in human placental and lung cells. Sci. Total Environ., 879, 162981. https://doi.org/10.1016/j.scitotenv.2023.162981
- Pernitsky, D. J. (2003). Coagulation 101. Proceedings of the Technology Transfer Conference. University of Calgary.
- Peterson, E. S., Raseman, W. J., Stanford, B. D., Bruce, G. M., Klintworth, H., and Reckhow, D. (2023). Evaluating regulatory scenarios to limit U.S. nationwide exposure to cytotoxic haloacetic acids. AWWA Water Sci., e1351. https://doi.org/10.1002/aws2.1351
- Pivokonsky, M., Naceradska, J., Kopecka, I., Baresova, M., Jefferson, B., Li, X., and Henderson, R. K. (2015). The impact of algogenic organic matter on water treatment plant operation and water quality: A review. Crit. Rev. Env. Sci. Tec., 46(4), 1–45. https://doi.org/10.1080/10643389.2015.1087369
- Plewa, M. J., Kargalioglu, Y., Vankerk, D., Minear, R. A., and Wagner, E. D. (2002). Mammalian cell cytotoxicity and genotoxicity analysis of drinking water disinfection by-products. Environ. Mol. Mutagen., 40(2), 134–142. https://doi.org/10.1002/em.10092
- Plewa, M. J., Simmons, J. E., Richardson, S. D., and Wagner, E. D. (2010). Mammalian cell cytotoxicity and genotoxicity of the haloacetic acids, a major class of drinking water disinfection by-products. Environ. Mol. Mutagen., 51(8-9), 871–878. https://doi.org/10.1002/em.20585
- Plewa, M. J., Wagner, E. D., Richardson, S. D., Thruston, A. D., Woo, Y., and McKague, A. B. (2004). Chemical and biological characterization of newly discovered iodoacid drinking water disinfection byproducts. Environ. Sci. Technol., 38(18), 4713–4722. https://doi.org/10.1021/es049971v
- Plourde-Lescelleur, F., Papineau, I., Carriere, A., Gadbois, A., and Barbeau, B. (2015). NOM removal: Evaluating five process alternatives to alum coagulation. Aqua (London), 64(3), 278–289. https://doi.org/10.2166/aqua.2014.090
- Plummer, J. D., and Edzwald, J. K. (2001). Effect of ozone on algae as precursors for trihalomethane and haloacetic acid production. Environ. Sci. Technol., 35(18), 3661–3668. https://doi.org/10.1021/es0106570
- Porter, C. K., Putnam, S. D., Hunting, K. L., and Riddle, M. R. (2005). The effect of trihalomethane and haloacetic acid exposure on fetal growth in a Maryland county. Am. J. Epidemiol., 162(4), 334–344. https://doi.org/10.1093/aje/kwi211
- Postigo, C., Richardson, S. D., and Barceló, D. (2017). Formation of iodo-trihalomethanes, iodo-haloacetic acids, and haloacetaldehydes during chlorination and chloramination of iodine containing waters in laboratory controlled reactions. J. Environ. Sci., 58(8), 127–134. https://doi.org/10.1016/j.jes.2017.04.009
- Pourmoghaddas, H., Stevens, A. A., Kinman, R. N., Dressman, R. C., Moore, L. A., and Ireland, J. C. (1993). Effect of bromide ion on formation of HAAs during chlorination. J. Am. Water Works Assoc., 85(1), 82–87. https://doi.org/10.1002/j.1551-8833.1993.tb05924.x
- Prince Edward Island Department of Communities Land and Environment. (2019). Occurrence of HAAs in distribution system. Personal communication with G. Somers, Drinking water and wastewater management division.
- Rajca, M., Włodyka-Bergier, A., Bodzek, M., and Bergier, T. (2017). MIEX®DOC process to remove disinfection by-product precursors. Desalin. Water Treat., 64, 372–377. https://doi.org/10.5004/dwt.2017.11397
- Randall, J. L., Christ, S. A., Horton Perez, P., Nolen, G. A., Read, E. J., and Smith, M. K. (1991a). Developmental effects of 2-bromoacetic acid in the Long-Evans rat. Teratology, 43: P122, 454.
- Randall, J. L., Christ, S. A., Nolen, G. A., Read, E. J., and Smith, M. K. (1991b). Developmental effects of dichloroacetic acid in Long-Evans rats II. Establishment of no adverse effect level. Teratology, 43: P123, 454.
- Reckhow, D., Hua, G., Kim, J., Hatcher, P., Caccamise, S., and Sachdeva, R. (2007). Characterization of total organic halogen produced during disinfection processes. Water Research Foundation, Denver, Colorado.
- Reckhow, D. A., Linden, K. G., Kim, J., Shemer, H., and Makdissy, G. (2010). Effect of UV treatment on DBP formation. J. Am. Water Works Assoc., 102(6), 100-113. – https://doi.org/10.1002/j.1551-8833.2010.tb10134.x
- Reckhow, D. A., and Singer, P. C. (2011). Chapter 19: Formation and control of disinfection by-products. In J. K. Edzwald (Ed.), Water quality and treatment: A handbook of community water supplies (6th ed.,). American Water Works Association, American Society of Civil Engineers and McGraw-Hill.
- Richardson, S. D., Fasano, F., Ellington, J. J., Crumley, F. G., Buettner, K. M., Evans, J. J., Blount, B. C., Silva, L. K., Waite, T. J., Luther, G. W., Mckague, A. B., Miltner, R. J., Wagner, E. D., and Plewa, M. J. (2008). Occurrence and mammalian cell toxicity of iodinated disinfection byproducts in drinking water. Environ. Sci. Technol., 42(22), 8330–8338. https://doi.org/10.1021/es801169k
- Richardson, S. D., Plewa, M. J., Wagner, E. D., Schoeny, R., and Demarini, D. M. (2007). Occurrence, genotoxicity, and carcinogenicity of regulated and emerging disinfection by-products in drinking water: A review and roadmap for research. Mutat. Res., 636(1-3), 178–242. https://doi.org/10.1016/j.mrrev.2007.09.001
- Richmond, R. E., Carter, J. H., Carter, H. W., Daniel, F. B., and DeAngelo, A. B. (1995). Immunohistochemical analysis of dichloroacetic acid (DCA)-induced hepatocarcinogenesis in male Fischer (F344) rats. Cancer Lett., 92(1), 67–76. https://doi.org/10.1016/0304-3835(94)03756-9
- Richmond, R. E., DeAngelo, A. B., Potter, C. L., and Daniel, F. B. (1991). The role of hyperplastic nodules in dichloroacetic acid-induced hepatocarcinogenesis in B6C3F1 male mice. Carcinogenesis, 12(8), 1383–1387. https://doi.org/10.1093/carcin/12.8.1383
- Ritson, J. P., Graham, N. J. D., Templeton, M. R., Clark, J. M., Gough, R., and Freeman, C. (2014). The impact of climate change on the treatability of dissolved organic matter (DOM) in upland water supplies: A UK perspective. Sci. Total Environ. , 473-474, 714–730. https://doi.org/10.1016/j.scitotenv.2013.12.095
- Rivera-Núñez, Z., and Wright, J. M. (2013). Association of brominated trihalomethane and haloacetic acid exposure with fetal growth and preterm delivery in Massachusetts. J. Occup. Environ. Med., 55(10), 1125–1134. https://doi.org/10.1097/JOM.0b013e3182a4ffe4
- Rivera-Núñez, Z., Wright, J. M., and Meyer, A. (2018). Exposure to disinfectant by-products and the risk of stillbirth in Massachusetts. Occup. Environ. Med., 75(10), 742–751. https://doi.org/10.1136/oemed-2017-104861
- Roccaro, P., and Vagliasindi, F. G. A. (2009). Differential vs. absolute UV absorbance approaches in studying NOM reactivity in DBPs formation: Comparison and applicability. Water Res., 43(3), 744–750. https://doi.org/10.1016/j.watres.2008.11.007
- Rodriguez, M. J., and Sérodes, N. B. (2001). Spatial and temporal evolution of trihalomethanes in three water distribution systems. Water Res., 35(6), 1572–1586. https://doi.org/10.1016/s0043-1354(00)00403-6
- Rodriguez, M. J., Sérodes, J., and Levallois, P. (2004). Behavior of trihalomethanes and haloacetic acids in a drinking water distribution system. Water Res., 38(20), 4367–4382. https://doi.org/10.1016/j.watres.2004.08.018
- RPC. (2020). Personal communication with B. Phillips, Fredericton, NB.
- Rubel, F. J. (2003). Design manual: Removal of arsenic from drinking water by ion exchange. Cincinnati, OH: United States Environmental Protection Agency.
- Ruecker, A., Uzun, H., Karanfil, T., Tsui, M. T. K., and Chow, A. T. (2017). Disinfection byproduct precursor dynamics and water treatability during an extreme flooding event in a coastal blackwater river in southeastern United States. Chemosphere, 188, 90–98. https://doi.org/10.1016/j.chemosphere.2017.08.122
- Saghir, S. A., Fried, K., and Rozman, K. K. (2001). Kinetics of monochloroacetic acid in adult male rats after intravenous injection of a subtoxic and a toxic dose. J. Pharmacol. Exp. Ther., 296(2), 612–622.
- Saghir, S. A., Ghanayem, B. I., and Schultz, I. R. (2011). Kinetics of trihalogenated acetic acid metabolism and isoform specificity in liver microsomes. Int. J. Toxicol., 30(5), 551–561. https://doi.org/10.1177/1091581811414213
- Saghir, S. A., and Rozman, K. K. (2003). Kinetics of monochloroacetic acid at subtoxic and toxic doses in rats after single oral and dermal administrations. Toxicol. Sci., 76(1), 51–64. https://doi.org/10.1093/toxsci/kfg214
- Saghir, S. A., and Schultz, I. R. (2002). Low-dose pharmacokinetics and oral bioavailability of dichloroacetate in naive and GST-zeta-depleted rats. Environ. Health Perspect., 110(8), 757–763. https://doi.org/10.1289/ehp.02110757
- Saghir, S. A., and Schultz, I. R. (2005). Toxicokinetics and oral bioavailability of halogenated acetic acids mixtures in naive and GSTzeta-depleted rats. Toxicol. Sci., 84(2), 214–224. https://doi.org/10.1093/toxsci/kfi070
- Saillenfait, A. M., Langonne, I., and Sabate, J. P. (1995). Developmental toxicity of trichloroethylene, tetrachloroethylene and four of their metabolites in rat whole embryo culture. Arch. Toxicol., 70(2), 71–82. https://doi.org/10.1007/BF02733666
- Sanchez, I. M., and Bull, R. J. (1990). Early induction of reparative hyperplasia in the liver of B6C3F1 mice treated with dichloroacetate and trichloroacetate. Toxicology, 64(1), 33–46. https://doi.org/10.1016/0300-483x(90)90097-z
- Sarathy, S. R., Stefan, M. I., Royce, A., and Mohseni, M. (2011). Pilot-scale UV/H2O2 advanced oxidation process for surface water treatment and downstream biological treatment: Effects on natural organic matter characteristics and DBP formation potential. Environ. Technol., 32(15), 1709–1718. https://doi.org/10.1080/09593330.2011.553843
- Saskatchewan Water Security Agency. (2019). Personal communication with S. Ferris, Regulatory Division.
- Saskatchewan Water Security Agency. (2024). Personal communication with S. Ferris, Regulatory Division.
- Savitz, D. A. (2012). Invited commentary: Biomarkers of exposure to drinking water disinfection by-products–are we ready yet? Am. J. Epidemiol., 175(4), 276–278. https://doi.org/10.1093/aje/kwr420
- Savitz, D. A., Singer, P. C., Herring, A. H., Hartmann, K. E., Weinberg, H. S., and Makarushka, C. (2006). Exposure to drinking water disinfection by-products and pregnancy loss. Am. J. Epidemiol., 164(11), 1043–1051. https://doi.org/10.1093/aje/kwj300
- [SCC] Standards Council of Canada. (2025). Directory of accredited product, process and service certification bodies. Standards Council of Canada.
- Scheili, A., Rodriguez, M. J., and Sadiq, R. (2015). Seasonal and spatial variations of source and drinking water quality in small municipal systems of two Canadian regions. Sci. Total Environ., 508, 514–524. https://doi.org/10.1016/j.scitotenv.2014.11.069
- Schock, M., and Lytle, D. (2011). Chapter 20: Internal corrosion and deposition control. In J. K. Edzwald (Ed.), Water quality and treatment: A handbook on drinking water (6th ed.,). McGraw Hill and American Water Works Association.
- Schroeder, M., DeAngelo, A. B., and Mass, M. J. (1997). Dichloroacetic acid reduces Ha-ras codon 61 mutations in liver tumors from female B6C3F1 mice. Carcinogenesis, 18(8), 1675–1678.
- Schultz, I. R., Merdink, J. L., Gonzalez-Leon, A., and Bull, R. J. (1999). Comparative toxicokinetics of chlorinated and brominated haloacetates in F344 rats. Toxicol. Appl. Pharmacol., 158(2), 103–114. https://doi.org/10.1006/taap.1999.8698
- Schultz, I. R., Merdink, J. L., Gonzalez-Leon, A., and Bull, R. J. (2002). Dichloroacetate toxicokinetics and disruption of tyrosine catabolism in B6C3F1 mice: Dose–response relationships and age as a modifying factor. Toxicology, 173(3), 229–247.
- Schultz, I. R., and Shangraw, R. E. (2006). Effect of short-term drinking water exposure to dichloroacetate on its pharmacokinetics and oral bioavailability in human volunteers: A stable isotope study. Toxicol. Sci., 92(1), 42–50. https://doi.org/10.1093/toxsci/kfj193
- Schultz, I. R., and Sylvester, S. R. (2001). Stereospecific toxicokinetics of bromochloro- and chlorofluoroacetate: Effect of GST-zeta depletion. Toxicol. Appl. Pharmacol., 175(2), 104–113. https://doi.org/10.1006/taap.2001.9250
- Seidel, C., Ghosh, A., Tang, G., Rosario-Ortiz, F., Hohner, A. K., Summers, R. S., McKnight, D. M., and Rodgers, M. (2013). Effects of Lake Erie water quality changes on DBP formation. Water Research Foundation, Denver, Colorado.
- Selbes, M., Brown, J., Lauderdale, C., and Karanfil, T. (2017). Removal of selected C‐ and N‐DBP precursors in biologically active filters. J. Am. Water Works Assoc., 109(3), E73–E84. https://doi.org/10.5942/jawwa.2017.109.0014
- Sharma, N., Zeng, C., Eaton, A., Karanfil, T., Ghosh, A., and Westerhoff, P. (2023). Co-occurrence of bromine and iodine species in U.S. drinking water sources that can impact disinfection byproduct formation. Environ. Sci. Technol.. https://doi.org/10.1021/acs.est.2c06044
- Shroads, A. L., Guo, X., Dixit, V., Liu, H., James, M. O., and Stacpoole, P. W. (2008). Age-dependent kinetics and metabolism of dichloroacetate: possible relevance to toxicity. J. Pharmacol. Exp. Ther., 324(3), 1163–1171. https://doi.org/10.1124/jpet.107.134593
- Simard, S., Tardif, R., and Rodriguez, M. J. (2013). Variability of chlorination by-product occurrence in water of indoor and outdoor swimming pools. Water Res., 47(5), 1763–1772. https://doi.org/10.1016/j.watres.2012.12.024
- Singer, P. C., Arlotta, C., Snider-Sajdak, N., and Miltner, R. (2003). Effectiveness of pre- and intermediate ozonation on the enhanced coagulation of disinfection by-product precursors in drinking water. Ozone: Sci. Eng., 25(6), 453–471. https://doi.org/10.1080/01919510390481775
- Singer, P. C., and Bilyk, K. (2002). Enhanced coagulation using a magnetic ion exchange resin. Water Res., 36(16), 4009–4022. https://doi.org/10.1016/s0043-1354(02)00115-x
- Singer, P. C., Schneider, M., Edwards-Brandt, J., and Budd, G. C. (2007). MIEX for removal of DBP precursors: Pilot-plant findings. J. Am. Water Works Assoc., 99(4), 128–139. https://doi.org/10.1002/j.1551-8833.2007.tb07913.x
- Singh, R. (2005). Effect of maternal administration of trichloroacetic acid (TCA) on fetal ovary
rats. Biomedical Research, 16(6), 195–200. - Singh, R. (2006). Neuroembryopathic effect of trichloroacetic acid in rats exposed during organogenesis. Birth Defects Research. Part B, Developmental and Reprod. Toxicol., 77(1), 47–52. https://doi.org/10.1002/bdrb.20064
- Sketchell, J., Peterson, H. G., and Christofi, N. (1995). Disinfection by-product formation after biologically assisted GAC treatment of water supplies with different bromide and DOC content. Elsevier, Amsterdam, Netherlands. https://doi.org/10.1016/0043-1354(95)00130-d
- Smeets, P. W. M. H., Medema, G. J., and van Dijk, J. C. (2009). The Dutch secret: How to provide safe drinking water without chlorine in the Netherlands. Drinking Water Eng. Sci., 2(1), 1–14. https://doi.org/10.5194/dwes-2-1-2009
- Smith, M. K., Christ, S. A., Randall, J. L., Nolen, G. A., Read, E. J., and Stober, J. A. (1991). Interaction study of chlorinated acetic acids in pregnant Long-Evans rats. Teratology, 43: P121, 453–454.
- Smith, M. K., Randall, J. L., Read, E. J., and Stober, J. A. (1989). Teratogenic activity of trichloroacetic acid in the rat. Teratology, 40(5), 445–451. https://doi.org/10.1002/tera.1420400506
- Smith, M. K., Randall, J. L., Read, E. J., and Stober, J. A. (1992). Developmental toxicity of dichloroacetate in the rat. Teratology, 46(3), 217–223. https://doi.org/10.1002/tera.1420460305
- Smith, M. T., Guyton, K. Z., Kleinstreuer, N., Borrel, A., Cardenas, A., Chiu, W. A., Felsher, D. W., Gibbons, C. F., Goodson, W. H. 3., Houck, K. A., Kane, A. B., La Merrill, M. A., Lebrec, H., Lowe, L., McHale, C. M., Minocherhomji, S., Rieswijk, L., Sandy, M. S., Sone, H., Wang, A., Zhang, L., Zeise, L., and Fielden, M. (2020). The key characteristics of carcinogens: relationship to the hallmarks of cancer, relevant biomarkers, and assays to measure them. Cancer Epidemiol Biomarkers Prev., 29(10), 1887–1903. https://doi.org/10.1158/1055-9965.EPI-19-1346
- Smith, R. B., Edwards, S. C., Best, N., Wright, J., Nieuwenhuijsen, M. J., and Toledano, M. B. (2016). Birth weight, ethnicity, and exposure to trihalomethanes and haloacetic acids in drinking water during pregnancy in the born in Bradford cohort. Environ. Health Perspect., 124(5), 681–689. https://doi.org/10.1289/ehp.1409480
- Smyth, H. F., Carpenter, C. P., and Weil, C. S. (1951). Range-finding toxicity data: List IV. AMA Arch. Ind Hyg. Occup. Med., 4(2), 119–122.
- Snyder, R. D., Pullman, J., Carter, J. H., Carter, H. W., and DeAngelo, A. B. (1995). In vivo administration of dichloroacetic acid suppresses spontaneous apoptosis in murine hepatocytes. Cancer Res., 55(17), 3702–3705.
- So, S. H., Choi, I. H., Kim, H. C., and Maeng, S. K. (2017). Seasonally related effects on natural organic matter characteristics from source to tap in Korea. Sci. Total Environ., 592, 584–592. https://doi.org/10.1016/j.scitotenv.2017.03.063
- Soyluoglu, M., Ersan, M. S., Ateia, M., and Karanfil, T. (2020). Removal of bromide from natural waters: Bromide-selective vs. conventional ion exchange resins. Chemosphere, 238, 124583. https://doi.org/10.1016/j.chemosphere.2019.124583
- Speight, V. L., and Singer, P. C. (2005). Association between residual chlorine loss and HAA reduction in distribution systems. J. Am. Water Works Assoc., 97(2), 82–91. https://doi.org/10.1002/j.1551-8833.2005.tb10827.x
- Speitel, G. E., Symons, J. M., Diehl, A. C., Sorensen, H. W., and Cipparone, L. A. (1993). Effect of ozone dosage and subsequent biodegradation on removal of DBP precursors. J. Am. Water Works Assoc., 85(5), 86–95. https://doi.org/10.1002/j.1551-8833.1993.tb05989.x
- Saskatchewan Research Council. Environmental Analytical Laboratories (2020). Personal communication with J. Zimmer, Saskatoon, SK
- Srivastav, A. L., Patel, N., and Chaudhary, V. K. (2020). Disinfection by-products in drinking water: Occurrence, toxicity and abatement. Environ. Pollut., 267, 115474. https://doi.org/10.1016/j.envpol.2020.115474
- Stacpoole, P. W. (2011). The dichloroacetate dilemma: environmental hazard versus therapeutic goldmine—both or neither? Environ. Health Perspect., 119(2), 155–158. https://doi.org/10.1289/ehp.1002554
- Stacpoole, P. W., Kurtz, T. L., Han, Z., and Langaee, T. (2008). Role of dichloroacetate in the treatment of genetic mitochondrial diseases. Adv. Drug Delivery Rev., 60(13-14), 1478–1487. https://doi.org/10.1016/j.addr.2008.02.014
- Stalter, D., O'Malley, E., von Gunten, U., and Escher, B. I. (2016). Fingerprinting the reactive toxicity pathways of 50 drinking water disinfection by-products. Water Res., 91, 19–30. https://doi.org/10.1016/j.watres.2015.12.047
- Stauber, A. J., and Bull, R. J. (1997). Differences in phenotype and cell replicative behavior of hepatic tumors induced by dichloroacetate (DCA) and trichloroacetate (TCA). Toxicol. Appl. Pharmacol., 144(2), 235–246.
- Stauber, A. J., Bull, R. J., and Thrall, B. D. (1998). Dichloroacetate and trichloroacetate promote clonal expansion of anchorage-independent hepatocytes in vivo and in vitro. Toxicol. Appl. Pharmacol., 150(2), 287–294.
- Steinberg, S. M., Kimble, G. M., Schmett, G. T., Emerson, D. W., Turner, M. F., and Rudin, M. (2008). Abiotic reaction of iodate with sphagnum peat and other natural organic matter. J. Radioanal. Nucl. Chem., 277(1), 185–191. https://doi.org/10.1007/s10967-008-0728-1
- Styles, J. A., Wyatt, I., and Coutts, C. (1991). Trichloroacetic acid: studies on uptake and effects on hepatic DNA and liver growth in mouse. Carcinogenesis, 12(9), 1715–1719. https://doi.org/10.1093/carcin/12.9.1715
- Summerhayes, R. J., Rahman, B., Morgan, G. G., Beresin, G., Moreno, C., and Wright, J. M. (2021). Meta-analysis of small for gestational age births and disinfection byproduct exposures. Environ. Res., 196, 110280. https://doi.org/10.1016/j.envres.2020.110280
- Summers, R. S., Hooper, S. M., Shukairy, H. M., Solarik, G., and Owen, D. (1996). Assessing DBP yield: Uniform formation conditions. J. Am. Water Works Assoc., 88(6), 80–93.
- Sun, Y., Wang, Y., Liu, C., Chen, Y., Lu, W., and Messerlian, C. (2020). Trimester-specific blood trihalomethane and urinary haloacetic acid concentrations and adverse birth outcomes: Identifying windows of vulnerability during pregnancy. Environ. Health Perspect., 128(10), 107001. https://doi.org/10.1289/EHP7195
- Świetlik, J., Dąbrowska, A., Raczyk-Stanisławiak, U., and Nawrocki, J. (2004). Reactivity of natural organic matter fractions with chlorine dioxide and ozone. Water Res., 38(3), 547–558. https://doi.org/10.1016/j.watres.2003.10.034
- Symons, J., Stevens, A., Clark, R., Geldreich, E. E., Love, O., and DeMarco, J. (1981). Treatment techniques for controlling trihalomethanes in drinking water. U.S. EPA Drinking Water Research Division, Municipal Environmental Research Laboratory, Office of Research and Development. Cincinnati, Ohio.
- Tao, L., Kramer, P. M., Ge, R., and Pereira, M. A. (1998). Effect of dichloroacetic acid and trichloroacetic acid on DNA methylation in liver and tumors of female B6C3F1 mice. Toxicol. Sci., 43(2), 139–144.
- Tao, L., Li, Y., Kramer, P. M., Wang, W., and Pereira, M. A. (2004a). Hypomethylation of DNA and the insulin-like growth factor-II gene in dichloroacetic and trichloroacetic acid-promoted mouse liver tumors. Toxicology, 196(1), 127–136.
- Tao, L., Wang, W., Li, L., Kramer, P. M., and Pereira, M. A. (2004b). Effect of dibromoacetic acid on DNA methylation, glycogen accumulation, and peroxisome proliferation in mouse and rat liver. Toxicol. Sci., 82(1), 62–69. https://doi.org/10.1093/toxsci/kfh266
- Tao, L., Wang, W., Li, L., Kramer, P. K., and Pereira, M. A. (2005). DNA hypomethylation induced by drinking water disinfection by-products in mouse and rat kidney. Toxicol. Sci., 87(2), 344–352. https://doi.org/10.1093/toxsci/kfi257
- Tao, L., Yang, S., Xie, M., Kramer, P. M., and Pereira, M. A. (2000a). Effect of trichloroethylene and its metabolites, dichloroacetic acid and trichloroacetic acid, on the methylation and expression of c-Jun and c-Myc protooncogenes in mouse liver: prevention by methionine. Toxicol. Sci., 54(2), 399–407.
- Tao, L., Yang, S., Xie, M., Kramer, P. M., and Pereira, M. A. (2000b). Hypomethylation and overexpression of c-jun and c-myc protooncogenes and increased DNA methyltransferase activity in dichloroacetic and trichloroacetic acid-promoted mouse liver tumors. Cancer Lett., 158(2), 185–193. https://doi.org/10.1016/s0304-3835(00)00518-8
- Templin, M. V., Parker, J. C., and Bull, R. J. (1993). Relative formation of dichloroacetate and trichloroacetate from trichloroethylene in male B6C3F1 mice. Toxicol. Appl. Pharmacol., 123(1), 1–8. https://doi.org/10.1006/taap.1993.1214
- Templin, M. V., Stevens, D. K., Stenner, R. D., Bonate, P. L., Tuman, D., and Bull, R. J. (1995). Factors affecting species differences in the kinetics of metabolites of trichloroethylene. J. Toxicol. Environ. Health, 44(4), 435–447. https://doi.org/10.1080/15287399509531972
- Tennant, D. A., Duran, R. V., and Gottlieb, E. (2010). Targeting metabolic transformation for cancer therapy. Nat. Rev. Cancer, 10(4), 267–277. https://doi.org/10.1038/nrc2817
- Thomassen, P. R., and Leicester, H. M. (1951). A tracer study of distribution of iodoacetate in rat tissue. Proceedings of the society for experimental biology and medicine. Exp. Biol. Med., 77(4), 622–624. https://doi.org/10.3181/00379727-77-18868
- Tian, Y., Guo, H., Wang, Y., Liu, Y., and Shan, J. (2017). Behaviour of haloacetic acids in drinking water distribution systems. Trans. Tianjin Univ., 23(1), 93–99. https://doi.org/10.1007/s12209-016-0026-x
- Tokarz, D. A., Gruebbel, M. M., Willson, G. A., Hardisty, J. F., Pearse, G., and Cesta, M. F. (2022). Spontaneous primary pleural mesothelioma in fischer 344 (F344) and other rat strains: A retrospective review. Toxicol. Pathol., 50(2), 167–175. https://doi.org/10.1177/01926233211053631
- Tomperi, J., Juuso, E., and Leiviskä, K. (2016). Early warning of changing drinking water quality by trend analysis. J. Water Health, 14(3), 433–442. https://doi.org/10.2166/wh.2016.330
- Tong, Z., Board, P. G., and Anders, M. W. (1998a). Glutathione transferase zeta catalyses the oxygenation of the carcinogen dichloroacetic acid to glyoxylic acid. Biochem. J., 331 (Pt 2)(Pt 2), 371–374. https://doi.org/10.1042/bj3310371
- Tong, Z., Board, P. G., and Anders, M. W. (1998b). Glutathione transferase zeta-catalyzed biotransformation of dichloroacetic acid and other alpha-haloacids. Chem. Res. Toxicol., 11(11), 1332–1338. https://doi.org/10.1021/tx980144f
- Toor, R., and Mohseni, M. (2007). UV-H2O2 based AOP and its integration with biological activated carbon treatment for DBP reduction in drinking water. Chemosphere, 66(11), 2087–2095. https://doi.org/10.1016/j.chemosphere.2006.09.043
- Toth, G. P., Kelty, K. C., George, E. L., Read, E. J., and Smith, M. K. (1992). Adverse male reproductive effects following subchronic exposure of rats to sodium dichloroacetate. Fundam. Appl. Toxicol., 19(1), 57–63. https://doi.org/10.1016/0272-0590(92)90028-g
- Traina, V., Katz, R., Diener, R., and Thompson S. (1977). CGS 7937A (Sodium dichloroacetate): Acute and subacute toxicity studies in mice, rats, and dogs. Toxicology/Pathology Report No. 7-77, CIBA-GEIGY Pharmaceuticals Division, Summit, New Jersey.
- Tran, Q., Lee, H., Park, J., Kim, S., and Park, J. (2016). Targeting cancer metabolism - Revisiting the Warburg effects. Toxicol. Res., 32(3), 177–193. https://doi.org/10.5487/TR.2016.32.3.177
- Tsuchiya, T., Ooyama, N., Murakami, T., Sano, F., Sugimoto, J., and Mutai, M. (2000). Collaborative work to evaluate toxicity on male reproductive organs by repeated dose studies in rats 25). Effects of 2- and 4- week repeated- dosing of dibromoacetic acid. J. Toxicol. Sci., 25 Spec No, 241–249. https://doi.org/10.2131/jts.25.specialissue_241
- Tubić, A., Agbaba, J., Dalmacija, B., Molnar, J., Maletić, S., Watson, M., and Perović, S. U. (2013). Insight into changes during coagulation in NOM reactivity for trihalomethanes and haloacetic acids formation. J. Environ. Manage., 118, 153–160. https://doi.org/10.1016/j.jenvman.2012.11.046
- Tugulea, A., Aranda-Rodriguez, R., Bérubé, D., Giddings, M., Lemieux, F., Hnatiw, J., Dabeka, L., and Breton, F. (2018). The influence of precursors and treatment process on the formation of Iodo-THMs in Canadian drinking water. Water Res., 130, 215–223. https://doi.org/10.1016/j.watres.2017.11.055
- Tully, D. B., Luft, J. C., Rockett, J. C., Ren, H., Schmid, J. E., Wood, C. R., and Dix, D. J. (2005). Reproductive and genomic effects in testes from mice exposed to the water disinfectant byproduct bromochloroacetic acid. Reprod. Toxicol., 19(3), 353–366. https://doi.org/10.1016/j.reprotox.2004.06.009
- Tung, H., and Xie, Y. F. (2009). Association between haloacetic acid degradation and heterotrophic bacteria in water distribution systems. Water Res., 43(4), 971–978. https://doi.org/10.1016/j.watres.2008.11.041
- Tzeng, H. F., Blackburn, A. C., Board, P. G., and Anders, M. W. (2000). Polymorphism- and species-dependent inactivation of glutathione transferase zeta by dichloroacetate. Chem. Res. Toxicol., 13(4), 231–236. https://doi.org/10.1021/tx990175q
- Urbansky, E. T. (2000). Techniques and methods for the determination of haloacetic acids in potable water. J. Environ. Monit., 2(4), 285–291. https://doi.org/10.1039/b002977g
- [U.S. EPA] United States Environmental Protection Agency. (1991). Toxicology of the chloroacetic acids, byproducts of the drinking water disinfection process. II. The comparative carcinogenicity of dichloroacetic acid and trichloroacetic acid: implication for risk assessment. Document No. HERL-0820. Deliverable No. 3101. Health Effects Research Laboratory, U.S. Environmental Protection Agency, Research Triangle Park, North Carolina.
- [U.S. EPA] United States Environmental Protection Agency. (1992). Method 552.1 revision 1.0. Determination of haloacetic acids and dalapon in drinking water by ion-exchange liquid-solid extraction and gas chromatography with an electron capture detector. Environmental Monitoring Systems Laboratory, Office of Research and Development, U.S. Environmental Protection Agency, Cincinnati, Ohio.
- [U.S. EPA] United States Environmental Protection Agency. (1995). Method 552.2 revision 1.0. Determination of haloacetic acids and dalapon in drinking water by liquid-liquid extraction, derivatization and gas chromatography with electron capture detection. National Exposure Research Laboratory, Office of Research and Development, U.S. Environmental Protection Agency, Cincinnati, Ohio.
- [U.S. EPA] United States Environmental Protection Agency. (1998). Final report: Assessment of human dietary ingestion exposures to water disinfection byproducts via food. U.S. Environmental Protection Agency, Washington, DC.
- [U.S. EPA] United States Environmental Protection Agency. (2003a). Toxicological review of dichloroacetic acid. In support of summary information on the integrated risk information system (IRIS). EPA 635/R-03/007. U.S. Environmental Protection Agency, Cincinnati, Ohio.
- [U.S. EPA] United States Environmental Protection Agency. (2003b). Method 552.3 revision 1.0. Determination of haloacetic acids and dalapon in drinking water by liquid-liquid microextraction, derivatization, and gas chromatography with electron capture detection. National Exposure Research Laboratory, Office of Research and Development, U.S. Environmental Protection Agency, Cincinnati, Ohio.
- [U.S. EPA] United States Environmental Protection Agency. (2003c). The Feasibility of Performing Cumulative Risk Assessments for Mixtures of Disinfection By-Products in Drinking Water. EPA/600/R-03/051. U.S. Environmental Protection Agency, Cincinnati, Ohio.
- [U.S. EPA] United States Environmental Protection Agency. (2005). Drinking water criteria document brominated acetic acids. EPA-822-R-05-007.Office of Science and Technology, Office of Water, U.S. Environmental Protection Agency, Washington, DC.
- [U.S. EPA] United States Environmental Protection Agency (2006). National primary drinking water regulations: Stage 2 disinfectants and disinfection byproducts rule; Final Rule. Code of Federal Register (CFR) 40 CFR Parts 9, 141, and 142. Fed Reg 71(2): 388–493. U.S. Environmental Protection Agency, Washington, DC.
- [U.S. EPA] United States Environmental Protection Agency. (2009). Method 557. Determination of haloacetic acids, bromate, and dalapon in drinking water by ion chromatography/electrospray ionization tandem mass spectrometry (IC/ESI-MS/MS). Office of Ground Water and Drinking Water, U.S. Environmental Protection Agency, Cincinnati, Ohio.
- [U.S. EPA] United States Environmental Protection Agency. (2011). Toxicological review of trichloroacetic acid. EPA 635/R-09/003F. U.S. Environmental Protection Agency.
- [U.S. EPA] United States Environmental Protection Agency. (2012). Radionuclides in drinking water, compliance options: Treatment technology descriptions. U.S. Environmental Protection Agency.
- [U.S. EPA] United States Environmental Protection Agency. (2018). Drinking water standards and health advisories tables. EPA 822-F-18-001. Office of Water, U.S. Environmental Protection Agency, Washington, DC.
- [U.S. EPA] United States Environmental Protection Agency. (2022a). Comptox chemicals dashboard [Database]. U.S. Environmental Protection Agency, Washington, DC. Available at: https://comptox.epa.gov/dashboard
- [U.S. EPA] United States Environmental Protection Agency. (2022b). Estimation Program Interface (EPI) Suite [Database]. U.S. Environmental Protection Agency, Washington, DC.
- Uyak, V., and Toroz, I. (2007). Investigation of bromide ion effects on disinfection by-products formation and speciation in an Istanbul water supply. J. Hazard. Mater., 149(2), 445–451. https://doi.org/10.1016/j.jhazmat.2007.04.017
- Uzun, H., Dahlgren, R. A., Olivares, C., Erdem, C. U., Karanfil, T., and Chow, A. T. (2020). Two years of post-wildfire impacts on dissolved organic matter, nitrogen, and precursors of disinfection by-products in California stream waters. Water Res., 181, 115891. https://doi.org/10.1016/j.watres.2020.115891
- Vander Heiden, M. G., Cantley, L. C., and Thompson, C. B. (2009). Understanding the Warburg effect: the metabolic requirements of cell proliferation. Science, 324(5930), 1029–1033. https://doi.org/10.1126/science.1160809
- Van der Linden, L., Burch, M., Chang, C., Lin, T., Barandouzi, M. A., Moglen, G., Godrej, A., Little, J., and Brookes, J. (2018). Assessment of the impacts of climate change on reservoir water quality. Water Research Foundation, Denver, Colorado.
- Veeramachaneni, D., Higuchi, T. T., Palmer, J. S. and Kane C. M. (2000). Dibromoacetic acid, a disinfection by-product in drinking water, impairs sexual function and fertility in male rabbits (Abstract). Paper presented at the Annual Meeting for the Society for the Study of Reproduction.
- Veeramachaneni, D. N. R., Palmer, J. S., and Klinefelter, G. R. (2007). Chronic exposure to low levels of dibromoacetic acid, a water disinfection by-product, adversely affects reproductive function in male rabbits. J. Androl., 28(4), 565–577. https://doi.org/10.2164/jandrol.107.002550
- Verdugo, E. M., Gifford, M., Glover, C., Cuthbertson, A. A., Trenholm, R. A., Kimura, S. Y., Liberatore, H. K., Richardson, S. D., Stanford, B. D., Summers, R. S., and Dickenson, E. R. V. (2020). Controlling disinfection byproducts from treated wastewater using adsorption with granular activated carbon: Impact of pre-ozonation and pre-chlorination. Water Res. X, 9, 100068. https://doi.org/10.1016/j.wroa.2020.100068
- Von Gunten, U. (2003). Ozonation of drinking water: Part I. Oxidation kinetics and product formation. Water Res., 37(7), 1443–1467. https://doi.org/10.1016/s0043-1354(02)00457-8
- Walgren, J. L., Kurtz, D. T., and McMillan, J. M. (2005). Lack of direct mitogenic activity of dichloroacetate and trichloroacetate in cultured rat hepatocytes. Toxicology, 211(3), 220–230. https://doi.org/10.1016/j.tox.2005.03.009
- Wang, D., Bolton, J. R., Andrews, S. A., and Hofmann, R. (2015). Formation of disinfection by-products in the ultraviolet/chlorine advanced oxidation process. Sci. Total Environ., 518-519, 49–57. https://doi.org/10.1016/j.scitotenv.2015.02.094
- Wang, L., Chen, A. S. C., and Wang, A. (2010). Arsenic removal from drinking water by ion exchange. U.S. EPA demonstration project at Fruitland, ID. Final performance evaluation report. (EPA/600/R-10/152). United States Environmental Protection Agency.
- Wang, L., Sun, Y., and Chen, B. (2018). Rejection of haloacetic acids in water by multi-stage reverse osmosis: Efficiency, mechanisms, and influencing factors. Water Res., 144, 383–392. https://doi.org/10.1016/j.watres.2018.07.045
- Wang, Y. H., and Chen, K. C. (2014). Removal of Disinfection by-products from contaminated water using a synthetic goethite catalyst via catalytic ozonation and biofiltration system. Int. J. Environ. Res. Public Health 2014, 11, 9325–9344; https://doi.org/10.3390/ijerph110909325
- Wehmas, L. C., DeAngelo, A. B., Hester, S. D., Chorley, B. N., Carswell, G., Olson, G. R., George, M. H., Carter, J. H., Eldridge, S. R., Fisher, A., Vallanat, B., and Wood, C. E. (2017). Metabolic disruption early in life is associated with latent carcinogenic activity of dichloroacetic acid in mice. Toxicol. Sci., 159(2), 354–365. https://doi.org/10.1093/toxsci/kfx146
- Westerhoff, P., Sharma, N., Zeng, C., Karanfil, T., Kim, D., Ghosh, A., Seidel, C., Samson, C., and Eaton, A. (2022). Occurrence survey of bromide and iodide in water supplies. Water Research Foundation, Denver, Colorado.
- Wetmore, B. A. (2015). Quantitative in vitro-to-in vivo extrapolation in a high-throughput environment. Toxicology, 332, 94–101. https://doi.org/10.1016/j.tox.2014.05.012
- Weyer, P., Rhoads, A., Suhl, J., Luben, T. J., Conway, K. M., Langlois, P. H., Shen, D., Liang, D., Puzhankara, S., Anderka, M., Bell, E., Feldkamp, M. L., Hoyt, A. T., Mosley, B., Reefhuis, J., and Romitti, P. A. (2018). Drinking water disinfection byproducts and risk of orofacial clefts in the National Birth Defects Prevention Study. Birth Defects Res., 110(12), 1027–1042. https://doi.org/10.1002/bdr2.1348
- Whitehead, D. C. (1984). The distribution and transformations of iodine in the environment. Environ. Int., 10(4), 321–339. https://doi.org/10.1016/0160-4120(84)90139-9
- [WHO] World Health Organization. (2000). Disinfectants and disinfectant by-products. World Health Organization, Geneva, Switzerland. Available at: https://apps.who.int/iris/bitstream/handle/10665/42274/WHO_EHC_216.pdf
- [WHO] World Health Organization. (2004a). Monochloroacetic acid in drinking-water. Background document for development of WHO guidelines for drinking-water quality. World Health Organization, Geneva, Switzerland.
- [WHO] World Health Organization. (2004b). Trichloroacetic acid in drinking-water. Background document for development of WHO guidelines for drinking-water quality. World Health Organization, Geneva, Switzerland. Available at: https://cdn.who.int/media/docs/default-source/wash-documents/wash-chemicals/trichloroaceticacid.pdf?sfvrsn=796766f_4
- [WHO] World Health Organization (2005). Dichloroacetic acid in drinking-water, background document for development of WHO guidelines for drinking-water quality. WHO/SDE/WSH/05.08/121. World Health Organization, Geneva, Switzerland. Available at: https://cdn.who.int/media/docs/default-source/wash-documents/wash-chemicals/dichloroaceticacid0505.pdf?sfvrsn=2246389b_4
- [WHO] World Health Organization. (2012). Water safety planning for small community water supplies: Step-by-step risk management guidance for drinking-water supplies in small communities. World Health Organization, Geneva, Switzerland. Available at: https://iris.who.int/bitstream/handle/10665/75145/9789241548427_eng.pdf
- [WHO] World Health Organization. (2017a). Chemical mixtures in source water and drinking-water. World Health Organization. Geneva, Switzerland. Available at: https://iris.who.int/bitstream/handle/10665/255543/9789241512374-eng.pdf?sequence=1andisAllowed=y
- [WHO] World Health Organization. (2017b). Guidelines for drinking-water quality: Fourth edition incorporating first addendum. World Health Organization, Geneva, Switzerland. Available at: https://iris.who.int/bitstream/handle/10665/254637/9789241549950-eng.pdf?sequence=1andisAllowed=y
- Wood, C. E., Hester, S. D., Chorley, B. N., Carswell, G., George, M. H., Ward, W., Vallanat, B., Ren, H., Fisher, A., Lake, A. D., Okerberg, C. V., Gaillard, E. T., Moore, T. M., and Deangelo, A. B. (2015). Latent carcinogenicity of early-life exposure to dichloroacetic acid in mice. Carcinogenesis, 36(7), 782–791. https://doi.org/10.1093/carcin/bgv057
- Woodard, G., Lange, S. W., Nelson, K. W., and Calvery, H. O. (1941). The acute oral toxicity of acetic, chloracetic, dichloracetic, and trichloracetic acids. J. Ind. Hyg. Toxicol., 23(2), 78–82.
- Wright, J. L. (2022). Biological ion exchange for removal of natural organic matter from surface water in long-term operation. [Master’s Thesis, University of British Columbia.] https://open.library.ubc.ca/soa/cIRcle/collections/ubctheses/24/items/1.0412914
- Wright, J. M., Evans, A., Kaufman, J. A., Rivera-Núñez, Z., and Narotsky, M. G. (2017). Disinfection by-product exposures and the risk of specific cardiac birth defects. Environ. Health Perspect., 125(2), 269–277. https://doi.org/10.1289/EHP103
- Wright, J. M., Schwartz, J., and Dockery, D. W. (2004). The effect of disinfection by-products and mutagenic activity on birth weight and gestational duration. Environ. Health Perspect., 112(8), 920–925.
- Wu, H., and Xie, Y. F. (2005). Effects of EBCT and water temperature on HAA removal using BAC. J. Am. Water Works Assoc., 97(11), 94–101. https://doi.org/10.1002/j.1551-8833.2005.tb07522.x
- Wu, W. W., and Chadik, P. A. (1998). Effect of bromide ion on haloacetic acid formation during chlorination of Biscayne Aquifer water. J. Environ. Eng., 124(10), 932–938. https://doi.org/10.1061/(ASCE)0733-9372(1998)124:10(932)
- Xia, Y., Mo, Y., Yang, Q., Yu, Y., Jiang, M., Wei, S., Lu, D., Wu, H., Lu, G., Zou, Y., Zhang, Z., and Wei, X. (2018). Iodoacetic acid disrupting the thyroid endocrine system in vitro and in vivo. Environ. Sci. Technol., 52(13), 7545–7552. https://doi.org/10.1021/acs.est.8b01802
- Xiang, W., Xiang, J., Zhang, J., Wu, F., and Tang, J. (2005). Geochemical transformation of trichloroacetic acid to chloroform in fresh waters - The results based upon laboratory experiments. Water Air Soil Pollut., 168(1-4), 289–312.
- Xie, S., Li, Y., Tan, Y., Zheng, D., Liu, A., Xie, H., and Lu, W. (2011). Urinary trichloroacetic acid levels and semen quality: A hospital-based cross-sectional study in Wuhan, China. Environ. Res., 111(2), 295–300. https://doi.org/10.1016/j.envres.2010.12.010
- Xu, G., Stevens, D. K., and Bull, R. J. (1995). Metabolism of bromodichloroacetate in B6C3F1 mice. Drug Metab. Dispos., 23(12), 1412–1416.
- Xu, X., Mariano, T. M., Laskin, J. D., and Weisel, C. P. (2002). Percutaneous absorption of trihalomethanes, haloacetic acids, and haloketones. Toxicol. Appl. Pharmacol., 184(1), 19–26.
- Xu, X., and Weisel, C. P. (2003). Inhalation exposure to haloacetic acids and haloketones during showering. Environ. Sci. Technol., 37(3), 569–576. https://doi.org/10.1021/es025747z
- Xue, C., Wang, Q., Chu, W., and Templeton, M. R. (2014). The impact of changes in source water quality on trihalomethane and haloacetonitrile formation in chlorinated drinking water. Chemosphere, 117, 251–255. https://doi.org/10.1016/j.chemosphere.2014.06.083
- Yan, Z., Henderson, G. N., James, M. O., and Stacpoole, P. W. (1997). Determination of dichloroacetate and its metabolites in human plasma by gas chromatography-mass spectrometry. Journal of Chromatography.B, Biomedical Sciences and Applications, 703(1-2), 75–84. https://doi.org/10.1016/s0378-4347(97)00404-0
- Yang, L., She, Q., Wan, M. P., Wang, R., Chang, V. W., and Tang, C. Y. (2017). Removal of haloacetic acids from swimming pool water by reverse osmosis and nanofiltration. Water Res., 116, 116–125. https://doi.org/10.1016/j.watres.2017.03.025
- Yang, X., Guo, W., and Lee, W. (2013). Formation of disinfection byproducts upon chlorine dioxide preoxidation followed by chlorination or chloramination of natural organic matter. Chemosphere, 91(11), 1477–1485. https://doi.org/10.1016/j.chemosphere.2012.12.014
- Ye, T., Xu, B., Lin, Y., Hu, C., Xia, S., Lin, L., Mwakagenda, S. A., and Gao, N. (2012). Formation of iodinated disinfection by-products during oxidation of iodide-containing water with potassium permanganate. J. Hazard. Mater., 241-242, 348–354. https://doi.org/10.1016/j.jhazmat.2012.09.046
- Yeatts, S. D., Gennings, C., Wagner, E. D., Simmons, J. E., and Plewa, M. J. (2010). Detecting departure from additivity along a fixed-ratio mixture ray with a piecewise model for dose and interaction thresholds. J. Agric. Biol. Environ. Stat., 15(4), 510–522. https://doi.org/10.1007/s13253-010-0030-x
- Yllner, S. (1971). Metabolism of chloroacetate-1- 14 C in the mouse. Pharmacol. Toxicol., 30(1), 69–80. https://doi.org/10.1111/j.1600-0773.1971.tb00635.x
- Young, T. R., Deem, S., Lesile, J. C., Salo-Zieman, V., He, H., Dodd. M. C. (2020). Drivers of disinfection byproduct formation and speciation in small, chlorinated coastal groundwater systems: relative roles of bromide and organic matter, and the need for improved source water characterization and monitoring. Environ. Sci., 6, 3361. https://doi.org/10.1039/d0ew00663g
- Yount, E. A., Felten, S. Y., O'Connor, B. L., Peterson, R. G., Powell, R. S., Yum, M. N., and Harris, R. A. (1982). Comparison of the metabolic and toxic effects of 2-chloropropionate and dichloroacetate. J. Pharmacol. Exp. Ther., 222(2), 501–508.
- Yu, K. O., Barton, H. A., Mahle, D. A., and Frazier, J. M. (2000). In vivo kinetics of trichloroacetate in male Fischer 344 rats. Toxicol. Sci., 54(2), 302–311. https://doi.org/10.1093/toxsci/54.2.302
- Zaganjor, I., Luben, T. J., Desrosiers, T. A., Keil, A. P., Engel, L. S., Michalski, A. M., Carmichael, S. L., Nembhard, W. N., Shaw, G. M., Reefhuis, J., Yazdy, M. M., Langlois, P. H., Feldkamp, M. L., Romitti, P. A., and Olshan, A. F. (2020). Maternal exposure to disinfection by-products and risk of hypospadias in the National Birth Defects Prevention Study (2000-2005). Int. J. Environ. Res. Public Health, 17(24), 9564. https://doi.org/10.3390/ijerph17249564
- Zazouli, M. A., and Kalankesh, L. R. (2017). Removal of precursors and disinfection by-products (DBPs) by membrane filtration from water; a review. J. Environ. Health Sci. Eng., 15(1), 25. https://doi.org/10.1186/s40201-017-0285-z
- Zeng, Q., Wang, Y., Xie, S., Xu, L., Chen, Y., Li, M., Yue, J., Li, Y., Liu, A., and Lu, W. (2014). Drinking-water disinfection by-products and semen quality: A cross-sectional study in China. Environ. Health Perspect., 122(7), 741–746. https://doi.org/10.1289/ehp.1307067
- Zhang, J., Zhang, F., Hong, C., Giuliano, A. E., Cui, X., Zhou, G., Zhang, G., and Cui, Y. (2015). Critical protein GAPDH and its regulatory mechanisms in cancer cells. Cancer Biol. Med., 12(1), 10–22. https://doi.org/10.7497/j.issn.2095-3941.2014.0019
- Zhang, K., Qiu, C., Cai, A., Deng, J., and Li, X. (2020). Factors affecting the formation of DBPs by chlorine disinfection in water distribution system. Desalin. Water Treat., 205, 91-102. https://doi.org/10.5004/dwt.2020.26416
- Zhang, M., Liu, X., Deng, Y., Liu, C., Zeng, J., Miao, Y., Wu, Y., Li, C., Li, Y., Liu, A., Zhu, J., TREE Study Team, and Zeng, Q. (2024). Associations between urinary biomarkers of exposure to disinfection byproducts and semen parameters: A repeated measures analysis. J. Hazard. Mater., 461, 132638. https://doi.org/10.5004/dwt.2020.26416
- Zhang, X., and Minear, R. A. (2002). Decomposition of trihaloacetic acids and formation of the corresponding trihalomethanes in drinking water. Water Res., 36(14), 3665–3673. https://doi.org/10.1016/s0043-1354(02)00072-6
- Zhao, R., Reckhow, D. A., Becker, W. C., and Schindler, S. (2018). Seasonal variation of disinfection byproduct precursors in a large water supply. J. Am. Water Works Assoc., 110(11), 15–32. https://doi.org/10.1002/awwa.1108
- Zhao, Y., Xiao, F., Wang, D., Yan, M., and Bi, Z. (2013). Disinfection byproduct precursor removal by enhanced coagulation and their distribution in chemical fractions. J. Environ. Sci., 25(11), 2207–2213. https://doi.org/10.1016/s1001-0742(12)60286-1
- Zheng, L., Sun, H., Wu, C., Wang, Y., Zhang, Y., Ma, G., Lin, H., Chen, J., and Hong, H. (2020). Precursors for brominated haloacetic acids during chlorination and a new useful indicator for bromine substitution factor. Sci. Total Environ., 698, 134250.
- Zimmermann, K., Chen, W. S., Wright, J., and Mohseni, M. (2023). Design considerations for biological ion exchange drinking water filters: Resin selection, backwash, and regenerations. AWWA Water Sci., 5(5). https://doi.org/10.1002/aws2.1356
- Zimmermann, K., Wright, J., Bérubé, P., Barbeau, B., and Mohseni, M. (2021). Biological ion exchange capable of sulphate-based secondary ion exchange during long-term DOC removal. Water Res., 196, 117036. https://doi.org/10.1016/j.watres.2021.117036
- Zuo, Y., Hu, Y., Lu, W., Cao, J., Wang, F., Han, X., Lu, W., and Liu, A. (2017). Toxicity of 2,6-dichloro-1,4-benzoquinone and five regulated drinking water disinfection by-products for the Caenorhabditis elegans nematode. J. Hazard. Mater., 321, 456–463.
Appendix A: List of abbreviations
- AF
- Allocation factor
- AIX
- Anionic ion exchange
- ALARA
- As low as reasonably achievable
- ALT
- Alanine transaminase
- ANSI
- American National Standards Institute
- AOM
- Algal organic matter
- AOP
- Advanced oxidation process
- ASF
- Allometric scaling factor
- ATP
- Adenosine triphosphate levels
- 6C3F1, CD-1, F344, Hsd:SD
- Rat and mouse strains
- BAC
- Biological activated carbon
- BCAA
- Bromochloroacetic acid
- BDCAA
- Bromodichloroacetic acid
- BIAA
- Bromoiodoacetic acid
- BIEX
- Biological ion exchange
- BIF
- Bromine incorporation factor
- BMD
- Benchmark dose
- BMDL
- Lower 95% confidence limit on the benchmark dose
- Br-HAA
- Brominated haloacetic acid
- BSF
- Bromine substitution factor
- BV
- Bed volume
- BW
- Body weight
- CDBAA
- Chlorodibromoacetic acid
- CIAA
- Chloroiodoacetic acid
- Cl-HAA
- Chlorinated haloacetic acid
- CRPF
- Combined Relative Potency Factor
- CSF
- Cancer slope factor
- CSS
- Blood concentration at steady state
- DBAA
- Dibromoacetic acid
- DBCA
- Dibromochloroacetic acid
- DBP
- Disinfection by-product
- DCAA
- Dichloroacetic acid
- DIAA
- Diiodoacetic acid
- Di-HAA
- Dihaloacetic acid
- DL
- Detection limit
- DOC
- Dissolved organic carbon
- DOI
- Dissolved organic iodine
- DOM
- Dissolved organic matter
- DUVA
- Differential ultraviolet absorbance
- DWTP
- Drinking water treatment plant
- EBCT
- Empty bed contact time
- EEM
- Excitation-emission matrix
- EOM
- Extracellular organic matter
- FDOM
- Fluorescent dissolved organic matter
- FP
- Formation potential
- GAC
- Granular activated carbon
- GAPDH
- Glyceraldehyde-3-phosphate dehydrogenase
- GD
- Gestation day
- GST-ζ
- Glutathione S-transferase zeta
- HAA
- Haloacetic acid
- HAA5
- Sum of MCAA, DCAA, TCAA, MBAA and DBAA
- HAA6
- Sum of HAA5 and BCAA
- HAA9
- Sum of HAA6 and TBAA, CDBAA, BDCAA
- HBV
- Health-based value
- HED
- Human equivalent dose
- HOBr
- Hypobromous acid
- HOI
- Hypoiodous acid
- HPC
- Heterothropic plate count
- IARC
- International Agency for Research on Cancer
- IC
- Index chemical
- ICED
- Index chemical effective dose
- I-DBP
- Iodinated disinfection by-products
- I-HAA
- Iodinated haloacetic acid
- IOM
- Intracellular organic matter
- LD50
- Median lethal dose
- LOAEL
- Lowest observed adverse effect level
- MAC
- Maximum acceptable concentration
- MBAA
- Monobromoacetic acid
- MCAA
- Monochloroacetic acid
- MIAA
- Monoiodoacetic acid
- MIEX
- Magnetic ion exchange
- MOA
- Mode of action
- Mono-HAA
- Monohaloacetic acid
- MRL
- Method reporting limit
- MRTL
- Maximum residence time location
- MW
- Molecular weight
- MWCO
- Molecular weight cut-off
- N-DBP
- Nitrogenous disinfection by-product
- NDWS
- National Drinking Water Survey
- NF
- Nanofiltration
- NOAEL
- No observed adverse effect level
- NOM
- Natural organic matter
- NSF
- NSF International Standard
- NTP
- National Toxicology Program
- PACl
- Polyaluminum chloride
- PARAFAC
- Parallel factor analysis
- PBPK
- Physiologically based pharmacokinetic modelling
- PDC
- Pyruvate dehydrogenase complex
- PDK
- Pyruvate dehydrogenase kinase
- POD
- Point of departure
- qIVIVE
- Quantitative in vitro to in vivo extrapolation
- RO
- Reverse osmosis
- ROS
- Reactive oxygen species
- SGA
- Small for gestational age
- SIX
- Suspended ion exchange
- SUVA
- Specific ultraviolet absorbance
- TBAA
- Tribromoacetic acid
- TCAA
- Trichloroacetic acid
- TDI
- Tolerable daily intake
- THM
- Trihalomethane
- TOC
- Total organic carbon
- TOX
- Total organic halogen
- Tri-HAA
- Trihaloacetic acid
- UF
- Ultrafiltration
- UFC
- Uniform formation conditions
- UFT
- Uncertainty factor total
- UTOX
- Unknown total organic halogen
- UV
- Ultraviolet
- WC
- Water consumption
- WOE
- Weight of evidence
Appendix B: Provincial and Territorial Anticipated Impacts
Additional information on anticipated impacts in specific jurisdictions has been provided by Federal-Provincial-Territorial Committee on Drinking Water (CDW) members and is presented verbatim.
Please note that this information is not available in both official languages because the source of the information is not subject to the Official Languages Act.
Alberta
Drinking water systems in Alberta are currently required to monitor for HAA5 and meet the current MAC of 80 ug/L. They are not required to monitor for HAA6 or BCAA, though a few larger systems voluntarily monitor for this parameter. We, therefore, have very limited quantitative information on BCAA levels in water systems in the province. Nor are systems required to test for bromide in source water. Overall, this makes it difficult to provide a complete statement on how the proposed new guideline will impact water systems across the province. We do know that roughly 60 out of 700 (about 8-9%) systems, mainly surface water systems, have difficulty meeting disinfection by-product (DPB) MACs for THM and/or HAA at present. These systems are in different stages of implementing plans to meet the limits while ensuring that disinfection is not compromised. The Province of Saskatchewan has tested for BCAA (Table 1.3.1) and their data shows the median BCAA concentration was 4.8 ug/L and the 90% percentile concentration was 10 ug/L. If we assume similar occurrence in Alberta, we may expect to see some level of BCAA occurrence and that a few more systems that are currently close to the HAA5 limit will exceed the new HAA6 MAC of 80 ug/L.
Solutions for meeting the disinfection by-product limits vary from facility to facility, but often involve capital investment to modify or upgrade the treatment system or to identify a new water source. Fortunately, solutions for reducing THM level will likely be effective for reducing HAA levels as well. Systems in Alberta can apply for funding through the Alberta Municipal Water and Wastewater Partnership Program or Water for Life Program to obtain funding, however, funding is limited and competitive. It will, therefore, take time to address existing and any new DBP exceedances. The priority in the province will be to ensure proper disinfection.
British Columbia
No impact statement provided.
Manitoba
The updated draft guideline proposes a maximum acceptable concentration (MAC) of 0.08 mg/L for the total sum of six haloacetic acids (HAA6) that can be found in disinfected drinking water in Canada. The specific HAAs targeted by the guideline are monochloroacetic acid (MCAA), dichloroacetic acid (DCAA), trichloroacetic acid, (TCAA), monobromoacetic acid (MBAA), dibromoacetic acid (DBAA), and bromochloroacetic acid (BCAA). Under this updated guideline, the MAC for the sum of HAAs remains 0.08 mg/L; however, an additional sixth and new HAA, BCAA, has been added to the total summary of HAA results (going from HAA5 to HAA6). As well, it specifies that if BCAA is measured at levels equal to or greater than 0.01 mg/L, steps should be taken to reduce brominated HAA formation. Manitoba has adopted the existing guideline (HAA5) as a water quality standard in regulation, which is applied to water systems through operating licences.
Licenced water systems across Manitoba are currently adhering to monitoring protocols and implementing treatment technologies to achieve compliance with the existing MAC of 0.08 mg/L for HAA5. The impact of adding a new, sixth HAA (BCAA) to the total HAA guideline cannot accurately be determined in Manitoba at this time. Although many larger water systems have control strategies and treatment processes already in place that should be able to accommodate the proposed new guideline, smaller water systems with less treatment and a smaller capital base would have greater difficulty meeting the requirements. Manitoba has confirmed that testing for BCAA is achievable using local laboratory services.
New Brunswick
Based on available data from a limited number of drinking water systems, the proposed Health Canada MAC for haloacetic acids is expected to have minimal to no impact. Regulated systems in New Brunswick are not required to monitor haloacetic acids in drinking water at this time.
Newfoundland and Labrador
The Province of Newfoundland and Labrador implemented the Multi-Barrier Strategic Action Plan (MBSAP) in 2001 to enhance drinking water safety in public drinking water systems. The provincial government is responsible for extensive drinking water quality monitoring of public drinking water systems, including disinfection by-products (Trihalomethanes and Haloacetic Acids).
There are currently 474 public drinking water systems (179 groundwater systems and 295 surface water systems).
Disinfection by-products are sampled four times per year for all surface water supplies that utilize chlorine as a disinfectant. The four samples must encompass the four seasons. Disinfection by-products are sampled at least once for all groundwater supplies that utilize chlorine as a disinfectant to establish background levels. If the value is below 10 µg/L, no further sampling is required. If the value is above 10 µg/L, then it will be sampled four times per year and will encompass the four seasons.
The current monitoring program implements a MAC of 80 µg/L for total HAA5 based on the summation of Monochloroacetic Acid (MCAA), Monobromoacetic Acid (MBAA), Dichloroacetic Acid (DCAA), Trichloroacetic Acid (TCAA), and Dibromoacetic Acid (DBAA). The MAC is based on a locational running average of quarterly samples taken in the distribution system.
Based on historical water quality monitoring for public drinking water systems in NL:
- Approximately 142 public drinking water systems exceed the current HAA5 MAC of 80 µg/L.
- No monitoring for BCAA has been conducted in NL.
- Historical source water quality data for NL indicates that bromide levels are typically less than detectable, except for seven (7) public water systems.
The current monitoring program does not report BCAA and the cost to analyze is expected to be an additional $15 per sample. Approximately 1400 HAA samples are collected per year, resulting in an increased cost of approximately $21,000 per year.
Substantial changes will need to be incorporated into the data management and reporting system currently used for processing and disseminating drinking water quality data to the public.
All seven (7) water systems with a historical detection for bromide are very small water systems that service less than 500 people. These very small water systems have limited financial and technical capacity that contribute to the challenge of providing reliable water treatment.
Northwest Territories
No anticipated impacts.
Nova Scotia
No impact statement provided.
Nunavut
No anticipated impacts.
Ontario
Ontario is supportive of the consultation document on Haloacetic Acids in Drinking Water noting that there is no change in the numerical guideline value of 0.080 mg/L as an average of quarterly samples taken from the distribution system. The guideline document adequately stresses that utilities should strive to provide properly disinfected water while maintaining the disinfection by-products such as trihalomethanes and haloacetic acids as low as reasonably achievable. Excursions above the drinking water quality standard for disinfection by-products are reported as prescribed by our regulation and addressed by the local health unit that also considers the presence of microbiological parameters as a part of the health risk as recommended by this guideline document. Overall, drinking water systems are providing water that is safe and of high quality.
Prince Edward Island
The changes to the HAA guideline limit should have very little impact on PEI. All PEI municipalities rely on groundwater for water supply which contains very small amounts of natural organic matter. As well, since PEI uses groundwater there is very little fluctuation in water temperatures throughout the year. With consistent cool groundwater temperatures and low organic matter content, the two precursors for the formation of HAA’s, the risk of disinfection byproducts is low on PEI.
Quebec
Au Québec, les acides haloacétiques (AHA5) font l'objet d'une norme dans le Règlement sur la qualité de l'eau potable (RQEP – 60 µg/L, basée sur une moyenne de quatre trimestres consécutifs), mais ils ne font pas l'objet d'un contrôle systématique. Toutefois, il est exigé aux responsables des installations de distribution d'eau potable de faire analyser les concentrations d'acides haloacétiques lorsqu'ils soupçonnent que cette norme pourrait ne pas être respectée. C'est notamment le cas lorsque les concentrations de trihalométhanes totaux se rapprochent ou dépassent la norme applicable du RQEP (80 µg/L, basée sur une moyenne de quatre trimestres consécutifs) et que les valeurs de pH sont inférieures à 7,0. Ces deux situations, présentes simultanément, devraient amener le responsable à faire analyser les concentrations en acides haloacétiques dans l'eau distribuée en vertu de l'article 42 du RQEP.
Ainsi, dans le cadre du RQEP, pour les années 2016, 2017 et 2018, 408 échantillons provenant de 40 installations de distribution d'eau potable ont été analysés. De ceux-ci, 205 échantillons provenant de 24 réseaux de distribution ont dépassé la valeur de 60 µg/L.
Des suivis des concentrations en AHA5 ont également été réalisés dans le cadre du Programme de surveillance de la qualité de l'eau potable. Dans le cadre de ce programme, 131 échantillons provenant de 11 réseaux de distribution, sélectionnés en fonction de la présence potentielle de précurseurs de sous-produits émergents dans la source d’approvisionnement (bromures et iodures) et des concentrations de THM mesurées dans l’eau distribuée, ont été prélevés en 2014, 2015 et 2016 et ont été analysés pour les AHA5. Le BCAA a également été analysé. Un seul de ces réseaux a présenté une concentration en BCAA supérieure à 10 µg/L, et des concentrations supérieures à 60 µg/L pour les AHA5 ont également été obtenues pour ce réseau.
Considérant les résultats d'analyse disponibles et présentés sommairement ci-dessus, les impacts attendus de la modification de la recommandation canadienne pour les AHA seraient faibles au Québec. En effet, la norme au RQEP pour les AHA5 est plus sévère que la recommandation canadienne actuelle et le BCAA ne semble pas susceptible de faire augmenter le nombre de dépassements.
Saskatchewan
The guideline document proposes a new Maximum Acceptable Concentration (MAC) of 80 µg/L for total haloacetic acids (HAA6; 6 haloacetic acids) in drinking water; this guideline includes a new guideline of 0.10 µg/L for bromochloroacetic acid (BCAA). The existing guideline is 80 µg/L for five halaoacetic acids (HAA5). Saskatchewan adopted the existing HAA5 guideline as a drinking water quality standard in 2010 and communities in Saskatchewan are implementing appropriate treatment technologies to achieve less than the standard, however, several communities in the province are facing challenges in meeting the HAA5 Standard of 80 µg/L.
The health benefits associated with the proposed BCAA guideline are not clear in the document. Five year data (2018 to 2023) from the database showed that many communities in Saskatchewan are having at least one sample with BCAA level. There are 38 communities that have at least one data point above 10 µg/L. It is not clear how the existing treatment or new system will reduce this BCAA. The document didn’t address the treatment system details or any other to reduce the BCAA levels. More information is needed on the treatment aspects of BCAA.
The estimation of treatment cost to comply with the proposed HAA6 guideline is not possible at this time, however, Saskatchewan expects that affected communities in the province may expect a significant treatment cost once the new HAA6 guideline is in place and the province adopts the guideline as a drinking water standard. There may be increased operational and maintenance costs, and salary for the higher level certified operators for the new systems etc. Also, not all the affected communities may be eligible or qualify for federal/provincial funding, some communities may have to put up their own cost to comply with the new MAC and that will increase their financial liability.
The new MAC of 80 µg/L for HAA6 including BCAA will pose a significant compliance challenge for the affected communities in Saskatchewan including those already have a treatment in place to achieve less than the existing standard. Most of these communities are small and they may not have adequate funding to upgrade their treatment system. Saskatchewan has concerns regarding the achievability of the new MAC of 80 µg/L for HAA6 by the communities in Saskatchewan.
Yukon
No anticipated impacts.
Indigenous Services Canada
Quantifying the potential impact of the proposed change of the Maximum Acceptable Concentration (MAC) (that is, from a total of five haloacetic acids (HAA5) to a total of six HAAs (HAA6) while maintaining a value of 0.08 mg/L, and adding a target of 0.01 mg/L for bromochloroacetic Acid (BCAA)) on public and semi-public drinking water systems in First Nations communities south of 60o is challenging, as HAA6 is not currently included in routine monitoring programs. Limited HAA6 data from First Nations’ water systems in British Columbia and Ontario suggest that a small number of additional systems may exceed the MAC for HAAs as a result of the proposed change from the current use of HAA5 to the use of HAA6. A separate data set for BCAA from First Nations communities in British Columbia, Manitoba, Ontario, and Atlantic regions was analyzed to assess the potential impact of the proposed target of 0.01 mg/L. The concentrations of BCAA in British Columbia and Atlantic were observed to be low. In Ontario and Manitoba, between one and four percent of samples exceeded 0.01 mg/L, respectively. Therefore, it is anticipated that some First Nation drinking water systems in Ontario and Manitoba may need to take steps to reduce brominated HAA formation.
In order to meet the proposed HAA6 MAC and address brominated HAA formation, a small number of drinking water systems will likely require capital investments and/or operational adjustments. Increased monitoring of HAA6 will be needed in the future to provide comprehensive data to be able to accurately assess the potential impact of the proposed HAA6 MAC and BCAA ‘target’. Laboratory costs to analyze samples collected for HAAs by Environmental Public Health Officers and Water Treatment Plant Operators is expected to increase by five to twenty percent due to the additional cost for analysis of BCAA. Indigenous Services Canada will support First Nations to meet the final proposed guideline and will continue to support operator training and capacity-building programs.
Appendix C: Canadian Water Quality Data
| Survey (year) |
Source water | Parameter | MCAA | DCAA | TCAA | MBAA | DBAA | TBAA | BCAA | CDBAA | BDCAA |
|---|---|---|---|---|---|---|---|---|---|---|---|
| Drinking water survey (2009–2010) |
Surface | # detects/ N | 154/ 262 | 260/ 262 | 261/ 262 | 2/262 | 40/ 262 | 0/262 | 145/ 262 | 17/262 | 152/262 |
| Drinking water survey (2009–2010) |
Surface | Detect % | 58.8 | 99.2 | 99.6 | 0.8 | 15.3 | 0 | 55.3 | 6.5 | 58.0 |
| Drinking water survey (2009–2010) |
Surface | Median (μg/L) | 1.4 | 16.1 | 13.3 | < 0.57 | < 0.26 | < 2.84 | 1.4 | < 0.76 | 1.1 |
| Drinking water survey (2009–2010) |
Surface | MeanTable C1 Footnote a (μg/L) |
1.8 | 23.6 | 20.2 | 0.5 | 0.7 | < 2.84 | 2.8 | 0.7 | 2.3 |
| Drinking water survey (2009–2010) |
Surface | 90th percentile(μg/L) | 3.9 | 47.5 | 43.0 | < 0.57 | 1.4 | < 2.84 | 8.3 | < 0.76 | 6.8 |
| Drinking water survey (2009–2010) |
Ground | # detects/ N | 5/107 | 63/107 | 52/ 107 | 0/107 | 33/ 107 | 0/107 | 22/ 107 | 5/107 | 18/107 |
| Drinking water survey (2009–2010) |
Ground | Detect % | 4.7 | 58.9 | 48.6 | 0 | 30.8 | 0 | 20.6 | 4.7 | 16.8 |
| Drinking water survey (2009–2010) |
Ground | Median(μg/L) | < 0.59 | 1.6 | 0.4 | < 0.57 | < 0.26 | < 2.84 | < 0.3 | < 0.76 | < 0.32 |
| Drinking water survey (2009–2010) |
Ground | MeanTable C1 Footnote a (μg/L) |
0.5 | 2.9 | 2.2 | < 0.57 | 0.9 | < 2.84 | 1.2 | 0.9 | 1.4 |
| Drinking water survey (2009–2010) |
Ground | 90th percentile(μg/L) | < 0.59 | 6.2 | 4.7 | < 0.57 | 1.7 | < 2.84 | 2.0 | < 0.76 | 1.4 |
| Targeting highly brominated water (2007) |
Surface | # detects/ N | 12/13 | 13/13 | 13/13 | 0/13 | 5/13 | NR | 13/13 | 1/13 | 12/13 |
| Targeting highly brominated water (2007) |
Surface | Detect % | 92.3 | 100 | 100 | 0 | 38.5 | NR | 100 | 7.7 | 92.3 |
| Targeting highly brominated water (2007) |
Surface | Median(μg/L) | 2.4 | 26.4 | 15.1 | < 0.91 | < 0.79 | NR | 3.6 | < 1.22 | 3.1 |
| Targeting highly brominated water (2007) |
Surface | MeanTable C1 Footnote a (μg/L) |
3.4 | 49.4 | 43.7 | < 0.91 | 1.1 | NR | 4.9 | 0.4 | 5.2 |
| Targeting highly brominated water (2007) |
Surface | 90th percentile(μg/L) | 10.5 | 184.2 | 200.1 | < 0.91 | 4.1 | NR | 14.2 | < 1.22 | 15.3 |
| Targeting highly brominated water (2007) |
Ground | # detects/ N | 10/16 | 16/16 | 10/16 | 3/16 | 9/16 | NR | 13/16 | 2/16 | 8/16 |
| Targeting highly brominated water (2007) |
Ground | Detect % | 62.5 | 100 | 62.5 | 18.8 | 56.3 | NR | 81.3 | 12.5 | 50 |
| Targeting highly brominated water (2007) |
Ground | Median(μg/L) | 0.9 | 2.8 | 1.4 | < 0.91 | 1.5 | NR | 1.9 | < 1.22 | 0.3 |
| Targeting highly brominated water (2007) |
Ground | MeanTable C1 Footnote a (μg/L) |
1.2 | 22.5 | 1.9 | 0.4 | 5.4 | NR | 5.1 | 0.5 | 1.5 |
| Targeting highly brominated water (2007) |
Ground | 90th percentile(μg/L) | 3.7 | 18.2 | 4.9 | 1.1 | 18.4 | NR | 23.5 | 1.2 | 6.8 |
| Targeting small systems (1999–2000) |
Surface | # detects/ N | 133/161 | 158/161 | 154/161 | 10/161 | 23/161 | NR | 64/ 161 |
10/161 | 70/161 |
| Targeting small systems (1999–2000) |
Surface | Detect % | 82.6 | 98.1 | 95.7 | 6.2 | 14.3 | NR | 40.0 | 6.2 | 43.5 |
| Targeting small systems (1999–2000) |
Surface | Median(μg/L) | 2.4 | 26.4 | 22.9 | < 0.42 | < 0.7 | NR | < 0.26 | < 0.74 | < 0.53 |
| Targeting small systems (1999–2000) |
Surface | MeanTable C1 Footnote a (μg/L) |
3.2 | 43.5 | 48.3 | 0.3 | 0.6 | NR | 2.3 | 0.4 | 2.2 |
| Targeting small systems (1999–2000) |
Surface | 90th percentile(μg/L) | 6.7 | 103.4 | 138.9 | < 0.42 | 1.2 | NR | 6.9 | < 0.74 | 7.6 |
BCAA – bromochloroacetic acid; BDCAA – bromodichloroacetic acid; CDBAA – chlorodibromoacetic acid; DBAA – dibromoacetic acid; DCAA – dichloroacetic acid; MBAA – monobromoacetic acid; MCAA – monochloroacetic acid; N – sample size; NR – not reported; TBAA – tribromoacetic acid; TCAA – trichloroacetic acid. Source: Health Canada (2017)
|
|||||||||||
| Source water | Parameter | Newfoundland and Labrador MCAA | Newfoundland and Labrador DCAA | Newfoundland and Labrador TCAA | Newfoundland and Labrador MBAA | Newfoundland and Labrador DBAA | Newfoundland and Labrador BCAA | Newfoundland and Labrador HAA5 | Newfoundland and Labrador HAA6 | Ontario HAA5 |
|---|---|---|---|---|---|---|---|---|---|---|
| Surface water | # detects/N | 3993/ 12 368 |
10 367/ 12 368 |
10 303/ 12 368 |
42/ 12 368 |
211/ 12 368 |
653/ 5630 |
10 719/ 12 368 |
4751/ 5630 |
2878/ 2878 |
| Surface water | Detect % | 32.3 | 83.8 | 83.3 | 0.3 | 1.7 | 11.6 | 86.7 | 84.4 | 100.0 |
| Surface water | Median (μg/L) | < 5 | 37.1 | 42.5 | < 5 | < 5 | < 5 | 83.9 | 85.0 | 31.4 |
| Surface water | MeanTable C2 Footnote a (μg/L) |
3.6 | 53.1 | 70.8 | 2.5 | 2.6 | 2.9 | 125.5 | 127.5 | 38.6 |
| Surface water | 90th percentile(μg/L) | 6.6 | 120.0 | 167.0 | < 5 | < 5 | 2.5 | 287.6 | 290.0 | 75.5 |
| Groundwater | # detects/N | 119/ 1188 | 512/ 1188 | 482/ 1188 | 14/ 1188 | 140/ 1188 | 68/ 508 | 748/ 1188 | 68/ 508 | 5644/ 5644 |
| Groundwater | Detect % | 10.0 | 43.1 | 40.6 | 1.2 | 11.8 | 13.4 | 63.0 | 13.4 | 100.0 |
| Groundwater | Median(μg/L) | < 5 | < 5 | < 5 | < 5 | < 5 | < 5 | 2.5 | < 5 | 5.3 |
| Groundwater | MeanTable C2 Footnote a (μg/L) |
2.8 | 17.1 | 20.0 | 2.5 | 3.0 | 3.1 | 36.9 | 37.2 | 10.3 |
| Groundwater | 90th percentile(μg/L) | 2.5 | 52.4 | 61.1 | < 5 | 2.5 | 5.6 | 116.2 | 135.5 | 20.8 |
BCAA – bromochloroacetic acid; DBAA – dibromoacetic acid; DCAA – dichloroacetic acid; HAA5 – sum of MCAA, DCAA, TCAA, MBAA and DBAA; HAA6 – sum of HAA5 and BCAA; MBAA – monobromoacetic acid; MCAA – monochloroacetic acid; N – sample size; TBAA – tribromoacetic acid; TCAA – trichloroacetic acid. Sources: Newfoundland and Labrador Department of Municipal Affairs and Environment (2019); Ontario Ministry of the Environment, Conservation and Parks (2019)
|
||||||||||
| Parameter | Treated water # detects/N |
Treated water Detection % |
Treated water Mean (µg/L) |
Farthest from treatment plant # detects/N |
Farthest from treatment plant Detection % |
Farthest from treatment plant Mean (µg/L) |
|---|---|---|---|---|---|---|
| Winter | ||||||
| MCAA | 19/60 | 31.7 | 1.0 | 27/60 | 45.0 | 1.4 |
| DCAA | 45/60 | 75.0 | 10.9 | 53/60 | 88.3 | 17.7 |
| TCAA | 43/60 | 71.7 | 8.5 | 53/60 | 88.3 | 14.7 |
| MBAA | 0/60 | 0.0 | < 1.0 | 0/60 | 0.0 | < 1.0 |
| DBAA | 7/60 | 11.7 | 0.6 | 11/60 | 18.3 | 0.8 |
| BCAA | 16/60 | 26.7 | 1.4 | 30/60 | 50.0 | 2.4 |
| TBAA | 0/60 | 0.0 | < 2.8 | 0/60 | 0.0 | < 2.8 |
| CDBAA | 4/60 | 6.7 | 0.7 | 4/60 | 6.7 | 0.7 |
| BDCAA | 18/60 | 30.0 | 1.0 | 29/60 | 48.3 | 1.8 |
| HAA5 | 45/60 | 75.0 | 20.4 | 54/60 | 90.0 | 34.0 |
| HAA6 | 44/60 | 73.3 | 21.4 | 55/60 | 91.7 | 36.2 |
| HAA9 | 41/60 | 68.3 | 22.6 | 51/60 | 85.0 | 37.9 |
| Summer | ||||||
| MCAA | 21/57 | 36.8 | 1.2 | 28/57 | 49.1 | 1.7 |
| DCAA | 47/57 | 82.5 | 15.3 | 52/57 | 91.2 | 19.7 |
| TCAA | 44/57 | 77.2 | 12.2 | 50/57 | 87.7 | 17.2 |
| MBAA | 0/57 | 0.0 | < 1.0 | 0/57 | 0.0 | < 1.0 |
| DBAA | 10/57 | 17.5 | 0.6 | 15/57 | 26.3 | 0.8 |
| BCAA | 27/57 | 47.4 | 2.2 | 30/57 | 52.6 | 2.8 |
| TBAA | 0/57 | 0.0 | < 2.8 | 0/57 | 0.0 | < 2.8 |
| CDBAA | 2/57 | 3.5 | 0.7 | 4/57 | 7.0 | 0.9 |
| BDCAA | 21/57 | 36.8 | 1.7 | 30/57 | 52.6 | 3.1 |
| HAA5 | 45/57 | 78.9 | 28.7 | 52/57 | 91.2 | 38.7 |
| HAA6 | 44/57 | 77.2 | 30.6 | 50/57 | 87.7 | 41.2 |
| HAA9 | 41/57 | 71.9 | 32.3 | 49.57 | 86.0 | 44.6 |
| Summer and winter | ||||||
| MCAA | 40/117 | 34.2 | 1.1 | 55/117 | 47.0 | 1.5 |
| DCAA | 92/117 | 78.6 | 13.1 | 105/117 | 89.7 | 18.7 |
| TCAA | 87/117 | 74.4 | 10.3 | 103/117 | 88.0 | 15.9 |
| MBAA | 0/117 | 0.0 | < 1.0 | 0/117 | 0.0 | < 1.0 |
| DBAA | 17/117 | 14.5 | 0.6 | 26/117 | 22.2 | 0.8 |
| BCAA | 43/117 | 36.8 | 1.8 | 60/117 | 51.3 | 2.6 |
| TBAA | 0/117 | 0.0 | < 2.8 | 0/117 | 0.0 | < 2.8 |
| CDBAA | 6/117 | 5.1 | 0.7 | 8/117 | 6.8 | 0.8 |
| BDCAA | 39/117 | 33.3 | 1.4 | 59/117 | 50.4 | 2.4 |
| HAA5 | 90/117 | 76.9 | 24.4 | 106/117 | 90.6 | 36.3 |
| HAA6 | 88/117 | 75.2 | 25.9 | 105/117 | 89.7 | 38.6 |
| HAA9 | 82/117 | 70.1 | 27.3 | 100/117 | 85.5 | 41.2 |
BCAA – bromochloroacetic acid; BDCAA – bromodichloroacetic acid; CDBAA – chlorodibromoacetic acid; DBAA – dibromoacetic acid; DCAA – dichloroacetic acid; HAA5 – sum of MCAA, DCAA, TCAA, MBAA and DBAA; HAA6 – sum of HAA5 and BCAA; HAA9 – sum of HAA6 and TBAA, CDBAA, BDCA; MBAA – monobromoacetic acid; MCA – monochloroacetic acid; N – sample size; TBAA – tribromoacetic acid; TCAA – trichloroacetic acid. Source: Health Canada (2017) |
||||||
| Parameter | Centre # detects/N |
Centre Detection % |
Centre Mean (µg/L) |
Extremity # detects/N |
Extremity Detection % |
Extremity Mean (µg/L) |
|---|---|---|---|---|---|---|
MCAA |
26/58 |
44.8 |
0.9 |
24/58 |
41.4 |
1.0 |
DCAA |
58/58 |
100.0 |
9.4 |
57/58 |
98.3 |
8.1 |
TCAA |
58/58 |
100.0 |
11.1 |
58/58 |
100.0 |
12.7 |
MBAA |
9/58 |
15.5 |
0.7 |
11/58 |
19.0 |
0.7 |
DBAA |
39/58 |
67.2 |
4.6 |
36/58 |
62.1 |
4.3 |
BCAA |
56/58 |
96.6 |
5.6 |
48/58 |
82.8 |
5.3 |
TBAA |
12/58 |
20.7 |
17.7 |
14/58 |
24.1 |
16.4 |
CDBAA |
32/58 |
55.2 |
8.7 |
31/58 |
53.4 |
8.4 |
BDCAA |
52/58 |
89.7 |
6.6 |
52/58 |
89.7 |
6.9 |
HAA5 |
58/58 |
100.0 |
26.0 |
58/58 |
100.0 |
26.1 |
HAA6 |
58/58 |
100.0 |
31.5 |
58/58 |
100.0 |
31.4 |
HAA9 |
58/58 |
100.0 |
65.1 |
58/58 |
100.0 |
62.8 |
BCAA – bromochloroacetic acid; BDCAA – bromodichloroacetic acid; CDBAA – chlorodibromoacetic acid; DBAA – dibromoacetic acid; DCAA – dichloroacetic acid; HAA5 – sum of MCAA, DCAA, TCAA, MBAA and DBAA; HAA6 – sum of HAA5 and BCAA; HAA9 – sum of HAA6 and TBAA, CDBAA, BDCAA; MBAA – monobromoacetic acid; MCAA – monochloroacetic acid; N – sample size; TBAA – tribromoacetic acid; TCAA – trichloroacetic acid. Source: Ministère du Développement durable, de l’Environnement et de la Lutte contre les changements climatiques du Québec (2019) |
||||||
| Parameter | Treated water # detects/N |
Treated water Detection % |
Treated water MeanTable C5 Footnote a (µg/L) |
Distributed water # detects/N |
Distributed water Detection % |
Distributed water MeanTable C5 Footnote a (µg/L) |
|---|---|---|---|---|---|---|
| MCAA | 76/169 | 45 | 0.7 | 107/169 | 63.3 | 1.0 |
| DCAA | 164/169 | 97.0 | 11.6 | 166/169 | 98.2 | 16.4 |
| TCAA | 151/169 | 89.3 | 12.0 | 159/169 | 94.1 | 18.1 |
| MBAA | 96/169 | 56.8 | 0.20 | 106/169 | 62.7 | 0.25 |
| DBAA | 106/169 | 62.7 | 0.8 | 109/169 | 64.5 | 0.7 |
| BCAA | 159/169 | 94.1 | 2.2 | 159/169 | 94.1 | 2.7 |
| TBAA | 38/169 | 22.5 | 0.3 | 46/169 | 27.2 | 0.3 |
| CDBAA | 103/169 | 60.9 | 0.6 | 106/169 | 62.7 | 0.6 |
| BDCAA | 159/169 | 94.1 | 1.9 | 167/169 | 98.8 | 2.7 |
| HAA5Table C5 Footnote b | 625/631 | 99.0 | 18.4 | 628/631 | 99.5 | 27.5 |
| HAA6Table C5 Footnote b | 169/169 | 100.0 | 27.3 | 169/169 | 100.0 | 39.0 |
| HAA9Table C5 Footnote b | 169/169 | 100.0 | 30.0 | 169/169 | 100.0 | 42.1 |
BCAA – bromochloroacetic acid; BDCAA – bromodichloroacetic acid; CDBAA – chlorodibromoacetic acid; DBAA – dibromoacetic acid; DCAA – dichloroacetic acid; HAA5 – sum of MCAA, DCAA, TCAA, MBAA and DBAA; HAA6 – sum of HAA5 and BCAA; HAA9 – sum of HAA6 and TBAA, CDBAA, BDCAA; MBAA – monobromoacetic acid; MCAA – monochloroacetic acid; N – sample size; NR – not reported; TBAA – tribromoacetic acid; TCAA – trichloroacetic acid. Source: Ontario Ministry of the Environment, Conservation and Parks (2019)
|
||||||
| Population served | HAA5 concentration (μg/L) Groundwater Mean |
HAA5 concentration (μg/L) Groundwater Maximum |
HAA5 concentration (μg/L) Surface water Mean |
HAA5 concentration (μg/L) Surface water Maximum |
|---|---|---|---|---|
| < 100 | 15.82 | 585 | 135.79 | 1617 |
| 101–250 | 61.87 | 428 | 108.00 | 1960 |
| 251–500 | 64.22 | 612 | 153.96 | 1320 |
| 501–1000 | 9.43 | 33 | 132.90 | 1200 |
| 1001–3000 | 12.61 | 99.7 | 156.34 | 1600 |
| 3001–5000 | NA | NA | 108.24 | 574 |
| 5001–10 000 | 36.22 | 125 | 71.14 | 492 |
| > 10 000 | NA | NA | 76.28 | 326 |
| Overall | 27.7 | 612 | 129.2 | 1960 |
HAA – haloacetic acid; HAA5 – sum of MCAA, DCAA, TCAA, MBAA and DBAA; NA – not available. Source: Chowdhury (2018) |
||||
Appendix D: Epidemiology studies
| Endpoint | HAA | Population | Sample size | Exposure | Design | Outcome | Findings | Notes | Reference |
|---|---|---|---|---|---|---|---|---|---|
| Carcinogenicity | HAA5, THMs and nitrates | USA: Iowa Women’s Health Study; postmenopausal women | 15 577 women; 125 cases | Historical measurements in public water supplies >10 years use. | Cohort | Kidney | No association. | Large cohort study. Women only; focused on nitrates and THMs; low incidences; uncertainty in historical DBP levels. | Jones et al., 2017 |
| Carcinogenicity | HAA5, THMs and nitrates | USA: Iowa Women’s Health Study; postmenopausal women | 15 910 women; 624 colon and 158 rectal cases | Historical measurements in public water supplies >10 years use. | Cohort | Colon and rectal | Plausible association but requires replication. | Large cohort study. Women only; focused on nitrates and THMs; low incidences; uncertainty in historical DBP levels. | Jones et al., 2019 |
| Carcinogenicity | HAA5, THMs and nitrates | USA: Iowa Women’s Health Study; postmenopausal women | 10 501 women; 261 cases | Historical measurements in public water supplies >10 years use. | Cohort | Endometrial | Associated with low grade endometrial cancer risk. | Large cohort study. Women only; focused on nitrates and THMs; low incidences; uncertainty in historical DBP levels. | Medgyesi et al., 2022 |
| Reproduction | HAA | USA: 3 sites | 228 males-partners of women in pregnancy loss study (Savitz et al., 2006) | Drinking water: distribution system wide weekly average concentrations linked to telephone interview data on residences and water intake. | Prospective cohort | Sperm quality | No association. | Non-random selection; differ across sites (ethnicity, education, income and alcohol use). | Luben et al., 2007 |
| Reproduction | TCAA | China: Wuhan Tongji Reproductive and Environmental cohort | 418 males; fromcouples seeking care for infertility | Urinary TCAA collected at the time of semen collection. Questionnaire on tap water use. | Cross-sectional | Sperm quality | Negative: No association. | Non-random selection;creatinine adjusted; personal interviews. | Xie et al., 2011 |
| Reproduction | TCAA | China: Wuhan Tongji Reproductive and Environmental cohort | 2 009 men seeking semen analysis | Urinary TCAA collected at the time of semen collection. Questionnaire on tap water use. | Cross-sectional | Sperm quality | Positive: Association with some reduced semen quality parameters but no clear dose-response pattern. | Non-random; single spot morning urine sample; questionnaire on water exposure. | Zeng et al., 2014 |
| Reproduction | DCAA and TCAA in urine | China: Wuhan Tongji Reproductive and Environmental cohort | 1 230reproductive-aged men | Urinary DCAA and TCAA as internal biomarkers of DBP exposures; up to 3 specimens from different time points. | Cross-sectional | Sperm motility | Inversely associated with sperm motility. | Biomarkers rather than direct exposure through drinking water; more observable among leaner men. | Zhang et al., 2024 |
| Reproduction | DCAA and TCAA in urine | China: Wuhan Tongji Reproductive and Environmental cohort | 1 048 women undergoing assisted reproductive technology treatment | Quartiles of urinary DCAA and TCAA among women undergoing in vitro fertilization. | Prospective cohort | Fertilization | Associated with reduced numbers of oocytes and, for DCAA, decreased proportions of successful implantation, clinical pregnancy and live birth. | Biomarkers rather than direct exposure through drinking water. | Deng et al., 2023 |
| Reproduction | HAAs and THMs | USA: 3 sites | 236 women | Distribution system weekly average linked to personal questionnaire data on water intake and residence. | Prospective cohort | Time to pregnancy | Negative: No increase in time to pregnancy. | Differences in age, ethnicity, education,and incomeacross the 3 sites; exposure period unclear. | MacLehose et al., 2008 |
| Development - Fetal growth | TCAA and THMs | France: PELAGIE cohort | 174 or 114 cases, 399 controls. Pregnant women. | Drinking water. Only measured THM levels in water but looked at urinary TCAA in early pregnancy. | Nested case control | IUGR; preterm birth | Positive: association. | Urinary TCAA results from 1st trimester; no water TCAA measured. | Costet et al., 2012 |
| Development - Fetal growth | HAAs total and individual | USA: Arizona | 48 119 pregnant women; 3 760 IUGR and 8 59 LBW | Measured quarterly in 3 water facilities, averaged over the 3rd trimester and assigned to zip code of residence listed in birth records. | Retrospective cohort | LBW, IUGR and preterm birth | Positive: associations with LBW and IUGR. | No personal interviews; data from birth records; only term births included; increases in ORs are small. | Hinckley et al., 2005 |
| Development - Fetal growth | HAAs and THMs | USA: 3 communities | 1 958 SGA1 854 term BW2 039 duration of gestation | Drinking water: distribution system wide weekly average concentrations linked to telephone interview data on residences and water intake. | Prospective cohort | SGA, BW and duration of gestation | No association. | Few details on selection; no adjustments for smoking; not all statistical analysis provided. | Hoffman et al., 2008a, 2008b |
| Development - Fetal growth | HAAs and THMs | USA; Includes 2 of the 3 sitesin Hoffman et al., 2008a | 31 008 births; 1 543 SGA; 2 075 preterm | Weekly collection of drinking water at distribution centre in two cities. Levels of DBPs were below regulated levels (THM < 80, HAA5 < 60). Used public birth information. | Prospective | SGA and preterm birth. | Negative: No association. | No personal interviews; data from birth records; only term births; exposure 2nd trimester. | Horton et al., 2011 |
| Development - Fetal growth | HAAs total and individual | Canada: Quebec City | 571 newborn cases and 1 925 term controls | Drinking water exposure (monthly sampling at 46 sites and questionnaire on water consumption) during 3rd trimester of pregnancy. | Case- Control | SGA | Positive: HAA5, HAA9 (> 60 µg/L) and TCAA (> 17.48 µg/L). Negative: DCAA, but significant for ingestion only exposure > 14.80 µg/L. | Data from birth records; exposure 3rdtrimester; potential interaction with cytochrome p450 polymorphisms. | Levallois et al., 2012 |
| Development - Fetal growth | HAAs + THMs | Canada: Quebec City. 53 sites within the 16 water distribution systems serving the residence of participants | 1 549 mothers 1 455 children | Exposure assessment of mothers during the last trimester of their pregnancy was based on the estimation of concentrations of these chemicals in the tap water of residence of mothers in their last trimester during that period and on the amount of water consumed. | Case-control | IUGR | Negative: No association. | Previously positive associations not replicated. | Levallois et al., 2016 |
| Development - Fetal growth | TCAA | South Africa | 205 pregnant women | Levels in urine and questionnaire. | Cross-sectional | Premature birth, SGA and LBW | Negative: No statistically significant association. | One-time urine biomarker sample not valid for exposure during entire pregnancy; biomarker does not represent other DBPs; TCAA could be due to sources other than drinking water. | Mashau et al., 2019 |
| Development - Fetal growth | HAAs total and individual and THMs | USA: Maryland | 15 315 births; 1 114 IUGR | Monthly HAA concentrations at 4 sampling points from local water utility. | Retrospective cohort | IUGR | No consistent, dose-response or statistically significant effect on IUGR with any of the chlorine DBP. Potential for slightly elevated risk of IUGR during the 2nd and 3rd trimesters for total THMs and HAA5. | Data from birth certificates;variations in HAA levels; exposure: whole pregnancy average and each trimester. | Porter et al., 2005 |
| Development - Fetal growth | HAAs; THMs | USA: Massachusetts | 68 409 SGA;370 136 preterm births | Quarterly town averages of public water system, linked to addresses. | Retrospective cohort | SGA, mean birth weight, and preterm delivery. | Negative. Not statistically significant after adjustments. | Exposure: 2ndand 3rd trimesters; adjustments: source and disinfection not clear. | Rivera-Nunez and Wright, 2013 |
| Development - Fetal growth | HAA5. THMs and THMs + HAA | England: Bradford Cohort | 7 438 term singleton infants | Water monitoring data linked to personal questionnaire to develop exposure models. | Prospective cohort | Low mean birth weight | Negative: HAA ingestion alone or with THM. | Data from clinical records; majorchanges in results areseen after statisticaladjustments;only 3 HAAs had data points for modelling. | Smith et al., 2016 |
| Development - Fetal growth | HAAs (DCAA and TCAA) and THMs | China: Xiaogan City | 1 660 mothers | Biomarkers: THMs in blood and HAAs in urine. | Retrospective cohort | SGA, LBW, and preterm birth | Negative. Not associated with birth outcomes. | Birth outcomes from medical records. Biomarkers in single urine measure not representative of HAA in drinking water exposure. | Sun et al., 2020 |
| Development - Fetal growth | HAAs | USA: Massachusetts | 194 827 births; 17 359 SGA;11 580 preterm | Weekly to quarterly HAA monitoring data; town averages linked to subject residences. | Retrospective cohort | SGA | No association. | Exposure: 3rd trimester;data from birth records; age basedon clinician estimate. | Wright et al., 2004 |
| Development – other (inc. defects, pregnancy loss and hypospadias) | HAAs and THMs | USA: Massachusetts (113 towns) | 366 craniofacial birth defects cases, 10 controls to each case. | Public water system data and DBP concentrations based on quarterly sampling of public water system and birth records by town of birth. | Case–control | Defects: Craniofacial | Positive: Elevated though imprecise associations for eye defects and cleft palate with HAA5, TCAA and DCAA. | Information on co-variatesobtained from birth recordsor census data; exposure: 1st trimester. | Kaufman et al., 2018 |
| Development – other (inc. defects, pregnancy loss and hypospadias) | HAA5 and THMs | USA: Massachusetts | 187 cases and 10 controls per case | Weight-averaged town-level first-trimester DBP exposures were individually assigned based on residence at birth. | Case-control | Defects: Musculoskeletal | Negative: No association. | Indirect nature of exposure data and small case numbers. | Kaufman et al., 2020 |
| Development – other (inc. defects, pregnancy loss and hypospadias) | HAAs and THMs | USA: multisite National Birth Defects Prevention Study | 680 cases (535 isolated) and 1 826 controls | Maternal interview reports, linked with DBP concentration data using maternal residential addresses and public water system monitoring data. | Case-control | Defect: Orofacial cleft | Negative. Associations were near or below unity. | Maternal individual-level exposure data will be useful. | Weyer et al., 2018 |
| Development – other (inc. defects, pregnancy loss and hypospadias) | HAAs and THMs | USA: Massachusetts | 904 cases and 9 040 controls | Assigned to individuals based on residence at birth. Based on quarterly water measurements and disinfection treatment. Averaged concentrations for the 1st trimester used. | Case-control | Defect: Cardiovascular | Positive: Associations for tetralogy of Fallot and the upper exposure categories for TCAA, DCAA, and HAA5, including positive exposure–response relationships for DCAA and HAA5. | Cases from birth defectsmonitoring program;controls randomly selectedfrom all live births; exposure: 1st trimester. | Wright et al., 2017 |
| Development – other (inc. defects, pregnancy loss and hypospadias) | HAAs total and individual | Canada: Nova Scotia; Ontario | 112 cases and 398 controls | Estimates of daily exposure based on household water samples and questionnaire information on water consumption. | Case-control | Pregnancy loss | Negative: No association. | HAA and THM levels highlycorrelated;exposure period unclear. | King et al., 2005 |
| Development – other (inc. defects, pregnancy loss and hypospadias) | HAAs | USA: 3 sites | 2 409 pregnant women; 258 pregnancy losses | Distribution system weekly average linked to personal questionnaire data on water intake and residence. | Prospective cohort | Pregnancy loss | Inconsistent dose-response patterns. | Co-variate data from subject interviews; site differences in ethnicityand education; pregnancy loss not welldefined; exposure period: 3–8 weeks of pregnancy. | Savitz et al., 2006 |
| Development – other (inc. defects, pregnancy loss and hypospadias) | HAAs and THMs | USA: Massachusetts | 2 460 stillbirth cases; 10 controls per case | Drinking water: Quarterly THM and HAA5 town-level drinking water data. | Case-control | Pregnancy loss | Positive: Associations for stillbirths and upper DCAA quartiles and upper four HAA5 quintiles. No evidence of exposure–response relationships for any categorical DBP metrics. | Exposure period: 2nd and 3rd trimesters; adjustments for “source” and “disinfection” are unclear. | Rivera-Nunez et al., 2018 |
| Development – other (inc. defects, pregnancy loss and hypospadias) | HAAs and THMs | USA: Arkansas | 320 cases, 614 controls | Monitoring data from water treatment systems and usage questionnaire. | Case-control | Hypospadias | Negative: No increase risk and no clear associations or dose-response patterns after adjustments. | Exposure: 6–16 weeks of pregnancy;authors: fewer cases than expected and some cases may have been diagnosed out of study region. | Luben et al., 2008 |
| Development – other (inc. defects, pregnancy loss and hypospadias) | HAAs and THMs | USA: multisite National Birth Defects Prevention Study | 324 cases and 889 controls | Maternal behaviours related to water use. | Case-control | Hypospadias | Negative: No associations. | Estimates of exposure. | Zaganjor et al., 2020 |
| BW – birth weight; DBP – disinfection by-product; DCAA – dichloroacetic acid; IUGR – intrauterine growth retardation; HAAs – haloacetic acids; HAA5 – sum of monochloroacetic acid,, DCAA, TCAA, monobromoacetic acid and dibromoacetic acid; LBW – low birth weight; SGA – Small for gestational age; SNP single nucleotide polymorphism; TCAA – trichloroacetic acid; THM – trihalomethane; USA – United States of America. | |||||||||
Appendix E : Database for Oral Toxicity of HAAs in Experimental Animals
| HAA | Rat LD50 (mg/kg) |
Mouse LD50 (mg/kg) |
Other LD50 (mg/kg) |
Clinical observations | Reference |
|---|---|---|---|---|---|
| MCAA - neutralized | 76–580 | 165–255 | 80Guinea pig | Apathy, rapid weight loss, narcosis. | Woodard et al., 1941Table E1 Footnote *; Morrison, 1946; Maksimov and Dubinina, 1974 |
| MCAA -un-neutralized | 55–225 | Not available | Not available | Mobility problems, coma, clonic and tonic convulsions. | Maksimov and Dubinina, 1974; Saghir and Rozman, 2003 |
| DCAA - neutralized | 2 820–4 480 | 4 100–5 520 | Not available | Narcosis | Woodard et al., 1941Table E1 Footnote *; Smyth et al., 1951; Yount et al., 1982 |
| TCAA - neutralized | 3 200–5 000 | 4 970–5 640 | Not available | Narcosis | Woodard et al., 1941Table E1 Footnote *; Bailey and White, 1965 |
| TCAA -un-neutralized | Not available | 1 000 | >1 000 Dog | Emesis | Traina et al., 1977; Miyagawa et al., 1995 |
| MBAA - neutralized | 177 | 100 | Not available | Excessive drinking water intake, hypomobility, laboured breathing, mild diarrhea. | Morrison, 1946; Linder et al., 1994a |
| DBAA - neutralized | 1 737 | Not available | Not available | Excessive drinking water intake, hypomobility, respiratory depression, laboured breathing, mild diarrhea, ataxia; misshapen epididymal sperm and abnormal retention of Step 19 spermatids. | Linder et al., 1994a |
| MIAA | 60–147 | 63 | Not available | Not available | Hayes et al., 1973; Fuhrman et al., 1955 |
|
|||||
Studies in experimental animals exposed orally to HAAs. Subchronic and Chronic studies: > 1 month of exposure to haloacetic acids (HAAs). Only statistically significant effects are reported in this table. Since studies were limited, studies using at least two doses were included. See Table E4 for further details on the carcinogenicity studies. Key studies are labelled under the Reference Column (see Section 2.5 selection of key study and Section 3.0 derivation of HBV). |
||||
| HAA | NOAEL/LOAEL (mg/kg bw per day) | Method | Critical effect(s)(mg HAA/kg bw per day) | Reference |
|---|---|---|---|---|
MCAA |
3.5/26.1 |
Rats, F344/N (50 males/dose) given neutralized MCAA at 0.05, 0.5 or 2.0 g/L (3.5, 26.1 or 59.9 mg/kg bw per day) in drinking water for 104 weeks; top dose lowered to 1.5 (at 8 weeks) to 1 (at 24 weeks) g/L due to severe inhibition of bw gain. |
≥ 26.1: decreased absolute and relative liver weights and absolute kidney weights; increased relative testes weight; depressed growth rates; decreased drinking water intake. 59.9: increased myocardial degeneration; decreased body weight Note: No evidence of hepatic neoplasia or changes in liver pathology or AST and ALT. No change in peroxisome proliferation (as measured by cyanide-insensitive palmitoyl coenzyme A) or in rate of hepatocyte proliferation. |
DeAngelo et al. (1997) Key study |
MCAA |
ND/11 |
Rats, F344/N (70/sex/dose) gavaged with un-neutralized MCAA at 15 or 30 mg/kg bw per day, 5 days per week for 104 weeks (11 and 21 mg/kg bw per day). |
≥ 11: decreased survival in females 21: decreased survival in males No evidence of carcinogenic activity. Note: Only two doses; organ weight changes observed at 6 months were not seen later; myocardial lesions were not seen despite being seen in 13-week study; decreased survival caused by increased natural deaths and moribund animals with no cause identified. |
NTP (1992) |
MCAA |
ND/30 |
Rats, F344/N (20/sex/dose) gavaged with un-neutralized MCAA at 30, 60, 90, 120 or 150 mg/kg bw per day, 5 days per week for 13 weeks. Note: Organ weights (absolute/relative) were provided for 60 mg/kg bw per day or less only. |
Males ≥ 30: increased relative kidney and liver weights 60: decreased absolute and relative heart weights; increased absolute liver and adrenal weights ≥ 90: increased BUN; increased ChE; increased T4 150: increased ALT and AST levels Females ≥ 30: decreased relative heart weights 60: increased relative liver weight; increased ALT; decreased absolute heart weights; ≥ 60: increased BUN; ≥ 120: increased ALT; 150: increased AST Both ≥ 60: increased cardiomyopathy increased relative liver weights ≥ 90: decreased survival; increased segmented neutrophils Note: Sialodacryoadenitis virus were present in both dosed and control rats. T4 changes could be related to caloric deprivation due to inhibition of the TCA cycle, as there was no change to T3. |
Bryant et al. (1992); NTP (1992) |
MCAA |
ND/15 |
Rats, Sprague-Dawley (10/sex/dose) gavaged with neutralized MCAA at 15, 30, 60 or 120 mg/kg bw per day for 90 days. Note: No statistics were performed on males at 120 mg/kg bw per day due to high mortality. |
Males ≥ 15: pale, yellow-coloured livers; increased creatinine 15 and 30: increased BUN, ALT; increased relative testes weights 60: increased chronic nephropathy 120: increased mortality Females ≥ 30: increased white blood cell counts ≥ 60: increased segmented neutrophils; pale, yellow-coloured livers 120: increased absolute liver and kidney weights; increased inorganic phosphorus, BUN, AST and ALT Both 60: increased relative liver and kidney weights 120: increased mortality |
Daniel et al. (1991) |
MCAA |
36/71 |
Mice, B6C3F1 (60/sex/dose) gavaged with un-neutralized MCAA at 50 or 100 mg/kg bw per day (36 and 71 mg/kg bw per day), 5 days per week for 104 weeks. |
Males 71: increased mortality Females 71: decreased mean body weight Both 71: forestomach squamous cell hyperplasia. No evidence of carcinogenic activity. |
NTP (1992) |
MCAA |
100/150 |
Mice, B6C3F1 (20/sex/dose) gavaged with un-neutralized MCAA at 25, 50, 100, 150 or 200 mg/kg bw per day 5 days per week for 13 weeks. |
Females ≥ 150: decreased liver ChE in females 200: decreased final mean body weight and mean weight gain; increased relative and absolute liver weights Both sexes 200: increased deaths; mice that died had increased incidence and severity of cardiomyopathy and increased hepatocellular cytoplasmic vacuolization Note: No change in hematologic or clinical pathology parameters. No evidence of peroxisome proliferation in liver. Statistically significant changes in organ weight to body weight ratios were not dose-dependent. |
Bryant et al. (1992); NTP (1992) |
DCAA |
3.9/35.5 |
Rats, male Sprague-Dawley (10/dose) given neutralized DCAA at 50, 500, 5 000 ppm (calculated as 3.9, 35.5 or 345 mg/kg bw per day) in drinking water for 90 days. |
≥ 35.5: decreased final body weights; increased relative kidney and liver weight; increased alkaline phosphatase; decreased water consumption 345: increased absolute liver weight with microscopic hepatocellular enlargement, intracellular swelling and glycogen accumulation; liver enlargement; increased relative spleen weight; increased ALT levels; elevated peroxisomal beta-oxidation activity; renal tubular epithelium and glomeruli cell degeneration Note: No effects on immune system; no histopathological changes in spleen. |
Mather et al. (1990) |
DCAA |
3.6/40.2 |
Study 1: Rats, male F344 (50–78/dose) given neutralized DCAA at 0.05, 0.5 and 5.0* g/L (3.6, 40.2 mg/kg bw per day) in drinking water for 100 weeks (*due to neuropathy, high dose lowered to 1 g/L by 52 weeks and stopped at 60 weeks). Study 2: Rats, 78 male F344 given neutralized DCAA at 2.5 g/L (139.1 mg/kg bw per day) in drinking water for 103 weeks (dose lowered to 1 g/L by 26 weeks). Control groups given 2 g/L of sodium chloride. |
Study 1 40.2: mildly increased relative and absolute testes weight; increased incidences of hepatocellular neoplasia and proliferative lesions Study 2 139.1: decreased absolute testes and final body weights; decreased relative kidney and liver weights; increased incidences of hepatocellular carcinomas, neoplasia and proliferative lesions. Note: No significant differences in animal survival between any of the control and treatment groups. Unscheduled deaths were due to mononuclear cell leukemia. No changes in absolute and relative kidney, liver or spleen weights in Study 1. Note: Although DCA was a hepatocellular carcinogen in male F344 rats, the concurrent observations of high mortality and tumour incidences at the highest dose decrease the sensitivity of the study making it unsuitable as a critical study for carcinogenesis. |
DeAngelo et al. (1996) |
DCAA |
ND/26 |
Rats, male Long-Evans, gavaged with 31.25, 62.5 or 125 mg NaDCAA/kg bw per day (26, 53, and 106 mg DCAA /kg bw per day) for 10 weeks. |
≥ 26: decreased weight gain; decreased absolute epididymis and preputial gland weights; increased relative liver weights ≥ 53: decreased final body weights; decreased relative epididymis and preputial gland weights; decreased cauda epididymis weight; decreased cauda epididymal sperm counts; decreased percentage normal intact sperm; increased relative kidney and spleen weights; decreased sperm motility; increased absolute liver weights; retention of late-step spermatids (stage 9); altered sperm parameters 106: increased relative weight of testes; decreased prostate and seminal vesicles weight; retention of step 19 spermatids into stage 10 seminiferous tubules; decreased number of live implants per untreated dam. |
Toth et al. (1992) |
DCAA |
54/160 |
Rats, male Harlan Sprague-Dawley (8/dose) gavaged with 18, 54, 160, 480, 1 440 mg (pH-adjusted) DCAA/kg bw per day for 14 days. |
≥ 160: decreased cauda sperm count; increased percentage of abnormal cauda sperm; decreased cauda and caput sperm motility; decreased mean body weight gain ≥ 480: increased percentage of abnormal caput sperm; retained Step 19 spermatids; decreased epididymis weight; decreased body weights 1440: atypical residual bodies in all stages; decreased caput sperm counts Note: No change in testosterone levels, testis and epididymis weights or sperm production. |
Linder et al. (1997a) |
DCAA |
ND/107 |
Rats, Sprague-Dawley (10/sex/dose) gavaged with DCAA as sodium salt at 125, 500, 2 000 mg/kg bw per day (107, 427, 1 708 mg DCAA/kg bw per day) for 3 months; plus 5 rats/sex for control and high dose for 4-week recovery. |
Males: 427: increased relative adrenal weights ≥ 427: testicular germinal epithelial degeneration 1 708: small testes; aspermatogenesis Females: ≥ 107: increased kidney weights 1 708: increased relative adrenal weights Both: ≥ 107: suppressed erythroid parameters; brain lesions; decreased growth and food intake; increased relative liver weights 1 708: high mortality, hindlimb paralysis, pollakiuria Recovery: persistence of small testes and aspermatogenesis in males and of brain lesions; reversal of pollakiuria, hind limb paralysis and depressed growth; return to normal erythroid parameters and organ weights Note: Histologically normal bone marrow and spleens in treated animals. |
Katz et al. (1981) |
DCAA |
ND/140 |
Mice, B6C3F1 (15 males/dose; 10 females/dose) neutralized DCAA in drinking water males given 1, 2 g/L (140, 300 mg/kg bw per day) for 37 with sacrifice at 52 weeks; females given 2 g/L (480 mg/kg bw per day) for 52 weeks. |
Males ≥ 140: increased relative liver weight; increased hepatoproliferative lesions (hyperplastic nodules, adenomas, carcinomas); glycogen accumulation in hepatocytes Females 480: increased liver weights |
Bull et al. (1990); OEHHA (2022) |
DCAA |
7.6/77 |
Mice, male B6C3F1 (50/dose) given pH adjusted DCAA at 0.05, 0.5, 3.5, 5 g/L (7.6, 77, 410, 486 mg/kg bw per day) in drinking water for 60 or 75 weeks. |
≥ 77: increased final relative liver weights ≥ 410: increased incidence of liver neoplasia and hyperplastic nodules; decreased final body weights; decreased drinking water intake; increased relative kidney weights at 410 mg/kg bw per day only Note: No effect on survival; no changes in relative testes or spleen weights. DCA was carcinogenic with a threshold concentrate of at least 0.5 g/L (77 mg/kg bw per day). |
DeAngelo et al. (1991) |
DCAA |
ND/7.7 |
Mice, male B6C3F1 (7/dose) gavaged with 7.7, 77, 154, 410 mg DCAA/kg bw per day for 4 or 13 weeks. |
4 weeks: ≥ 7.7: increased LP and SA production in hepatic tissues; increased MPO in PLCs ≥ 77: increased SA production in PLCs; increased DNA SSBs in hepatic tissues; increased SOD activity in PLCs; TNF-α production in PLCs 13 weeks: 7.7–154: increased SA production in hepatic tissues and in PLCs; increased LP production in hepatic tissues; increased MPO activity in PLCs; increased TNF-α production in PLCs ≥ 7.7: increased LP and SA production and SSBs in hepatic tissues; increased SOD activity in PLCs 410: hepatomegaly; increased absolute and relative liver weight Note: Both dosing periods resulted in similar effects on SA, LP and SSBs in hepatic tissues although severity was greater following 13 weeks of dosing; effects following 4 weeks of dosing were not always statistically significant. Oxidative stress and markers considered initial events that may lead to liver toxicity/carcinogenicity. |
Hassoun et al. (2010a, 2010b) |
DCAA |
ND/12.5 |
Dogs, beagle (5/sex/dose), given neutralized DCAA orally in gelatin capsules at 12.5, 39.5, 72 mg/kg bw per day for 90 days. |
Males: ≥ 12.5: increased relative liver weight (at low and mid-dose only); testicular degeneration 72: decreased absolute heart weight; increased lactate dehydrogenase Females: ≥ 12.5: increased absolute liver weights 72: increased absolute kidney and lung weights Both: ≥ 12.5: increased relative liver weights; mild microscopic changes in brain and gallbladder; histopathological changes in pancreas; eye effects ≥ 39.5: hemosiderosis; dyspnea; increased relative kidney weights; diarrhea 72: hematological changes; partial paralysis of hindlimbs; increased relative lung weights; increased relative brain weights; gross histopathological changes of the lungs, liver, kidney, pancreas and gall bladder Note: No change in ovary or testes weights. |
Cicmanec et al. (1991) |
DCAA |
ND/50 |
Dogs (3/sex/dose) given capsules containing 50, 75, 100 mg DCAA/kg bw per day for 3 months; additional 1 dog/sex for control and high dose for 5-week recovery. |
≥ 50: ocular anomalies; brain lesions; liver effects; gall bladder effects; weight loss; suppressed erythroid parameters; altered blood chemistry (pyruvate, lactate, glucose); prostate glandular atrophy, testicular changes Females: ≥ 50: decreased appetite Both: ≥ 75: emesis 100: bloody stool; paralysis Recovery: normal prostate; normal blood chemistry; improved erythroid parameters; persistent brain lesions and liver and gall bladder effects; improved ocular effects but lenticular opacities persisted |
Katz et al. (1981) |
DCAA |
Study 1 ND/900 Study 2 ND/14 |
Rats, female Long-Evans hooded (19–20/dose) gavaged with 0, 900, 1 400, 1 900 or 2 400 mg DCAA/kg bw per day from GD 6–15 for study 1 and with 0, 14, 140 or 400 mg DCAA/kg bw per day from GD 6–15 for study 2 Note: *DCA was pH-adjusted and calculated as free acid. |
Study 1 Maternal ≥ 900: increased relative liver weights; decreased body weights and body weight gains ≥ 1 900: dose-dependent maternal deaths Fetal ≥ 900: decreased crown-rump length; decreased fetal body weights; increased incidence of total soft tissue and cardiovascular malformations (high interventricular septal defects) 900–1 900: increased incidence of orbital malformations ≥ 1 400: increased incidence of urogenital malformations 2 400: decreased mean live fetuses per litter; increased male/female sex ratio Study 2 Maternal ≥ 14: increased relative liver weight ≥ 140: decreased weight gain 400: increased relative kidney and spleen weights Fetal ≥ 140: increased incidence of total soft tissue malformations 400: decreased total implants per litter; decreased crown-rump length; decreased fetal body weights; increased incidence of cardiovascular malformations (high interventricular septal defects) Note: No effect on number of viable litters in either study. No skeletal malformations. |
Smith et al. (1992) |
DCAA |
ND/ND |
Rats, pregnant Long-Evans (7–10/ group) gavaged with neutralized DCAA at 1 900 (GD 6–8, 9–11, 12–15, 6–15), 2 400 (single dose on GD 10–13) or 3 500 (single dose on GD 9–13) mg/kg bw per day. |
Fetal 1 900: GD 6–8: decreased fetal weight GD 9–11, 12–15: heart defects 2 400: heart defects in groups treated on GD 10 and 12 3 500: heart defects in groups treated on GD 9, 10 and 12 |
Epstein et al. (1992) |
DCAA |
Initial study ND/140 Repeat study ND/14 - maternal toxicity 14/140 -developmental |
Rats, pregnant Long-Evans given 140, 400, 900, 1 400 or 2 400 mg DCAA/kg bw per day from GD 6–15; repeat study used 14, 140, 400 mg/kg bw per day. |
Initial study ≥ 140: cardiovascular malformations in fetuses in presence of maternal toxicity (reduced maternal weight gain) Repeat study ≥ 14: increased maternal relative organ weights (liver, spleen, kidney) ≥ 140: reduced maternal weight gain; increased total fetal soft tissues malformations 400: decreased mean fetal weight and length; increased fetal cardiovascular malformations (predominantly defects between ascending aorta and right ventricle) |
Randall et al. (1991a) (abstract only) |
TCAA |
7.7/77 |
Mice, male B6C3F1 (7/dose) gavaged with 7.7, 77, 154 or 410 mg TCAA/kg bw per day for 4 or 13 weeks. |
4 weeks ≥ 7.7: increased MPO activity in PLCs ≥ 77: increased LP production in hepatic tissues and in PLCs; increased DNA SSBs in hepatic tissues; increased SA production in liver cells, increased SOD activity and TNF-α production in PLCs ≥ 154: increased SA production in hepatic tissues 13 weeks ≥ 7.7: increased SA and lipid peroxidation production in hepatic tissues; increased SOD activity in PLCs 77–154: increased MPO activity PLCs ≥ 77: increased SSBs in hepatic tissues; increased TNF-α production in PLCs Note: Effects were similar regardless of dosing period although severity was greater following 13 weeks of dosing. Biomarkers used to measure phagocytic activation included MPO, SA, SOD and TNF-α. |
Hassoun et al. (2010a, 2010b) |
TCAA |
ND/6 |
Study 1 Mice, male B6C3F1 (35/dose) given neutralized TCAA at 0.05, 0.5 or 5 g/L (calculated as 8, 68 or 602 mg/kg bw per day) in drinking water for up to 60 weeks Study 2 Mice, male B6C3F1 (35/dose) given neutralized TCAA at 4.5 g/L (calculated as 575 mg/kg bw per day) in drinking water for up to 104 weeks Study 3 Mice, male B6C3F1 (72/dose) given neutralized TCAA at 0.05 or 0.5 g/L (calculated as 6 or 58 mg/kg bw per day) in drinking water for up to 104 weeks. |
Study 1 ≥ 8: increased severity of non-neoplastic lesions (centrolobular cytoplasmic alteration); increased incidence of hepatic inflammation ≥ 68: increased hepatic peroxisome proliferation (increased cyanide-insensitive palmitoyl coenzyme A oxidase activity-PCO); increased absolute and relative liver weights; increased prevalence and multiplicity of adenomas; increased prevalence and multiplicity of either adenomas or carcinomas 602: decreased terminal body weight; increased incidence of centrolobular cytoplasmic alteration; increased hepatocyte proliferation; increased prevalence and multiplicity of adenomas, carcinomas Study 2 575: increased hepatic peroxisome proliferation (increased cyanide-insensitive palmitoyl coenzyme A oxidase activity); increased hepatocyte proliferation; increased prevalence and multiplicity of adenomas, carcinomas and either adenomas or carcinomas Study 3 ≥ 6: increased percentage of large foci of cellular alteration in liver 58: increased neoplastic lesions (adenomas, carcinomas and either adenomas or carcinomas) |
DeAngelo et al. (2008) Key study |
TCAA |
ND/25 |
Mice, male B6C3F1 (20/dose) given neutralized TCAA at 0.1, 0.5 or 2.0 g/L (calculated as 25, 125, or 500 mg/kg bw per day) in drinking water for 3 or 10 weeks. |
≥ 25: increased relative liver weight; increased peroxisome proliferation (measured by cyanide-insensitive acyl-CoA oxidase or Acyl-CoA activity) ≥ 125: increased absolute liver weight 500: transient decreased body weight; increased 12-hydroxylation/11-hydroxylation of laurate Note: Despite inducing peroxisome proliferation, TCAA does not cause oxidative damage to genomic DNA following prolonged treatment. |
Parrish et al. (1996) |
TCAA |
ND/54.6 |
Mice, male B6C3F1 (20/dose) given neutralized TCAA at 0.5 or 2 g/L (calculated as 54.6 or 237.5 mg/kg bw per day) in drinking water for 52 weeks with an additional 35 weeks of treatment for low dose group. |
> 54.6: increased hepatocellular adenomas and combined hepatocellular adenomas and carcinomas Note: No effect on survival. |
Bull et al. (2002) |
TCAA |
ND/75 |
Mice, male B6C3F1 (5/dose) given neutralized TCAA at 0.3, 1 or 3 g/L (calculated as 75, 250 or 750 mg/kg bw per day) in drinking water for 12 weeks. |
75: increased relative liver weights; decreased liver glycogen content ≥ 250: increased absolute liver weights |
Kato-Weinstein et al. (2001) |
TCAA |
ND/164 |
Mice, B6C3F1 (11-24 males/dose; 10 females/dose) neutralized TCAA in drinking water males given 1 or 2 g/L (calculated as 164 or 329 mg/kg bw per day) for 37 weeks with sacrifice at 52 weeks; females given 2 g/L (482 mg/kg bw per day) for 52 weeks. |
Males ≥ 164: increased incidence of hepatoproliferative lesions; increased absolute and relative liver weights Females 482: increased absolute and relative liver weights Note: No effect on kidney weights or body weights. Reversal of liver weight in males during recovery period. |
Bull et al. (1990) |
TCAA |
32.5/364 |
Rats, male F344 (50 /dose) given neutralized TCAA 0.05, 0.5 or 5.0 g/L (calculated as 3.6, 32.5, 364 mg/kg bw per day) in drinking water for 104 weeks. |
364: mild hepatocellular necrosis; depressed growth rate; decreased absolute liver weight; increased ALT levels; increased peroxisome proliferation in livers; increased palmitoyl CoA activity Note: No changes in absolute and relative organ weights (kidney, spleen, testes) were seen. No increase in deaths, hepatocyte proliferation, hepatocellular tumours or prevalence of neoplasms were seen. Non-neoplastic hepatic alterations were spontaneous and age-related. |
DeAngelo et al. (1997) |
TCAA |
36.5/355.0 |
Rats, male Sprague-Dawley (10/dose) given neutralized TCAA 50, 500 or 5 000 ppm (calculated as 4.1, 36.5 or 355.0 kg bw per day) in drinking water for 90 days. |
≥ 36.5: decreased water consumption 355.0: increased relative liver weight with microscopic hepatocellular enlargement, intracellular swelling and glycogen accumulation; elevated peroxisomal beta-oxidation activity; increased relative kidney weight Note: Decreased body weights were not statistically significant; absolute spleen weights were decreased at the lowest and highest doses but not the middle dose; no effect on immune system, organ weights or serum chemistry; normal tissues seen in spleen, thymus, testis, brain, heart, lung, thymus, pancreas, adrenals, lymph nodes, GI track, bladder, skin, muscle. |
Mather et al. (1990) |
TCAA |
ND/330 |
Rats, female Long-Evans (20–26/dose) gavaged with pH adjusted TCAA at 330, 800, 1 200 or 1 800 mg/kg bw per day (as free acid) on GD 6–15. |
Maternal ≥ 330: increased kidney and spleen weights; decreased body weight ≥ 800: decreased percent weight gain; increased mean implants per litter; increased percent post-implantation loss ≥ 1 200: decreased mean live fetuses per litter; increased number of totally resorbed litters; decreased number of viable litters Fetal ≥ 330: decreased crown-rump lengths; decreased body weights; increased total soft tissue external malformations and cardiovascular (interventricular septal defects, levocardia) ≥ 800: increased embryo lethality ≥ 1 200: increased skeletal and orbital malformations Note: No maternal deaths or overt toxicity were seen; no affect on pregnancy rates, no affect on maternal liver weights; no effect on fetal male/female sex ratio. |
Smith et al. (1989) |
TCAA |
ND/1000 |
Rats, pregnant Charles Foster (25/dose) gavaged with neutralized TCAA at 1 000, 1 200, 1 400, 1 600 or 1 800 mg/kg bw per day on GD 6–15 Note: A top dose of 2000 mg/kg bw per day was dropped due to 100% implantation loss. |
Maternal ≥ 1 000: increased percentage of post-implantation loss ≥ 1 200: decreased maternal weight gain ≥ 1 400: decreased ovarian weight; decreased number of oocytes and increased vacuolar spaces in ovary Fetal ≥ 1 000: decreased fetal weight; increased percentage of hydrocephalus and percent of brain vacuolation ≥ 1 200: increased average frequency per litter of total brain lesions; decreased fetal brain weight; increased neuronal death; increased percentage of brain hemorrhages ≥ 1 400: decreased fetal whole brain length 1 800: decreased ovarian weight. |
Singh et al. (2005, 2006) |
MBAA |
50/100 |
Rats, pregnant Long Evans, gavaged with MBAA at 25, 50 or 100 mg/kg bw per day from GD 6–15. |
100: decreased maternal weight gain, 1 maternal death; smaller fetuses; increased fetal malformations (cardiovascular and craniofacial) Note: No effect on reproduction (that is, mean number of resorbed implants/litter). |
Randall et al. (1991b) (abstract only) |
DBAA |
2/20 |
Rats, F344/N (50/sex/dose) given pH-adjusted DBAA at 50, 500 or 1 000 mg/L (calculated as 2, 20 or 40 mg/kg bw per day in males and 2, 25 or 45 mg/kg bw per day in females) in drinking water for 2 years. |
≥ 20/25: decreased mean body weights male and females 40: increased incidences of malignant mesotheliomas (males) Note: No effect on survival. Decreased body weights were associated with decreased drinking water intake. Although increased incidences of mononuclear cell leukemia occurred, it is a common, spontaneous cancer in F344 rats. |
Melnick et al. (2007) |
DBAA |
ND/2 |
Rats, F344/N (50/sex/dose) given pH-adjusted DBAA at 50, 500 or 1 000 mg/L (calculated as 2, 20 or 40 mg/kg bw per day and 2, 25 or 45 mg/kg bw day in females) in drinking water for 2 years. |
≥ 2: increased incidences of minimal to mild cystic degeneration of liver (males); increased incidences of nephropathy (females) ≥ 20/25: decreased mean body weights; increased incidences of alveolar epithelial hyperplasia in lung (females) 40/45: decreased water consumption; increased incidence of malignant mesothelioma in several organs (males); positive trend in incidence of mononuclear cell leukemia (females) Note: No effect on survival. Although increased incidences of mononuclear cell leukemia occurred, it is a common, spontaneous cancer in F344 rats. |
NTP (2007a) |
DBAA |
ND/10 |
Rats, F344/N (10/sex/dose) given pH-adjusted DBAA at 125, 250, 500, 1 000 or 2 000 mg/L (calculated as 10, 20, 40, 90 or 166 mg/kg bw per day for males and 12, 23, 48, 93 or 181 mg/kg bw per day for females) in drinking water for 3 months. |
Male ≥ 10: increased liver weights ≥ 40: increased hepatocellular vacuolization; delayed spermiation (retained spermatids) and atypical residual bodies 166: decreased testicular weights; increased testicular atrophy; hypospermia; decreased final mean body weights/body weight gains Female ≥ 12: increased liver weights; decreased final mean body weights/body weight gains 181: increased hepatocellular vacuolization Note: No effect on water consumption or survival and no clinical findings. |
Melnick et al. (2007) |
DBAA |
ND/10 |
Rats, F344/N (10/sex/dose) given pH-adjusted DBAA at 125, 250, 500, 1 000 or 2 000 mg/L (calculated as 10, 20, 40, 90 or 166 mg/kg bw per day in males and 12, 23, 48, 93, or 181 mg/kg bw per day in females) in drinking water for 3 months. |
≥ 10/12: increased relative and absolute liver weights ≥ 40/48: retained spermatids (but not at highest dose); increased incidences of hepatocellular vacuolization (males); increased relative and absolute kidney weights; delayed spermiation (retained Step 19 spermatids, retained large residual bodies) 166/181: decreased mean final body weight and body weight gain (both sexes); decreased water consumption; testicular atrophy and hypospermia; decreased sperm motility; decreased absolute and relative testes weights; increased incidences of pituitary gland cellular hypertrophy (males); increased incidences of hepatocellular vacuolization (females); hematopoietic cell proliferation in spleen (females); decreased absolute (both sexes) heart weights; decreased absolute thymus weight Note: No mortalities associated with treatment. Minimally impaired erythropoiesis at 1000 mg/L. Treatment-related histopathological changes were noted in the liver, pituitary gland, epididymis, testes and spleen but not in the kidney, heart, lung or thymus. |
NTP (2007a) |
DBAA |
ND/20 |
Rats, F344 (12/sex/dose) given DBAA at 0.2, 0.6 or 1.5 g/L (calculated as 20, 72 or 161 mg/kg bw per day) in drinking water for 6 months with functional observational battery/motor activity testing at 0, 1, 2, 4 and 6 months. |
≥ 20: diarrhea (males); decreased sensorimotor responsiveness ≥ 72: neuromuscular toxicity (limb weakness, gait abnormalities, hypotonia); diarrhea (females); degeneration of spinal cord and presence of cellular vacuolation 161: decreased body weight; decreased motor activity Note: Neurotoxicity was present at 1 month, but continued exposure did not increase its severity. There were no differences related to sex, so data was combined for analyses. |
Moser et al. (2004) |
DBAA |
ND/4 |
Mice, B6C3F1 (50/sex/dose) given pH-adjusted DBAA at 50, 500 or 1 000 mg/L (calculated as 4, 45 or 87 mg/kg bw per day in males and 4, 35 or 65 mg/kg bw per day in females) in drinking water for 2 years. |
Male ≥ 4: increased incidence of hepatocellular adenoma or carcinoma ≥ 45: increased incidences of hepatoblastomas Female ≥ 35: increased incidence of hepatocellular adenoma or carcinoma Note: No effect on survival or mean body weights. |
Melnick et al. (2007) |
DBAA |
ND/4 |
Mice, B6C3F1 (50/sex/dose) given pH-adjusted DBAA at 50, 500 or 1 000 mg/L (calculated as 4, 45 or 87 mg/kg bw per day for males or 4, 35 or 65 mg/kg bw per day for females) in drinking water for 2 years. |
≥ 4: positive trend in incidences of liver neoplasms; increased incidences of multiple hepatocellular adenoma and hepatocellular adenoma or carcinoma (males) ≥ 35/45: increased incidences of hepatoblastoma (males); increased incidences of multiple hepatocellular adenoma and hepatocellular adenoma or carcinoma (females); positive trend in incidences of alveolar/bronchiolar adenoma 87: increased incidence of hematopoietic cell proliferation (males) Note: No effect on mortality or water consumption. |
NTP (2007a) |
DBAA |
30/56 |
Mice, B6C3F1 (10/sex/dose) given pH-adjusted DBAA at 125, 250, 500, 1 000 or 2 000 mg/L (calculated as 16, 30, 56, 115 or 230 mg/kg bw per day in males and 17, 34, 67, 132 or 260 mg/kg bw per day in females) in drinking water for 3 months. |
≥ 56/67: increased absolute liver weights (both); increased relative liver weights (females) ≥ 115/132: increased relative liver weight (males); increased hepatocellular cytoplasmic vacuolization; increased incidences of abnormal testicular morphology; increased absolute and relative lung weights (females) 230/260: decreased mean body weights (females) and body weight gains (both sexes); decreased water consumption (males); slight decreases in mean cell hemoglobin and platelet counts (males); decreased absolute (both sexes) and relative (males) heart weights; increased relative kidney weight (females) Note: All mice survived to the end of the study. No effect on testes weights. No significant increases on BrdU labeling index in liver. |
NTP (2007a) |
DBAA |
30/56 |
Mice, B6C3F1 (10/sex/dose) given pH-adjusted DBAA at 125, 250, 500, 1 000 or 2 000 mg/L (calculated as 16, 30, 56, 115 or 230 mg/kg bw per day for males and 17, 34, 88, 166 or 309 mg/kg bw per day for females) in drinking water for 3 months. |
Male ≥ 56: increased liver weights ≥ 115: delayed spermiation, atypical residual bodies 230: decreased final mean body weights/body weight gains Female ≥ 88: increased liver weights 309: decreased final mean body weights/body weight gains Note: No effect on water consumption or survival and no clinical findings. |
Melnick et al. (2007) |
DBAA |
ND/72 |
Mice, male B6C3F1 (5/dose) given neutralized DBAA at 0.3, 1 or 2 g/L (calculated as 72, 240 or 480 mg/kg bw per day) in drinking water for 12 weeks. |
≥ 72: increased liver glycogen content ≥ 240: decreased serum insulin; increased relative and absolute liver weights 480: decreased terminal body weight; decreased serum glucose |
Kato-Weinstein et al. (2001) |
DBAA |
ND/2 |
Rats, male Sprague-Dawley (8/dose) gavaged with DBAA at 2, 5, or 10 mg/kg bw per day for 14 days or 2 or 4 mg/kg bw per day (48 rats/dose) for 14 days; artificial insemination of untreated females with treated sperm. |
Range-finding 10: decreased SP22 protein in testes Definitive ≥ 2: decreased SP22 protein in testes 4: decreased fertility |
Kaydos et al. (2004) |
DBAA |
125/250 |
Rats, female Holtzman (8/dose) gavaged with DBAA at 62.5, 125, 250 or 500 mg/kg bw per day from GD 1–8 (500 dose discontinued). |
250: increased serum 17β-estradiol Note: No effect on other female reproductive measures (preimplantation losses, number of resorptions, number of pups per litter, pup weights, placental weights). |
Cummings and Hedge (1998) |
DBAA |
2/10 |
Rats, male Sprague-Dawley (6 or 10/group) gavaged with DBAA at 2, 10, 50 mg/kg bw per day for 79 days or with 250 mg/kg bw per day for 42 days (duration shortened due to high toxicity); 186-day recovery period; reproductive performance was assessed via natural insemination and artificial insemination. |
≥ 10: retention of Step 19 spermatids in Stage IX-XI ≥ 50: decreased body weight gain; moderate changes in sperm morphology and motility; decreased percent normal cauda and caput sperm; decreased epididymal sperm counts; atypical residual bodies in Stage IX; increased number of dead fetuses 250: overt neurotoxicity (awkward gait, atypical limb movement, abnormal posturing); decreased fertility via natural mating with limited recovery and via artificial insemination; declining sperm quality; decreased testicular weights; atrophic seminiferous tubules persisting into recovery Note: At 6 months post-dosing, the high-dose group showed partial recovery in testicular weights and fertility but not related to atrophic seminiferous tubules. |
Linder et al. (1995, 1997b) |
DBAA |
ND/4.4 |
Two-generation rats, Sprague-Dawley (30/sex/dose/generation) given DBAA at 50, 250 or 650 ppm (calculated as 4.4–11.6, 22.4–55.6 or 52.4–132.0 mg/kg bw per day) in drinking water for the P-generation for 92 days (males) and 120 days (females); F1 generation were exposed in utero, during lactation and then via drinking water from post-weaning, mating; exposure of F1 females continued from parturition (F2) to lactation day 22. F2 generation were exposed until lactation day 22. |
P-generation ≥ 4.4: increased absolute and relative liver and kidney weights; decreased absolute and relative adrenal weights (females) ≥ 22.4: decreased water intake; decreased viability index; retained Step 19 spermatids in Stage IX and X tubules; increased abnormal residual bodies; testicular atrophy; hypospermia 52.4: intermittent, decreased absolute and relative food intake; decreased terminal body (males) and body weight gains; clinical adverse effects (soft feces in males); increased relative spleen and pituitary weights (males); increased relative brain weights (both sexes); increased average percent morphologically abnormal sperm but were within historical controls F1 ≥ 4.4: increased absolute and relative liver and kidney weights (males) ≥ 22.4: decreased water intake; decreased pup body weights in pups consuming treated drinking water; decreased feed consumption post-weaning then increased feed consumption starting at premating period; increased number of litters with dehydrated pups; retained Step 19 spermatids in Stage IX and X tubules; increased abnormal residual bodies in affected seminiferous tubules; testicular hypoplasia and atrophy; hypospermia; clinical adverse effects in males (soft feces); decreased absolute and relative adrenal weights (males) 52.4: decreased body weight gains (females); malformations of male reproductive tract; decreased sperm motility but within historical controls; delayed sexual maturation in both sexes (delayed preputial separation and delayed vaginal patency – attributed to decreased body weight); clinical adverse effects in females; decreased body weight gains starting at weaning; increased relative brain and spleen weights (males); increased average duration of gestation (females); increased absolute spleen and thymus weights (males) F2 ≥ 22.4: decreased pup body weights in pups consuming treated drinking water; decreased anogenital distance associated with reduced body weights (males) Note: Decreased body weights and clinical signs may have been related to decreased water intake related to taste aversion. P- and F1 generation (250, 650 ppm) had clinical signs (diarrhea, dehydration) associated with decreased drinking water intake. Delayed sexual maturity (F1) was associated with a general retardation of growth (lower body weights). Food consumption was also intermittently reduced. No histopathological changes to liver or kidney at any dose/generation. Increased pup mortality seen in F1 litters was unrelated to DBA. No effect on estrous cycling, gestation length, litter size, pup sex ratios in P or F1 generations. Most changes in organ weights were associated with decreased terminal body weights. |
Christian et al. (2002) |
DBAA |
ND/10.2 |
Rats, Sprague-Dawley (56-67/sex/dose) given DBAA at 125, 250, 500 or 1 000 ppm (calculated in P adults as 10.2, 20.4, 35.7, or 66.1 mg/kg bw per day in males and 13.3–43.5, 26.2–86.6, 41.8–150.7 or 60.2–211.7 mg/kg bw per day in females and in F1 weanlings as 31.8, 58.5, 122.9 or 254.7 mg/kg bw per day in males and 33.3, 61.5, 123.8 or 241.2 mg/kg bw per day in females) in drinking water starting 14 days pre-mating, throughout gestation and lactation (63–70 days of treatment). |
P-generation ≥ 10.2/13.3: decreased body weight gain F1 ≥ 31.8: decreased body weight gain (secondary to decreased water/food intake) Note: Decreased water intake due to taste aversion in parental animals at 500 and 1000 ppm caused reduced feed intake and weight gain and dehydration. Detectable levels of DBA were found in plasma, placentas, amniotic fluid and milk. No effect on reproductive (decreased mating performance was seen at 1000 ppm but was within normal limits) or developmental parameters. No gross lesions were seen. No effects were observed on estrous cycle, pre- and post-implantation losses, live litter sizes, gross external morphology and sex ratios in pups. |
Christian et al. (2001) |
DBAA |
4-week 5/50 2-week 50/250 |
Rats, male Sprague-Dawley (6/group) gavaged with pH-adjusted DBAA at 5, 50, 250 mg/kg bw per day for 2 weeks or 5, 50 mg/kg bw per day for 4 weeks. |
4 weeks ≥ 50: increased abnormal caput and caudal sperm; retention of Step 19 spermatids 2 weeks 250: decreased mean absolute epididymal weights; decreased sperm counts and motility; altered spermiation (presence of atypical residual bodies and retention of Step 19 spermatids); increased abnormal caput and caudal sperm; narrowing of duct lumina of epididymides Note: No effect on mortality or body/testicular weights. |
Tsuchiya et al. (2000) |
DBAA |
ND/10 |
Rats, male Harlan Sprague-Dawley (8/dose) gavaged with neutralized DBAA at 10, 30, 90 or 270 mg/kg bw per day for 14 days. |
≥ 10: decreased caput sperm count; altered spermiation (retention of Step 19 spermatids in Stages IX to XII; atypical Step 15 spermatid acrosomal development) ≥ 90: decreased cauda sperm count 270: mild lethargy; histopathological changes in testes and epididymis; decreased testes and epididymis weights; increased abnormal epididymal sperm morphology; decreased epididymal sperm motility Note: No signs of toxicity or effect on body weights. |
Linder et al. (1994b) |
DBAA |
ND/66 |
Dose-finding Rats, pregnant female Sprague-Dawley (3 litters/dose) given pH-adjusted DBAA at 400, 600 or 800 ppm (calculated as 49/66, 74/99 or 99/132 mg/kg bw per day for dams/male pups) in drinking water from GD 15 to PND 21; weaned male pups (3 litters/dose) given maternal dose until PND 98; artificial insemination of untreated females. |
Male pups ≥ 66: delayed preputial separation; decreased sperm protein SP22 ≥ 99: decreased epididymis weight; increased incidence of atypical residual bodies, delayed spermiation (retention of Stage VIII spermatids) and atrophic seminiferous tubules; altered sperm motility; decreased fertility (via intrauterine insemination) 132: decreased body weight; decreased testes weight Female pups 800 ppm: delayed vaginal opening Note: Data insufficient to calculate mg/kg bw equivalent for female pups. |
Klinefelter et al. (2004) |
DBAA |
ND/0.6 |
Definitive Rats, female Sprague-Dawley (≥ 10 dams per dose; 6–10 pups/dose) given pH-adjusted DBAA at 4, 40 or 400 ppm (calculated as 0.49/0.6, 4.9/6.3 or 49/66 mg/kg bw per day dams/male pups) in drinking water from GD 15 to PND 21; weaned F1 male pups (3 litters/ dose) continued exposure until PND 56 or PND 120; artificial insemination of untreated females. |
Male pups ≥ 0.6: delayed preputial separation; decreased sperm proteins SP22 and SP38 66: decreased body weight; delayed preputial separation (in groups exposed until PND 56 and PND 120); decreased percentage of morphologically normal sperm Female pups ≥ 66: delayed vaginal opening (group exposed until PND 56 and PND 120) Note: Delays in preputial separation and vaginal opening were independent of body weight. No organ weight changes. No effect on fertility using intrauterine insemination. Data insufficient to calculate mg/kg bw equivalent for female pups. |
Klinefelter et al. (2004) |
DBAA |
ND/24 |
Mice, CD-1 gavaged with DBAA at 24, 50, 100, 200, 392, 610 or 806 mg/kg bw per day on GD 6–15. |
≥ 24: delayed parturition ≥ 610: increased postnatal mortality; decreased pup weight; fetal skeletal malformations 806: maternal toxicity (piloerection, motor depression); increased prenatal mortality |
Narotsky et al. (1996) (abstract only) |
DBAA |
50/100 |
Mice, CD-1 gavaged with DBAA at 50, 100 or 400 mg/kg bw per day on GD 6–15. |
≥ 100: fetal hydronephrosis 400: renal agenesis (small kidneys) in fetuses Note: No maternal toxicity. No effects on prenatal survival, fetal weight and skeletal development. |
Narotsky et al. (1997) (abstract only) |
DBAA |
ND/1 |
Rabbits, male Dutch-belted (9–22/dose) exposed in utero and via lactation to neutralized DBAA at 1, 5, 50 mg/kg bw per day (pregnant females dosed via drinking water) from GD 15 to 6 weeks postpartum and then in drinking water at maternal doses for 12 (1.02, 5.8 or 61.08 mg/kg bw per day) or 24 (0.99, 5.2 or 55.57 mg/kg bw per day) weeks; untreated females artificially inseminated with treated sperm. |
≥ 1: impaired spermiogenesis; decreased SP22 sperm membrane protein; altered seminiferous tubules; increased ejaculate volumes and decreased sperm concentrations; altered sperm morphology; decreased conception rates 50: increased ejaculation time; increased liver weight Note: No effect on male or female reproductive hormones. No signs of overt toxicity. |
Veeramachaneni et al. (2007) |
DBAA |
ND/0.97 |
Rabbits, male Dutch-belted (10/dose) given DBAA in utero/via lactation to 0.97, 5.05 or 54.2 mg/kg bw per day in drinking water from GD 15 throughout life. |
≥ 0.97: decreased male fertility (based on artificial insemination) 54.2: increased fetal malformations (cleft palate, cranioschisis) |
Veeramachaneni et al. (2000) (abstract only) |
TBAA |
ND |
Range finding Rats, Sprague-Dawley given TBAA at 30, 100, 300 and 500 ppm in drinking water for 2 weeks. Main study Rats, Sprague-Dawley (5–10/dose) given TBAA at 10, 70 and 400 ppm (1, 7, 39 mg/kg bw per day) in drinking water for 35 days; rats further divided into Group A (non-BrdU) and B (BrdU) and exposure varied from peri-conception to gestational exposure. |
Range finding 500 ppm: decreased water consumption Main study Both sexes 39: slight and inconsistent decrease in water consumption Males – Group A 39: mottled kidneys, increased liver-to-body weight ratio; small increase in blood urea nitrogen and serum albumin (could be related to dehydration or to mild kidney toxicity) Note: No deaths and no clinical signs of general toxicity at any dose level. No reproductive (number of corpora lutea, live/dead fetuses or implantation sites in females or sperm effects in males) or developmental (heart and brain, anogenital distance) effects or treatment-related findings in body weights or feed consumption. Cellular proliferation as measured by BrdU Labeling Index was unaffected. |
NTP (1998a) |
BCAA |
Main study Males 15/39 Females 19/50 |
Range finding Rats, Sprague-Dawley (30/sex/dose) given BCAA at 30, 100, 300, 500 ppm (3, 10, 28, 41 mg/kg bw per day) in drinking water for 2 weeks Main study Rats, Sprague-Dawley given BCAA at 60, 200, 600 ppm (5–10 males/dose as 5, 15, 39 mg/kg bw per day; 5–13 females/dose as 6, 19, 50 mg/kg bw per day) in drinking water for up to 35 days including GD 6 to parturition for some females; BrdU given to select groups. |
Range finding No effects on body weight, body weight gain, food and water consumption, clinical observations or mortality. Main study Males ≥ 15: decreased ALT 39: decreased water consumption likely due to taste aversion; increased albumin-to-globulin ratio (not likely significant, may be related to dehydration); increased relative liver weights; increased cytoplasmic vacuolization of hepatocytes Note: No effects on epididymal sperm measures, spermatid head counts, sperm morphology or sperm motility. Females 50: decreased water consumption likely due to taste aversion; dose-dependent but not statistically significant increases in incidence of renal tubular dilation/degeneration; decreased number of live fetuses/litter and total implants per litter Note: No effects on mating or pregnancy index. Other adverse effects were seen on female reproduction but lacked statistical significance due to the small number of pregnancies (n=2-5) per treatment group evaluated. Authors concluded that BCAA adversely affected the ability of females to conceive and carry a full litter to term, with effects particularly relevant for early gestation. |
NTP (1998a) |
BCAA |
5/10 |
Rats, F344/N (10/sex/dose) given BCAA at 62.5, 125, 250, 500 and 1 000 mg/L (5, 10, 20, 40, or 75 mg/kg bw per day in males and 5, 10, 20, 40 or 85 mg/kg bw per day in females) in drinking water for 3 months. |
Males: ≥ 10: increased relative liver weights ≥ 20: transient decreased serum ALT and serum sorbitol dehydrogenase ≥ 40: increased absolute kidney and liver weights 75: increased relative kidney weights; increased incidences of cytoplasmic vacuolization in liver Females: ≥ 10: decreased urinary creatinine ≥ 40: increased absolute and relative liver weight; transient decreased serum ALT and serum sorbitol dehydrogenase 85: increased relative kidney weights; increased incidences of cytoplasmic vacuolization in liver Note: No effects on sperm parameters or estrous cycle. |
NTP (2009) |
BCAA |
Males 32/65 Females ND/8 |
Mice, B6C3F1 (10/sex/dose) given BCAA at 62.5, 125, 250, 500 and 1 000 mg/L (8, 16, 32, 65 or 125 mg/kg bw per day in males and 8, 17, 35, 70 or 140 mg/kg bw per day in females) in drinking water for 3 months. |
Males: ≥ 65: increased incidence of hepatic periportal cytoplasmic vacuolization 125: increased absolute and relative kidney weights; increased liver weights Females: ≥ 8: increased absolute and relative kidney weights; increased liver weights ≥ 70: increased incidence of hepatic periportal cytoplasmic vacuolization; decreased mean body weight gain Note: Increased hematopoietic proliferation in spleen of males (8, 16, 32) and females (17 and 140). |
NTP (2009) |
BCAA |
10/20 |
Rats, F344/N (50/sex/dose) given BCAA at 0, 250, 500 and 1 000 mg/L (0, 10, 20 or 40 mg/kg bw per day in males and 0, 13, 25 or 50 mg/kg bw per day in females) in drinking water for 2 years. |
Males: ≥ 20: increased incidences of malignant mesotheliomas (but not at highest dose); decreased mean body weight 40: increased incidences of eosinophilic focus in liver Females: ≥ 25: increased incidences of eosinophilic focus in liver and of multiple fibroadenomas in mammary gland 50: increased incidences of adenomas (large intestine, liver), of alveolar epithelium hyperplasia in lung and of mixed cell focus in liver; decreased mean body weight Note: NTP found clear evidence of carcinogenic activity in rats. |
NTP (2009) |
BCAA |
ND/15 |
Mice, B6C3F1 (50/sex/dose) given BCAA at 250, 500, and 1 000 mg/L (25, 50, or 90 mg/kg bw per day in males and 15, 30, or 60 mg/kg bw per day in females) in drinking water for 2 years. |
Males: ≥ 25: increased incidences of hepatocellular adenoma (but not at highest dose), of liver adenomas and/or carcinomas, of hepatoblastoma (multiple) and of hepatocyte cytoplasmic vacuolization ≥ 50: increased incidences of hepatocellular carcinomas (multiple) and of hepatopoietic cell proliferation of spleen 90: increased incidence of bone marrow hyperplasia and of liver centrilobular necrosis; decreased survival; decreased mean body weights Females: ≥ 15: increased incidence of hepatocellular adenomas and combined incidence of hepatocellular adenomas and/or carcinomas; increased incidences of hepatocyte cytoplasmic vacuolization ≥ 30: increased incidences of hepatic eosinophilic focus 60: decreased mean body weight Note: NTP found clear evidence of carcinogenic activity in mice. |
NTP (2009) |
BCAA |
ND/1.6 |
Rats, male Sprague-Dawley (8/dose) gavaged with BCAA at 1.6, 4 and 8 mg/kg bw per day for 14 days or 1.6 and 3.2 mg/kg bw per day; sperm used to artificially inseminate untreated females. |
≥ 1.6: decreased SP22 protein in testes and decreased fertility of cauda epididymal sperm. |
Kaydos et al. (2004) |
BCAA |
Range finding: 24/72 Dose-response ND/8 |
Rats, male Sprague-Dawley (6 or 12/dose) Range finding: (12/dose) gavaged with BCAA at 24, 72 or 216 mg/kg bw per day for 14 days. Dose-response: 10/dose gavaged with BCAA at 8, 24 or 72 mg/kg bw per day for 14 days; untreated females artificially inseminated with sperm from treated males. |
Range finding: ≥ 72: decreased epididymal sperm reserves (cauda, caput); decreased percentage of motile and progressively motile cauda epididymal sperm; decreased sperm velocity; decreased cauda and epididymal sperm counts; increased percentage of tail defects in cauda epididymal sperm; increased retained spermatids (Step 19 in stages X and XI) in testis; decreased serum LH; increased percentage of retained spermatids in testes; qualitative increase in atypical residual bodies in stages X and XI (not quantified) 216: decreased body weight; increased caput and cauda sperm abnormalities; decreased caput sperm count Overall – delayed spermiation in testes Note: No effects were seen on testis sperm production, serum testosterone or weights of testis, epididymis and seminal vesicles. Dose-response ≥ 8: decreased progressive sperm motility and percentage of motile sperm; decreased percent fertility of cauda sperm via in utero insemination; decreased SP22 (correlated with fertility) and SP9 proteins ≥ 24: increased heads-only cauda sperm 72: decreased epididymis weight; increased abnormal caput and cauda sperm Note: No effects were seen on body weight, testes weight, seminal vesicles weight or on hormonal levels. |
Klinefelter et al. (2002) |
BCAA |
24/72 |
Mice, male juvenile (PND 8–21) and adult, C57BL/6 (12/dose) gavaged with BCAA at 8, 24, 72 or 216 mg/kg bw per day for 14 days; 7/age/dose used in follow-up 40-day sequential breeding assay; juveniles had 14-week maturation period. |
14 Day Study: Juveniles: 216: smaller juveniles with recovery by week 10 Note: No effect on relative testis weights Breeding assay: ≥ 72: transient decreased mean number of litters/males, percentage of litters/females bred, total number of fetuses/males; increased spermatid retention and atypical residual bodies; disruption of spermatogenic cycle (Stage I-VIII) Note: Effects were transient in adult-exposed mice (indicating spermatids toxicity) and were not a consequence of juvenile dosing. No significant differences in relative weights of reproductive organs or in reproductive parameters in juvenile-dosed adults. |
Tully et al. (2005) |
BCAA |
ND/75 |
Mice, male B6C3F1 (5/dose) given neutralized BCAA at 0.3, 1 or 3 g/L (calculated as 75, 250 or 750 mg/kg bw per day) in drinking water for 12 weeks. |
75: increased liver glycogen content 750: increased relative liver weights |
Kato-Weinstein et al. (2001) |
CDBAA |
62/78 |
Range finding Rats, Sprague-Dawley (31/sex/dose) given CDBAA at 750, 1 000 and 1 500 ppm (calculated as 52, 64 and 75 mg/kg bw per day) in drinking water for 2 weeks. Main study Rats, Sprague-Dawley given CDBAA at 500, 1 000, 1 500 ppm in drinking water for up to 35 days (5–10 males/dose as 37, 62 and 78 mg/kg bw per day; 5–13 females/dose as 58, 100 and 124 mg/kg bw per day). |
Range finding Note: No significant test-article related effects at any dose. Water consumption was decreased starting at 52 in males and 64 in females but was most likely related to taste aversion. Main study Males: ≥ 62: deceased water intake 78: increased cell proliferation in liver; decreased sperm velocity and maximum amplitude of lateral head displacement (ALH max) (no change in other sperm measurements); decreased food intake Females: ≥ 100: decreased water intake 124: decreased mean absolute body weights and feed consumption; increased cell proliferation in liver and kidneys Note: Authors state that the lack of overt cytotoxicity in the presence of a cell proliferative response suggests a mitogenic MOA. Note: No treatment-related clinical findings or mortality. No female reproductive toxicity or developmental toxicity (no visceral malformation or variations in any pups). |
NTP (2000) |
BDCAA |
ND/5 |
Rats, F344/N (10/sex/dose) given un-neutralized BDCAA at 62.5, 125, 250, 500 or 1 000 mg/L in drinking water for 14 weeks (calculated as 5, 9, 19, 37 or 72 mg/kg bw per day for males; 5, 10, 20, 43 or 69 for females); additional 10 rats/sex/dose used for clinical pathology for 4 weeks. |
Males ≥ 9: decreased serum ALT 72: decreased left testis weights and sorbitol dehydrogenase; increased relative liver weights Females ≥ 5: decreased serum albumin (can indicate liver/kidney issues) ≥ 20: increased platelet counts and relative kidney weights; decreased serum ALT ≥ 43: decreased serum total protein 69: decreased final mean body weights and body weight gains; increased absolute kidney weights Note: No chemical-related histological lesions were seen. |
NTP (2015) |
BDCAA |
ND/11 |
Rats, F344/Ntac (66/sex/dose) given BDCAA at 250, 500 or 1 000 mg/L in drinking water for 104 weeks (calculated as 11, 21 or 43 mg/kg bw per day for males; 13, 28 or 57 for females); additional 8 rats/sex/dose used for clinical pathology at 6 and 13 months. |
Both sexes ≥ 11/13: increased incidences of non-neoplastic lesions (angiectasis) in bone marrow, of fibroadenomas and neoplasms in the mammary gland, and of malignant mesotheliomas in all organs examined Males ≥ 11: increased incidences of malignant mesotheliomas in testes and epididymis ≥ 21: increased incidences of adenoma of the large intestine (considered equivocal by NTP), and of adenoma/carcinoma in Harderian gland 43: decreased water consumption; increased incidences of skin neoplasms, subcutaneous fibroma, eosinophilic focus in liver, and hyperplasia of the bone marrow Females ≥ 13: increased hyperplasia of the bone marrow ≥ 28: decreased survival; increased eosinophilic focus in liver, of hepatic and splenic hematopoietic cell proliferation 57: increased incidences of mammary gland carcinoma, and hyperplasia of the mammary gland Note: Clear evidence of carcinogenic activity in both sexes. |
NTP (2015) |
BDCAA |
15/30 |
Mice, B6C3F1/N (10/sex/dose) given BDCAA at 62.5, 125, 250, 500 or 1 000 mg/L in drinking water for 14 weeks (calculated as 7, 15, 30, 59 or 123 mg/kg bw per day for males; 9, 17, 36, 70 or 129 for females). |
Males ≥ 30: increased relative liver weights ≥ 59: increased absolute liver weights 123: decreased absolute kidney weights Females 129: increased glycogen depletion in livers; increased relative kidney weights Note: No effect on hematology or male/female reproductive system. |
NTP (2015) |
BDCAA |
ND/17 |
Mice, B6C3F1/N (66/sex/dose) given BDCAA at 250, 500 or 1 000 mg/L in drinking water for 105 weeks (calculated as 23, 52 or 108 mg/kg bw per day for males; 17, 34 or 68 mg/kg bw per day for females); additional 7/8 mice/sex/dose used for clinical pathology at 6 and 14 months. |
Both sexes ≥ 17/23: increased water consumption (except females at 68) 68/108: increased incidences of atypical focus of cellular alteration of liver Males ≥ 23: increased incidences of hepatocellular carcinoma, hepatoblastoma and epididymal atrophy ≥ 52: decreased survival (deaths related to liver neoplasms) and mean body weights; increased incidences of atrophy of the testis, of epididymal epithelium degeneration, and of Harderian gland adenomas/carcinomas 108: increased hypospermia; decreased absolute and relative kidney weights Females ≥ 17: decreased mean body weights; increased incidences of hepatocellular adenomas and carcinomas ≥ 34: increased incidences of hepatocellular carcinoma 68: increased incidence of hepatoblastomas and hemangiosarcomas; decreased mean body weights Note: Clear evidence of carcinogenic activity in both sexes. |
NTP (2015) |
BDCAA |
ND/75 |
Mice, male B6C3F1 (5/dose) given neutralized BDCAA at 0.3, 1 or 3 g/L (calculated as 75, 250 or 750 mg/kg bw per day) in drinking water for 12 weeks. |
75: increased relative liver weights; decreased liver glycogen content |
Kato-Weinstein et al. (2001) |
MIAA |
ND/10 (mg/L) |
Pregnant CD-1 mice (12/dose) given 10, 100 or 500 mg/L of MIAA in drinking water for 35 days pre-mating and continued until PND 21. |
No affect on estrous cycle or fertility parameters (mortality rate, sex ratio) of F0 females but did decrease estradiol levels at the highest dose. At PND 21, F1 females (25–35/dose) had decreased body weights starting at 100 mg/L while increased absolute ovarian weights were seen at 10 mg/L. Delayed rate of vaginal opening, increased anogenital distance relative to body weight and decreased percentage of atretic follicles were also seen in F1 females. |
Gonsioroski et al. (2022) |
MIAA |
ND/500 (mg/L) |
Female CD-1 mice (12/dose) given 0.5-500 mg/L of MIAA in drinking water for 35–40 days. |
No effect on body weight gain, ovarian, uteri and liver weights. At the highest dose tested, MIAA affected reproductive function by decreasing the length of the proestrous stage of the estrous cycle, disrupting ovarian gene expression and decreasing androstenedione and estradiol levels. |
Gonsioroski et al. (2021) |
MIAA |
2.5/7.5 |
Male and female rats (10/dose) were gavaged with 0, 2.5, 7.5 or 22.5 mg/kg bw per day MIAA starting two weeks pre-mating. Males were sacrificed after 4 weeks of dosing while females were sacrificed at postpartum day 13. |
No reproductive toxicity in female rats was seen. Increased relative weights of testes (in the absence of histopathological changes) and seminal vesicles plus coagulating glands were seen in parental male rats at 22.5 mg/kg bw per day. MIAA caused increased head congestion in offspring starting at 7.5 mg/kg bw per day and decreased litter weight, lower viability index and decreased anogenital distance index in male pups at 22.5 mg/kg bw per day. |
Long et al. (2021) |
MIAA |
ND/6 |
Sprague-Dawley rats (7/sex/dose) gavaged with 0, 6, 12 or 24 mg/kg bw per day of MIAA for 28 days. |
Decreased relative liver (≥ 12 mg/kg bw per day) and heart weights (24 mg/kg bw per day) were seen in males. Alanine phosphatase, total protein and blood urea nitrogen were also decreased at the highest dose tested. In females, ovarian weights were decreased while relative hypothalamus weight was increased starting at the lowest dose tested. Altered levels of hormones were seen in both males and females starting at 12 and 24 mg/kg bw per day, respectively. A statistically significant increase in total number of smaller thyroid follicles was seen in sexes at the highest dose. Gene expression in the thyroid and liver was altered while TSHR protein expression was downregulated. |
Xia et al. (2018) |
| ALT – alanine aminotransferase; AST – aspartate aminotransferase; BCAA – bromochloroacetic acid; BDCAA – bromodichloroacetic acid; BrdU – bromodeoxyuridine/5-bromo-2′ -deoxyuridine labeling index to measure cell proliferation; BUN – blood urea nitrogen; bw – body weight; CDBAA – chlorodibromoacetic acid; ChE – cholinesterase; DBAA – dibromoacetic acid; DCAA – dichloroacetic acid; F – female; GD – gestation day; LOAEL – lowest observed adverse effect level; LP – lipid peroxidation; M – male; MBAA – monobromoacetic acid; MCAA – monochloroacetic acid; MIAA – monoiodoacetic acid; MOA – mode of action; MPO – myeloperoxidase; N – number; NOAEL – no observed adverse effect level; ND – not determined; PND – post natal day; PLCs – peritoneal lavage cells; SA – superoxide anion; SOD – superoxide dismutase; SSBs – DNA-single strand breaks; T4 – thyroxin; T3 – triiodothyronine; TBAA – tribromoacetic acid; TCAA – trichloroacetic acid; TCA – tricarboxylic acid cycle; TNF-α – tumour necrosis factor-alpha. | ||||
For each HAA, the assays are listed in order of decreasing severity of genotoxic effects (for example, DNA mutations [DM] > chromosomal aberration [CA] or micronucleus [MN] test > DNA damage [DD]; indicator test, for example, comet assay, single-cell gel electrophoresis [SCGE]) > DNA adducts [DA] and increasing phylogenetic relevance to humans (in vitro: bacteria, animal cells, human cells, and in vivo animals). In the weight of evidence evaluation of genotoxicity, the highest weight is given to mutations at DNA/gene and chromosome levels in animals (top right rows for each HAA). Very few DA studies were found. |
||||||
| HAA | Assay | Bacterial In vitro assays | Animal In vitro assays | Human In vitro assays | Animal In vivo assays | Weight of evidence |
|---|---|---|---|---|---|---|
| MCAA | DM | (-) S. typhimurium TA98, TA100, TA104, TA1530, TA1535, TA1537, G46, TA1535/pSK1002. (+) TA 98, TA100Table E3 Footnote 1 |
(+) CHO (high dose), tk+/tk- mouse lymphomaTable E3 Footnote 3 | NA | NA | N/A |
| MCAA | CA | NA | (-) CHO and CHL ± S9 (4 studies). (+) CHO w/o S9 (2 studies)Table E3 Footnote 1 | (-) Tk6. (+) lymphocytesTable E3 Footnote 2 | NA | N/A |
| MCAA | MN | NA | NA | (+) lymphocytes, A549 lungTable E3 Footnote 3 | NA | N/A |
| MCAA | DD | NA | (+) CHO (2 studies)Table E3 Footnote 3 | (-) HEPG (high dose), T24. (+) lymphocytes (2 studies) and weak in CCRF-CE, sperm, FHs (4 studies)Table E3 Footnote 3 | (-) B6C3F1 mice (liver, spleen, stomach, duodenal epithelial cells), F344 rat liver. (+) secondary to cytotoxicity in primary rat hepatocytesTable E3 Footnote 1 | N/A |
| MCAA | N/A | N/A | N/A | N/A | N/A | MCAA is likely not a direct acting genotoxic carcinogen. |
| DCAA | DM | (-) S. typhimurium TS24 recA, TA2322 polA, TA1950 uvrB, TA98, TA100, TA104, TA1535, TA1537, TA1538, TA1950, TA2322, E. coli WP2urvA, TA1535/pSK1002. (+) TA98, TA100, TA1535, TA1538, RSJ100, TA1535/pSK1002Table E3 Footnote 1 | (-) Mouse lymphoma L5178Y/TK+/- cells. (+) Mouse lymphoma L5178Y/TK+/- cells, CHOTable E3 Footnote 2 | NA | (-) Big Blue B6C3F1 transgenic mice 1 and 3.5 g/L 4 and 10 weeks; (+) at 60 weeksTable E3 Footnote 1 | N/A |
| DCAA | CA | NA | (+) L5178Y/TK+/- cells. (-) CHOTable E3 Footnote 2 | NA | NA | N/A |
| DCAA | MN | NA | (-) L5178Y/TK+/- cellsTable E3 Footnote 1 | (+/-) peripheral blood lymphocytesTable E3 Footnote 2 |
(-) p53 haploinsufficient mice 0, 0.5, 1, or 2 g/L; Tg.AC mice 0, 0.5, 1, or 2 g/L; B6C3F1 mice 0, 0.067, 0.125, 0.25, 0.5, or 1 g/L. (+) B6C3F1 mice 3.5 g/LTable E3 Footnote 1 | N/A |
| DCAA | DD | NA | (-) CHO, B6C3F1 mice primary hepatocytes, F344 rat hepatocytesTable E3 Footnote 1 | (-) CCRF-CEM cells. (+) HEPG2Table E3 Footnote 2 | (-) F344 rats 15, 41, 113 mg/kg; B6C3F1 mice 0.7, 17 mg/kg; B6C3F1 mice 0.13-1.3 g/kg duodenal and stomach cells; F344 rat livers 0.05, 0.5, or 2 g/L; F344 rat livers 0.13-0.65 g/kg. (+) F344 rats 3300 mg/kg, B6C3F1 mice 6500 mg/kg; B6C3F1 mice 10, or 500 mg/kg; B6C3F1 mice liver cells 0.13-1.3 g/kg and B6C3F1 mice liver cells 0.5, or 5 g/L, B6C3F1 mice liver 7.5 mg/kg/d, Wister rat liver 0.5 and 2.0 g/LTable E3 Footnote 1 | N/A |
| DCAA | N/A | N/A | N/A | N/A | N/A | DCAA does not appear to be directly genotoxic. |
| TCAA | DM | (-) B. subtilis H17 Rec+ and M45 Rec-, S. Typhimurium TA98, TA100, TA 1535, TA1537, TA1538, TA104, RSJ100, E. coli PQ37. (+) TA1535, TA100, TA98, TA1535/pSK1002.Table E3 Footnote 1 | (-) CHO. (+) L5178Y/TK+/- cellsTable E3 Footnote 2 | NA | NA | N/A |
| TCAA | CA | NA | weak (+) TK6Table E3 Footnote 3 | (-/+) peripheral lymphocytesTable E3 Footnote 2 | (-) white mice 1, 10, 100, 500 or 1000 mg/kg sodium trichloroacetate for 20 hours. (+) Swiss mice 500 mg/kg (high dose)Table E3 Footnote 1 | N/A |
| TCAA | MN | NA | NA | (-/+) peripheral lymphocytesTable E3 Footnote 2 | (-) C57BL/6JfBL10/Alpk mice i.p injection of 337, 675, or 1080 mg/kg-day (males); 0, 405, 810, or 1620 mg/kg day (females). (+) Swiss mice i.p. injection of 125, 250 or 500 mg/kg (high doses)Table E3 Footnote 2 | N/A |
| TCAA | DD | (-/+) S. Typhimurium TA1535/pSK1002Table E3 Footnote 2 | (-) CHO, primary hepatocytes from B6C3F1 mice and male F344 rats.Table E3 Footnote 1 | (-) CCRF-CEM. (+) HEPG2Table E3 Footnote 2 | (-) F344 rat doses < 25 mmol/kg and 0, 164 or 817 mg/kg (hepatic); B6C3F1 mice < 0.1 mmol/kg and 500 mg/kg (hepatic), 1 g/kg and 1500 mg/kg and 1.6 g/kg (stomach and duodena). (+) F344 rats 25 mmol/kg; B6C3F1 mice 0.1 mmol/kg, 500 mg/kg and 1.6 g/kg (hepatic) and 300 mg/kg (hepatic) and 77, 154, or 410; NOAEL 7.7/LOAEL25 mg/kg/d, mg/kg-day (hepatic) and 25, or 50 mg/kg day (hepatic)Table E3 Footnote 2 | N/A |
| TCAA | DA | NA | NA | NA | (-) B6C3F1 mice 20, 100 mg/kg and 25, 125, or 500 mg/kg-day. (+) B6C3F1 mice 300 mg/kgTable E3 Footnote 1 |
N/A |
| TCAA | N/A | N/A | N/A | N/A | N/A | TCAA does not appear to be directly genotoxic. Positive results were at high doses and in a species where TCAA exposure did not cause tumours (rats). |
| MBAA | DM | (-) S. Typhimurium TA100, TA98, TA1535/pSK1002, E. coli PQ37. (+) TA100, TA98, TA1535/pSK1002Table E3 Footnote 2 | (+) CHOTable E3 Footnote 3 | NA | NA | N/A |
| MBAA | CA | NA | NA | (-) TK6. (+) lymphocytesTable E3 Footnote 2 | NA | N/A |
| MBAA | MN | NA | NA | (-) TK6. (+) lymphocytes, A549 lungTable E3 Footnote 2 | NA | N/A |
| MBAA | DD | NA | (+) L- 1210, CHOTable E3 Footnote 3 | (-) T24 cells. (+) FHs, HepG, sperm, lymphocytesTable E3 Footnote 3 |
NA | N/A |
| MBAA | N/A | N/A | N/A | N/A | N/A | MBAA is likely genotoxic. |
| DBAA | DM | (-) S. Typhimurium TA98, RSJ100 (+) TA100, TA98, TA1535/pSK1002, E. Coli PQ37Table E3 Footnote 3 | (+) CHO-K1Table E3 Footnote 3 | NA | NA | N/A |
| DBAA | MN | NA | NA | NA | (-) female B6C3F1 mice 17, 34, 67, 132 or 260 mg/kg-day (+) male B6C3F1 mice 16, 30, 56, 115 or 230 mg/kg-dayTable E3 Footnote 2 | N/A |
| DBAA | DD | NA | (+) CHO-AS52Table E3 Footnote 3 | (+) HepG2Table E3 Footnote 3 | NA | N/A |
| DBAA | DA | NA | NA | NA | (+) Male B6C3F1 mice 300 mg/k and 0, 29, 144, or 578 mg/kg dayTable E3 Footnote 2 |
N/A |
| DBAA | N/A | N/A | N/A | N/A | N/A | DBAA is likely genotoxic. |
| TBAA | DM | (-) SalmonellaTable E3 Footnote 1 | NA | (+) A549 lungTable E3 Footnote 3 | NA | N/A |
| TBAA | DD | NA | (+) CHO (high dose)Table E3 Footnote 2 | NA | NA | N/A |
| TBAA | N/A | N/A | N/A | N/A | N/A | Limited data; appears to not be genotoxic at low doses. |
| BCAA | DM | (-) Salmonella TA98, E. coli WP2uvrA/pkM101 (+) Salmonella TA100Table E3 Footnote 2 | NA | NA | NA | N/A |
| BCAA | MN | NA | NA | NA | (-) B6C3F1 mice erythrocytes in peripheral bloodTable E3 Footnote 1 | N/A |
| BCAA | DD | NA | (+) CHO (high dose)Table E3 Footnote 2 | NA | NA | N/A |
| BCAA | N/A | N/A | N/A | N/A | N/A | Limited data; appears not genotoxic at low doses. |
| CDBAA | DD | NA | (+) CHO (high dose)Table E3 Footnote 2 | NA | NA | Insufficient data. |
| BDCAA | DM | (+) Salmonella TA97, TA98, TA100, E. coli WP2 uvrA/pkm101Table E3 Footnote 3 | NA | NA | NA | N/A |
| BDCAA | MN | NA | NA | NA | (-) B6C3F1 mice erythrocytes in peripheral blood NOAEL 123 mg/kgTable E3 Footnote 1 | N/A |
| BDCAA | DD | NA | (+) CHO (high dose)Table E3 Footnote 2 | NA | NA | N/A |
| BDCAA | N/A | N/A | N/A | N/A | N/A | Insufficient data. |
| MIAA | DM | (+) Salmonella A1535/pSK1004Table E3 Footnote 3 | (+) CHOTable E3 Footnote 3 | NA | NA | N/A |
| MIAA | CA | NA | (+) CHO, Tk6Table E3 Footnote 3 | (+) lymphocytes. (-)Table E3 Footnote 2 Tk6 | NA | N/A |
| MIAA | MN | NA | NA | (+) lymphocytesTable E3 Footnote 3 | NA | N/A |
| MIAA | DD | NA | (+) CHO (2 Studies)Table E3 Footnote 3 | (-) T24, (+) lymphocytes (2 Studies), FHs, HEPG2Table E3 Footnote 3 | NA | N/A |
| MIAA | N/A | N/A | N/A | N/A | N/A | I-HAA is likely genotoxic. |
| DIAA | DD | NA | (+) CHO (high dose)Table E3 Footnote 2 | (+) A549 lung (high dose)Table E3 Footnote 2 | NA | Insufficient data. |
| CIAA | MN | NA | NA | (+) A549 lungTable E3 Footnote 3 | NA | Insufficient data. |
| BIAA | DD | NA | (+) CHO (high dose)Table E3 Footnote 2 | NA | NA | Insufficient data. |
(-) indicates negative assay results; (+) indicates positive assay results; CA: chromosomal aberration; CCRF-CEM: acute human lymphoma-derived cell line; CHO: Chinese hamster ovary; DA: DNA adducts; DD: DNA damage; DM: DNA mutations; L-1210: Mouse lymphocytic leukemia; FHs: Non-transformed human fetal small intestinal epithelial cells; HepG2: Human liver hepatocellular carcinoma; MN: micronucleus; NOAEL: no observed adverse effect level; NA: not available; N/A: not applicable; SCGE: single-cell gel electrophoresis; T24: human urothelial cell line; TK6: human lymphoblastoid thymidine kinase heterozygote. References: BCAA: bromochloroacetic acid: Plewa et al., 2010; NTP, 2009. BDCAA: bromodichloroacetic acid: Plewa et al., 2010; NTP, 2015. BIAA: bromoiodoacetic acid: Plewa et al., 2010. CDBAA: chlorodibromoacetic acid: Plewa et al., 2010. CIAA: chloroiodoacetic acid: Pérez-Albaladejo et al., 2023. DBAA: dibromoacetic acid: References from OEHHA, 2022: Parrish et al.,1996; Austin et al., 1996; NTP, 2007a; Giller et al.,1997; Nelson et al., 2001; Fang et al., 2001; Kargalioglu et al., 2002; Zhang et al., 2010, 2012, 2016; Stalter et al., 2016; Plewa et al., 2002, 2010. DCAA: dichloroacetic acid: References from OEHAA, 2022: Leavitt et al., 1997; NTP, 2007b; Fuscoe et al., 1996; Chang et al., 1992; Nelson et al., 1989, 2001; Nelson and Bull, 1988; Varshney et al., 2013; Fox et al., 1996; Harrington-Brock et al., 1998; Kargalioglu et al., 2002; Giller et al., 1997; Plewa et al., 2002, 2004, 2010; Zhang et al., 2010, 2012, 2016; Stalter et al., 2016; Ono et al., 1991; Nelson et al., 2001; DeMarini et al., 1994; Herbert et al., 1980; Waskell, 1978; Hassoun et al., 2014; El-Arem et al., 2014. DIAA: diiodoacetic acid: Plewa et al., 2010; Pérez-Albaladejo et al., 2023. MBAA: monobromoacetic acid: References from OEHHA, 2022: Giller et al., 1997; Kargalioglu et al., 2002; Zhang et al., 2010, 2012, 2016; Stalter et al., 2016; Stratton et al., 1981; Plewa et al., 2000, 2002, 2004, 2010; Muellner et al., 2010; Attene-Ramos et al., 2010; Dad et al., 2013; Escobar-Hoyos et al., 2013; Komaki et al., 2009; Ali et al., 2014; Pals et al., 2016; Liviac et al., 2010; Richardson et al., 2007; Marsa et al., 2018. Other: Pérez-Albaladejo et al., 2023. MCAA: monochloroacetic acid: OEHHA, 2022: McCann and Ames, 1976; Bartsch et al., 1975; Rannug et al., 1976; NTP, 1992; Giller et al., 1997; Nelson et al., 2001; Kargalioglu et al., 2002; Zhang et al., 2010, 2012, 2016; Stalter et al., 2016; Galloway et al., 1987; Sawada et al., 1987; Plewa et al., 2002, 2018; Komaki et al., 2009; Attene-Ramos et al., 2010; Escobar-Hoyos et al., 2013; McGregor et al., 1987; Chang et al., 1992; Ali et al., 2014; Liviac et al., 2010; Marsa et al., 2018. Other: Pérez-Albaladejo et al., 2023; MIAA: monoiodoacetic acid: References from Richardson et al. Review (2007): Cemeli et al., 2006; Plewa et al., 2004; Hilliard et al., 1998. References from OEHHA, 2022: Ali et al., 2014; Escobar-Hoyos et al., 2013; Zhang et al., 2010, 2012, 2016; Liviac et al., 2010; Attene-Ramos et al., 2010; Komaki et al., 2009, 2018; Marsa et.al., 2018. TBAA: tribromoacetic acid: Kargalioglu et al., 2002; Plewa et al., 2010; Pérez-Albaladejo et al., 2023. TCAA: trichloroacetic acid: References from OEHHA, 2022: Parrish et al., 1996, Austin et al., 1996, Hassoun et al., 2010a, 2014; Hassoun and Dey, 2008; Chang et al., 1992; Styles et al., 1991; Nelson et al., 1989, 2001; Nelson and Bull, 1988; Kurinnyĭ, 1984; Bhunya and Das, 1987; Varshney et al., 2013, 2014; Mackay et al., 1995; Harrington-Brock et al., 1998; Zhang et al., 2010, 2012, 2016; Stalter et al., 2016; Giller et al., 1997; Plewa et al., 2002, 2010; DeMarini et al., 1994; Ono et al., 1991; Moriya et al., 1983; Rapson et al., 1980; Nestmann et al., 1980; Waskell, 1978; Shirasu et al., 1976; Anderson et al., 1972; Kikland et al., 2011.
|
||||||
| HAA | Species, sex, number | Exposure: Route, dose and duration | Response: Tumour type and incidence/number of animals | NOAEL/LOAEL mg/kg bw per day | Reference |
|---|---|---|---|---|---|
MCAA |
Rat F344/N (70/dose) and mouse B6C3F1 male and female (60/sex/dose) |
Rats: Gavage, un-neutralized MCAA at 15 or 30 mg/kg bw per day, 5 days per week for 104 weeks (calculated as 11 and 21 mg/kg bw per day). Mice: Gavaged with un-neutralized MCAA at 50 or 100 mg/kg bw per day (calculated as 36 and 71 mg/kg bw per day), 5 days per week for 104 weeks. |
No evidence of carcinogenicity |
NA |
NTP, 1992 |
MCAA |
Rat, F344/N, male (50/dose) |
Drinking water, neutralized MCAA at 0.05, 0.5 or 2.0 g/L (calculated as 3.5, 26.1 or 59.9 mg/kg bw per day) for 104 weeks. |
No evidence of carcinogenicity |
NA |
#DeAngelo et al., 1997 |
DCAA |
Male and female |
Drinking water, 52 weeks, neutralized DCAA: Male: 0, 1, or 2 g/L (0, 140, or 300 mg/kg bw per day). 11 mice in the 2 g/L subgroup exposure stopped after 37 weeks and mice sacrificed at 52 weeks (280 mg/kg bw per day). Female: 0 or 2 g/L (0 or 480 mg/kg bw per day) for 52 weeks. |
Male: HA: 0/35, 0/1, 2/10; |
Only males developed tumours |
Bull et al., 1990 |
DCAA |
Male B6C3F1 mice |
Drinking water, neutralized DCAA Study 1: 60 weeks: 0, 0.05, 0.5, 5 g/L (0, 7.6, 77, or 486 mg/kg bw per day). 75 weeks: 0, 0.05, 0.5 g/L (0, 7.6, 77 mg/kg bw per day). Study 2: 60 weeks: 0 or 3.5 g/L (0 or 410 mg/kg bw per day). |
Combined results (weeks 60 and 75 and Studies 1 and 2): |
77/486 |
DeAngelo et al., 1991 |
DCAA |
Male B6C3F1 mice |
Drinking water, 0 or 0.5 g/L (0 or 93 mg/kg bw day) neutralized DCAA for 104 weeks. |
HA: 1/20, 10/24*; HC: 2/20, 15/24*; HA or HC: 3/20, 18/24* |
NA/93 |
Daniel et al., 1992 |
DCAA |
Male B6C3F1 mice |
Drinking water, 0 or 5 g/L (0 or 900 |
HA: 2/24, 83/89*; HC: 2/24, 66/89* |
NA/900 |
Anna et al., 1994 |
DCAA |
Male F344 rats |
Drinking water, 0, 0.05, 0.5 or 2.4 g/L (0, 4, 40 or 296 mg/kg bw per day) neutralized DCAA for 15, 30, 45, 60 or 104 weeks. |
Hepatic nodules: 0/7, 0/7, 0/7, 19/27* (60-week sacrifice). No significant increase of HA or HC; high-dose groups only sacrificed at 60 weeks. Combined 45–104-week groups (no duration adjustment): HA: 1/37, 0/40, 6/43, 8/34*; HC: 0/37, 0/40, 3/43, 1/34. |
40/296 |
Richmond et al., 1995 |
DCAA |
Male B6C3F1 mice (number |
Drinking water, 0, 1, or 3.5 g/L (0, 180, or 630 mg/kg bw per day) neutralized DCAA for 104 weeks. |
HC: 19%, 70.6%, 100% (only percentages reported, no statistical analysis). |
NA |
Ferreira- Gonzalez et al., 1995 |
DCAA |
Male Fischer 344 rats |
Drinking water, neutralized DCAA 0, 0.05, 0.5, 5 g/L (0, 3.6, 40.2, 402 mg/kg bw per day) for 100 weeks and 0, 1.6 g/L (0, 139 mg/kg bw per day) for 103 weeks. |
100 weeks: HA: 1/23, 0/26, 5/29; HC: 0/23, 0/26, 3/29; HA+HC: 1/23, 0/26, 7/29*. 103 weeks: HA: 0/33, 3/28; HC: 1/33, 6/28*; HA+HC: 1/33, 8/28*. 5 g/L group was excluded due to neuropathy. |
3.6/40.2 |
DeAngelo et al., 1996 |
DCAA |
Female B6C3F1 mice |
Drinking water, 0, 2.0, 6.67 or 20 mM (0, 40, 115, or 330 mg/kg bw per day) neutralized DCAA up to 576 days. |
HA: 2/90, 3/50; 7/28*, 16/19*; HC: 2/90, 0/50, 1/28, 5/19* |
40/115 |
Pereira et al., 1996 |
DCAA |
Female B6C3F1 mice |
Drinking water, 0, 0.5 or 3.5 g/L (0, 94 or 438 mg/kg bw per day) neutralized DCAA for 104 weeks |
HC: 1/39, 1/25, 23/25* |
94/438 |
Schroeder et al., 1997 |
DCAA |
Male B6C3F1 mice |
Drinking water, 0, 0.5, 1, 2 or 3.5 g/L (0, 8, 84, 168, 315 or 429 mg/kg bw per day) neutralized DCAA for up to 100 weeks. |
HA: 5/50, 1/33, 5/25, 18/35*, 9/21*, 5/11*; HC: 13/50, 11/33, 12/25, 25/35*, 20/21*, 11/11*; HA or HC: 18/50, 11/33, 14/25, 30/35*, 21/21*, 11/11* |
84/168 |
DeAngelo et al., 1999 |
DCAA |
Male B6C3F1 mice (20/dose) |
Drinking water, 0, 0.1, 0.5 or 2 g/L (0,11, 54 or 216 mg/kg bw per day) neutralized DCAA for 52 weeks. |
HA: 0/20, 1/20, 4/20, 10/19*; HC:0/20, 0/20, 1/20, 1/19; HA or HC: 0/20, 1/20, 4/20,11/19* |
54/216 |
#Bull et al., 2002 |
DCAA |
Male and female Tg.AC mice (v-Ha-ras transgenic) (10 or 15/sex/dose/time point) |
Drinking water, 0, 0.5, 1 or 2 g/L (males: 0, 75, 145 or 235 mg/kg bw per day; females: 0, 100, 185 or 285 mg/kg bw per day) un-neutralized DCAA for 26 or 41 weeks. |
No dose-related liver tumours observed. |
235/NA |
NTP, 2007b |
DCAA |
Male and female p53 haplo-insufficient mice (25/sex/dose) |
Drinking water: 0, 0.5, 1 or 2 g/L (males: 0, 45, 80 or 145 mg/kg bw per day; females: 0, 75, 145 or 220 mg/kg bw per day) un-neutralized DCAA for 26 or 41 weeks. |
No tumours detected. P53 haplo-insufficient mice generally do not respond to other chemicals that typically induce liver tumours. |
220/NA |
NTP, 2007b |
DCAA |
Male and female B6C3F1 mice (30–48/sex/dose; 26– |
Drinking water, males: 0, 1, 2, 3.5 g/L (0, 136, 232 and 297 mg/kg bw per day); females: 0, 1, 2 g/L (0, 142, 253 mg/kg bw per day) neutralized DCAA for 10 weeks followed by water only for 84 weeks. |
Male: HA: 15/27, 13/27, 11/27, 15/26*; HC: 8/27, 8/27, 6/27, 19/26*; total liver neoplasms: 12/27, 15/27, 14/27, 24/26*. Female: HA: 0/27, 9/26*, 6/28*; HC: 0/27, 2/26, 3/28; total liver neoplasms: 0/27, 10/26*, 9/28* |
Males: 232/297; Females: NA/142 |
Wood et al., 2015 |
DCAA |
Male B6C3F1 mice |
Drinking water, 0 or 3.5 g/L neutralized DCAA for 4, 10, 26, 52, plus 93 weeks recovery. Mean DCAA doses reported: 429 (4 weeks), 479 (10 weeks), 423 (26 weeks), 397 (52 weeks), 377 (93 weeks) mg/kg bw per day. |
HA: 12/52 (control), 7/28 (4 weeks), 18/55 (10 weeks), 22/54 (26 weeks), 30/54* (52 weeks), 26/44* (93 weeks); |
ND |
Wehmas et al., 2017 |
DCAA |
Male B6C3F1 mice |
Initiation and drinking water. Initiation: 2.5 µg/kg ENU (i.p. injection); 0, 2, or 5 g/L (0, 400, or 1 000 mg/kg bw per day) neutralized DCAA for 61 weeks. |
HA: 1/22, 22/29*, 31/32*; |
NA/400 (limitation: no uninitiated controls) |
Herren-Freund et al., 1987 |
DCAA |
Male B6C3F1 |
Initiation and drinking water. Initiation: 16.4 µg/kg sodium acetate (as ENU control); 0 or 5 g/L (0 or 1 000 mg/kg bw per day) neutralized DCAA for 61 weeks. |
HA: 2/22, 25/26*; |
NA/1000 (limitation: no uninitiated controls) |
Herren-Freund et al., 1987 |
DCAA |
Female B6C3F1 mice |
Initiation and drinking water. Initiation: 25 mg/kg MNU (single i.p. injection); 0, 2.0, 6.67, or 20 mM (0, 50, 167, or 468 mg/kg bw per day) neutralized DCA for up to 52 weeks. |
HA: 7/38, 2/8, 1/8, 16/22*; HC: 4/38, 3/8, 2/8, 4/22 |
167/468 (limitation: no uninitiated controls) |
Pereira and Phelps, 1996 |
DCAA |
Male and female |
Initiation and drinking water. Initiation: 30 mg/kg MNU (single i.p. injection); 0 or 3.2 g/L (males: 0 or 453 mg/kg bw per day; females: 0 or 483 mg/kg bw per day) neutralized DCAA for 31 weeks. |
Males: HA: 2/8, 21/25*; HC: 0/8, 7/25; HA or HC: 2/8, 23/25* |
NA/453 (limitation: no uninitiated controls) |
Pereira et al., 2001 |
TCAA |
Male and female B6C3F1 mice (10–35/sex/dose) |
Drinking water, males: 0, 1, or 2 g/L (0, 164, or 329 mg/kg bw per day); females: 0 or 2 g/L (0 or 482 mg/kg bw per day) neutralized TCAA for 52 weeks; 11 males in the 2 g/L group were treated for 37 weeks and sacrificed at 52 weeks (recovery group). |
Males: HA: 0/35, 2/11, 1/11; Females: no tumours |
Not all mice were examined |
Bull et al., 1990 |
TCAA |
Male B6C3F1 mice (number not specified) |
Drinking water, 0 or 4.5 g/L (0 or 583 mg/kg bw per day) neutralized TCAA for 94 weeks. |
HA: 0%, 43.3%*; HC: 12.3%, 72.8%*; HA and/or HC: 11.4%, 86.7%* |
Only percentages reported |
U.S. EPA, 1991 |
TCAA |
Male B6C3F1 mice (number not specified) |
Drinking water, 0 or 4.5 g/L (0 or 1 080 mg/kg bw per day) neutralized TCAA for 104 weeks. |
HC: 19%, 73.3% |
Only percentages reported, no statistical analysis |
Ferreira Gonzalez et al., |
TCAA |
Female B6C3F1 mice (18–90/dose) |
Drinking water, 0, 2, 6.67, or 20 mM (0, 44, 155, or 453 mg/kg bw per day) TCAA for 360 or 576 days. |
360 days: HA: 1/40, 3/40, 3/19, 2/20; HC: 0/40, 0/40, 0/19, 5/20*; 576 days: HA: 2/90, 4/53, 3/27, 7/18*; HC: 2/90, 0/53, 5/27*, 5/18* |
360 days: 155/453; 576 days: 44/155 |
Pereira, 1996 |
TCAA |
Male F344/N rats (50/dose) |
Drinking water, 0, 0.05, 0.5, or 5 g/L (0, 3.6, 32.5, or 364 mg/kg bw per day) neutralized TCAA for 104 weeks. |
HA: 1/23, 1/24, 3/20, 1/22; HC: 0/23, 0/24, 0/20, 1/22 |
NA/364 |
DeAngelo et al., 1997 |
TCAA AA |
Male B6C3F1 mice (20/dose) |
Drinking water for 52 weeks. Exp1: 0, or 2 g/L (0 or 238 mg/kg bw per day) neutralized TCAA. Exp2: 0, 0.5, or 2 g/L (0, 55, or 238 mg/kg bw per day) neutralized TCAA. |
Exp1: Hepatic nodules, HA and HC: 4/12, 33/40*; Exp2: HA: 0/20, 5/20, 6/20; HC: 0/20, 3/20, 3/20; HA and HC: 0/20, 6/20*, 8/20* |
NA/55 |
Bull et al., 2002 |
TCAA |
Male B6C3F1 mice; Exp1: 30/dose; Exp2: 75/dose; Exp3: 72/dose |
Drinking water. Exp1: 0, 0.05, 0.5, or 5 g/L (0, 7.7, 68.2, or 602.1 mg/kg bw per day) neutralized TCAA for 60 weeks; controls received 2 g/L sodium chloride. Exp2: 0 or 4.5 g/L (0 or 572 mg/kg bw per day) neutralized TCAA for 104 weeks; controls received1.5 g/L neutralized acetic acid. Exp3: 0, 0.05, or 0.5 g/L (0, 6.7, or 81.2 mg/kg bw per day) neutralized TCAA for 104 weeks; controls received deionized water. |
Exp1: HA and/or HC 45-60 weeks: 4/35, 5/32, 12/34*, 19/34*; HA and/or HC 60 weeks: 4/30, 4/27, 11/29*, 16/29*. Exp2: HA: 0/25, 21/36*; HC: 3/25, 28/36*; HA and/or HC: 3/25, 32/36*. Exp3: HA and/or HC 52-104 weeks: 31/56, 21/48, 36/51; HA and/or HC 104 weeks: 27/42, 19/35, 32/36* |
Exp1: 7.7/68.2; Exp2: NA/572; Exp3: 6.7/81.2 |
#DeAngelo et al., 2008 |
TCAA |
Male B6C3F1 mice |
Initiation and drinking water for 61 weeks. Exp1: Initiation 2 µl/g sodium acetate as ENU control (single i.p. injection); 0 or 5 g/L (0 or 1 g/kg bw per day) neutralized TCAA. Exp2: initiation: 2.5 µg/kg ENU (single i.p. injection); 0, 2 or 5 g/L (0, 0.4 or 1 g/kg bw per day) neutralized TCAA. Exp3: initiation: 10 µg/kg ENU (single i.p. injection); 0 or 5 g/L (0 or 1 g/kg bw per day) neutralized TCAA. |
Exp1: HA: 2/22, 8/22*; HC: 0/22, 7/22*. Exp2: HA: 1/22, 11/33*, 6/23*; HC: 1/22, 16/33*, 11/23*. Exp3: HA: 9/23, 11/28; HC: 9/23, 15/28 |
Exp1: TCAA acted as a complete carcinogen; LOAEL 1000; Exp2: LOAEL 400; Exp3: NA |
Herren-Freund et al., 1987 |
TCAA |
Male and female B6C3F1 mice (8–29/dose) |
Initiation and drinking water. Initiated with 30 mg/kg MNU (i.p. injection); 0 or 4.0 g/L (females: 0 or 0.96 g/kg bw per day, males: 0 or 1 g/kg bw per day) neutralized TCAA for 31 weeks. |
Females: HA: 2/29, 2/14; HC: 0/29, 4/14; HA and HC: 2/29, 6/14. Males: HA: 2/8, 12/16; HC: 0/8, 10/16*; HA and HC: 2/8, 13/16*; renal tumours (cystic |
NA/1000 |
Pereira et al., 2001 |
TCAA |
Female B6C3F1 mice (20– |
Initiation and drinking water. Initiation 25 mg/kg MNU (i.p. injection); 0, 6 or 25 mM neutralized TCAA for 44 weeks. |
HA: not reported; HC: 0/29, 0/20, 4/29 |
NA |
Pereira et al., 1997 |
TCAA |
Female B6C3F1 mice (6– |
Initiation and drinking water for 52 weeks. Exp1: Initiation (i.p. injections) 4 ml/kg MNU control; 0, 2, 6.67 or 20 mM (0, 78, 262 or 784 mg/kg bw per day) neutralized TCAA. Exp2: Initiation 25 mg/kg MNU (i.p. injection); 0, 2, 6.67 or 20 mM (0, 78, 262 or 784 mg/kg bw per day) neutralized TCAA. |
Exp1: HA: 1/40, 3/19, 3/19, 2/40; HC: 0/40, 0/19, 0/19, 5/40*. Exp2: HA: 7/38, 3/10, 5/6*, 15/22*; HC: 4/38, 0/10, 5/6*, 18/22* |
Exp1: 262/784; TCAA acted as a complete carcinogen; Exp2: 78/262 |
Pereira and Phelps, 1996a |
DBAA |
Male or female |
Drinking water, 0, 50, 500 or 1 000 mg/L (0, 2, 20 or 40 mg/kg bw per day for male rats; 0, 2,25 or 45 mg/kg bw per day for female rats; 0, 4, 45 or 87 mg/kg bw per day for male mice; and 0, 4, 35 or 65 mg/kg bw per day for female mice) DBAA for 2 years. |
Male mice: HA: 18/49, 37/50*, 37/50*, 42/50*; HC: 14/49, 9/50, 19/50, 26/50*. HA or HC: 28/49, 41/50*, 42/50*, 47/50*; hepatic cystic degeneration in male rats. Alveolar epithelial hyperplasia in female rats. Male mouse response was greater than rat and female mice. |
4/45 |
#NTP, 2007a |
BCAA |
Female F344/N rat; male and female B6C3F1 mice (50/dose) |
Drinking water for 2 years. BCAA 0, 250, 500, 1 000 mg/L (Rats: 0, 13, 25, 50 mg/kg bw per day; male mice: 0, 25, 50, 90 mg/kg bw per day; female mice: 0, 15, 30, 60 mg/kg bw per day. |
Rats: adenoma of large intestine at 50, multiple fibroadenomas of mammary gland at 25 and 50, trend for HA. Male mice: adenomas at 25 and 50, carcinomas at 50 and 90, adenomas and carcinomas combined at all doses, hepatoblastoma at all doses. Also reduced survival. Female mice: adenomas at all doses, carcinomas at 30, combined at all doses. |
Rat: 13/25; mice male: NA25; female mice: NA/15 |
#NTP, 2009 |
BDCAA |
Female and male F344/Ntac rats (50/dose); male and female B6C3F1 mice (66/dose) |
Drinking water: BDCAA 0, 250, 500, 1 000 mg/L (male rats: 0, 11, 21, 43 mg/kg bw per day; female rats 0, 13, 28, 57 mg/kg bw per day for 104 weeks; mice: 0, 23, 52, 108 mg/kg bw per day for males and 0, 17, 34, 68 for females) for 105 weeks. |
Rats: Not statistically significant but biologically significant since they are not found in historical controls, including brain glioma and oligodendroglioma. Mice: Males: HC ≥ 23 mg/kg bw per day, HB ≥ 23 mg/kg bw per day, and combined but only at 23 and 108 mg/kg bw per day; females: HA ≥ 17 mg/kg bw per day, HC ≥ 34 mg/kg bw per day, HB 68 mg/kg bw per day and combined at ≥ 17 mg/kg bw per day. |
Rats: none; mice: males: NA/23; females: NA/17 |
#NTP 2015 |
| BCAA – bromochloroacetic acid; BDCAA – bromodichloroacetic acid; DBAA – Dibromoacetic acid; DCAA – dichloroacetic acid; ENU – N-ethyl-N-nitrosourea; Exp – experiment; HA – hepatocellular adenoma; HB – hepatoblastoma; HC – hepatocellular carcinoma; i.p. – intraperitoneal injection; LOAEL – lowest observed adverse effect level; MCAA – monochloroacetic acid; MNU – N-methyl-N-nitrosourea; N – number; NA – not available NOAEL – no observed adverse effect level; TCAA – trichloroacetic acid; * – statistically significant; # indicates key study (see section 2.5 selection of key study and section 3.0 derivation of HBV). Bromodichloroacetic acid, bromoiodoacetic acid, chloroiodoacetic acid, diiodoacetic acid, monobromoacetic acid, monoiodoacetic acid, tribromoacetic acid: No studies on carcinogenicity found. | |||||
Appendix F: Mixture Analysis
In drinking water, HAAs often occur as a mixture with each other and other DBPs. Based on the toxicity database for mixtures of HAAs, the pathway for mixture assessment is not clearly evident (Table F1). Therefore, a “Combined Exposure to Multiple Substances (Mixture) Risk Assessment” (adapted from WHO [2017a] and EFSA [2019]) for people in Canada orally exposed to HAAs through drinking water was conducted to:
- organize and consider all relevant information for human mixture risk assessment in a systematic, iterative, and “fit-for-purpose” way
- provide a rationale for considering HAAs individually or in (sub)groups for risk assessment and management
- prioritize substances for further testing (by highlighting areas of uncertainty and identifying critical data needs)
- identify potential data-filling tools (for example, read-across, trend analysis, new approach methods [NAMs]) for data poor substance
- determine a risk estimate for risk management
Relevant information on exposure, kinetics, health effects, MOAs and HBVs from sections 1.0–3.1 are integrated and compared to support the mixture risk assessment of HAAs (Table F2).
Problem formulation
The first step in the mixture risk assessment uses problem formulation to consider if a mixture risk assessment is appropriate, given the goal of the assessment and define assessment grouping(s).
- Is the nature of exposure known? The mixture is component-based and includes 13 different types of HAAs including nine chlorine and bromine-containing mono-, di-, or tri-HAAs and four iodine-containing acetic acids. Monitoring data for these substances in drinking water are available from all provinces and territories. DCAA and TCAA had the highest detection rates and concentrations across Canada, while MBAA and DBAA had the lowest. BCAA concentrations varied considerably, and thus are expected to occasionally increase HAA6 concentrations compared to HAA5 concentrations. Similarly, TBAA, CDBAA and BDCAA are also expected to occasionally increase HAA9 concentrations compared to HAA6. I-HAA compounds had very low detection rates. HAAs are long lived in water.
- Is co-exposure likely given the context? All HAAs are by-products of the disinfection of drinking water. Consequently, they are routinely found together in drinking water and co-exposure is likely
- Is co-exposure likely within a relevant timeframe?
- External co-exposure: Since HAAs are highly soluble in water and routinely found together in drinking water, external co-exposure during a similar timeframe is likely. However, bromine treatment is not expected at the same time as chlorine treatment; one is usually selected over the use of the other.
- Internal co-exposure: Internal co-exposure is likely through the ingestion of water. Mono-, di- and tri-HAAs are rapidly absorbed and widely distributed internally. However, there are differences in plasma protein binding, metabolism, and clearance that could be used to support separating substances into subgroups (Table F2); the trends appear consistent across species (human, mouse and rat).
- Biomonitoring: No data available.
- Is there a rationale for considering the substances in an assessment group based on hazard? Overall, HAAs have similar use but their structure, kinetics, health effects (common target tissues and carcinogenicity) and MOAs vary depending on the substitution type or number (Table F2). Kinetic and carcinogenicity data indicate that the bromine-containing HAAs have a higher metabolism and toxicity than chlorine-containing HAAs. HAAs that contain at least two halogens (one of which is a bromine) induce liver tumours in mice, malignant mesotheliomas in rats, and extrahepatic tumours in mice and rats. Conversely, no extrahepatic tumours were induced by the chlorine containing HAAs. The carcinogenic MOA is dependent on the HAA speciation (chlorine vs. bromine vs. iodine). Br-HAAs have a greater potential for direct-DNA genotoxic MOA, while the carcinogenetic MOA of Cl-HAAs is non-direct DNA (epigenetic, and/or altered energy metabolism). I-HAAs are also potentially direct-DNA genotoxic. Since the HAAs do not share a common carcinogenic MOA, it is recommended to group them by their carcinogenic MOA, direct-DNA or non-direct DNA.
Mixture risk assessment: Based on the problem formulation, a mixture risk assessment is appropriate for subgroups of HAAs, rather than all 13 HAAs together. It is not reasonable to assume that MOAs for all HAAs are the same and, therefore, the simple dose addition hazard index approach is not appropriate. HAAs should be sub-grouped based on their carcinogenic MOAs (direct-DNA or non-direct DNA). Exposure and hazard information should be considered by an iterative and tiered approach, then compared for risk characterization using a response addition method. Two response addition methods for combining the exposure and hazard information for the mixture of HAAs could be used. The first method is simple and conservative by assuming that the HAAs within each subgroup have equivalent potencies to the most toxic member (IC and then adding the total exposures measured for each HAAs within the subgroup). This total exposure value is then compared to the HBV for the subgroup IC. The second CRPF method derives ICEDs for each subgroup HAA component before adding them. The U.S. EPA (2003c; Evan et al., 2020) also used this approach for risk assessment of drinking-water DBP mixtures (HAA and THMs). Briefly:
- Components of the mixture were grouped into subgroups based on their MOA (direct DNA-reactive or non-direct DNA-reactive).
- Relative potency factors (RPFs) were derived for all HAAs components in each subgroup relative to an IC (DBAA or DCAA). The potencies are the HEDs derived in section 3.1 from dose-response curves (meeting assumption of similarly shaped dose-response curves within the exposure region of interest) using the same benchmark response (10%). The RPF for each component HAA in the subgroup is calculated by HEDIC divided by the HEDcomponent HAA. If an RPF can not be calculated for a component HAA in the subgroup, a surrogate component can be used (for example, the IC itself). Assumption: The mixture toxicity is equivalent to the toxicity of its most potent or most studied component, scaled by relative exposure (next step).
- An ICED for each component in a subgroup is calculated by the component exposure multiplied by the component RPF.
- A subgroup ICED is the sum of all the component ICEDs within each subgroup. The subgroup ICED can then be compared to the HBV of the IC. If the subgroup ICED < HBV of the IC, then the combined risk is considered acceptable. If necessary, the subgroup ICED could be multiplied by the slope factor of the IC to obtain a subgroup risk estimate. If desired, the total mixture average cancer risk estimate can be derived by adding the subgroup risks.
- Example calculations and results are summarized in Table F3.
The CRPF method derives ICEDs for each subgroup. The subgroup ICED can then be compared to the HBV of the IC for each subgroup. If the subgroup ICED < HBV of the IC, then the combined risk is considered acceptable.
For the direct DNA-reactive subgroup, the HBV of the IC (DBAA) is 0.003 mg/L, and for the non-direct DNA-reactive subgroup, the HBV of the IC (DCAA) is 0.07 mg/L.
Assumptions/Limitations/Uncertainties: For exposure, not all compounds are measured by all jurisdictions and individual differences in exposure are not accounted for. Assumptions: Response addition, no interactions, stable mixture, HAAs are 100% bioavailable. Uncertainties: Hazard database is not adequate for all components, lack of HBVs for two HAAs (use of surrogates), knowledge of human relevance is deficient. Limitations: Reliance on the quality of the toxicological database of the IC. Labour intensive for chemicals that do not have defined scaling/potency factors.
Advantages and potential future considerations: Accounts for the potency of different groups of chemicals present in the mixture. This approach can accommodate other DBPs for which fewer toxicity data exist. Although in vivo data may not be available, RPFs can be derived using other measures of potency (for example, in vitro genotoxicity data, in vitro development data from section 2.3.2, or I-HAA qIVIVE data from Table 13), provided that the data are relevant to the endpoint of interest and also exist for the IC. DBP assessment could be broadened to take into account dermal, oral, and inhalation exposure routes, and patterns of human behaviour that affect water usage and contact time with the drinking water. Refined PBPK models could be useful to derive internal estimates of exposure for the assessment. Probabilistic hazard estimate data from new approach methods could be included (for example, qIVIVE data from I-HAAs; section 2.5) for chemicals that lack data. The assessment of combined exposure to a mixture of THMs and HAAs in drinking water could be considered using this approach.
| HAAs (Study type) |
NOAEL/LOAEL (mg/kg per day) |
Method | Critical effect(s) (mg/kg bw per day) |
Reference |
|---|---|---|---|---|
DCAA + TCAA (Subchronic) |
ND/ 7.5:12.5 DCAA:TCAA |
Mice, male B6C3F1 (8/dose), gavage 7.5:12.5 (mix I), 15:25 (mix II) or 30:50 (mix III) DCAA:TCAA mg/kg per day for 13 weeks. |
≥ 7.5:12.5 DCAA:TCAA Significant and dose-dependent increases in markers of superoxide anion formation, lipid peroxidation and DNA single strand breaks. Mix I and II: Additive for all endpoints. Mix III: Additive for superoxide anion formation; greater than additive for lipid peroxidation and DNA single strand breaks. |
Hassoun et al., 2014 |
DCAA + TCAA (Subchronic) |
ND/ 7.5:12.5 DCAA:TCAA |
Mice, male B6C3F1 (6/group) gavaged 7.5:12.5 (mix I), 15:25 (mix II) or 30:50 (mix III) DCAA + TCAA mg/kg per day for 13 weeks. |
≥ 7.5:12.5 DCAA:TCAA Significant increases in superoxide anion formation, myeloperoxidase activity, and tumor necrosis factor alpha levels in the peritoneal lavage cells. For all endpoints, mix II was significantly higher than mix I, but not significantly different from mix III. Mix I and II: Additive effect on phagocytic activation. Mix III: Less than additive effect on phagocytic activation. |
Hassoun et al., 2013 |
BCAA + DBAA (Reproduction) |
ND/ 1.6:2 BCAA:DBAA |
Rats, male Sprague-Dawley (8/group) gavaged 1.6:2 mg/kg BCAA:DBAA or 4:5 mg/kg BCAA:DBAA for 14 days. |
≥ 1.6:2 BCAA:DBAA Significant decrease in SP22 sperm protein (additive). |
Kaydos et al., 2004 |
HAA5 (Reproduction/ development) |
ND/44 |
Rats, F344 pregnant females (9–17/dose) gavaged with proportional mixtures (MCAA, DCAA, TCAA, MBAA, DBAA) low 44 (1, 18, 16, 7, 2), mid 88 (2, 36, 32, 14, 4) or high 176 (4, 72, 64, 28, 8) mg/kg bw per day in castor oil from GD 6–20. |
≥ 44: increased pups/litters with eye defects |
Narotsky et al., 2011 |
HAA5 + THM4 (Reproduction/ development) |
ND/44.25 |
Rats, F344 pregnant females (10–19/dose) gavaged with proportional mixtures (MCAA, DCAA, TCAA, MBAA, DBAA, THM4) low 44.25 (0.5, 9, 8, 3.5, 1, 22.25), mid 88.5 (1, 18, 16, 7, 2, 44.5) or high 177 (2, 36, 32, 14, 4, 89) mg/kg bw per day in castor oil from GD 6 to 20. |
≥ 44.25: significant weight loss after 1st dose; significantly reduced body weight gains during GD 6–20; prenatal loss significantly increased; repeated blinking after 1st dose; ocular reactions (squinting, blinking, ptosis) after 2nd, 3rd, or 4th doses; dose-related piloerection ≥ 88.5: pregnancy loss; full-litter resorption 177: high carriage in 5/11 animals; 2/11 dead Note: The addition of THMs to HAA5 seemed to ameliorate HAA-induced eye defects. This may be due to inhibition of CYP2E1 or competition for CYP2E1. |
Narotsky et al., 2011 |
HAA5 + THM4 (Reproduction/ development) |
70 mg/L / 140 mg/L |
Rats, Sprague-Dawley pregnant females (parental, F1 and F2 generations; 25 parental rats/dose) given proportional mixtures (MCAA, DCAA, TCAA, MBAA, DBAA, THM4) in their drinking water at: 70 mg/L (7.04, 13.52, 6.85, 0.82, 1.77, 40 mg/L) 140 mg/L (14.07, 27.03, 13.71, 1.64, 3.54, 80 mg/L), or 280 mg/L (28.15, 54.06, 27.42, 3.28, 7.09, 160 mg/L), proportional to 0, 500x, 1000x or 2000x U.S. EPA’s MCLs, from GD 0 to PND 6 of the F2 generation. |
≥ 70 mg/L: post-weaning water consumption reduced ≥ 140 mg/L: maternal water consumption reduced; F1 pup weights unaffected at birth but reduced on PND 21; onset of puberty delayed 280 mg/L: F1 pup weights unaffected at birth but reduced on PND 6; post-weaning F1 body weights reduced; significantly increased incidence of retained nipples and compromised sperm motility in males; nephropathy and adrenal cortical pathology in parental dams Notes: F1 estrous cycles and fertility were unaffected. F2 litters showed no effects on pup weights or survival. Reduced maternal water consumption during lactation may have contributed to reduced pup weights. |
Narotsky et al., 2015 |
BCAA + DBAA (Development; in vitro) |
ND/ 85:100 µM BCAA:DBAA |
GD 9.5 rat embryo culture (7–24/dose) exposed to 85:100 µM BCAA:DBAA or 128:171 µM BCAA:DBAA for 48 hours. |
≥ 85:100 µM BCAA:DBAA: significantly dysmorphogenic; significantly reduced somite number; significantly reduced developmental score Note: Embryo toxicity appears to be additive. |
Andrews et al., 2004 |
BCAA + DCAA (Development; in vitro) |
ND/ 85:1075 µM BCAA:DCAA |
GD 9.5 rat embryo culture (27–31/dose) exposed to 85:1075 µM BCAA:DCAA or 128:1700 µM BCAA:DCAA for 48 hours. |
≥ 85:1075 µM BCAA:DCAA: significantly dysmorphogenic; significantly reduced somite number; significantly reduced crown-rump length; significantly reduced developmental score 128:1700 µM BCAA:DCAA: significantly reduced head length Note: Embryo toxicity appears to be additive. |
Andrews et al., 2004 |
DBAA + DCAA (Development; in vitro) |
ND/ 100:1075 µM DBAA:DCAA |
GD 9.5 rat embryo culture (14–23/dose) exposed to 100:1075 µM DBAA:DCAA or 171:1700 µM DBAA:DCAA for 48 hours. |
≥ 100:1075 µM DBAA:DCAA: significantly dysmorphogenic; significantly reduced somite number; significantly reduced developmental score 171:1700 µM DBAA:DCAA: significantly reduced crown-rump length Note: Embryo toxicity appears to be additive. |
Andrews et al., 2004 |
BCAA + DBAA + DCAA (Development; in vitro) |
ND/ 56.7:66.6:717 µM BCAA:DBAA:DCAA |
GD 9.5 rat embryo culture (12–26/dose) exposed to 56.7:66.6:717 µM BCAA:DBAA:DCAA or 85:114:1133 µM BCAA:DBAA:DCAA for 48 hours. |
≥ 56.7:66.6:717 µM BCAA:DBAA:DCAA: significantly dysmorphogenic; significantly reduced somite number; significantly reduced developmental score Note: Embryo toxicity appears to be additive. |
Andrews et al., 2004 |
| BCAA – bromochloroacetic acid; DBAA – dibromoacetic acid; DCAA – dichloroacetic acid; HAA – haloacetic acid; HAA5 – monochloroacetic acid, DCAA, TCAA, monobromoacetic acid and DBAA; GD – gestation day; LOAEL – lowest observed adverse effect level; MCL – maximum contaminant level; ND – not determined; NOAEL – no observed adverse effect level; PND – pre-natal day; TCAA – trichloroacetic acid; THM4 – chloroform, bromodichloromethane, dibromochloromethane and bromoform. | ||||
| Category | MCAA | DCAA | TCAA | MBAA | DBAA | TBAA | BCAA | CDBAA | BDCAA | I-HAAs | Mixture |
|---|---|---|---|---|---|---|---|---|---|---|---|
Structure |
Chloro- (mono-HAA) |
Chloro- (di-HAA) |
Chloro- (tri-HAA) |
Bromo- (mono-HAA) |
Bromo- (di-HAA) |
Bromo- (tri-HAA) |
Bromo- Chloro- (di-HAA) |
Bromo- Chloro- (tri-HAA) |
Bromo- Chloro- (tri-HAA) |
Iodo- (mono-or di-HAA) |
mixed |
Potential for co-exposure (section 1.0) |
Low-moderate |
High |
High |
Low-moderate |
Low-high |
Low |
Low-high |
Moderate-high |
High |
Very low |
HAA5 and HAA6 more commonly measured than HAA9. Long-lived in water |
Internal potential for co-exposure (section 2.1 Kinetics; no biomonitoring data) |
A: rapid, high BA D: rapid, wide, high protein binding M: glutathione conjugation E: urine |
A: variable, high BA D: wide, low plasma protein binding M: high, GST-ζ, DCAA to MCAA E: urine t1/2 in rats 2.40 hrs, large human interindividual variations, plasma t1/2 20-36 minutes |
A: high BA, 6 hrs; D: wide, med plasma protein binding; Vd human lower M: least, some TCAA to DCAA E: human slower than rodent; t1/2 2-6 days human, most eliminated unchanged
|
A: rapid D: rapid M: rapid E: rapid (not detected in plasma 1 minute after oral dose) |
A: lower BA; 1.2 hrs D: no sig BioA, low plasma protein binding, Vd 400; M: GST-ζ (inhibits own M) E: rapid t1/2 0.72 hrs |
A: med BA; 1.1 hrs D: wide, low BioA; higher plasma protein binding M: rapid, TBAA to DBAA (in vitro) E: t1/2 0.58 hrs |
A: med BA; 1.2 hrs; D: wide, low BioA; low plasma protein binding M: GST-ζ (inhibits own M) E: rapid clearance from blood due to biotransformation; t1/2: 3.93 hrs |
A: high BA; 1.7 hrs; D: wide, low BioA; med plasma protein binding M: rapid P450 CDBAA to BCAA (in vitro) E: t1/2 1.26 hrs |
A: high BA; 0.7 hrs; D: wide, low BioA; med plasma protein binding M: rate mouse > rats; metabolites: oxalate, glycolate, glyoxylate and DCAA E: urine rats > mice, t1/2 1.4–1.85 hrs |
D: rapidly to organs rich in SH groups such as thyroid and liver
|
Metabolism (some limited): TCAA to DCAA, DCAA to MCAA, TBAA to DBAA, CDBAA to BCAA and BDCAA to DCAA. |
Critical health effects animal- non-cancer |
Liver, kidney and heart, testis; systemic tox-rat |
Liver, kidneys, spleen, brain and nervous system, male reproductive system and fetus |
Liver, kidneys, female reproduction and fetal development |
Limited database; developmental effects |
Limited database; male repro, liver, neuro |
Limited database; weak kidney and development effects |
Targets included the liver, kidney, reproductive and developmental systems |
Limited database; male repro effect |
Liver, kidney and in fetus (e.g., heart, eye defects) |
MIA caused reproductive, developmental and endocrine effects |
Toxicity trends: Cl- << Br- < I-HAAs; Mono- > di- > tri-HAAs (except MCAA) |
Early event in cancer MOA |
not-dG; EM |
not-dG; EPI and EM |
not-dG; EM, EPI PPAR |
dG-?; EM |
dG; EM PPAR, EPI |
dG-?; EM (in vitro) |
dG-?; EM (in vitro) |
dG-?, EM (in vitro) |
dG-?, EM (in vitro) |
dG, EM (in vitro) |
Likely molecular initiating event: react with SH group to form ROS (indirect genotoxicity; Stalter et al., 2016).
Directly genotoxic (dG): potential iodinated and brominated HAAs > chlorinated HAAs. |
HED mg/kg bw per day |
0.92 |
0.50 |
0.85 |
ND |
0.57 |
ND |
1 |
ND |
0.87 |
ND |
HAA9 are expected to behave as expected under additivity (Yeatts et al., 2010); DCAA and TCAA on lipid peroxidation and single strand DNA breaks were greater than additive at certain HAA levels (Hassoun et al., 2014). |
HBV (mg/L) |
0.12 |
0.07 |
0.11 |
ND |
0.0025 |
ND |
0.005 |
ND |
0.004 |
ND |
HAA9 are expected to behave as expected under additivity (Yeatts et al., 2010); DCAA and TCAA on lipid peroxidation and single strand DNA breaks were greater than additive at certain HAA levels (Hassoun et al., 2014). |
| A – absorption; BA – bioavailability; BCAA – bromochloroacetic acid; BDCAA – bromodichloroacetic acid; BioA – bioaccumulation; CDBAA – chlorodibromoacetic acid; D – distribution; DBAA – dibromoacetic acid; DCAA – dichloroacetic acid; dG – direct DNA genotoxic; E – elimination; EM – altered energy metabolism; EPI – epigenetic; HAAs – haloacetic acids; HAA5 – MCAA, DCAA, TCAA, MBAA and DBAA; HAA6 – HAA5 plus BCAA; HAA9 – HAA6 plus TBAA, CDBAA and BDCAA; hrs – hours; I – iodinated; M – metabolism; MBAA – monobromoacetic acid; MCAA – monochloroacetic acid; MOA – mode of action; ND – not determined; not-dG – non-direct DNA genotoxic; PPAR – peroxisome proliferator-activated receptor; ROS – reactive oxygen species; SH – sulfhydryl; sig – significant; t1/2 – half-life; TBAA – tribromoacetic acid; TCAA – trichloroacetic acid; Vd – volume of distribution; ? – unknown. | |||||||||||
| HAA | HED (mg/kg bw per day) |
RPF (HEDIC/HEDcomponent HAA) |
Exposure exampleTable F3 Footnote a (μg/L) |
ICED (μg/L) Component Exposure*RPF |
ICED (μg/L) Subgroup Sum of components |
|---|---|---|---|---|---|
| Direct DNA-reactive subgroup | N/A | N/A | N/A | N/A | 0.95 |
| DBAAic | 0.57 | 1 | 0.2 | 0.20 | N/A |
| MBAA | NA | 1 | 0.1 | 0.10 | N/A |
| TBAA | NA | 1 | 0.1 | 0.10 | N/A |
| BCAA | 1 | 0.57 | 0.5 | 0.29 | N/A |
| CDBAA | NA | 1 | 0.3 | 0.30 | N/A |
| BDCAA | 0.87 | 0.66 | 0.1 | 0.07 | N/A |
| Non-direct DNA-reactive subgroup | N/A | N/A | N/A | N/A | 37.77 |
| DCAAic | 0.50 | 1 | 23 | 22.90 | N/A |
| TCAA | 0.85 | 0.6 | 23 | 13.24 | N/A |
| MCAA | 0.92 | 0.54 | 3 | 1.63 | N/A |
Method for combining exposure and hazard information. BCAA – bromochloroacetic acid; BDCAA – bromodichloroacetic acid; CDBAA – chlorodibromoacetic acid; DBAA – dibromoacetic acid; DCAA – dichloroacetic acid; HBV – health-based value; HED – human equivalent dose; IC – index chemical; ICED – index chemical equivalent dose; MBAA – monobromoacetic acid; MCAA – monochloroacetic acid; NA – not available; N/A – not applicable; RPF – relative potency factor (If an RPF is not known, then the RPF of the index chemical is used as a surrogate); TBAA – tribromoacetic acid; TCAA – trichloroacetic acid.
|
|||||
Appendix G: Suggested Parameters to Monitor From Natural Organic Matter (NOM) Guidance Document
| Parameter | Location | Frequency: Variable source | Frequency: Stable source | Frequency: Ideal | |
|---|---|---|---|---|---|
| Organic colour (true colour) | Raw and treated | Daily | Weekly | Online | |
| UV absorbance (at 254 nm) or UV transmittance | Raw and filteredTable G1 Footnote a | Daily | Weekly | Online | |
| Chemical oxygen demand (COD) | Raw, treatment processesTable G1 Footnote b and treated | Daily | Weekly | Online | |
| Dissolved or total organic carbon (DOC or TOC) | Raw and treatedTable G1 Footnote a | Weekly | Monthly | Online | |
| Specific UV absorbance (SUVA) – calculate from UV254 and DOC | Raw and treatedTable G1 Footnote a | Weekly | Monthly | Daily | |
Inorganic compounds that can enhance the reactivity of NOM to form DBPs:
|
Raw and treated | Quarterly | Quarterly | Quarterly | |
| Coagulant demand | Coagulation processTable G1 Footnote c | Daily | Daily | Online | |
| Zeta potential or streaming current – when NOM controls or influences coagulant dose | Coagulation processTable G1 Footnote c | Online | Online | Online | |
| Biological stability: | Disinfectant residual | Distribution system | Weekly | Weekly | Online |
| Biofilm formation rate – measured by adenosine triphosphate (ATP) accumulated on mild steel coupons | Every two weeks | Monthly | N/A | ||
| Corrosion rate – measured by linear polarization resistance using mild steel coupons | Monthly | Monthly | N/A | ||
Influence of NOM on corrosion:
|
In accordance with CC program | In accordance with CC program | In accordance with CC program | In accordance with CC program | |
CC – corrosion control.; N.A. – not applicable. Source: Health Canada, 2020.
|
|||||