
National surveillance of antimicrobial susceptibilities of Neisseria gonorrhoeae annual summary 2019
Executive summary
- This report consists of laboratory surveillance data for Neisseria gonorrhoeae isolates submitted by provincial microbiology laboratories to the National Microbiology Laboratory (NML) from 2015 – 2019 as part of the Gonococcal Antimicrobial Surveillance Program (GASP – Canada).
- The Canadian reported rate of gonorrhea is on the rise and has increased considerably from 21.8 cases per 100 000 population in 2001 to 94.3 cases per 100 000 population in 2019. Gonorrhea is the second most commonly reported bacterial sexually transmitted infection in Canada with 35 443 cases reported in 2019.
- Antimicrobial resistance in N. gonorrhoeae is a serious threat to effective treatment of gonococcal infections. Over time, N. gonorrhoeae has acquired resistance to many antibiotics such as penicillin, tetracycline, erythromycin and ciprofloxacin. The emergence of isolates with decreased susceptibilities to the cephalosporins and resistance to azithromycin along with reports of treatment failures nationally and globally, raise the possibility of gonorrhea infections becoming untreatable in the future.
- In 2019, a total of 4859 N. gonorrhoeae isolates were cultured and tested in public health laboratories across Canada; 2921 of these were submitted to the NML for Antimicrobial Susceptibility Testing (AST). AST data for an additional 1413 N. gonorrhoeae isolates were submitted by provincial public health laboratories and included in the analysis. The total number of isolates cultured in all provinces was used as the denominator to calculate resistance proportions.
- Between 2017-2018, four ceftriaxone resistant N. gonorrhoeae were identified in Canada. In 2019 there were no ceftriaxone resistant N. gonorrhoeae identified in Canada.
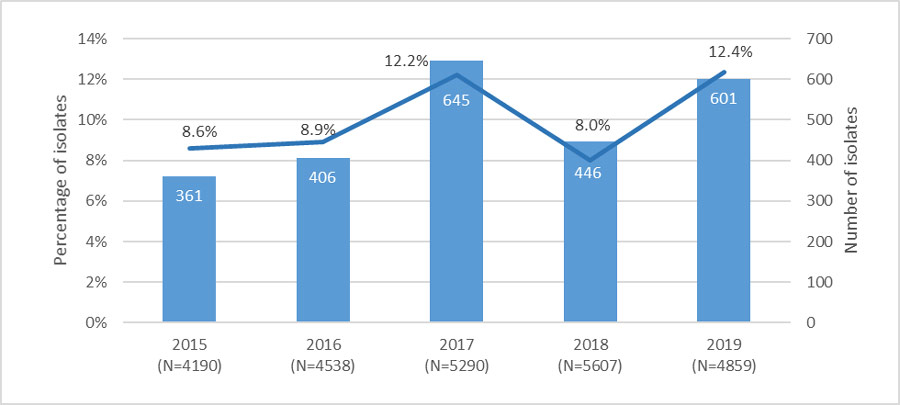
- The proportion of multi-drug resistant (MDR-GC; decreased susceptibility to a cephalosporin or resistance to azithromycin as well as resistance to at least two other antimicrobials) increased from 8.6% (361/4190) in 2015 to 12.4% (601/4859) in 2019 (Figure A).
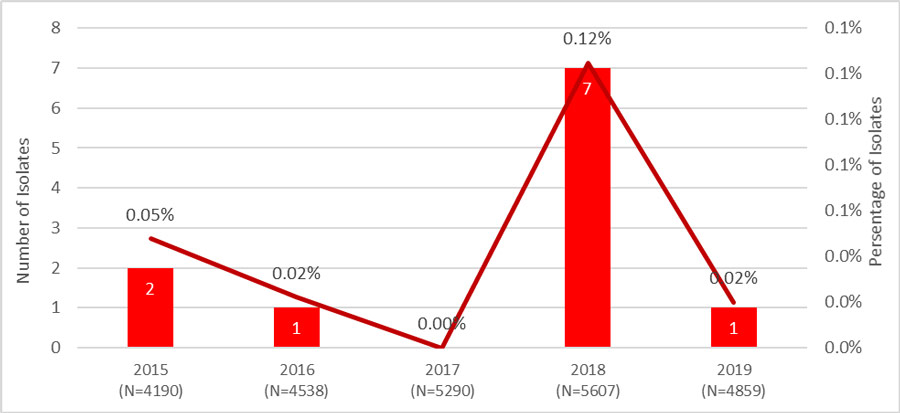
- From 2015 to 2017, only three extensively drug-resistant gonococci (XDR-GC; decreased susceptibility to a cephalosporin plus resistance to azithromycin as well as resistance to at least two other antimicrobials) were identified in Canada, while in 2018, 7 [1% (7/5607)] isolates were classified as XDR-GC. In 2019, one XDR-GC was identified in Canada. This poses a potential threat to successful treatment of gonorrhea (Figure B).
- Footnote a
-
Percentage based on total number of isolates tested nationally: 2015=4190; 2016=4538; 2017=5290; 2018=5607; 2019=4859
Figure A - Text Description
A combination bar and line graph displaying the trending of MDR-GC in Canada from 2015 to 2019 by percentage based on total number of isolates tested nationally (line graph) and by number (bar graph).
| Year (number of cultures tested nationally) | MDR (%) | MDR (n) |
|---|---|---|
| 2015 (N=4190) | 8.6% | 361 |
| 2016 (N=4538) | 8.9% | 406 |
| 2017 (N=5290) | 12.2% | 645 |
| 2018 (N=5607) | 8.0% | 446 |
| 2019 (N=4859) | 12.4% | 601 |
- Footnote a
-
Percentage based on total number of isolates tested nationally: 2015=4190; 2016=4538; 2017=5290; 2018=5607; 2019=4859
Figure B - Text Description
A combination bar and line graph displaying the trending of XDR-GC in Canada from 2015 to 2019 by percentage based on total number of isolates tested nationally (line graph) and by number (bar graph).
| Year (number of cultures tested nationally) | XDR (%) | XDR (n) |
|---|---|---|
| 2015 (N=4190) | 0.05% | 2 |
| 2016 (N=4538) | 0.02% | 1 |
| 2017 (N=5290) | 0% | 0 |
| 2018 (N=5607) | 0.12% | 7 |
| 2019 (N=4859) | 0.02% | 1 |
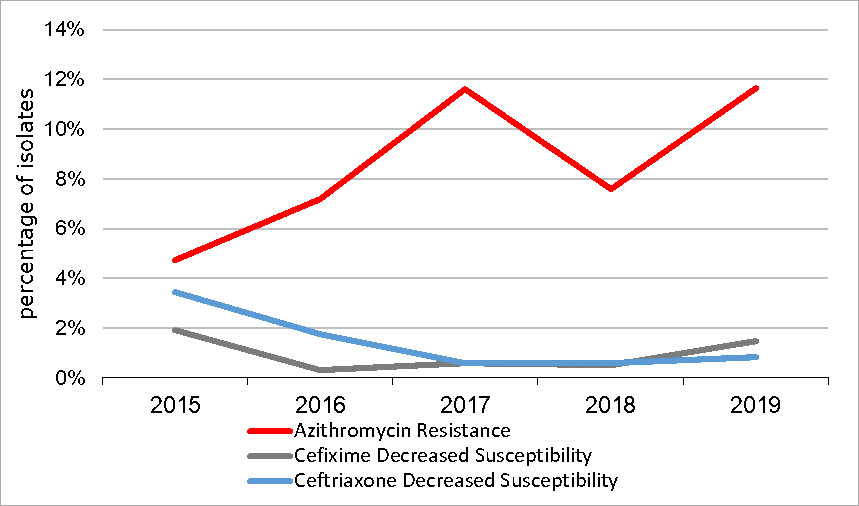
- Isolates with decreased susceptibility to cefixime (MIC ≥ 0.25 mg/L) decreased from 1.9% (80/4190) in 2015 to 0.5% (27/5607) in 2018. In 2019 it increased to 1.5% (71/4859) (Figure B).
- Isolates with decreased susceptibility to ceftriaxone (MIC ≥ 0.125 mg/L) decreased from 3.5% (145/4190) in 2015 to 0.8% (40/4859) in 2019 (Figure B).
- The proportion of azithromycin resistant (MIC ≥ 2mg/L) N. gonorrhoeae isolates increased from 4.7% (198/4190) in 2015 to 11.7% (567/4859) in 2019 (Figure C).
- 5 high-level azithromycin resistant (MIC ≥ 256 mg/L) N. gonorrhoeae isolates were identified in 2019 (QC, n=3; ON, n=2).
- Footnote a
-
Percentage based on total number of isolates tested nationally: 2015=4190; 2016=4538; 2017=5290; 2018=5607; 2019=4859
Figure C - Text Description
A line graph with three lines representing Neisseria gonorrhoeae isolates resistant to azithromycin, decreased susceptibility to cefixime and decreased susceptibility to ceftriaxone in Canada from 2015 to 2019.
| Antibiotic | 2015 | 2016 | 2017 | 2018 | 2019 |
|---|---|---|---|---|---|
| Ceftriaxone - (DS) Decreased Susceptibility | 144 (3.4%) | 80 (1.8%) | 30 (0.6%) | 31 (0.6%) | 40 (0.8%) |
| Cefixime - (DS) Decreased Susceptibility | 79 (1.9%) | 14 (0.3%) | 32 (0.6%) | 27 (0.5%) | 71 (1.5%) |
| Azithromycin - (R) Resistant | 198 (4.7%) | 327 (7.2%) | 613 (11.6%) | 427 (7.6%) | 597 (11.7%) |
- In 2019, 57.0% (2767/4859) of isolates were resistant to ciprofloxacin; 37.7% (1299/3446) were resistant to erythromycin; 7.1% (273/3822) were resistant to penicillin; and 44.2% (2148/4859) were resistant to tetracycline.
- N. gonorrhoeae isolates submitted to the NML were also analyzed by molecular genotyping using the N. gonorrhoeae multi-antigen sequence type (NG-MAST) method. In 2019, 463 different sequence types (STs) were identified among the 2921 isolates with STs identified and the most common sequence types were ST-14994 (14.1%), ST-12302 (11.8%), and ST-5985 (4.1%).
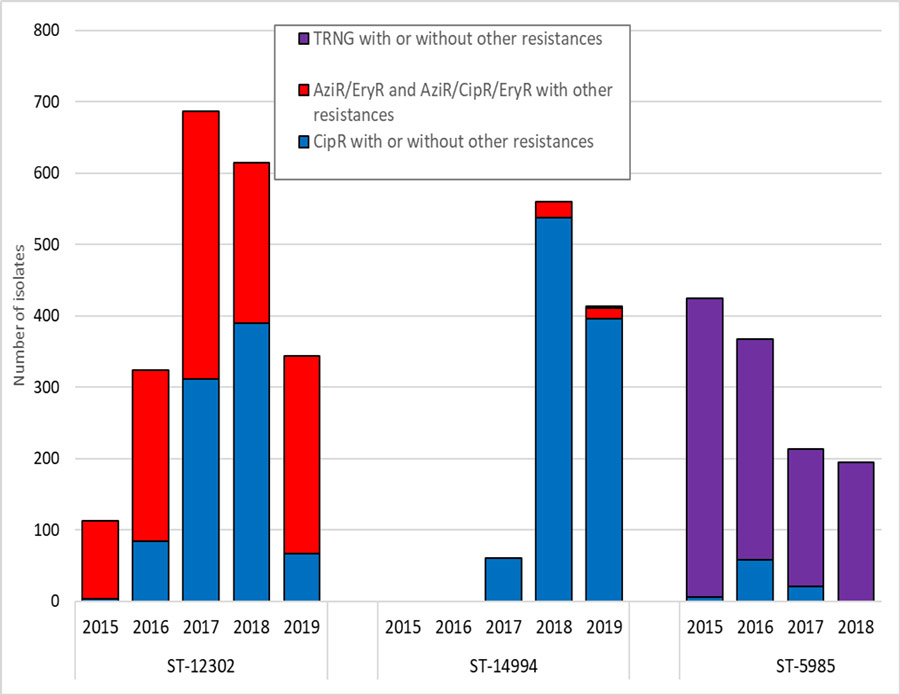
- ST-12302 increased from 4.3% (113/2638) of all isolates in 2015 to 23.9% (687/2875) in 2017 and has now decreased to 11.8% (344/2921) in 2019 (Figure D). In 2017, the isolates were primarily identified in central Canada; in 2019, approximately 18% were identified in western provinces.
- ST-14994, newly identified in 2017 (2.1% (60/2875) and has decreased from 16.7% (560/3350) in 2018 to 14.1% (413/2921) in 2019 (Figure D). These isolates are resistant to multiple drugs including ciprofloxacin; 3.4% are also azithromycin resistant.
- Footnote b
-
A total of 396 sequence types in 2015, 490 sequence types in 2016, 468 sequence types in 2017, 503 sequence types in 2018 and 464 sequence types in 2019. Only the most prevalent sequence types of 2015 to 2019 are represented in this graph.
Figure D - Text Description
A stacked bar graph displaying trending of three of the most prevalent NG-MAST sequence types in Canada from 2015 to 2019 and antimicrobial resistance associated with them.
| NG-MAST | Year | CipR with or without other resistances | TRNG with or without other resistances | AziR/EryR and AziR/CipR/EryR with other resistances |
|---|---|---|---|---|
| ST-12302 | 2015 | 3 | 0 | 110 |
| ST-12302 | 2016 | 84 | 0 | 240 |
| ST-12302 | 2017 | 312 | 0 | 375 |
| ST-12302 | 2018 | 390 | 0 | 225 |
| ST-12302 | 2019 | 66 | 0 | 278 |
| ST-14994 | 2015 | 0 | 0 | 0 |
| ST-14994 | 2016 | 0 | 0 | 0 |
| ST-14994 | 2017 | 60 | 0 | 0 |
| ST-14994 | 2017 | 537 | 0 | 23 |
| ST-14994 | 2019 | 396 | 2 | 15 |
| ST-5985 | 2015 | 6 | 419 | 0 |
| ST-5985 | 2016 | 58 | 309 | 0 |
| ST-5985 | 2017 | 20 | 193 | 0 |
| ST-5985 | 2018 | 0 | 194 | 0 |
| ST-5985 | 2019 | 0 | 120 | 0 |
For more details on the report and its key findings, please email: phac.nml.strepsti-lnm.strepits.aspc@canada.ca.