Standing Committee on Government Operations and Estimates, Shared Services Canada – SSC at a glance, 2019-20

Long description
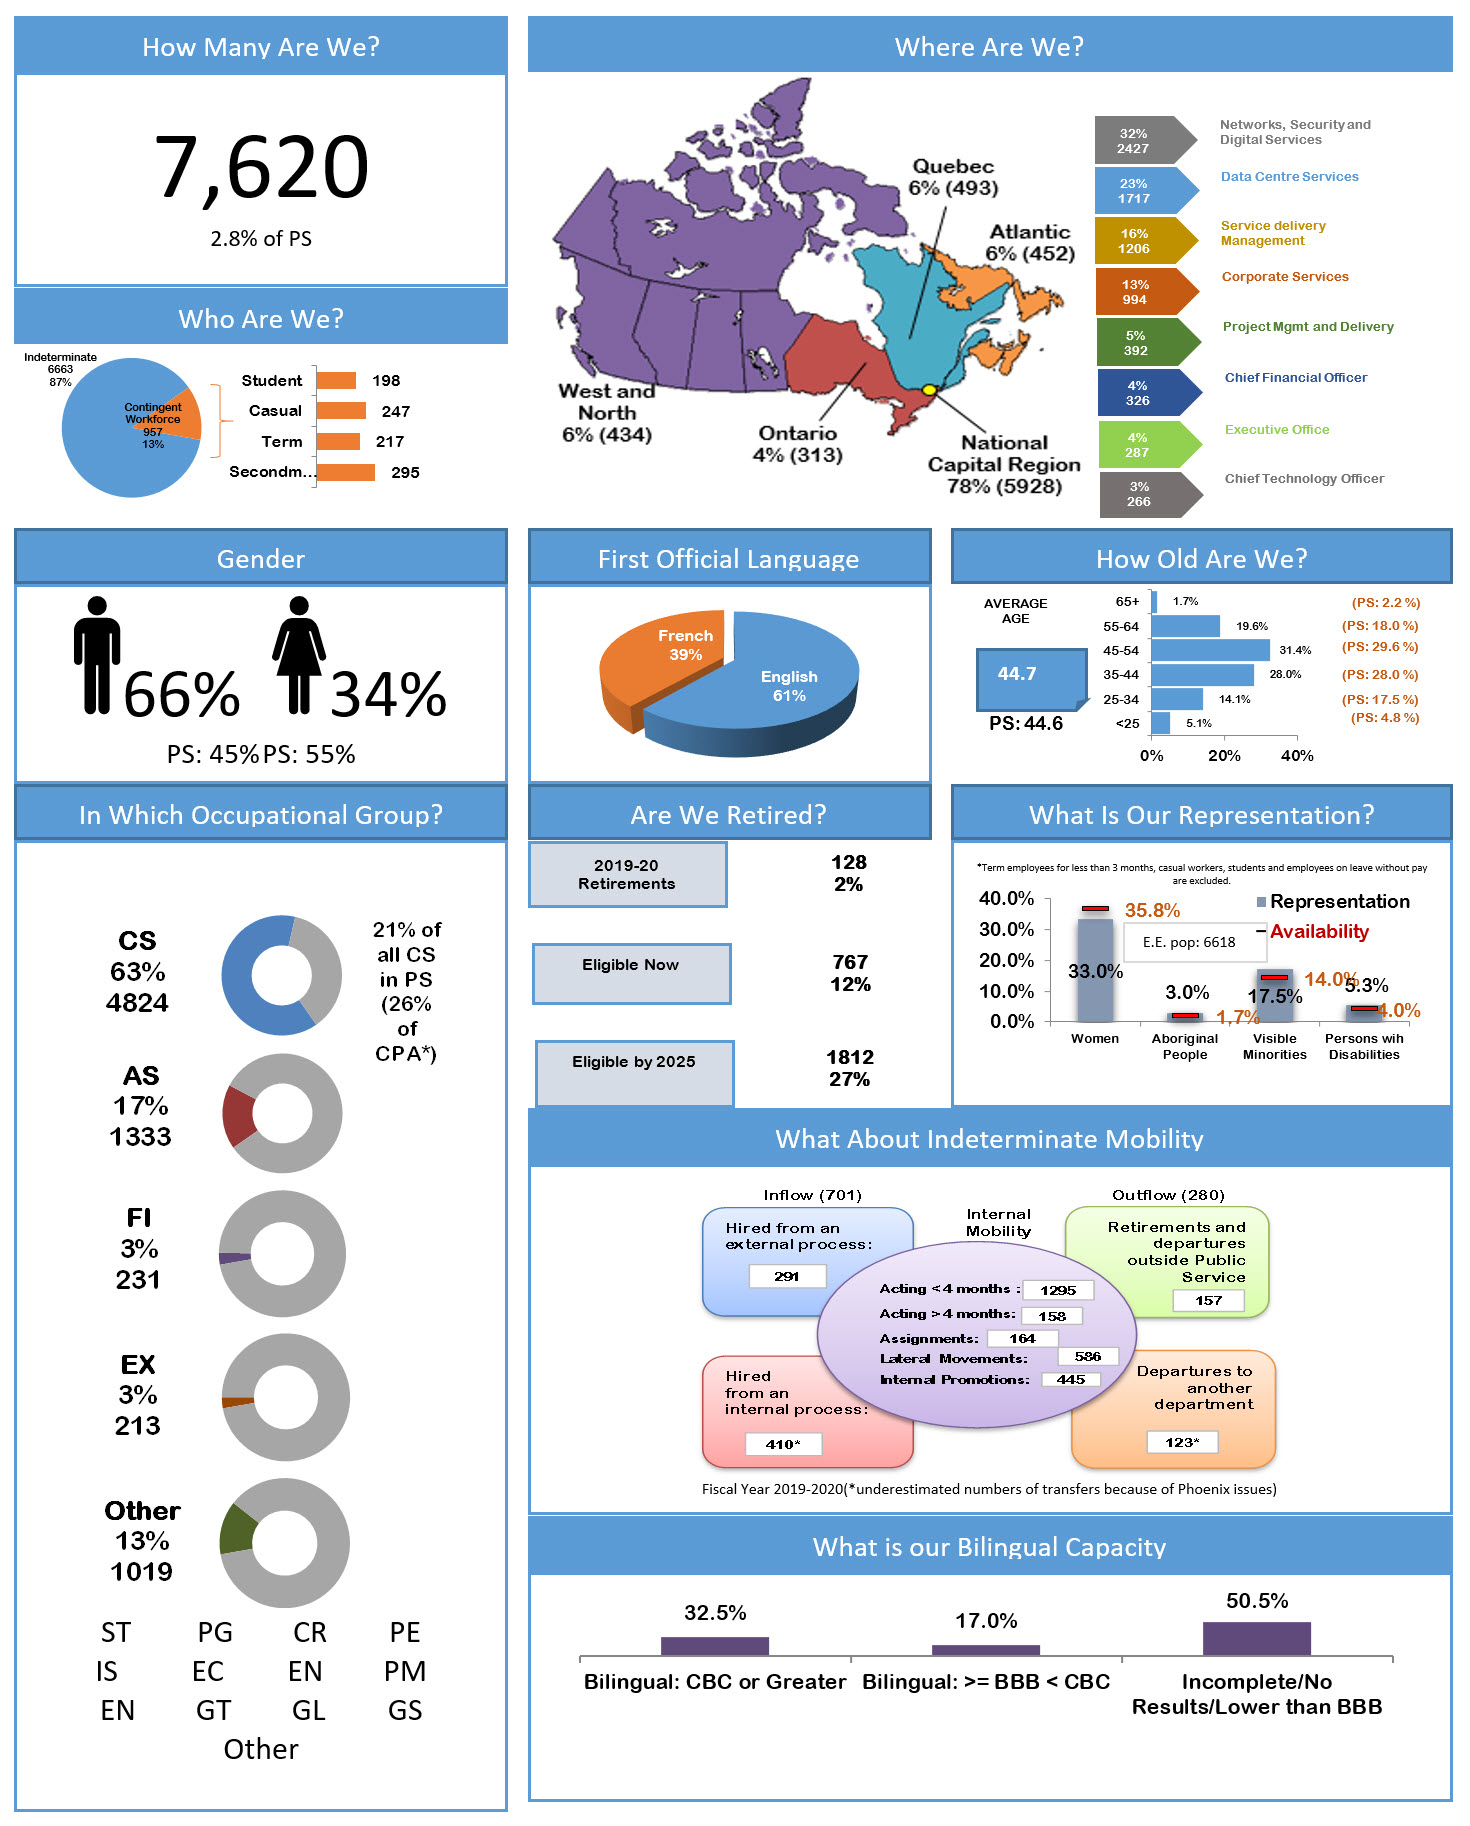
Shared Services Canada at a glance, 2019-2020. A summary of employee statistics presented as an infographic.
How Many are We?
7, 620 or 2.8% of the public service
Who Are We?
Indeterminate employees: 6, 663 (87%)
Contingent workforce: 957 (13%)
Student: 198
Casual: 247
Term: 217
Secondment: 295
Where Are We?
Employees broken down across Canada
West and North 434 (6%)
Ontario 313 (4%)
National Capital Region 5, 928 (78%)
Quebec 493 (6%)
Atlantic 452 (6%)
Where Are We?
Employees broken down by branch
Networks, Security and Digital Services 2, 427 (32%)
Data Centre Services 1, 717 (23%)
Service Delivery Management 1, 206 (16%)
Corporate Services 994 (13%)
Project Management and Delivery 392 (5%)
Chief Financial Officer 326 (4%)
Executive Office 287 (4%)
Chief Technology Officer 266 (3%)
Gender
Male 66%
Female 34%
Males across Public Service 45%
Females across Public Service 55%
First Official Language
French 39%
English 61%
How Old Are We?
Average Age SSC 44.7
Average Age PS 44.6
Employees 65+
SSC 1.7%
PS 2.2%
Employees 55-64
SSC 19.6%
PS 2.2%
Employees 45-54
SSC 31.4%
PS 29.6%
Employees 35-44
SSC 28%
PS 28%
Employees 25-34
SSC 14.1%
PS 17.5%
Employees under 24
SSC 5.1%
PS 4.8%
In Which Occupational Group?
CS 4, 834 (63%) compared with 21% of all CS in the PS and 26% of CPA*
AS 1, 333 (17%)
FI 231 (3%)
EX 213 (3%)
Other 1019 (13%)
Other includes ST, IS, EN, PG, EC, GT, CR, GL, EN, PE, PM, GS
*Fiscal year 2019-2020 underestimated numbers of transfers because of Phoenix issues.
Are We Retired?
2019-20 retirements 128 (2%)
Eligible now 767 (12%)}
Eligible by 2025 1812 (27%)
What is Our Representation?
E.E. population 6618
Women represention 33%
Availability 35.8%
Aboriginal peoples represention 3%
Availability 1.7%
Visible minorities 17.5%
Availability 14%
Persons with disabilities 5.3%
Availability 4%
What About Our Indeterminate Mobility?
Inflow 701
Hired from an external process 291
Outflow 280
Departures to another department 123*
Retirements and departures outside Public Service 157
Internal Mobility
Acting less than 4 months 1, 295
Acting more than 4 months 158
Assignments 164
Lateral movements 586
Internal promotions 445
*Fiscal year 2019-2020 underestimated numbers of transfers because of Phoenix issues.
What is our Bilingual Capacity?
Bilingual CBC or greater 32.5%
Bilingual less than or equal to BBB, CBC 17%
Incomplete/no results/lower than BBB 50%
Page details
- Date modified: