
Quarterly Financial Report for the quarter ended December 31, 2019
![]() Quarterly Financial Report for the quarter ended December 31, 2019 (PDF)
Quarterly Financial Report for the quarter ended December 31, 2019 (PDF)
Statement Outlining Results, Risks and Significant Changes in Operations, Personnel and Programs
1. Introduction
This quarterly financial report has been prepared as required by section 65.1 of the Financial Administration Act and in the form and manner prescribed by the Treasury Board. This report should be read in conjunction with the 2019-20 Main Estimates. This quarterly report has not been subject to an external audit or review.
The Administrative Tribunals Support Service of Canada (ATSSC) is responsible for providing support services and facilities to 11 federal administrative tribunals by way of a single, integrated organization.
These services include the specialized services required by each tribunal (Registry Services, Legal Services, and Mandate and Member Services), as well as internal services (e.g., human resources, financial services, information management and technology, accommodations, security, planning and communications).
Further information on the mandate, roles, responsibilities and programs of the ATSSC can be found by accessing the 2019-20 Departmental Plan.
1.1. Basis of Presentation
This quarterly report has been prepared using an expenditure basis of accounting. The accompanying Statement of Authorities (Annex A) includes the ATSSC's spending authorities granted by Parliament and those used by the ATSSC, consistent with the Main Estimates for the 2019-20 fiscal year. This quarterly report has been prepared using a special purpose financial reporting framework designed to meet financial information needs with respect to the use of spending authorities.
The authority of Parliament is required before money can be spent by the Government. Approvals are given in the form of annually approved limits through appropriation acts or through legislation in the form of statutory spending authority for specific purposes.
The ATSSC uses the full accrual method of accounting to prepare and present its annual departmental financial statements that are part of the departmental results reporting process. However, the spending authorities voted by Parliament remain on an expenditure basis. The main difference between the quarterly financial report and the departmental financial statements is the timing of when revenues and expenses are recognized.
2. Highlights of Fiscal Quarter and Fiscal Year to Date (YTD) Results
This section highlights the significant items that contributed to the net increase or decrease in authorities available for the year and actual expenditures for the quarter ended December 31, 2019.
The ATSSC’s financial structure is mainly composed of voted budgetary authorities namely, Vote 1—Program expenditures and Vote Netted Revenue (VNR) authority, as well as statutory authorities for contributions to employee benefit plans. The VNR gives the ATSSC authority to make recoverable expenditures on behalf of the Canada Pension Plan (CPP) and the Employment Insurance (EI) operating accounts. Presented in Graph 1 below are the gross and net budgetary authorities and expenditures for the first three quarters of 2019-20. For more details, refer to the Statement of Authorities table presented in Annex A.
Graph 1: Comparison of budgetary authorities and expenditures for the quarters ended December 31, 2019, and December 31, 2018.
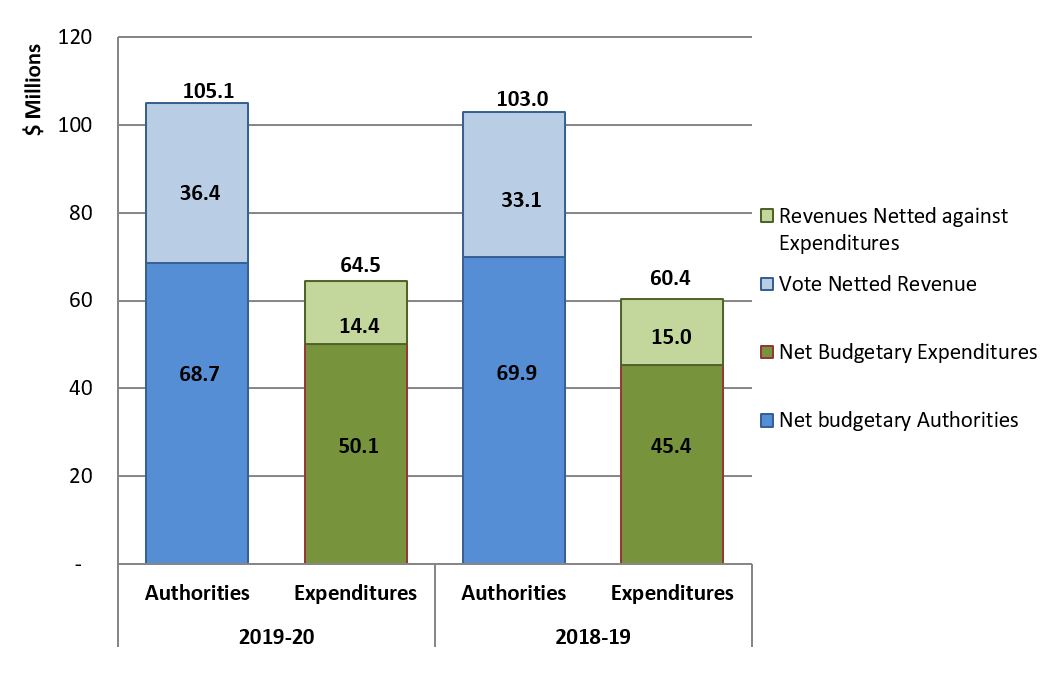
The ATSSC expended $64.5 million (61.4% of total authorities available for use) in the first three quarters of 2019-20. The majority of expenditures (81.6% of gross expenditures) relate to personnel, while the remaining (18.4% of gross expenditures) primarily comprises of professional and special services (mainly informatics services, translation costs and consulting services), transportation and communications and rental costs.
2.1. Significant Changes to Authorities
(Please refer to the Statement of Authorities table presented in Annex A.)
As of December 31, 2019, the total budgetary authorities available for use for the year decreased from $69.9 million in 2018-19 to $68.7 million in 2019-20. The decrease of $1.2 million is mainly due to the sunsetting of funding for the Space Optimization and Modernization projects that were completed in 2018-19.
2.2. Significant Changes to Vote Netted Revenue
(Please refer to the Statement of Authorities table presented in Annex A.)
As of December 31, 2019, the VNR authority increased from $33.1 million in 2018-19 to $36.4 million in 2019-20 due to the additional VNR authorities obtained through a Treasury Board Submission approval. The VNR authority is for the charging of administrative costs to the CPP and EI operating accounts to support the discharge of the mandates of the Social Security Tribunal (SST) and the ATSSC as it relates to the SST.
2.3. Significant Changes to Expenditures
(Please refer to the Departmental Budgetary Expenditures by Standard Object table presented in Annex B.)
Expenditures for the Quarter
Third quarter gross budgetary expenditures slightly increased from $22.4 million in 2018-19 to $22.8 million in 2019-20 mainly due to:
- $0.4 million increase in personnel spending related to an increase in salary rates resulting from the signing of collective agreements and revised remuneration agreements;
- $0.7 million increase in professional services expenditures related to an increase in IT projects;
- $0.3 million increase in rental expenditures attributable to a timing difference in the Public Services and Procurement Canada invoicing process; and
- $0.9 million decrease in repair and maintenance expenditures due to the sun setting of Space Optimization and Modernization projects.
Expenditures Year-to-Date
The year-to-date gross budgetary expenditures increased from $60.4 million in 2018-19 to $64.5 million in 2019-20 mainly due to:
- $2.1 million increase in personnel spending related to an increase in salary rates resulting from the signing of collective agreements and revised remuneration agreements;
- $1.7 million increase in professional services spending related to an increase in IT projects;
- $1.2 million increase in rental expenditures attributable to a timing difference in the Public Services and Procurement Canada invoicing process; and
- $0.9 million decrease in repair and maintenance expenditures due to the sunsetting of Space Optimization and Modernization projects.
3. Risks and Uncertainties
There is a risk that the ATSSC may not be able to maintain appropriate delivery capacity to meet the mandates of tribunals and the evolving needs of all program and internal service areas. As an organization tasked with delivering existing support services while seeking to improve its service delivery model, the ATSSC must ensure that it maintains appropriate delivery capacity. In particular, the ATSSC must effectively plan its operations and investments to make efficient and effective use of its limited financial and human resources.
To mitigate this risk, emerging trends, priorities, needs and legislative changes are being monitored to identify potential impacts on caseloads and on the ATSSC resources and funding. The ATSSC has built into the budget planning and allocation processes the flexibility to re-allocate resources if and when required. The ATSSC will also develop an investment plan that links proposed investments to organizational and tribunal priorities.
4. Significant Changes in Relation to Operations, Personnel and Programs
OThere has been no significant change to the ATSSC programs or structure since the last quarter of September 30th, 2019.
Approval by Senior Officials
Approved by:
Original signed by
________________________
Orlando Da Silva
Chief Administrator
Original signed by
________________________
Christopher Bucar, MBA, CPA, CMA, CD
Director General Corporate Services and Chief Financial Officer
Ottawa, Canada
February 28, 2020
Annex A
5. Statement of Authorities (unaudited)
(in dollars)
| Fiscal year 2019-20 | Fiscal year 2018-19 | |||||
|---|---|---|---|---|---|---|
| Total available for use for the year ending March 31, 2020 * |
Used during the quarter ended December 31, 2019 |
Year to date used at quarter end |
Total available for use for the year ending March 31, 2019 * |
Used during the quarter ended December 31, 2018 |
Year to date used at quarter-end |
|
| Vote 1 - Program expenditures | 93,824,047 | 20,400,253 | 57,195,460 | 93,315,587 | 20,023,658 | 53,106,968 |
| Less: Revenues netted against expenditures | (36,437,947) | (7,218,710) | (14,437,420) | (33,064,414) | (7,373,838) | (14,968,935) |
| Net Program expenditures | 57,386,100 | 13,181,543 | 42,758,040 | 60,251,173 | 12,649,820 | 38,138,033 |
| Budgetary statutory authorities | 11,266,046 | 2,432,344 | 7,297,030 | 9,687,430 | 2,421,857 | 7,265,572 |
| Total Budgetary authorities | 68,652,146 | 15,613,887 | 50,055,070 | 69,938,603 | 15,071,677 | 45,403,605 |
* Includes only Authorities available for use and granted by Parliament at quarter-end.
Annex B
6. Departmental Budgetary Expenditures by Standard Object (unaudited)
(in dollars)
| Fiscal year 2019-20 | Fiscal year 2018-19 | |||||
|---|---|---|---|---|---|---|
| Planned expenditures for the year ending March 31, 2020 |
Expended during the quarter ended December 31, 2019 |
Year to date used at quarter end |
Planned expenditures for the year ending March 31, 2019 |
Expended during the quarter ended December 31, 2018 |
Year to date used at quarter-end |
|
| Expenditures: | ||||||
| Personnel | 83,097,819 | 18,357,172 | 52,559,130 | 75,536,994 | 17,928,502 | 50,498,953 |
| Professional and special services | 9,363,464 | 2,018,715 | 5,308,326 | 10,562,719 | 1,371,222 | 3,655,099 |
| Transportation and communications | 4,415,801 | 810,951 | 2,162,967 | 4,554,655 | 955,435 | 2,232,551 |
| Rentals | 2,946,058 | 831,729 | 2,417,341 | 4,337,362 | 490,140 | 1,212,913 |
| Acquisition of machinery and equipment | 2,427,702 | 322,029 | 619,342 | 3,777,035 | 193,506 | 496,591 |
| Repair and maintenance | 739,746 | 255,940 | 356,552 | 2,189,282 | 1,142,832 | 1,244,707 |
| Utilities, materials and supplies | 750,687 | 76,767 | 489,651 | 873,561 | 215,696 | 506,010 |
| Information | 602,872 | 127,741 | 555,557 | 832,734 | 153,828 | 491,950 |
| Other subsidies and payments | 745,944 | 31,553 | 23,624 | 338,674 | (5,645) | 33,767 |
| Total gross budgetary expenditures | 105,090,093 | 22,832,597 | 64,492,490 | 103,003,017 | 22,445,515 | 60,372,540 |
| Less Revenues netted against expenditures: | ||||||
| Revenues | (36,437,947) | (7,218,710) | (14,437,420) | (33,064,414) | (7,373,838) | (14,968,935) |
| Total Revenues netted against expenditures: | (36,437,947) | (7,218,710) | (14,437,420) | (33,064,414) | (7,373,838) | (14,968,935) |
| Total net budgetary expenditures | 68,652,146 | 15,613,887 | 50,055,070 | 69,938,603 | 15,071,677 | 45,403,605 |