
Infographic: Atlantic Growth Strategy - Year 2 Results
Long description
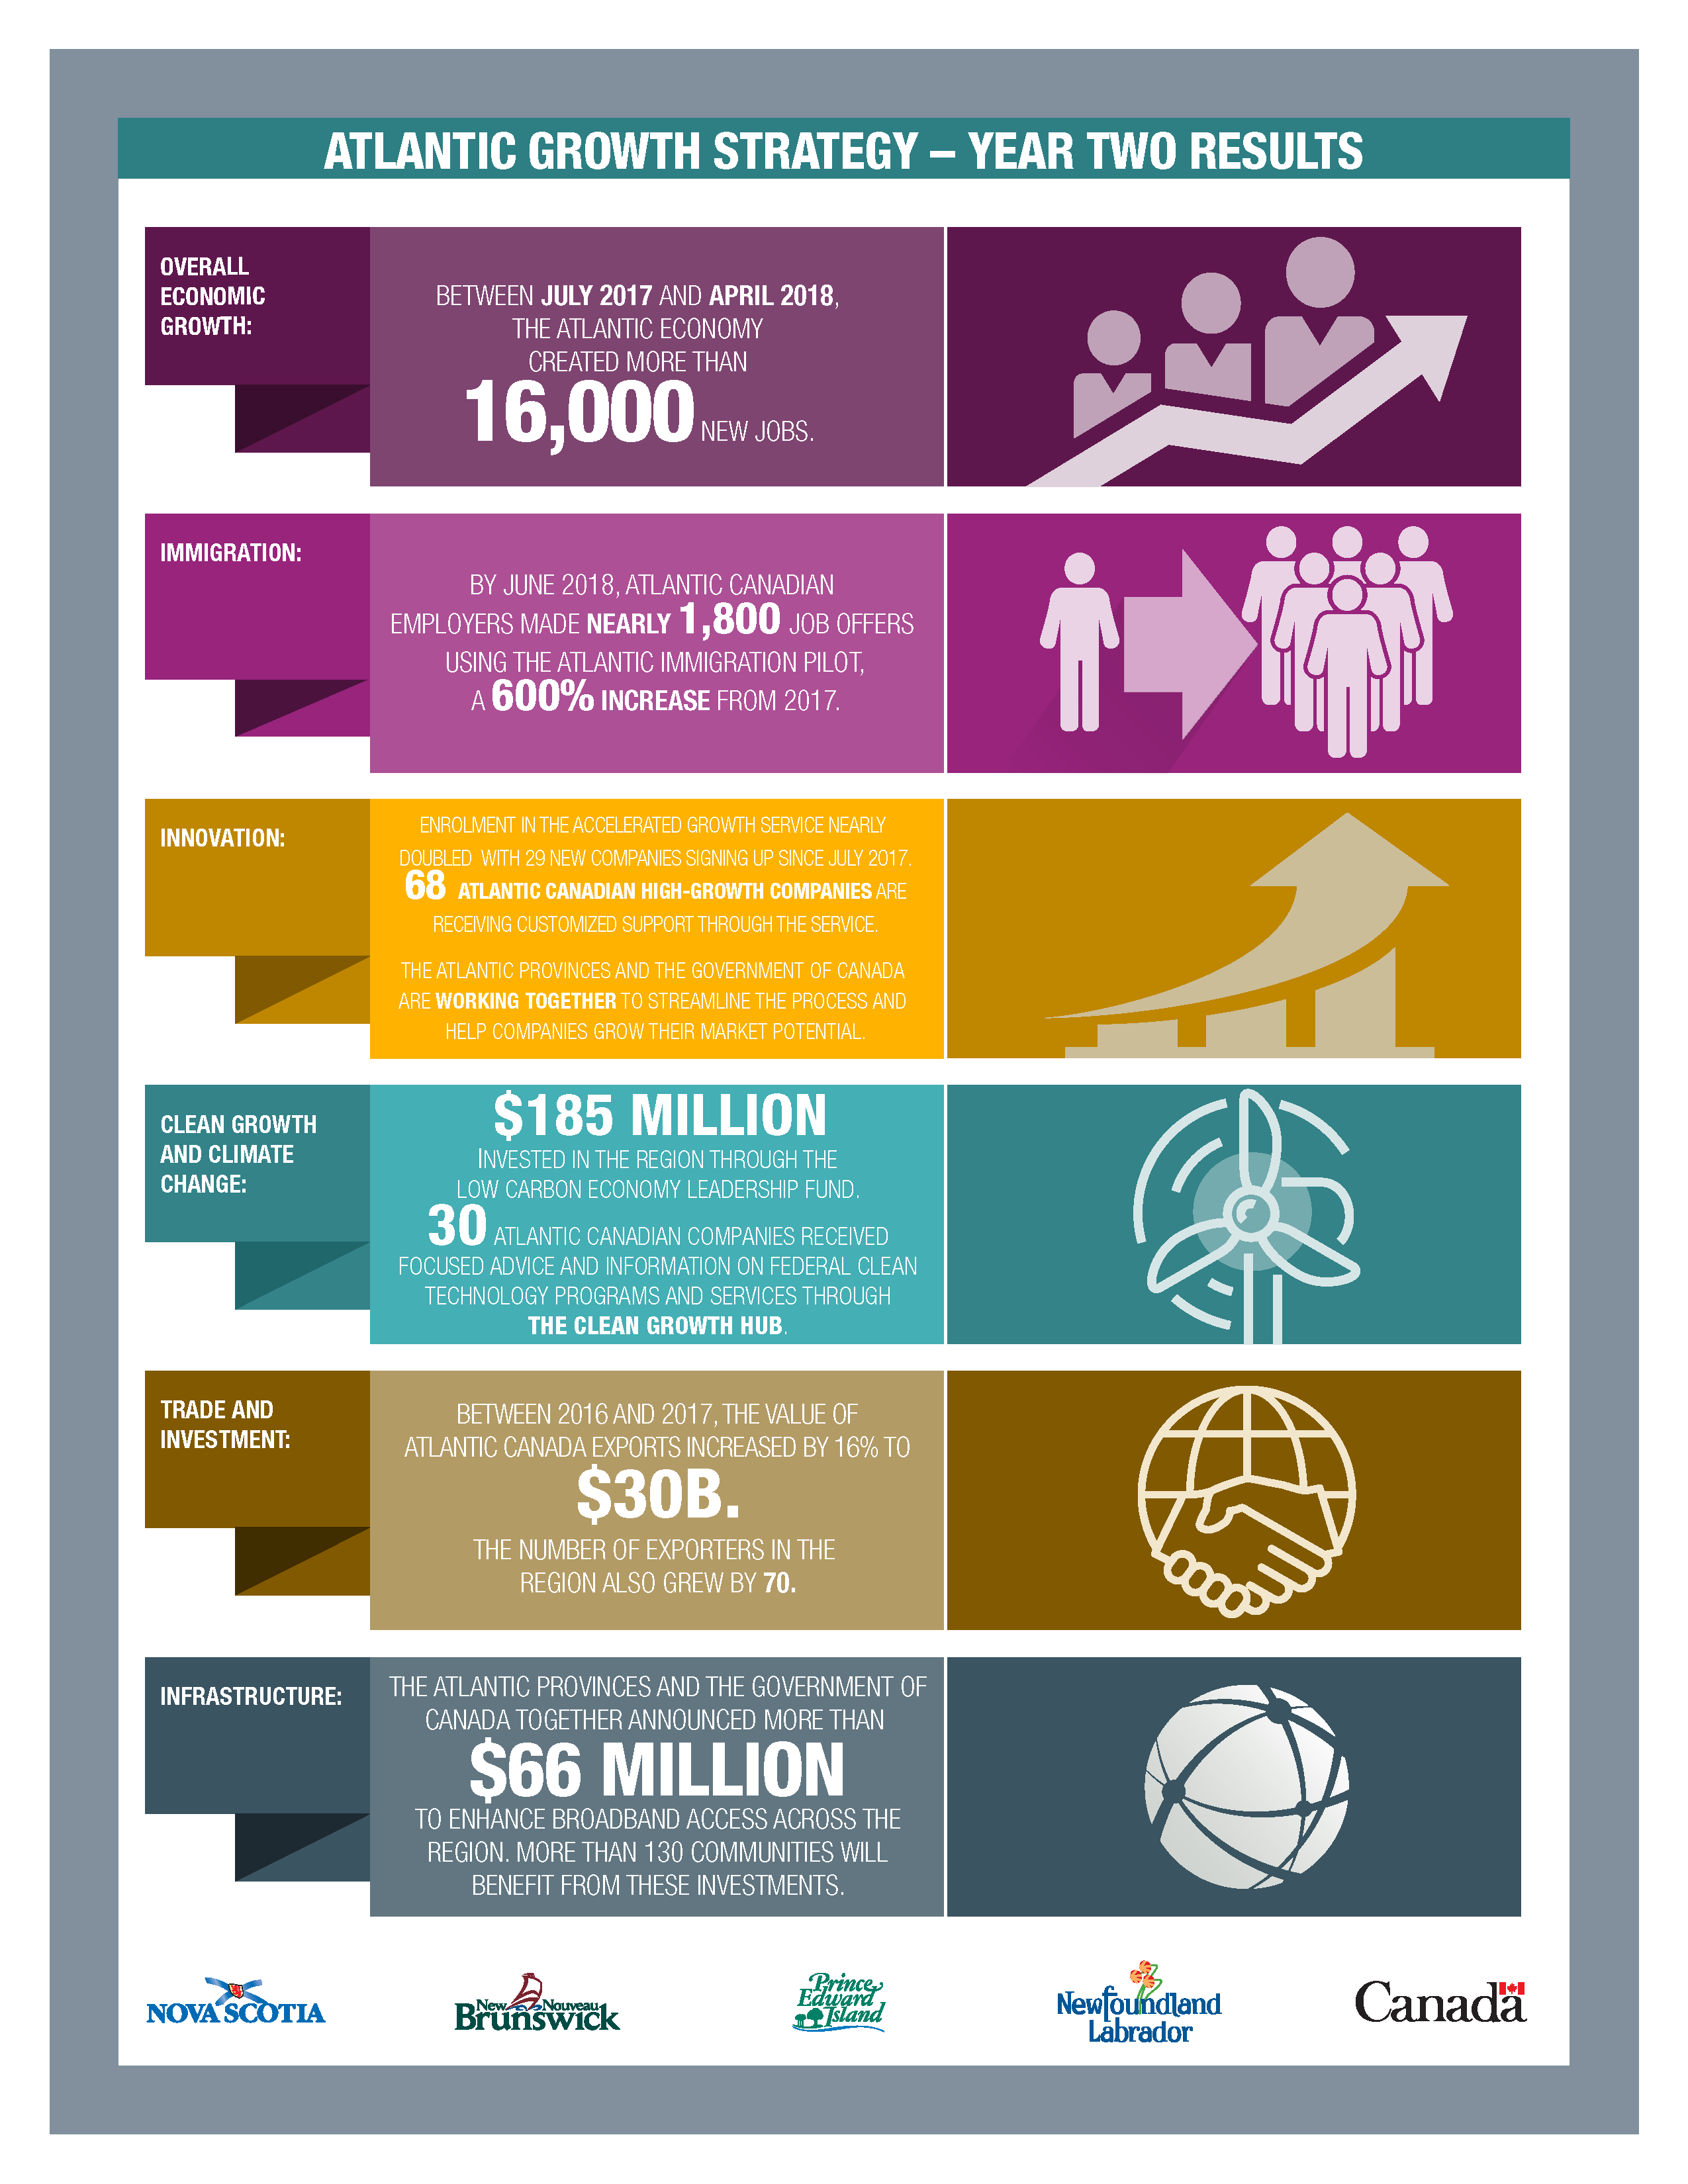
Infographic depicting outcomes achieved in Year Two of the Atlantic Growth Strategy. The infographic title is Atlantic Growth Strategy – Year Two Results
The infographic is divided into six rows (including one for each of the five pillars of the Strategy) and three columns. The first column names the pillars. The second column describes the result achieved, and the third column contains a graphic representation of the result.
The first row of text reads:
Overall Economic Growth: Between July 2017 and April 2018, the Atlantic economy created more than 16,000 new jobs.
Graphic depicts three progressively larger silhouettes of individuals atop a right-facing, upward-angled arrow.
The second row reads:
Immigration: By June 2018, Atlantic Canadian employers made nearly 1,800 job offers using the Atlantic Immigration Pilot, a 600% increase from 2017.
Graphic depicts a lone individual to the left of a right-facing arrow. The arrow points to a triangle-shaped cluster of six individuals.
The third row reads:
Innovation: Enrolment in the Accelerated Growth Service nearly doubled with 29 new companies signing up since July 2017. 68 Atlantic Canadian high-growth companies are receiving customized support through the service. The Atlantic provinces and the Government of Canada are working together to streamline the process and help companies grow their market potential.
Graphic depicts a line graph with three bars that grow progressively taller from left to right. A curved arrow above the bars points straight upwards.
The fourth row reads:
Clean growth and climate change: $185 million invested in the region through the Low Carbon Economy Leadership Fund. 30 Atlantic Canadian companies received focused advice and information on federal clean technology programs and services through the Clean Growth Hub.
Graphic depicts a wind turbine with three spinning blades.
The fifth row reads:
Between 2016 and 2017, the value of Atlantic Canada exports increased by 16% to $30b. The number of exporters in the region also grew by 70.
Graphic depicts a handshake superimposed over the bottom of a graphic of the world, which is divided by three vertical lines and two horizontal lines.
The sixth row reads:
Infrastructure: the Atlantic provinces and the Government of Canada together announced more than $66 million to enhance broadband access across the region. More than 130 communities will benefit from these investments.
Graphic depicts the world, covered with a web of intersecting lines. There are three dots at different locations on the world where the lines meet.