
Committee of the Whole (House of Commons) 2021-22 Supplementary Estimates (B) December 7 and 8, 2021
Table of Contents
Anchor Issues
Inflation
Economic Recovery
Summary of Canada's COVID-19 Economic Response Plan
• Support for P/Ts
• Worker Benefits
Debt and Deficit Levels
Debt ManagementSupporting Low- and Middle-Income Individuals and Families
Supporting Small Businesses During the Pandemic
Fighting Tax Evasion and Avoidance
Housing
Trade Irritants with the U.S.
Other Issues
Equalization (AB referendum, floor payments)
Provincial/territorial request to increase the Canada Health Transfer
CPP contribution rate increase
Border Carbon Adjustments (BCA)
Trans Mountain
• Trans Mountain Expansion Project
• Funding for Indigenous engagement on economic participation in Trans Mountain
Supplementary Estimates B
2021-22 Supplementary Estimate (B)
• Finance 2021-22 Supplementary Estimate (B)
• FINTRAC 2021-22 Supplementary Estimate (B)
Canadian Commercial Corporation (CCC)
Federal Payments to Western Provinces for Enhanced Oil and Gas Well Clean-up
Key Figures and Statistics
Quick Facts
• Economic Fact Sheet
• Fiscal Fact Sheet (Budget 2021)
Economic Indicators Fact Sheet
• Alberta Economic and Fiscal Factsheet
Parliamentary and Media Environment
Party Leaders and Finance Critics
Parliamentary Environmental Analysis
*Redacted*
Scenario Note
Appearance at House of Commons Committee of the Whole
Tuesday, December 7, 2021 and Wednesday, December 8, 2021
Ottawa, Ontario
Description: Pursuant to a motion adopted in the House of Commons on November 25, 2021, the House will consider the Supplementary Estimates in two Committees of the Whole. A Committee of the Whole is the entire membership of the House of Commons sitting as a committee.
Ministers Fortier, Boissonault, Duclos, Joly and Miller are expected to appear before the House of Commons Committee of the Whole.
Location: Chamber, House of Commons
Day of Committee of the Whole Timing and Officials
Supporting Officials
- Chamber Floor of the House of Commons
- Nick Leswick, Associate Deputy Minister
Teams/Virtual Support
- A Teams Channel will be used to provide support to the lead Minister/departments
Timing
- Debate is expected to begin at the regular time of adjournment (around 6:30 p.m., unless delayed by earlier proceedings) and is expected to conclude around 10:30 p.m. (4 hours)
- Debate may be delayed on Wednesday, December 8th due to expected votes in the House of Commons
Day of Committee of the Whole
- At the time of day set for Committee of the Whole, proceedings then underway in the House of Commons will come to an end. The Chair of the Committee of the Whole (the Speaker or Deputy Speaker) will give the MPs a brief overview of the rules for this Committee:
- The study will cover all of the items, or Votes, contained in the Estimates, which have been referred to the Committee of the Whole for consideration.
- The Speaker will explain the order in which the speaking slots will be divided amongst the parties and will explain other relevant agreements/arrangements that may have been reached.
- The Chair will emphasize speaking times for questions/answers and speeches.
- A reminder that there must be unanimous consent for MPs to split their time with another member.
- The seating will likely reflect the following:
- Ministers with Estimates to be reviewed (as identified by the agreed upon motion) will sit in the front row benches (usually in the centre) on the Government side.
- The Parliamentary Secretaries to the Ministers will sit in the second row.
- A small table will be placed directly in front of the Ministers (on the floor of the House) for the above identified Government officials.
- The officials will be escorted from the Government Lobby to this table, by an official of the House. The Minister may (or may not) choose to introduce officials to the House.
- Officials are not allowed to address the Chamber directly but may discretely provide information and advice to Ministers.
- Other officials of the Ministers are allowed to sit in the command centre room.
- MPs are allowed to sit where they wish, and some will likely participate virtually.
- The round of questions will then begin. The Speaker Chair of the Committee will usually moderate the debate of Committee of the Whole by matching the amount of time given to each answer with the amount of time used to pose the question (e.g. short question will be responded to with a short answer). The rounds of questioning are proportionate to standings in the House.
- In the opening round, each recognized party gets a 15 minute slot, in the following order:
- Opposition Q&A (Conservative) (15 minutes)
- Government Speech (10 minutes), followed by government-led Q&A (5 minutes)
- Opposition Q&A (Bloc Quebecois) (15 minutes)
- Opposition Q&A (New Democratic Party) (15 minutes)
- The remaining speaking slots will follow a rotation that match the strength of each party’s standings. Approximately half the speaking slots will go to the government, and the opposition will get the other half of the speaking slots (Conservatives getting the majority of opposition speaking slots, followed by the Bloc Quebecois and the New Democratic Party). (Full rounds in Annex)
- Speeches are being provided by: TBS (2), GAC (3), CIRNAC/ISC (3), HC (2), FIN (2), PS (1), DND (8), PCH (1), ECCC (1), INF (1)
- Tuesday, December 7, 2021 (Committee of the Whole 1):
- At the expiry of the time provide for the study (4 hours), or if the debate collapses, the meeting of the Committee will come to an end.
- Officials are then allowed to leave the House and the House immediately adjourns to the next sitting day.
- Wednesday, December 8, 2021 (Committee of the Whole 2):
- At the expiry of the time provided for the study (4 hours), or if the debate collapses, the meeting of the Committee will come to an end and the Estimates will be "deemed' reported back to the House. Contrary to what is possible in a Standing Committee, the rules of the House provide no procedure under which MPs in Committee of the Whole can reduce or reject the estimates they are examining.
- Officials are then allowed to leave the House and the House immediately adjourns to the next sitting day.
Contact List
[TBS Strategic Communications and Ministerial Affairs]
Assistant Secretary
Name: Kelly Acton
Title: Assistant Secretary
Email: Kelly.Acton@tbs-sct.gc.ca
Cell: *Redacted*
Executive Director
Name: Mark Stokes
Title: Executive Director of Communications
Email *Redacted*
Director, Parliamentary and Public Affairs
Name: Alain Belle-Isle
Title: Senior Manager, Parliamentary Affairs
Email: alain.belle-isle@tbs-sct.gc.ca
Cell: *Redacted*
Senior Manager, Parliamentary Affairs
Name: Émilie Anne Duval
Title: Senior Manager, Parliamentary Affairs
Email: emilieanne.duval@tbs-sct.gc.ca
Cell: *Redacted*
| Branch / Office | Name | |
|---|---|---|
| DMO | Nick Leswick | Nick.Leswick@fin.gc.ca |
| DPMO / MinO | Farees Nathoo | farees.nathoo@fin.gc.ca |
| Brendon Legault | brendon.legault@fin.gc.ca | |
| CSB / CFO | John Daley | John.Daley@fin.gc.ca |
| TAX | Miodrag Jovanovic | Miodrag.Jovanovic@fin.gc.ca |
| Shawn Porter | shawn.porter@fin.gc.ca | |
| Maude Lavoie | Maude.Lavoie@fin.gc.ca | |
| ITF | Patrick Halley | Patrick.Halley@fin.gc.ca |
| FSP | Isabelle Jacques | isabelle.jacques@fin.gc.ca |
| Soren Halverson | Soren.Halverson@fin.gc.ca | |
| Nicolas Moreau | Nicolas.Moreau@fin.gc.ca | |
| EFP | Brad Recker | Bradley.Recker@fin.gc.ca |
| Julie Turcotte | Julie.Turcotte@fin.gc.ca | |
| EDCF | TBD | |
| FPRSP | Alison McDermott | Alison.McDermott@fin.gc.ca |
| Galen Countryman | Galen.Countryman@fin.gc.ca | |
| C&C | Marie-Elise Rancourt | Marie-Elise.Rancourt@fin.gc.ca |
| Frank Harvey | Francois.Harvey@fin.gc.ca |
Annex (Rounds)
Opening Round
CPC (15 minutes)
LPC (15 minutes)
BQ (15 minutes)
NDP (15 minutes)
Rotations
Tuesday
LPC (15 minutes)
CPC (15 minutes)
LPC (15 minutes)
CPC (15 minutes)
LPC (15 minutes)
CPC (15 minutes)
LPC (15 minutes)
BQ (15 minutes)
LPC (15 minutes)
CPC (15 minutes)
LPC (15 minutes)
NDP (15 minutes)
--------------
Wednesday
LPC (15 minutes)
CPC (15 minutes)
LPC (15 minutes)
CPC (15 minutes)
LPC (15 minutes)
CPC (15 minutes)
LPC (15 minutes)
CPC (15 minutes)
LPC (15 minutes)
BQ (15 minutes)
LPC (15 minutes)
CPC (15 minutes)
LPC (15 minutes)
NDP (15 minutes)
LPC (15 minutes)
CPC (15 minutes)
LPC (15 minutes)
BQ (15 minutes)
CPC (15 minutes)
LPC (15 minutes)
CPC (15 minutes)
*exact split between each day is subject to change
Anchor Issues
Inflation
Issue
Consumer price inflation has risen significantly in recent months.
Talking points
- First, let’s remember that the pandemic was a massive shock with Canada seeing its largest recession on record. Extraordinary policy supports were needed to help businesses bridge the crisis and keep as many workers connected to their jobs as possible.
- The government and the Bank of Canada responded in force at the acute stages in the pandemic when the fear was deflation, and that worked. Canadians can be just as confident that the Bank of Canada will keep inflation on target over time.
- We are acutely aware that Canadians are paying higher prices for some goods and services that they are buying.
- But higher inflation is not due to an overheating economy related to too much spending in Canada.
- This is a global phenomenon, where inflation everywhere has been boosted by temporary effects including:
- A return of some prices to more normal levels from very low levels during the early days in the pandemic;
- Higher global energy and other commodity prices due to supply and severe weather issues;
- Higher prices for manufactured and other goods caused by ongoing production bottlenecks due to the pandemic and unusually strong demand for goods, as many services were restricted.
- As we have always said, restarting the economy is a complex process. There are good reasons to expect that the special factors pushing inflation across the world will ease, even if they are taking a little longer to get resolved.
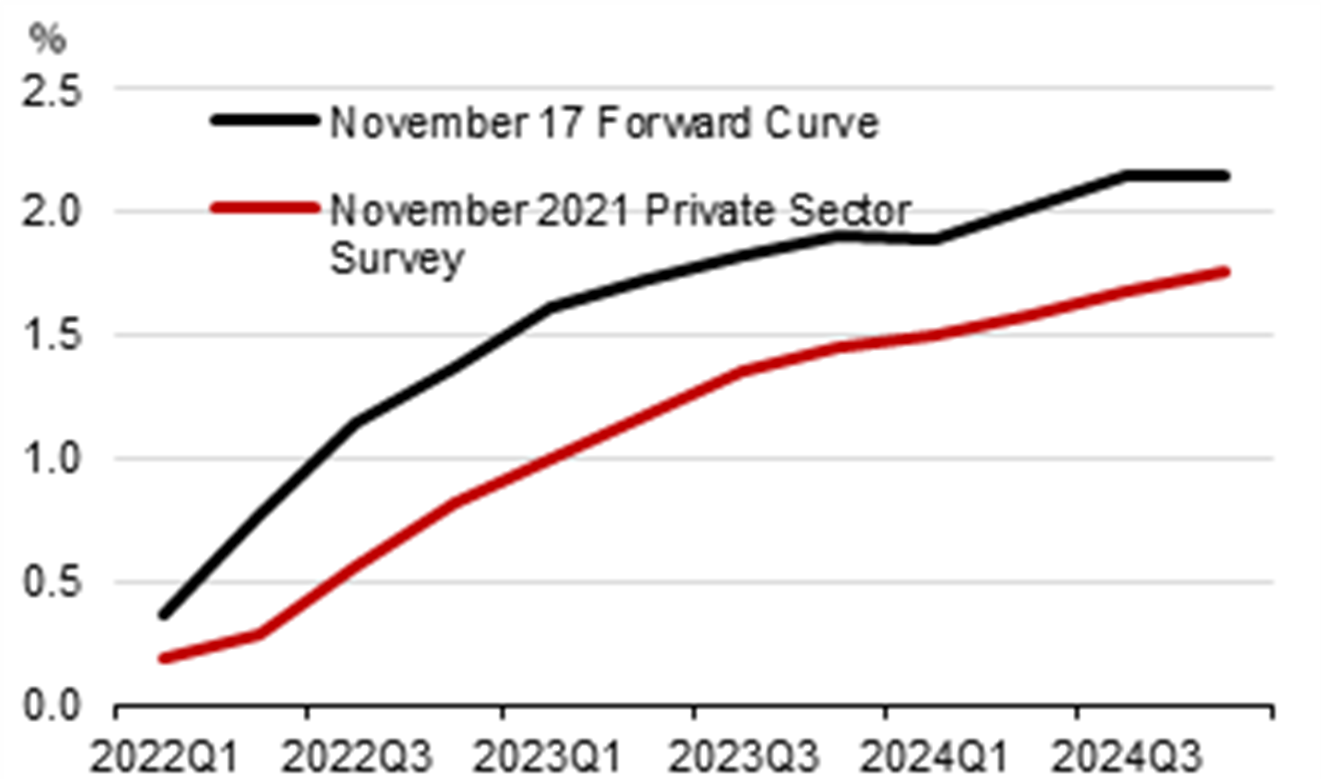
- The Bank of Canada and private sector economists expect that inflation may stay higher for longer, before easing back towards the 2% target throughout 2022.
- The government is moving from very broad-based support to more targeted measures that will provide help where it is needed, when it is needed.
- The vast majority of the government's Recovery Plan is targeted towards growth-enhancing and job creating initiatives – initiatives such as investments to support childcare and the adoption of new technologies that will help boost supply, increasing space for the economy to grow without the risk of higher inflation.
Background
Canada’s headline inflation rose to 4.7% year-over-year in October 2021, the fastest pace since February 2003 (Table 1). Inflation has been above the 3% upper end of the Bank of Canada’s inflation-control range for seven consecutive months. The acceleration of consumer prices on a year-over-year basis is not unique to the Canadian economy as other G7 countries such as the United States, Germany and United Kingdom are also facing higher prices for their goods and services (see International Comparisons section for more detail).
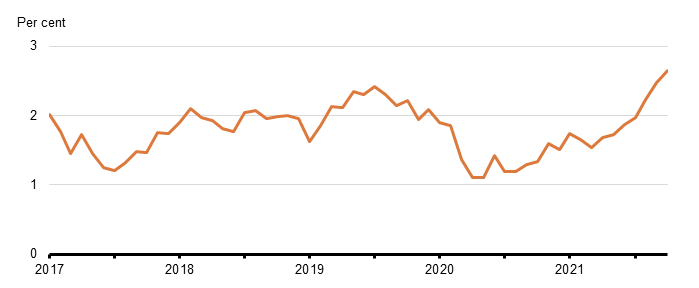
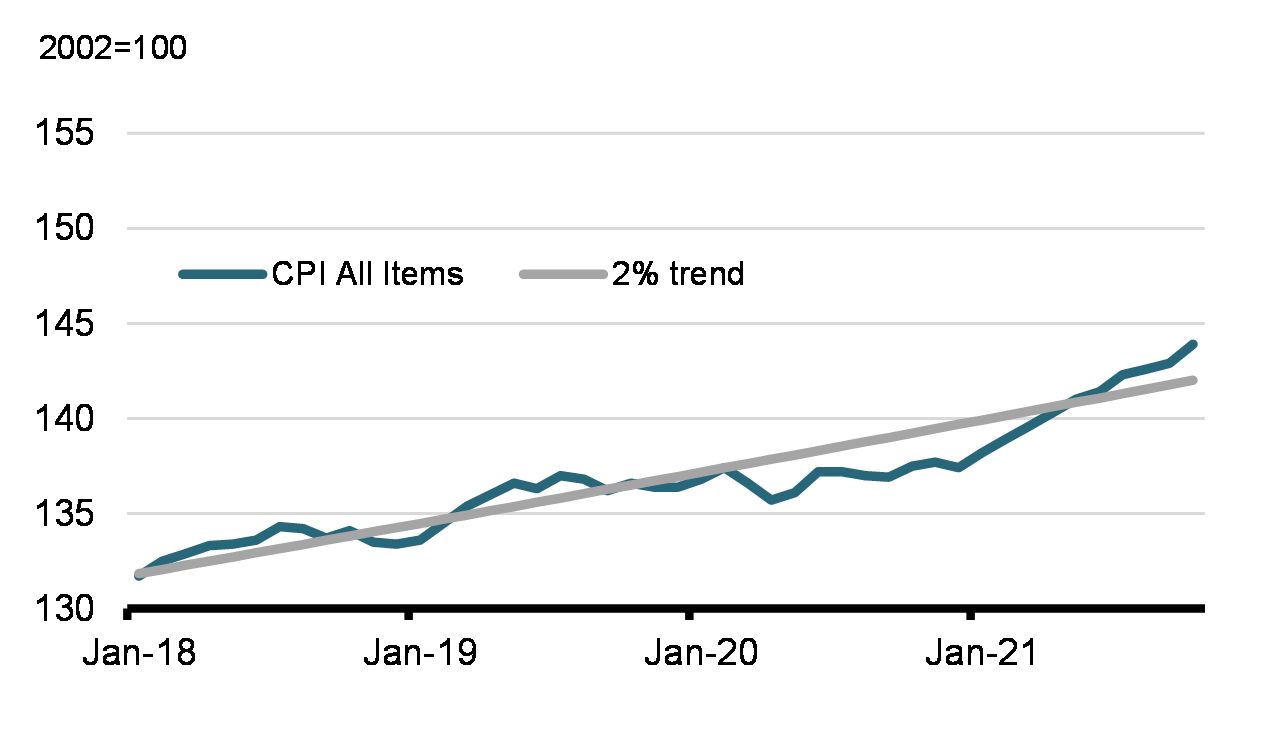
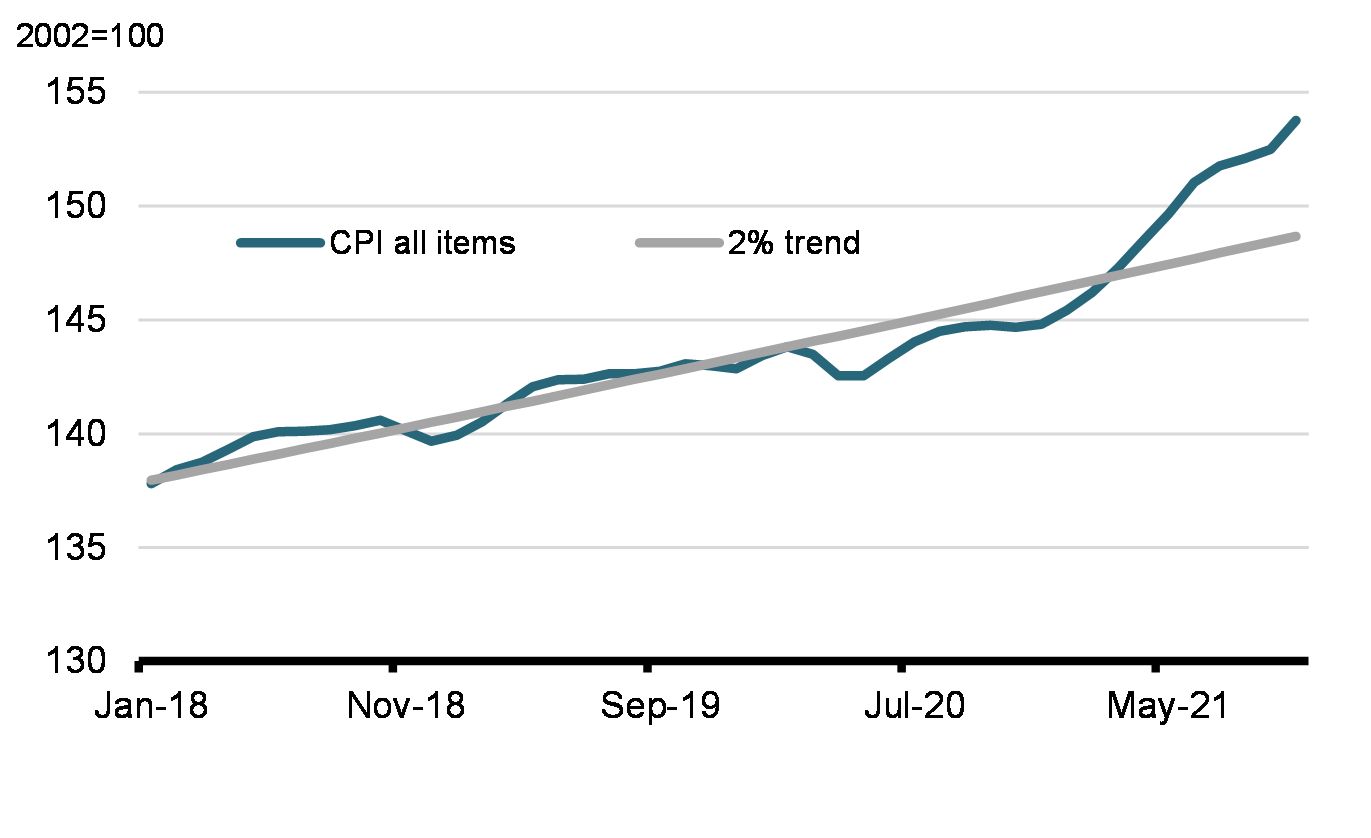
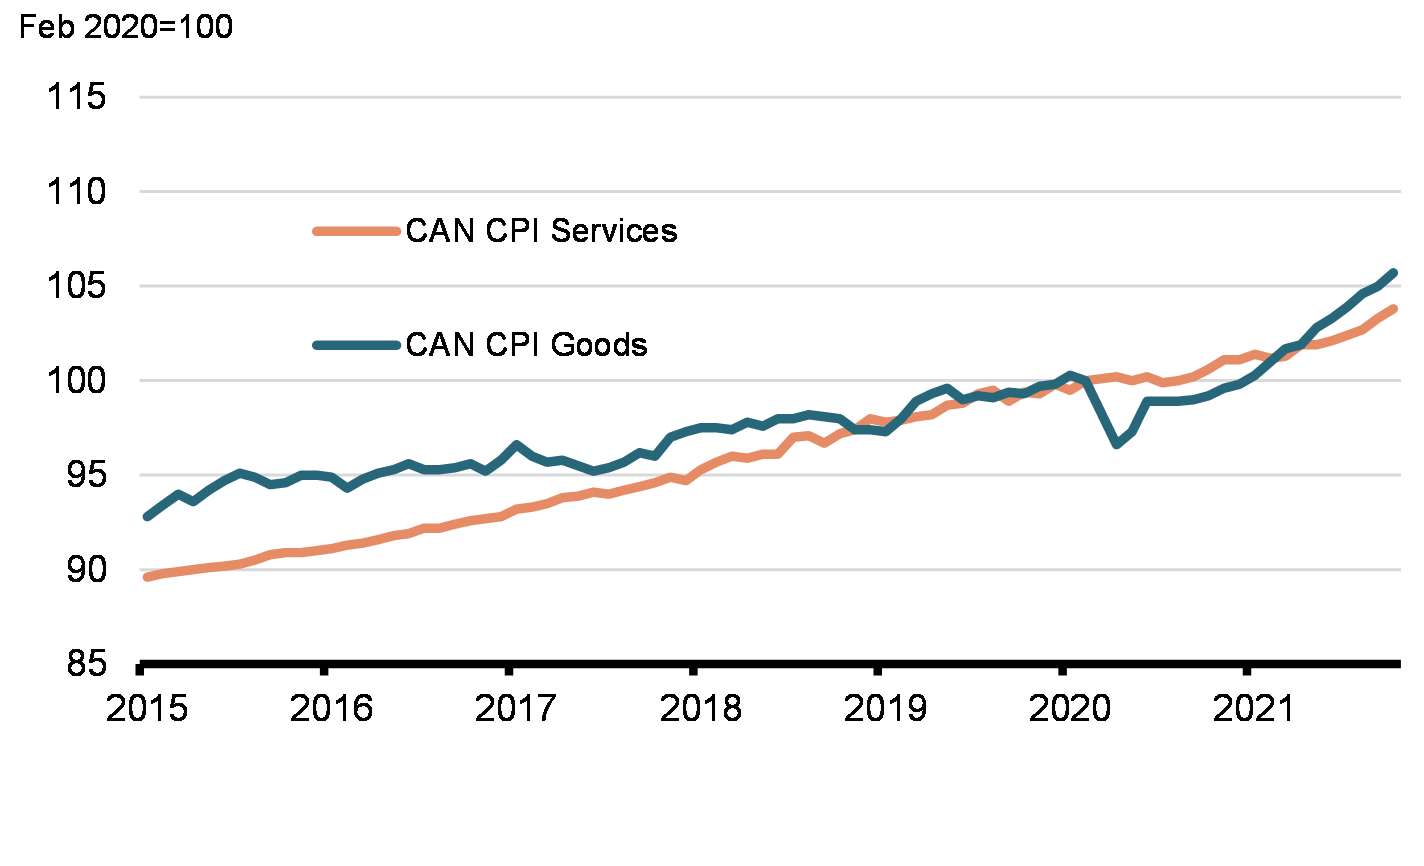
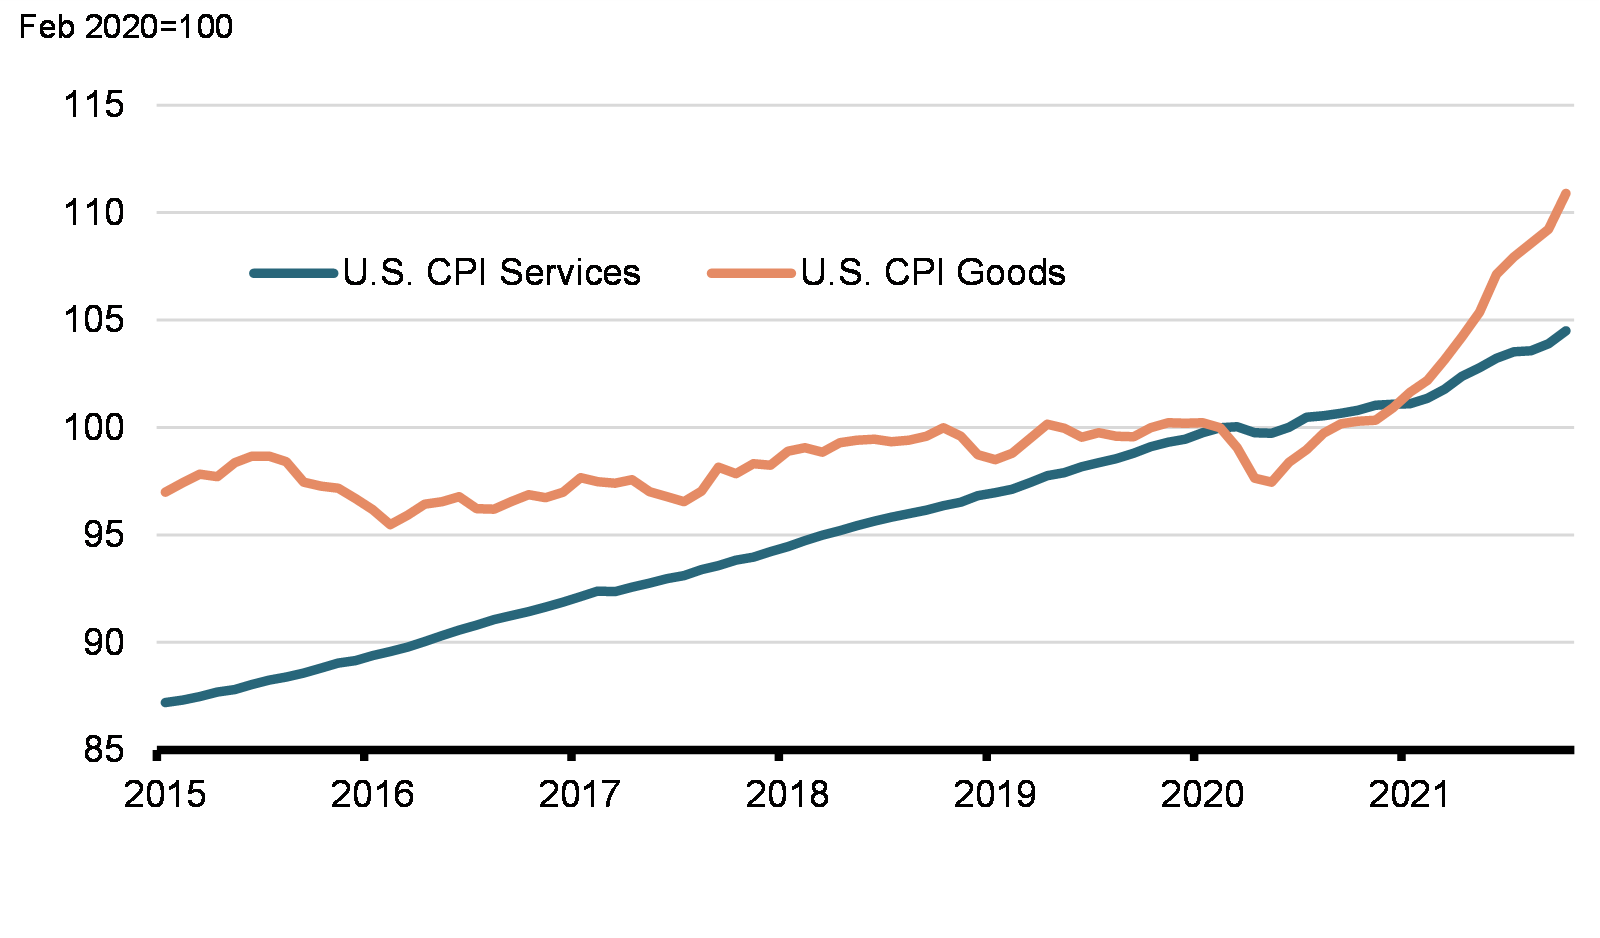
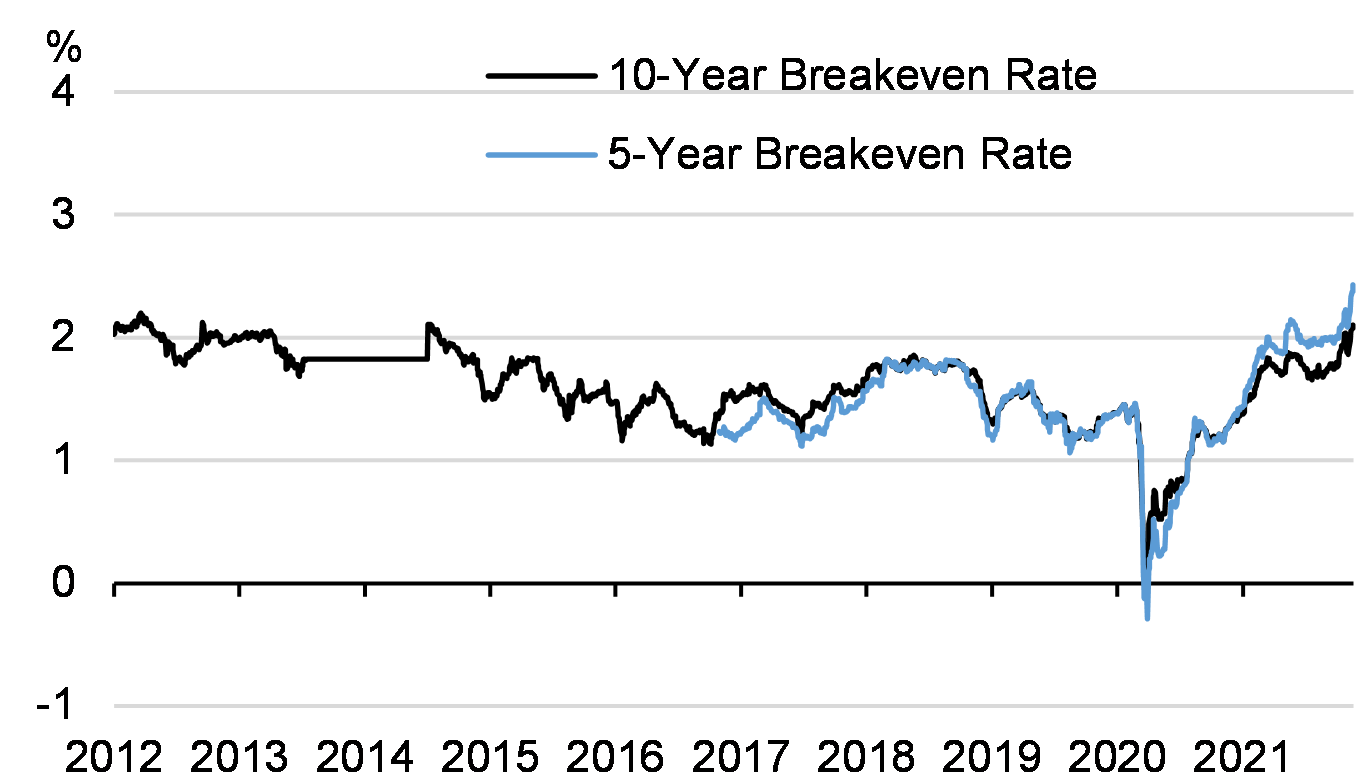
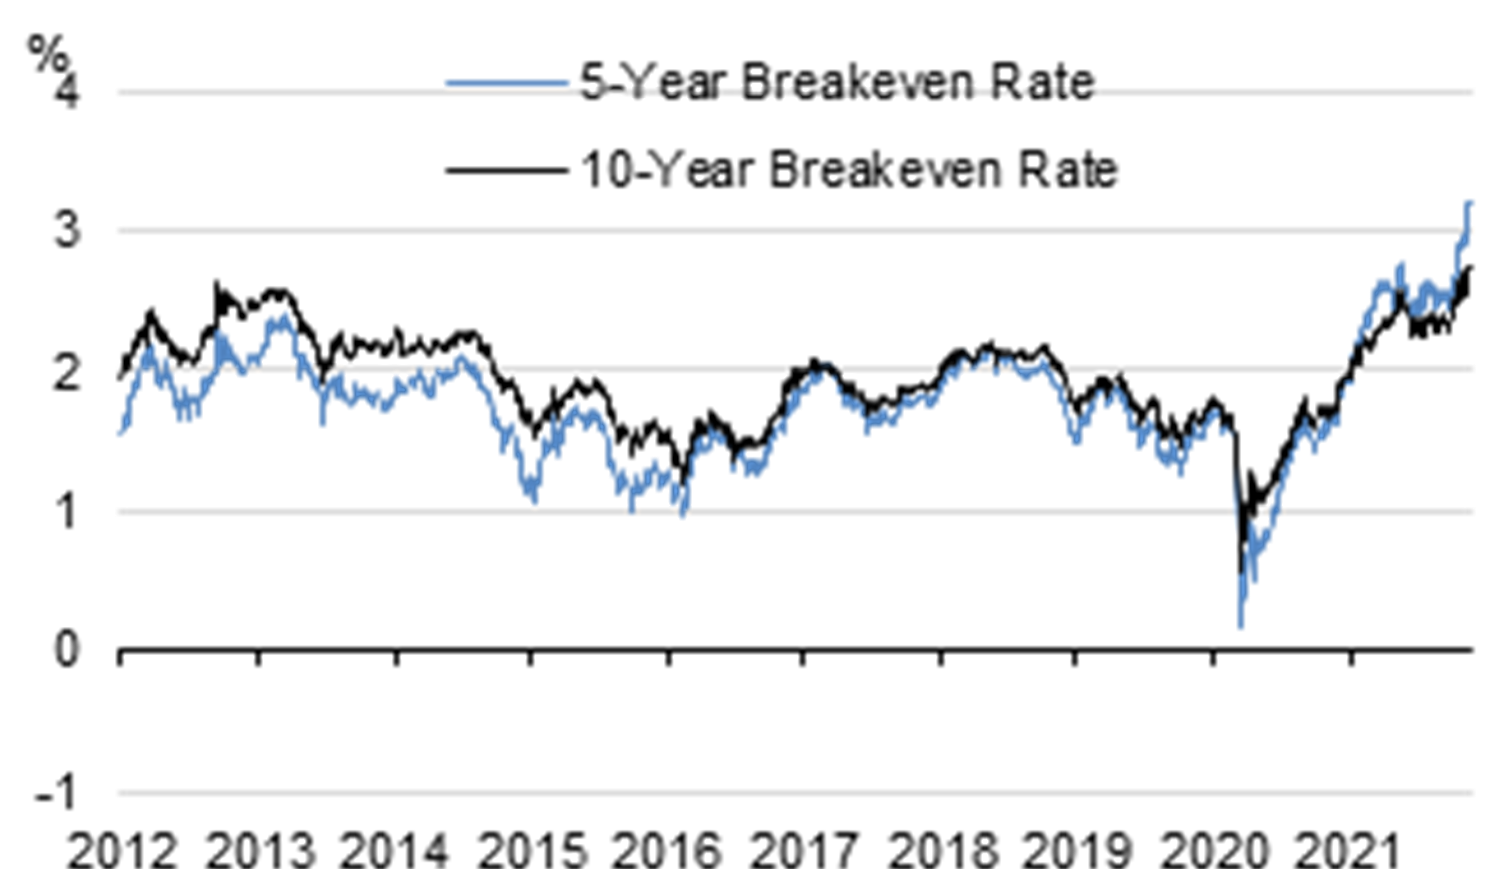
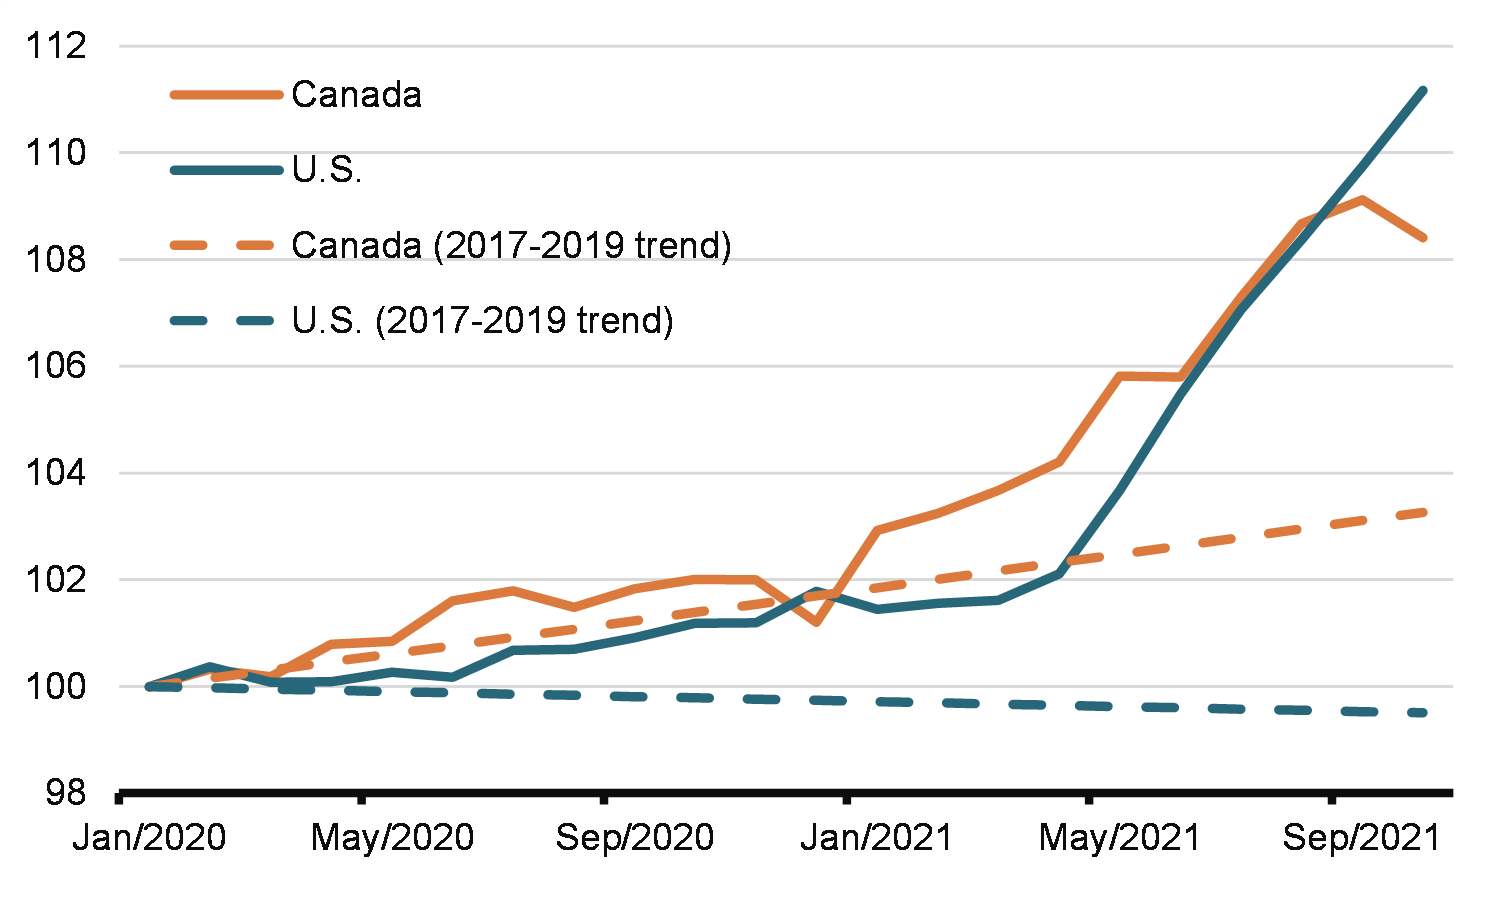
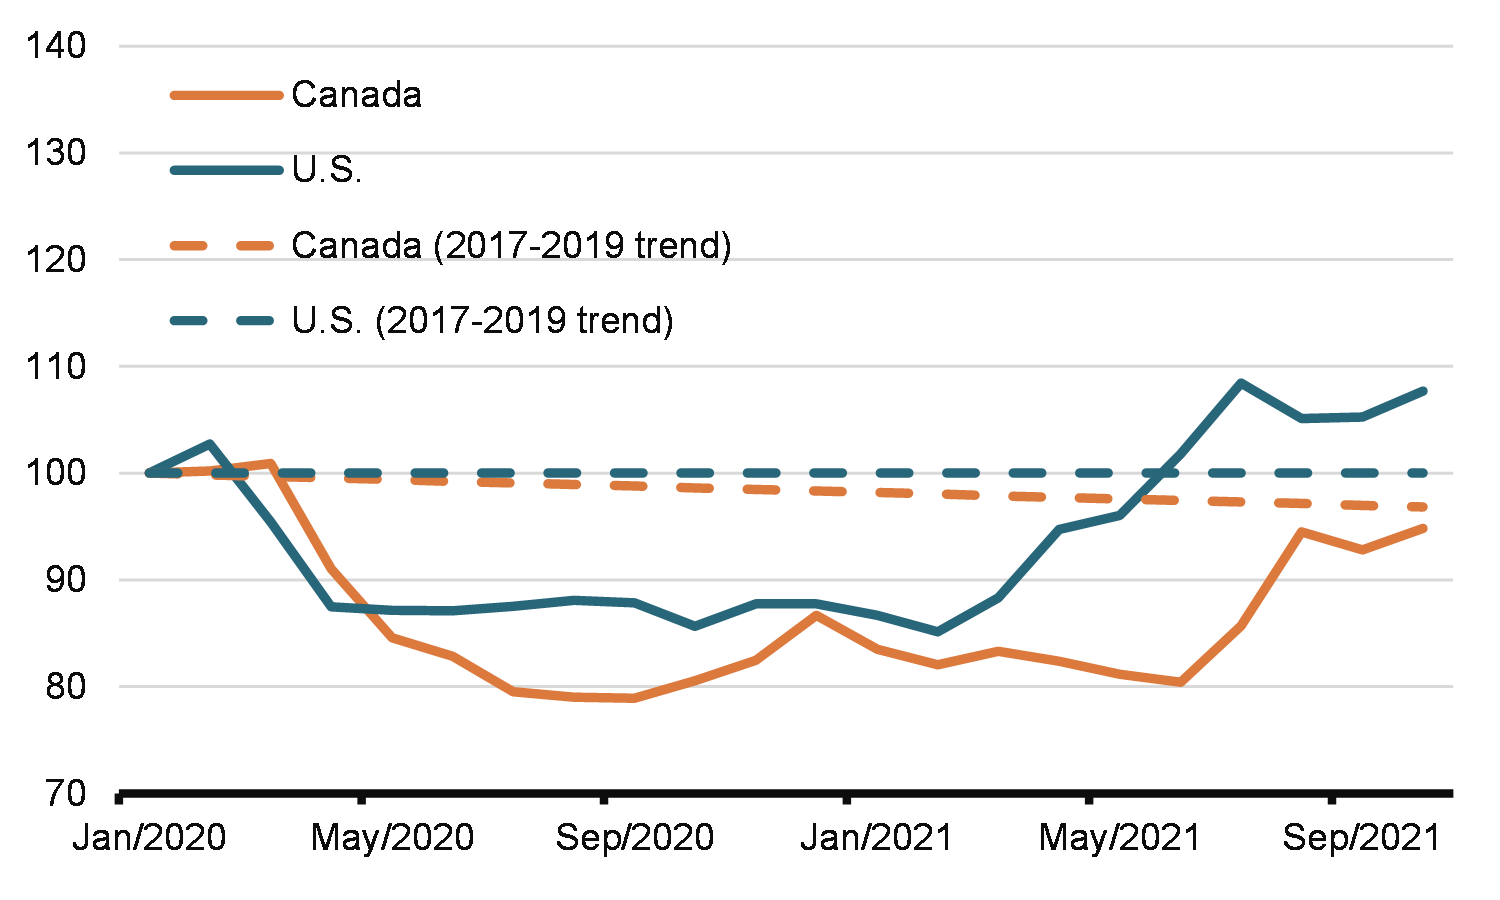
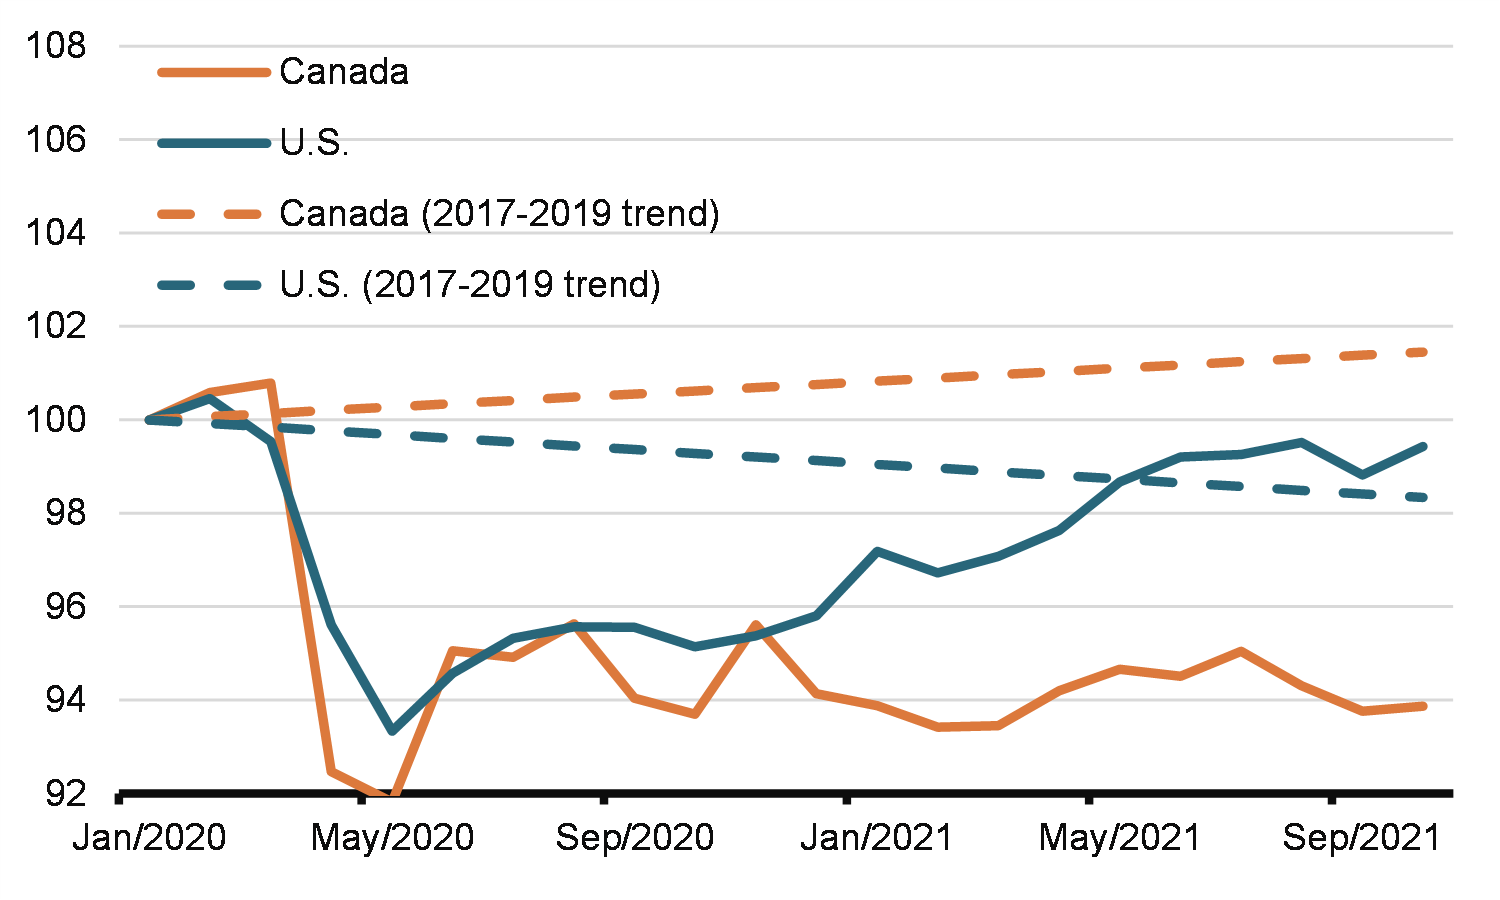
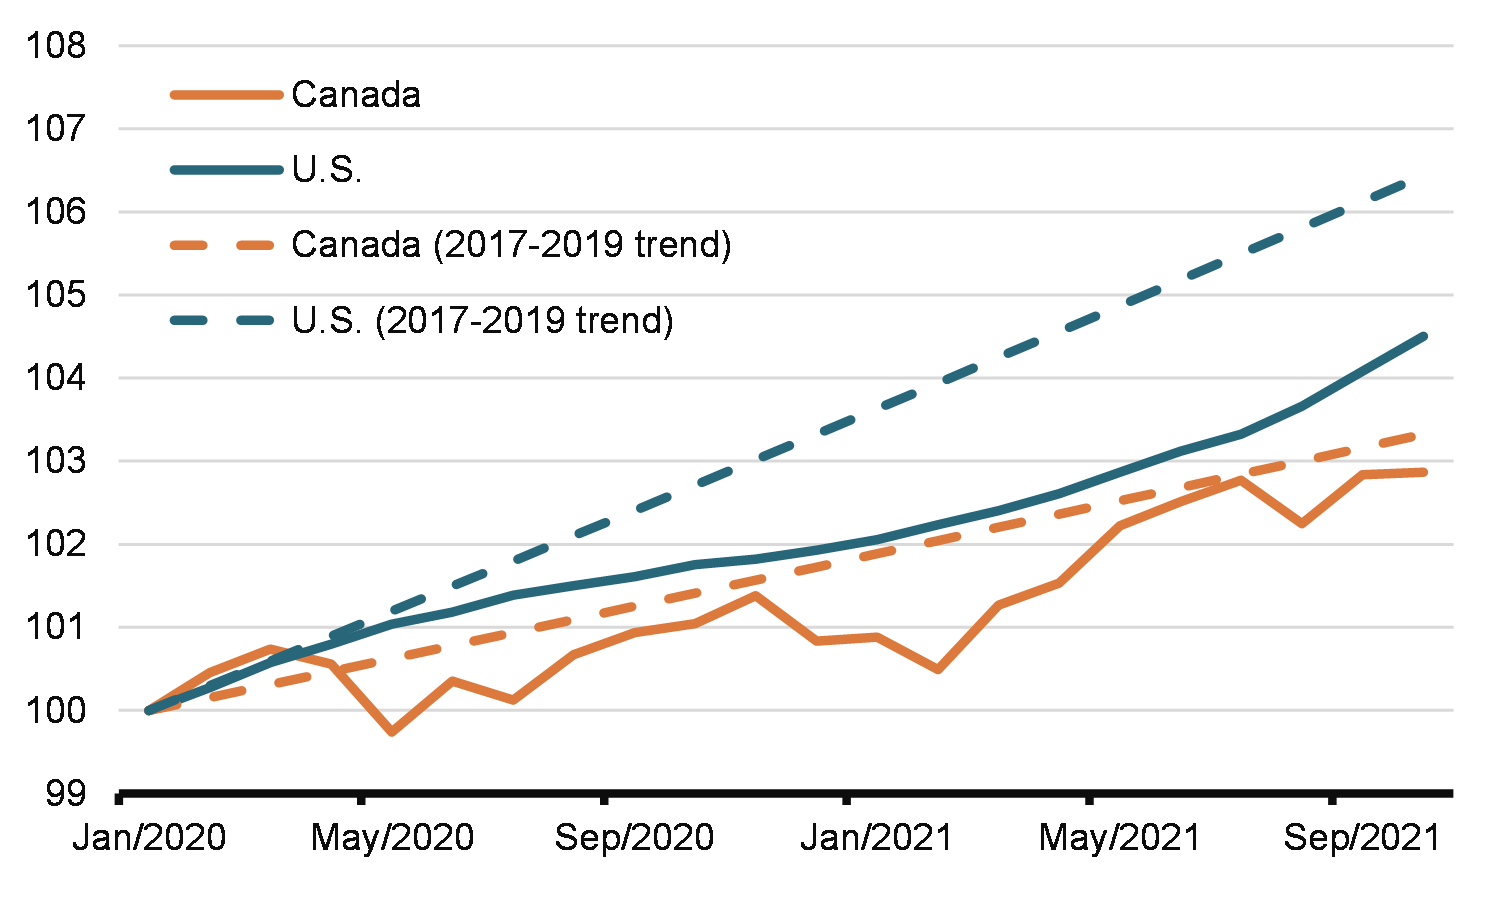
Higher prices around the world have largely been the result of pressures associated with the complex task of reopening the economy. Prices are currently being boosted by the “base-year” effects, where prices are recovering following sharp declines early in the pandemic. In particular, the easing of restrictions and the rapid return of economic activity globally has pushed up energy and other prices since the start of the year. These factors are causing a rapid increase in year-over-year inflation. However, changes in prices from two years ago are considerably less pronounced in advanced economies, including in Canada (Figure 1).
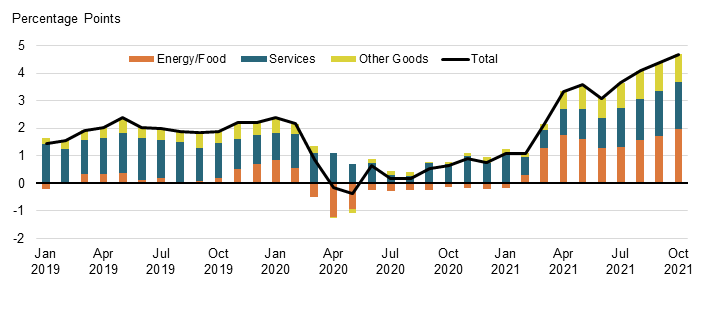
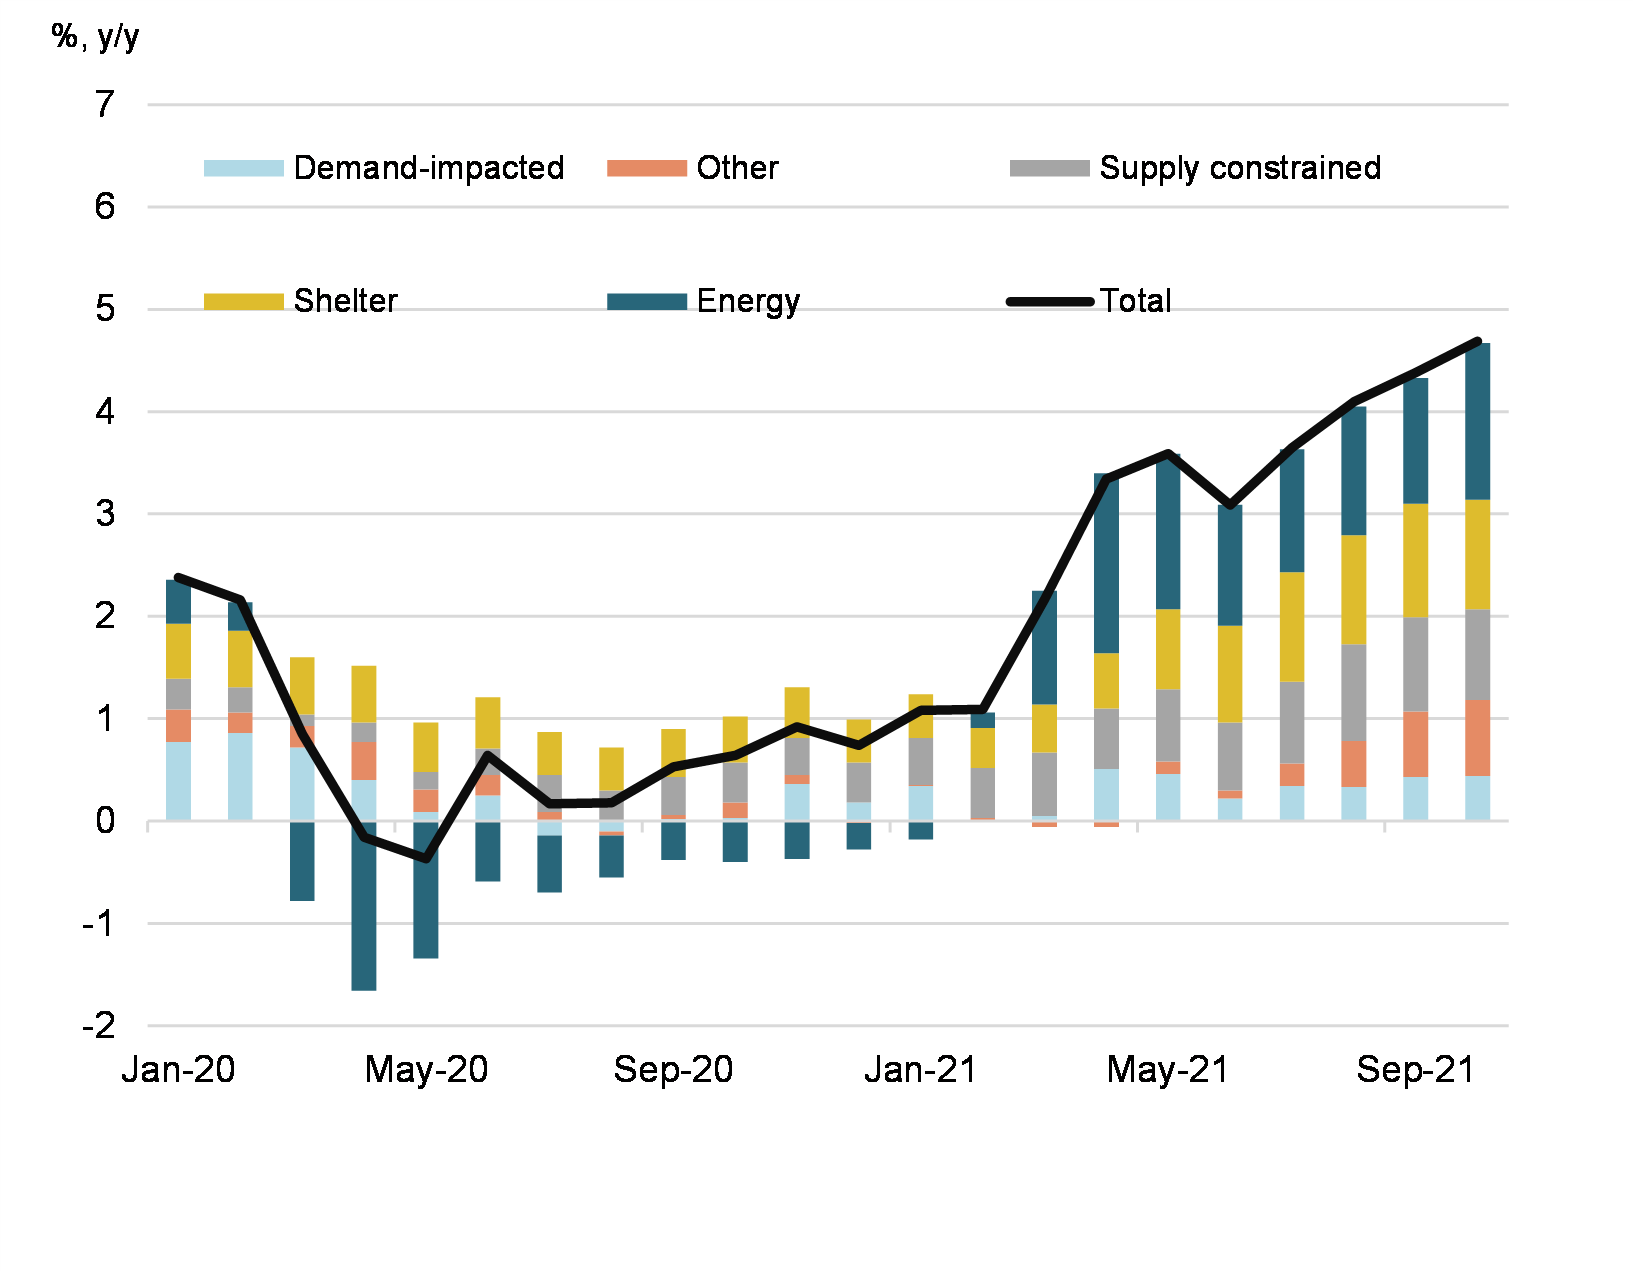
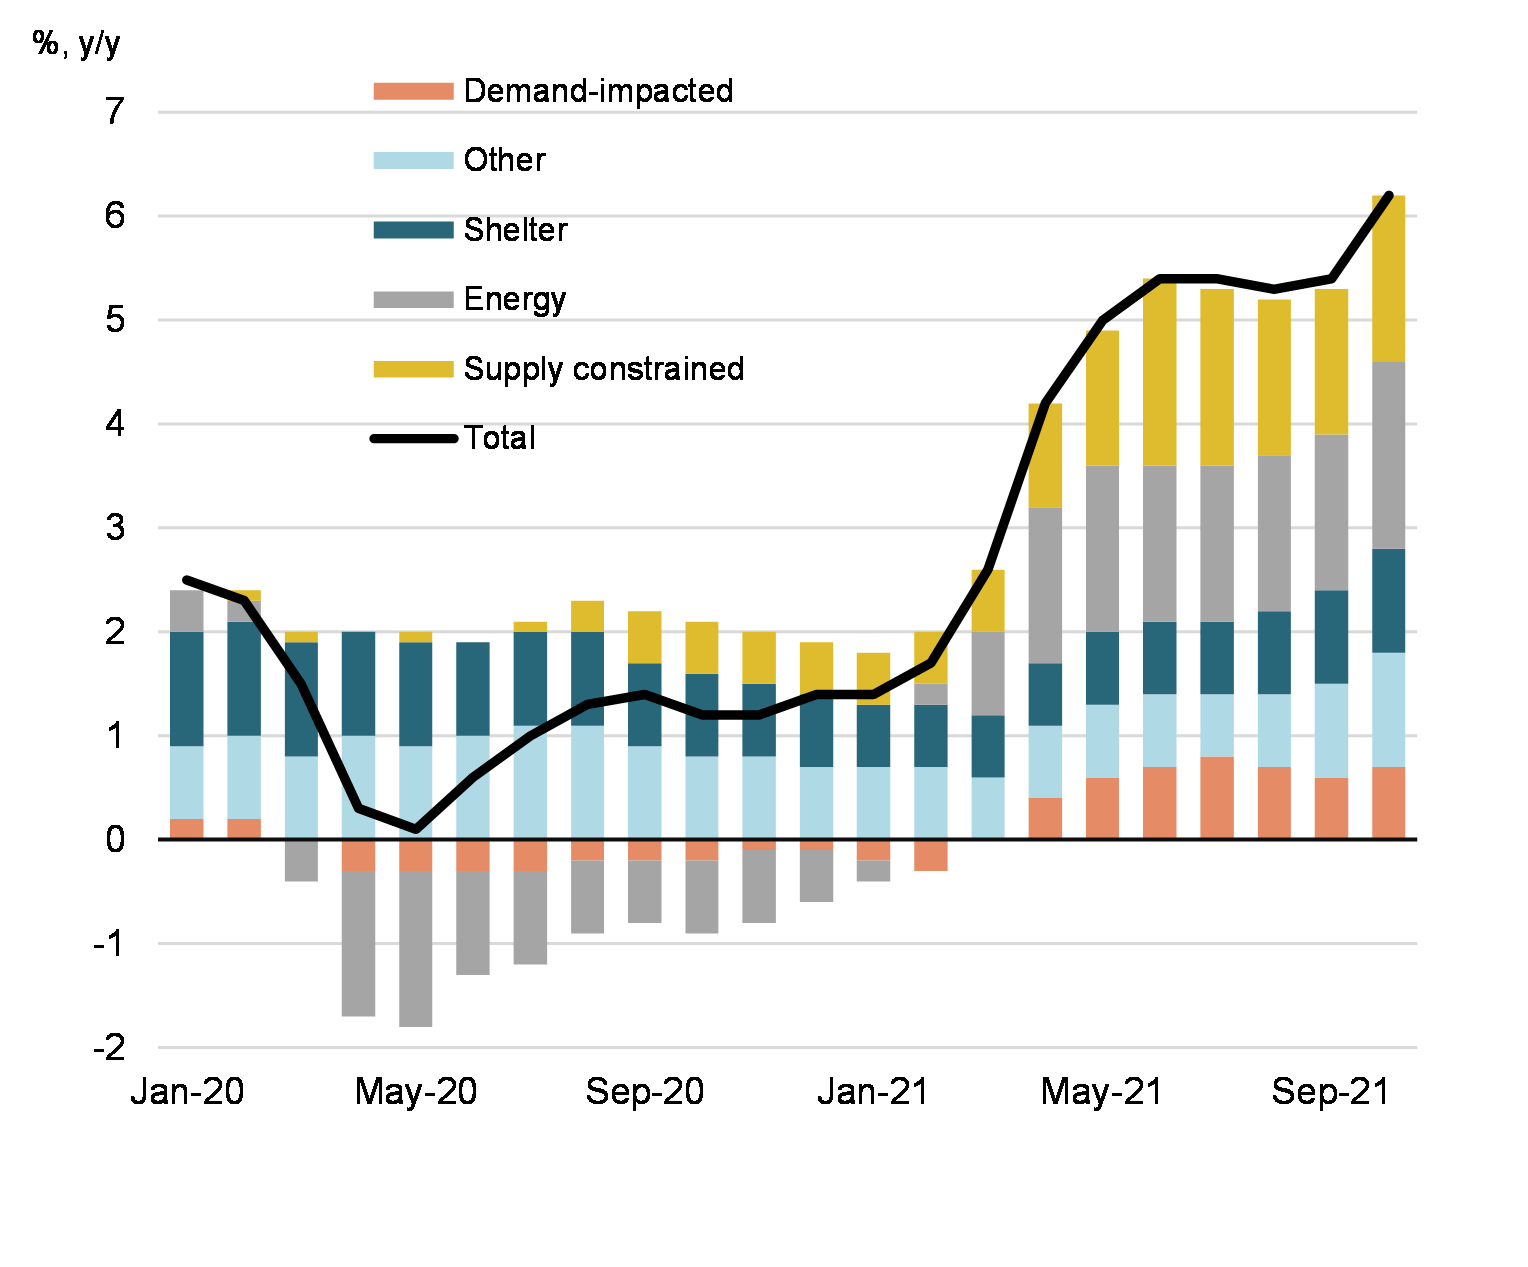
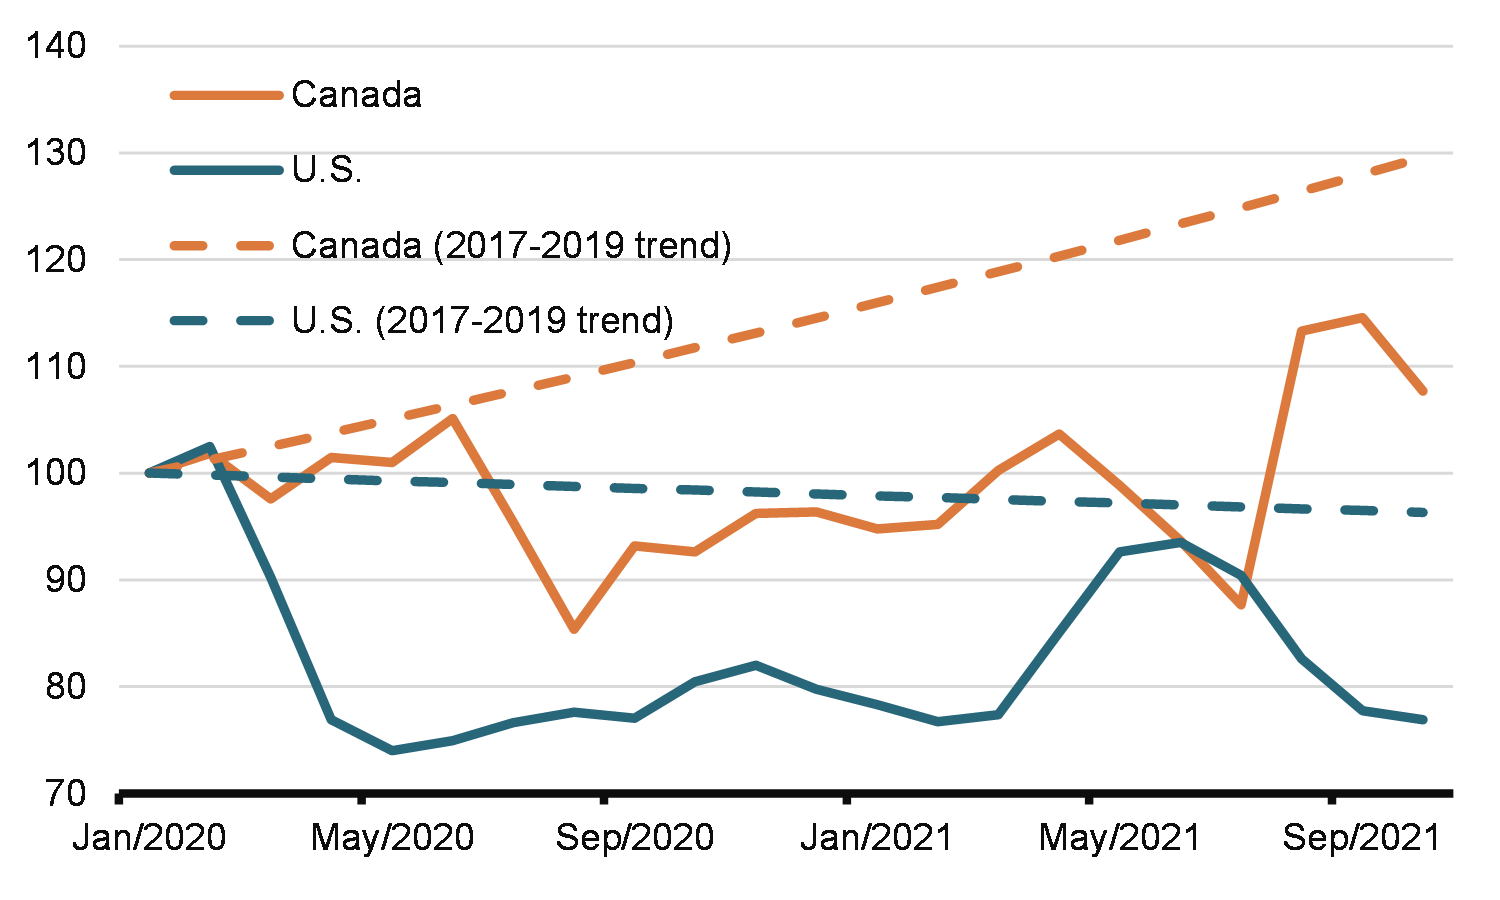
Inflation has also been boosted by higher energy prices and supply shortages (Figure 2):
- The strength in energy prices reflects imbalance between supply and demand, as oil production by countries from OPEC+ remained below pre-pandemic levels and supply was affected by severe weather events, while global demand increased.
- Prices of some durable goods, particularly cars, have surged along with stronger than usual demand amid restricted services and supply bottlenecks, such as that experienced with the global shortage of semiconductors. Public health restrictions at ports and plants are also contributing to supply disruptions and higher shipping costs. Food prices increased recently due to droughts and other adverse weather events, as well recent supply disruptions related to temporary plant closures following outbreaks.
These unusual factors are not expected to permanently increase inflationary pressures. Supply bottlenecks are expected to fade people returning to consuming more services and demand for goods normalizes. As the pandemic becomes less disruptive, supply capacity issues will ease, helping inflation to come down over the course of 2022. Finally, the impact of higher energy prices on inflation is expected to dissipate over 2022. Accordingly, in its most recent Monetary Policy Report, the Bank of Canada expects that inflation will remain elevated for the rest of 2021, before easing back towards the 2% target throughout 2022 (Table 2). This is broadly consistent with recent private sector forecasts.
| 2021-Q2 | 2021-Q3 | Aug-21 | Sep-21 | Oct-21 | |||
|---|---|---|---|---|---|---|---|
| Total CPI Inflation | |||||||
| Actual, Year-over-year, not seasonally adjusted | 3.3 | 4.1 | 4.1 | 4.4 | 4.7 | ||
|
Excluding Energy
|
1.9 | 3.0 | 3.0 | 3.3 | 3.3 | ||
| Period-over-period, seasonally adjusted | 1.0 | 1.4 | 0.5 | 0.6 | 0.5 | ||
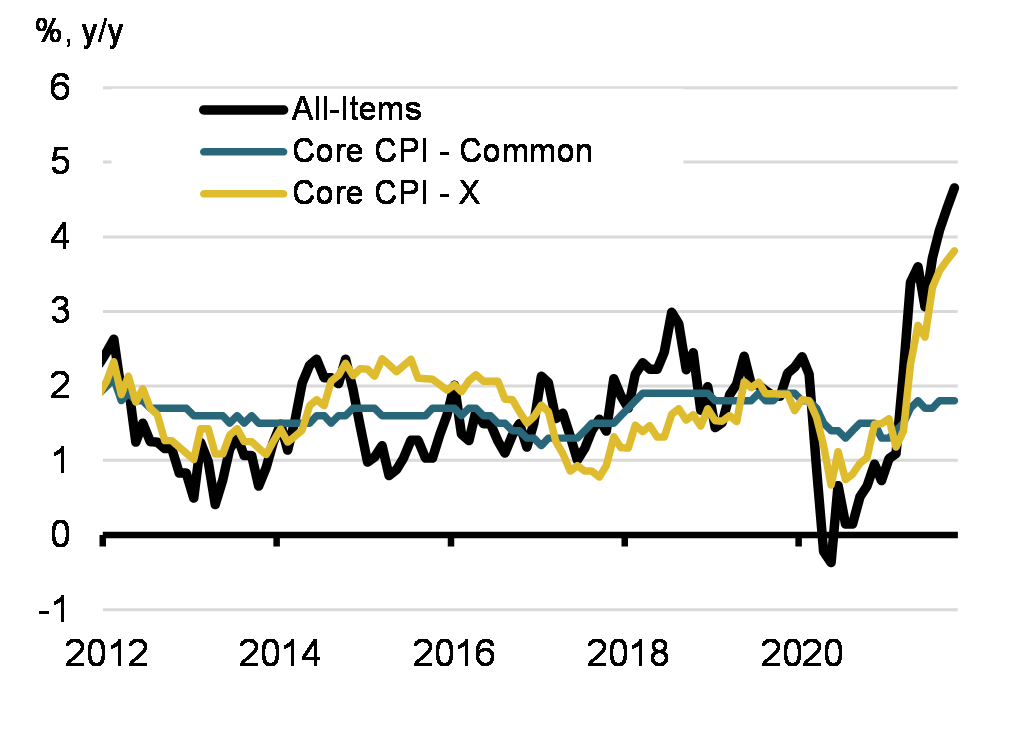
| Core inflation | |||||||
| CPI-common* | 1.7 | 1.8 | 1.8 | 1.8 | 1.8 | ||
| CPI-median* | 2.3 | 2.8 | 2.8 | 2.9 | 2.9 | ||
| CPI-trim* | 2.5 | 3.2 | 3.2 | 3.3 | 3.3 | ||
| Sources: Statistics Canada; Department of Finance calculatons. *CPI-common (common component) is an estimated measure of core inflation that tracks common price changes across categories in the CPI basket. CPI-median is based on a single component, the component with the monthly inflation rate at the 50th percentile of the distribution. CPI-trim excludes the 20% slowest-and fastest-growing components of the CPI (by weight). |
|||||||
Consumer Price Inflation over a Two-Year Period, Canada
(month-to-month, two-year moving average annualized growth)
Contribution to Year-Over-Year Consumer Price Inflation, Canada
| 21Q4 | 22Q1 | 22Q2 | 22Q3 | 22Q4 | |
|---|---|---|---|---|---|
| Bank of Canada MPR – October 2021 | 4.8 | 4.4 | 3.9 | 3.1 | 2.1 |
International Comparisons
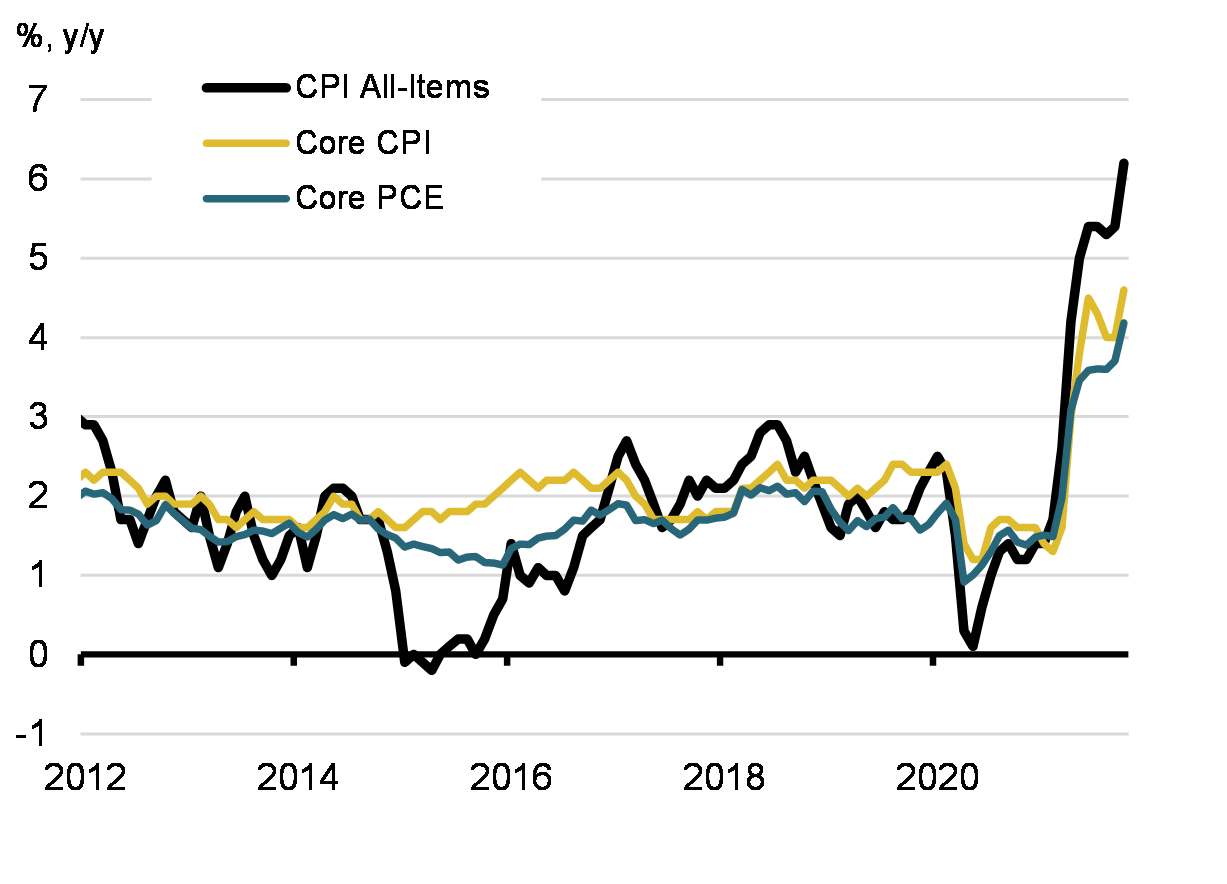
Canada currently has the second-highest rate of headline inflation in the G7, surpassed by only the United States, and is also currently higher than several developing economies (Saudi Arabia, Singapore, India and China).
However, international comparisons are problematic and can be misleading as countries account for price changes in very different manner. In particular, the treatment of housing costs is currently boosting Canada’s inflation rate relative to peer countries who either account for new housing differently (for example, Canada includes new home prices while others use slower-growing rent costs) or do not account for it at all. Further, comparisons between developed and emerging economies are not relevant, as many prices – particularly gasoline prices which have risen by over 40% in Canada over the past year – are controlled by legislation or with subsidies in emerging countries. In the current context, this understates price inflation in these developing countries.
| October 2021 | |
|---|---|
|
U.S.
|
6.2 |
|
Canada
|
4.7 |
|
Germany
|
4.5 |
|
U.K.
|
3.8 |
|
Italy
|
3.0 |
|
France
|
2.6 |
|
Japan
|
0.1 |
| Sources: Haver Analytics | |
| Product | Price | Y/Y Change (%) | |
|---|---|---|---|
| Sirloin steak, 1 kg | $26.45 | 13.6 | |
| Blade roast, 1 kg | $18.52 | 8.6 | |
| Ground beef, 1 kg | $12.31 | 8.2 | |
| Pork chops, 1 kg | $12.43 | 6.7 | |
| Chicken, 1 kg | $8.51 | 7.2 | |
| Bacon, 500 g | $8.29 | 19.1 | |
| Wieners, 450 g | $5.42 | 11.3 | |
| Canned salmon, 213 g | $6.66 | -0.7 | |
| Partly skimmed milk, 4 l | $5.52 | 4.2 | |
| Butter, 454 g | $5.60 | 6.3 | |
| Processed cheese, 250 g | $2.66 | -2.9 | |
| Eggs, 1 dozen | $3.87 | 7.2 | |
| Bread, 675 g | $2.84 | 0.4 | |
| Macaroni, 500 g | $1.53 | -7.3 | |
| Flour, 2.5 kgs | $4.19 | -1.2 | |
| Corn flakes, 675 g | $6.37 | 9.3 | |
| Apples, 1 kg | $4.61 | 1.8 | |
| Bananas, 1 kg | $1.60 | 1.9 | |
| Oranges, 1 kg | $4.02 | 1.5 | |
| Orange juice, 1 l | $4.35 | 7.1 | |
| Carrots, 1 kg | $2.32 | 8.4 | |
| Mushrooms, 1 kg | $9.43 | 1.7 | |
| Onions, 1 kg | $2.14 | -4.0 | |
| Potatoes, 4.54 kg | $10.17 | 3.6 | |
| French fries, frozen, 1 kg | $3.20 | 7.7 | |
| Baked beans, canned, 398 ml | $1.44 | 2.9 | |
| Ketchup, 1 l | $4.04 | 8.6 | |
| Sugar, white, 2 kg | $2.57 | 10.3 | |
| Coffee, roasted, 300 g | $5.21 | 4.6 | |
| Tea (72 bags) | $4.29 | 3.9 | |
| Cooking or salad oil, 1 l | $4.14 | 34.9 | |
| Soup, canned, 284 ml | $1.29 | 4.9 | |
| Baby food, 128 ml | $1.66 | 5.1 | |
| Peanut butter, 500 g | $2.78 | -0.4 | |
| Paper towels (2 rolls) | $3.31 | -0.6 | |
| Facial tissue (200 tissues) | $2.81 | 0.7 | |
| Bathroom tissue (4 rolls) | $2.95 | 12.2 | |
| Shampoo, 300 ml | $4.08 | 1.2 | |
| Deodorant, 60 g | $4.32 | 8.5 | |
| Toothpaste, 100 ml | $3.49 | 4.2 | |
| Cigarettes (200) | $140.99 | 9.3 | |
| Gasoline, l | $1.46 | 42.3 | |
Canada–U.S. Inflation Monitor
| Canada | U.S. |
|---|---|
|
|
|
|
|
|
|
|
|
|
|
|
|
|
|

|
Prices of certain goods and services fell sharply or increased at a subdued pace during lockdowns. As economies reopen, many prices are returning to pre-pandemic trends, boosting inflation.
Note: All series are seasonally adjusted.
Supply-constrained segment
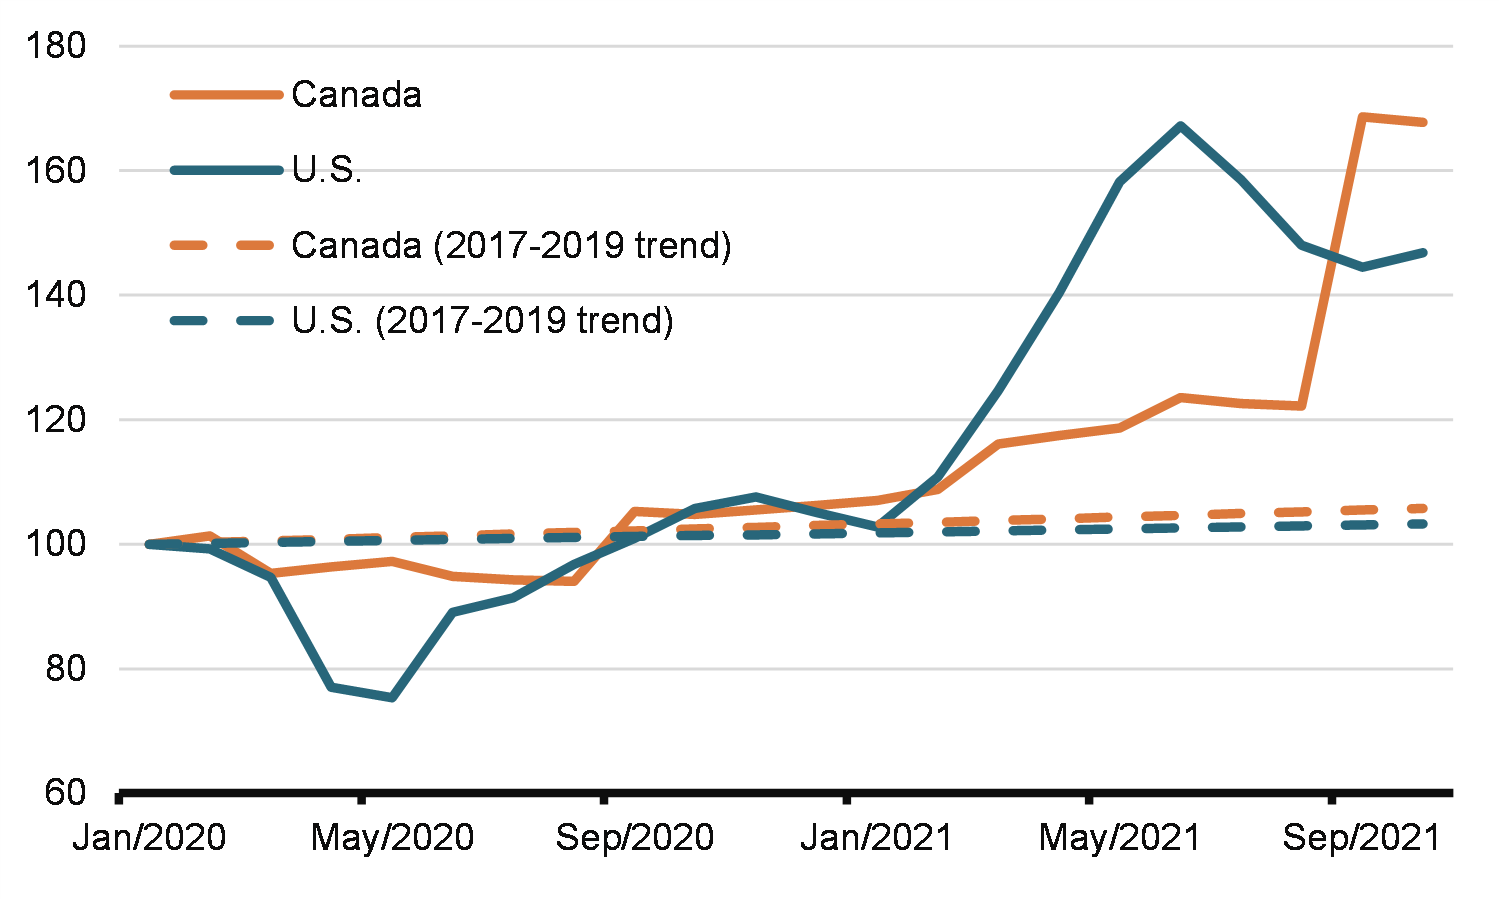
Demand-impacted segment
Economic Recovery
Issue
Canada’s economic recovery is well on track.
Talking points
- Canada’s economic recovery is well on track, with economic activity rebounding 5.4 per cent in the third quarter.
- That robust performance beat economists’ expectations of 3 per cent growth.
- The labour market recovery also took a larger-than-expected step forward in November, adding 154,000 jobs.
- Canada has now recovered 106 per cent of the jobs lost during the pandemic compared to just 83 per cent in the U.S.
- At 6.0 per cent in November, the unemployment rate is at its lowest since the start of the pandemic and very close to its pre-pandemic level.
- Equally as encouraging, job prospects for some of Canada’s most vulnerable, who bore the brunt of the pandemic’s wrath – such as women, young people, and racialized workers – have greatly improved.
- This is a tribute to the resilience and hard work of Canadians.
- Government supports have prevented unnecessary increases in insolvencies and kept Canadians’ and businesses’ finances largely intact, limiting economic scarring and laying the foundation for a strong recovery.
- Canada’s successful vaccination rollout and easing of public health restrictions have allowed businesses in many hard-hit sectors to reopen safely and start hiring back workers.
- Over the rest of the year and into 2022, Canada’s recovery will continue to build as our successes with vaccination and reopening allow Canadians to get back to things they have been missing these past nearly two years.
- Still, the recovery is uneven and as the recent Omicron variant demonstrates the pandemic is still with us, threatening Canadians health and livelihoods.
- Restarting the economy is a complex process, as we are seeing, with surging global demand disrupting global supply chains, and driving prices higher for many goods.
- The recent flooding in B.C. is also presenting challenges to many businesses by hampering supplies of goods and inputs as well as limiting exports of our key commodities and other goods.
- The government is determined to do what is necessary to accelerate the recovery, moving from very broad-based support to more targeted measures that will provide help where it is needed, to create jobs and set the stage for strong, sustained growth for years to come.
Background
The Canadian economy is on the road to recovery. After GDP slipped in the second quarter of 2021 (-3.2 per cent, at annual rate), Canada’s recovery regained its footing in the third quarter (5.4 per cent) as Canada’s vaccination campaign and lifting of public health restrictions drove a substantial rebound. Hard-hit services, such as restaurants, arts, and entertainment, saw sharp increases in activity as easing restrictions allowed households to start normalizing spending patterns. Exporters made solid gains in the third quarter, despite ongoing global supply chain issues, with higher exports of energy products, minerals, and machinery and equipment.
This robust performance in the third quarter was above market expectations of 3.0 per cent growth, but close to the Bank of Canada’s October Monetary Policy Report outlook (5.5 per cent). However, accounting for the downward revision to the second quarter, Canada’s real GDP level (at 1.4 per cent below its pre-pandemic level as of the third quarter) is at a similar point to what was expected by markets.
Canada’s real GDP growth in the third quarter was faster than in the U.S., the U.K. and Japan in the third quarter, but behind its European peers who saw large gains from re-opening and less drag from supply-chain disruptions and housing normalization. Among G7 countries, Canada’s real GDP level is now the fifth farthest from pre-pandemic levels, only ahead of the U.K. and Japan. OECD projections suggest Canada’s economic recovery will improve and is expected to rank the second fastest (relative to pre-pandemic level of GDP) among G7 countries by 2023.
With Canada’s recovery on more solid footing, job creation surged over the summer, with the government’s commitment to create one million new jobs achieved in September – well ahead of expectations. Moreover, employment jumped by 154,000 in November, now exceeding its pre-pandemic level by about 186,000 positions, a recovery that has been faster than most of Canada’s peers (among the G7 second only to France) and than any previous recessions. The unemployment rate has declined for six consecutive months, reaching 6.0 per cent in November, its lowest level since the start of the pandemic and just a bit higher than before the pandemic hit (when is was 5.7 per cent). Many businesses in the hardest-hit sectors are safely re-opening and actively hiring again, helping to reduce same of the unevenness that characterized the earlier part of the recovery. Canadians are confident in their labour market prospects with the share of Canadians aged 15 to 64 with a job or looking for a job reaching a record high in November, including for women, in contrast with the U.S. where labour force participation for this group remains below its pre-pandemic level.
Nevertheless, re-opening the domestic and global economy has been a complex task, and the process has not been smooth. Some of the optimism seen earlier in the year among households and businesses has faded amidst supply chain issues, higher inflation, and a fourth wave of the pandemic in some areas. More recently, the Omicron variant is posing renewed health risks, with many countries already imposing travel measures. While Canada faces this latest variant from a position of strength with 80 per cent of eligible Canadians (i.e. 5 years and older) fully vaccinated, if the variant proves to have greater health risks global efforts to contain its spread could exacerbate existing supply chain strains, slow the recovery and add more upward pressure to goods inflation.
As of September, economic activity in the Canadian economy is about 1.4 per cent below its pre-pandemic level. However, this aggregate change masks some of the deep and enduring impact on the hardest-hit sectors. Accommodation remains down about 20 per cent from pre-pandemic levels while food service is down 9 per cent. The air transportation sector and public transit have seen the severest decline, with activity in September more than 70 per cent and 40 per cent below, respectively, their pre-pandemic levels. For the rest of the year, we expect that these sectors will continue to see activity improving as vaccination and fewer restrictions drive a rebound. However, the rise of the Omicron variant highlights again that managing health risks remains key to a complete recovery.
Canada’s recovery should continue in the fourth quarter with ongoing improvements in hard-hit sectors, some easing of supply-chain issues, and less drag from housing normalization. Encouragingly, after a flat reading in September, Statistics Canada’s preliminary data points to a strong gain of 0.8 per cent (monthly rate) in October, with increases in most sectors and led by manufacturing. The severe flooding in B.C. is expected to take a toll on the economy in November (potentially leading to the first decline in real GDP since July)—slowing growth in the fourth quarter. Still, real GDP is on track for a solid 3.5 per cent gain in the quarter (vs. 4.0 per cent in the Bank of Canada’s October Monetary Policy Report outlook).
Further ahead, any drag from B.C. floods in the fourth quarter is likely to be recouped in December and at the start of 2022. Continuing progress in hard-hit sectors, easing supply-chain disruptions, and solid fundamentals such as the still-strong level of savings will all support growth. Meanwhile, the housing sector will likely continue to normalize, as spending patterns re-balance and mortgage rates continue rising. The Omicron variant also adds a new challenge heading into 2022, adding further evidence that real GDP is likely to remain uneven in the near term. Higher prices and the persistence of inflationary pressures remains an important risk for Canada, and may hold back consumer spending and real incomes.
As we look forward to the end of this year and into 2022, there is still work to do. About 155,000 Canadians are still working sharply reduced hours because of the pandemic. Long-term unemployment remains elevated, with 318,000 workers unemployed for more than 6 months (about 139,000 above pre-pandemic level). Jobs in the hard-hit accommodation and food services sectors are still more than 200,000 below pre-pandemic levels.
High vaccination rates and vaccine passports should mitigate the risk of widespread public health restrictions. However, some headwinds could slow the job recovery in the near-term including the new Omicron variant and ongoing supply chain issues. Any impact from the B.C. floods will be evident beginning with the December LFS (to be released Jan. 7) as the floods started just after the November reference week (November 7 – 13).
|
Pre-pandemic Level (February 2020) |
Current Nov-2021 |
|
|---|---|---|
| Employment (thousands) | 19,130 | 19,316 |
| Actual hours worked (thousands of hours per week) | 630,722 | 631,665 |
| Working-age (15-64) employment rate (per cent) | 74.4 | 74.9 |
| Number of unemployed (thousands) | 1,146 | 1,244 |
| Unemployement rate (per cent) | 5.7 | 6.0 |
| 2021 | 2022 | 2023 | |
|---|---|---|---|
| OECD Economic Outlook – December 2021 | 4.8 | 3.9 | 2.8 |
| Bank of Canada MPR – October 2021 | 5.1 | 4.3 | 3.7 |
| IMF World Economic Outlook – October 2021 | 5.7 | 4.9 | 2.6 |
| Budget 2021 – April 2021 | 5.8 | 4.0 | 2.1 |
| Real GDP Growth in 2021Q3 (annualized) | Real GDP Growth since 2019Q4 | |
|---|---|---|
| Canada | 5.4 | -1.4 |
| United States | 2.1 | 1.4 |
| France | 12.6 | -0.1 |
| Germany | 6.9 | -1.1 |
| Italy | 11.0 | -1.3 |
| United Kingdom | 5.1 | -2.1 |
| Japan | -3.0 | -2.2 |
Summary of Canada's COVID-19 Economic Response Plan
Issue
In March 2020, the Government of Canada rolled out its COVID-19 Economic Response Plan (ERP). In conjunction with measures that address the pandemic from an epidemiological and public health perspective, the ERP provided support to individuals, families, and businesses. Over time, the ERP evolved in response to the changing nature of COVID-19 in Canada, and wound down as policy shifted focus towards recovery.
Talking points
- The Government of Canada fulfilled its role to stabilize the economy and responded with rapid and broad-based emergency support. Measures were aimed at protecting the health of Canadians and providing a safety net to support families, workers and businesses across the country.
- Canada’s Economic Response Plan has been key in bridging Canadians and businesses through the COVID-19 shock waves and stabilized the economy. Canada’s response has been one of the largest and fastest among G7 countries.
- The government’s plan has positioned the Canadian economy to recover strongly.
- IMF analysis indicates that without direct support measures, Canada’s real GDP would have declined by about 13.2 per cent in 2020 (versus an actual decline of 5.4 per cent), a difference of about 8 percentage points. Further, without support measures, the IMF estimates that the unemployment rate would have risen by an additional 3.2 percentage points in 2020.
Background
The key policy pillars of Canada’s COVID-19 ERP include:
Protecting the Health and Safety of Canadians
- The Safe Restart Agreement provided $13 billion to Canada’s provinces and territories to support the restarting of the country’s economy, including by funding testing and contact tracing and capacity to manage outbreaks. This funding also supported vulnerable populations and communities. The agreement also provided over $4.5 billion for the centralized federal procurement of personal protective equipment (PPE). Value: $19.9 billion.
- PPE and ventilator procurement, including bulk purchases with provinces and territories. Value: $5.4 billion.
- Vaccine procurement, research, development, and production. Value: $14.3 billion.
- Immunization and health care system support payments to provinces and territories. Value: $5.5 billion.
Support for Individuals
- The Canada Emergency Response Benefit (CERB), which provided immediate and responsive income support to individuals who lost their jobs or faced reduced hours due to the pandemic, at a rate of $500 per week. Value: $73.1 billion.
- CERB was replaced by the Canada Recovery Benefit (CRB), Canada Recovery Sickness Benefit (CRSB), and Canada Recovery Caregiving Benefit (CRCB), which continued to provide support to Canadians who could not work or whose incomes had dropped significantly due to COVID-19, including those who had to miss work due to illness, increased susceptibility to contracting COVID-19, or caregiving responsibilities. These recovery benefits provided support at a rate of $500 per week, with the CRB decreasing to $300 per week as the economic situation improved. Value: $36.1 billion.
- It was recently announced that the CRB would be allowed to expire in October 2021 and would be replaced by the Canada Worker Lockdown Benefit, which would provide $300 a week in income support to eligible workers should they be unable to work due to a local lockdown. The CRSB and CRCB will be extended.
- Temporary increases to the Goods and Services Tax (GST) Credit and the Canada Child Benefit (CCB). Value: $7.5 billion. Legislation passed March 25.
Support for Businesses
- Canada Emergency Commercial Rent Assistance (CECRA), which provided forgivable loans to qualifying commercial property owners to reduce the rent owed by eligible small businesses by 75 per cent. Value: $2.97 billion.
- CECRA was replaced by the Canada Emergency Rent Subsidy (CERS) and Lockdown Support measures, which, at its most generous, provided up to a 65 per cent subsidy for small businesses paying rent or mortgages, and extended support up to 90 per cent for businesses that were closed or significantly restricted due to public health orders.
- Wage subsidies to support businesses and workers while encouraging continued labour-market attachment. The first measure introduced was a 10-per-cent Temporary Wage Subsidy. The Canada Emergency Wage Subsidy (CEWS) was subsequently introduced, which, at its most generous, provided a subsidy of up to 75 per cent for qualifying employers, up to $847 per week per employee.
- The government has recently introduced legislation to provide continued support through rent and wage subsidies to tourism, hospitality and other hard-hit organizations that have been deeply affected by the pandemic, until May 7, 2022.
- The Canada Emergency Business Account (CEBA) and related programs, providing interest-free loans of up to $60,000 to small businesses and not-for-profits. Up to 1/3 ($20,000) of the loan may be forgiven if fully repaid by December 31, 2022. Value: $50 billion.
- The Business Credit Availability Program (BCAP) and Highly Affected Sectors Credit Availability Program (HASCAP) provide loan guarantees and financing to Canadian businesses of all sizes in all sectors and regions. Current take-up: $7.4 billion (varying program data, August to October 2021). The Large Employer Financing Facility (LEEFF) supports large Canadian employers, and has provided financial support, including loans and equity, to seven firms, with an approved value of $6.1 billion, plus an airline loan voucher facility of $1.8 billion for customer refunds.
- Income tax, Goods and Services Tax/Harmonized Sales Tax (GST/HST) and customs duty payment deferrals. Liquidity support value: $85 billion until the end of September 2020. Implemented under existing administrative authority.
- Co-ordinated measures taken by the Minister of Finance and financial sector partners to support the functioning of markets and continued access to financing for Canadian businesses.
Support for Vulnerable Groups
- Support for community partners to address the shelter and safety needs of people experiencing homelessness, with funding used to help manage or prevent an outbreak in the shelter system. Value: $695 million.
- Support for nearly 3,000 food banks and local food and service organizations to address emergency hunger relief across Canada. Value: $200 million.
- Women’s Employment Readiness Pilot to support marginalized women by providing and testing pre-employment and skill development supports. Value: $50 million over two years.
- National Workplace Accessibility Stream of the Opportunities Fund for Persons with Disabilities to help Canadians with disabilities secure and maintain good jobs, and to help set up accessible work-from-home arrangements and expanding accessible online training opportunities. Value: $15 million.
The table annexed below gives a detailed overview of the measures introduced as part of the Government of Canada’s COVID-19 ERP, along with their ‘impact value’; that is, the total cash value over 2019-20 to 2021-22 for direct support measures, or the total liquidity support provided through loans or other measures.
Anticipated areas of questioning
- What is the total amount that has been announced by the Government of Canada on the COVID-19 Economic Response Plan?
- As of October 21, the government has provided $355 billion in direct supports, including $60 billion in health and safety spending and $295 billion in income and economic supports.
- In addition, the government has provided $85 billion in tax liquidity support.
- This represents total support of $440 billion, or 20 per cent of 2020 GDP, excluding other liquidity support and capital relief.
- How much funding has been provided for vaccine procurement?
- As of Budget 2021, over $9 billion has been allocated for vaccine procurement.
| Protecting Health and Safety | Impact1 ($M) |
|---|---|
| Safe Restart Agreement | 19,909 |
| Safe Return to Class | 2,000 |
| Vaccines and Therapeutics | 14,340 |
| PPE and Medical Equipment | 5,352 |
| Long-Term Care | 1,340 |
| Other Public Health Support | 9,579 |
| Helping Health Care Systems Recover | 4,000 |
| Canada's COVID-19 Immunization Plan | 1,000 |
| Supporting the Mental Health of Those Most Affected by COVID-19 | 140 |
| Supporting Indigenous Communities in the Fight Against COVID-19 | 1,239 |
| Safe Return to School on Reserve | 112 |
| International COVID-19 Response and Recovery | 375 |
| Enhanced Border and Quarantine Measures (Re-classified)3 | 894 |
| Sub-Total – Protecting Health and Safety | 60,279 |
| Direct Support Measures | Impact1 ($M) |
| Canada Emergency Wage Subsidy* | 111,385 |
| Canada Emergency Rent Subsidy and Lockdown Support* | 8,645 |
| Canada Emergency Response Benefit | 73,056 |
| Enhancements to Employment Insurance* | 13,133 |
| Canada Recovery Benefit* | 28,662 |
| Canada Recovery Sickness Benefit* | 823 |
| Canada Recovery Caregiver Benefit* | 3,763 |
| Canada Emergency Business Account - Incentive | 13,822 |
| Other Direct Support Measures (FES 2020) | 34,359 |
Of Which: Support for Sectors |
|
Support for Workers in the Live Events and Arts Sector |
322 |
Air Sector Support |
1,028 |
Support for Innovative Businesses |
535 |
Support for Local Indigenous Businesses and Economies |
133 |
Financial Relief for First Nations through the First Nations Finance Authority |
17 |
Support for Indigenous Businesses and Aboriginal Financial Institutions |
307 |
Support for Main Street Businesses |
47 |
Support for Food Inspection Services |
20 |
Support for Cultural, Heritage and Sport Organizations |
500 |
Support for Canada's National Museums |
26 |
Support for Canada's National Arts Centre |
18 |
Cleaning Up Former Oil and Gas Wells |
1,720 |
Emissions Reduction Fund for the Oil and Gas Sector |
750 |
Supporting Canada's Farmers, Food Businesses and Food Supply |
453 |
Support for Fish and Seafood Processors |
63 |
Support for Canada's Fish Harvesters |
469 |
Support for Canada's Academic Research Community |
450 |
Support for Workers in the Nfld. Labrador Offshore Energy Sector |
320 |
Of Which |
|
10% Temporary Wage Subsidy |
2,505 |
Enhanced GST Credit |
5,4254 |
Enhanced Canada Child Benefit |
1,9764 |
| Other Direct Support Measures in Budget 2021 | 1,829 |
Of Which: Support for Sectors: |
|
Supporting Temporary Foreign Workers While They Quarantine |
58 |
Supporting Safe Air Travel |
104 |
Extending Temporary Support for Seasonal Workers Who Continue to be Affected by the Pandemic |
4 |
Revitalizing Tourism |
425 |
Supporting Canada's Arts, Heritage, and Cultural Workers and Institutions |
222 |
Helping Canadian TV and Film Productions Through COVID-19 |
100 |
Support for the Canadian Broadcasting Corporation / Radio-Canada |
21 |
Support for the Canadian Book Industry |
23 |
Enhancing Digital Access to our Heritage |
5 |
Support for National Museums and the National Battlefields Commission |
73 |
Supporting Indigenous Economies (Renewal of Indigenous Community Business Fund) |
117 |
Supporting Indigenous Economies (First Nations Finance Authority) |
33 |
Other: |
|
Regional Relief and Recovery Fund Top-Up |
80 |
Parks Canada Anticipated Revenue Losses |
72 |
Improving Food Security |
140 |
Granville Island Emergency Relief Fund Extension |
22 |
Supporting Indigenous Post-Secondary Education during COVID-19 |
102 |
Maintaining Federal Court Services During COVID-19 |
5 |
Preventing the Spread of COVID-19 in Correctional Institutions |
155 |
Addressing Financial Impacts on Atomic Energy of Canada Limited |
39 |
Public Services and Procurement Canada Program Integrity |
30 |
| Total – Direct Support Measures | 289,477 |
| Sub-Total – Protecting Health and Safety, Direct Support Measures | 349,756 |
| As % of 2020 GDP | 15.9% |
| Tax Liquidity Support | Impact1 ($M) |
| CRA/CBSA liquidity support to businesses and individuals | |
Income Tax Payment Deferral until September 30, 2020 |
55,000 |
Sales Tax Remittance and Customs Duty Payments Deferral until June 30, 2020 |
30,000 |
| Supporting Jobs and Safe Operations of Junior Mining Companies | 50 |
| Sub-Total – Tax Liquidity Support | 85,050 |
| Other Liquidity Support and Capital Relief | Impact1 ($M) |
| Business Credit Availability Program and Other Credit Liquidity Support | 81,889 |
Of Which: |
|
Canada Emergency Business Account (not including incentive) |
36,689 |
Business Credit Availability Program |
|
Small- and Medium-sized Enterprise Loan and Guarantee Program |
40,0005 |
Mid-Market Guarantee and Financing Program |
TBD6 |
Highly Affected Sectors Credit Availability Program |
TBD6 |
Large Employer Emergency Financing Facility |
TBD6 |
Support for the Agriculture and Agri-Food Sector |
5,200 |
| Total – COVID-19 Economic Response Plan (Protecting Health and Safety, Direct Support Measures, Tax and Other Liquidity Support) | 516,695 |
| Other Liquidity Support | |
| Credit and Liquidity Support through the Bank of Canada, CMHC and Commercial Lenders7 | 300,000 |
| Capital Relief | |
| Capital Relief (OSFI Domestic Stability Buffer)8 | 300,000 |
|
Note: Numbers may not add due to rounding.
* Updated to include the estimated cost of extensions to COVID-19 benefits and business supports announced on July 30, 2021. |
|
Support for P/Ts
Issue
Since the onset of the pandemic, the Government of Canada has led a coordinated federal-provincial-territorial (FPT) response to fight COVID-19 and has provided unprecedented levels of support to provinces and territories (PTs).
Talking points
- Federal support provided directly to provinces and territories’ throughout the pandemic includes:
- $13 billion in direct support for provinces and territories provided through the nearly $20 billion Safe Restart Agreement;
- $4.5 billion in one-time payments through the Canada Health Transfer to support immediate health system needs;
- $1 billion to support the rollout of provincial and territorial immunization campaigns;
- $2.9 billion to help boost wages for essential workers across the country when we relied on them most;
- $2 billion to support a safe return to school for children and staff; and
- Up to $3.3 billion to support resilient communities through the COVID-19 Resilience Funding Stream;
- Other federal investments have directly supported provincial and territorial pandemic management, including:
- More than $9 billion to support vaccine purchases and access to vaccines through international collaboration; and
- $2 billion to support the purchase of personal protective equipment for health care and essential workers.
- The Government has also nearly tripled the cap on payments under the Fiscal Stabilization program. The higher cap will ensure provinces have additional resources to manage economic fluctuations in extraordinary times.
- The Government is committed to continuing to support provinces and territories throughout the pandemic and on the priorities that matter to Canadians. This includes:
- Developing a proof of vaccination credentials approach that will ensure fully vaccinated Canadians can move freely within Canada and that will support international travel. The government is also committed to supporting provincial and territorial proof of vaccination programs;
- Providing up to $30 billion, and combined with previous investments announced since 2015, $9.2 billion every year – to build a high-quality, affordable, flexible and inclusive early learning and childcare system in partnership with provincial, territorial and Indigenous partners; and
- Providing up to $1 billion to establish a Safe Long-term Care Fund with another up to $3 billion to ensure standards of care are applied and permanent changes are made.
Background (if required)
Safe Restart Agreement: Nearly $20 billion to help provinces and territories safely restart their economies and prepare for future waves of COVID-19. The Agreement included $13 billion in direct transfers to provinces and territories and addressed seven key priorities:
- Testing, contact tracing, and data management
- Health care capacity, including mental health and substance use
- Protecting vulnerable populations, including seniors
- Securing personal protective equipment
- Child care for people returning to work
- Support for municipalities, including for public transit
- Sick leave
Safe Return to Class Fund (and Safe Indoor Air Top-Up): The original Safe Return to Class Fund provided provinces and territories $2 billion in support towards the costs of adapting the education sector to ensure a safe return to class for students and staff throughout the 2020-21 school year. Through the platform, the government has also committed to provide a $100 million top-up to the fund, targeted towards supporting safe indoor air in schools.
Essential Workers Support Fund: The COVID-19 Essential Workers Support Fund was a federal transfer to provinces and territories to cost-share a temporary top-up to the salaries of workers deemed essential in the fight against COVID-19. All PTs received funding, totalling $2,884,208,769 in federal support.
Early Learning and Child Care: The Government has reached individual agreements with AB, BC, MB, NL, NS, PE, SK and the YK. Negotiations are ongoing with the remaining provinces and territories.
Long-term Care: Safe Long-term Care Fund agreements – being used as launching points for negotiations- have been reached with NL, PEI, NT, YK, and BC to date. Negotiations with other jurisdictions remain ongoing.
Public health / vaccine procurement: Canada has secured among the most diverse portfolio of vaccines in the world, with the Government of Canada covering the full cost of procured vaccines thus far, ensuring that they are free of charge to every Canadian.
Stabilization program reforms: The Government nearly tripled the cap on payments from $60 per capita to about $170 per capita in 2020-21, and indexed the cap to grow in line with economic growth per person in future years. Furthermore, the Minister of Finance has the discretion to grant interest-free loans to provinces for eligible revenue declines above the cap.
Anticipated areas of questioning
- Why was the Premiers’ proposal for the Fiscal Stabilization Program not adopted?
- The higher cap will ensure provinces have additional resources to manage economic fluctuations in extraordinary times.
- Furthermore, the Minister of Finance has the discretion to grant interest-free loans to provinces for eligible revenue declines above the cap.
- How much funding has been provided to buy vaccines for Canadians? Please breakdown the funding provided for vaccine purchases.
- As noted in Budget 2021, over $9 billion has been provided to secure COVID-19 vaccines for Canadians.
- The government has entered into a series of contracts with vaccine manufacturers, including Pfizer, Moderna and others. Details on the existing COVID-19 vaccine agreements are available on the government’s website.
Worker Benefits
Issue
On October 21, 2021, the government announced it would establish the Canada Worker Lockdown Benefit and extend the recovery sickness and caregiving benefits until May 7, 2022.
Talking points
- The government is transitioning from the very broad-based support that was appropriate at the height of the lockdowns, to more targeted measures that can provide help where it is needed.
- Despite making significant progress on Canada’s fight against COVID-19, the government recognizes that restrictions may still be required over the coming months to limit spread of the virus.
- The Canada Worker Lockdown Benefit will ensure that those whose employment is directly interrupted by a future public-health lockdown have the support they need – in case the pandemic requires further lockdowns to curtail the spread of COVID-19.
- The extension of the Canada Recovery Sickness Benefit and the Canada Recovery Caregiving Benefit – and additional 2 weeks proposed – will also continue to help Canadians who protect themselves and others by staying home when they are sick or helping a loved one.
If pressed:
- The Government will continue to monitor the public health situation and will ensure that workers continue to have the support they need and that no one is left behind.
Anticipated areas of questioning
- What is the government doing for individuals who are no longer eligible for the Canada Recovery Benefit?
- Over the last year, the Canada Recovery Benefits provided income support to millions of individuals directly affected by COVID-19.
- With the economy having recovered 100% of the jobs lost due to the COVID recession, the Government is adapting its income support.
- The Canada Worker Lockdown Benefit will support workers directly affected by lockdown situations, while the extension of the sickness and caregiving benefits will continue to provide support to those who are sick or must care for a relative.
- In addition, the extension of the Canada Recovery Hiring Program and the additional supports to firms in hard hit sectors, will help businesses continue to hire back workers and to create the additional jobs Canada needs for a full recovery.
- What is the expected cost of the Canada Worker Lockdown Benefit.
- This benefit would be triggered by lockdowns in a given region. As a result, the cost will vary based on the presence, scope and duration of lockdowns moving forward, should there be any at all.
- The Government will monitor the public health situation going forward, and provide cost projections accordingly as part of regular reporting.
- When will Canadians be able to apply for the new Canada Worker Lockdown Benefit?
- Only once legislation receives Royal Assent can the benefit be launched and Canadians be able to apply for the new benefit. The Governor-in-Council would then be empowered to designate the regions where these lockdowns occur. Should there be applicable lockdown situations before its launch, Canadians will be able to apply retroactively.
Debt and Deficit Levels
Issue
As a result of the COVID-19 pandemic and the government’s emergency response plan, the deficit is expected to rise to $354.2 billion in 2020-21, or 16.1 per cent of GDP. The federal debt-to-GDP ratio is expected to reach 51.2 per cent of GDP in 2021-22.
Talking points
- Canada entered this crisis in a strong fiscal position, allowing the government to take decisive action to put in place the support necessary for people and businesses to weather the storm and support a robust and inclusive recovery of the Canadian economy.
- However, those actions, combined with lower revenues due to the recession, have increased public debt sharply.
- The government is committed to unwinding COVID-related deficits and reducing the federal debt as a share of the economy over the medium-term.
- This fiscal anchor will continue to protect Canada’s low debt advantage so that borrowing costs remain low, and future generations are not burdened with COVID-19-related debt.
- In the current low-interest rate environment, the government is making investments that will drive future growth and prosperity. These actions can help to improve fiscal sustainability by raising GDP growth more than the costs in terms of increased debt service over the longer term.
- Finally, Canada’s history of prudent fiscal management means that, despite the unprecedented actions we took to fight the virus, we continue to have:
- The lowest net debt-to-GDP ratio in the G7; and,
- Excellent credit ratings from the four major credit rating agencies: Moody’s (Aaa), S&P (AAA), DBRS (AAA), and Fitch (AA+)
Anticipated areas of questioning
- Does the government ever intend to balance the budget?
- The government is committed to unwinding COVID-related deficits and reducing the federal debt as a share of the economy over the medium-term.
- This fiscal anchor will continue to protect Canada’s low debt advantage so that borrowing costs remain low, and future generations are not burdened with COVID-19-related debt.
- How is the government managing the large increase in debt?
- The government has and will continue to manage its finances prudently, retaining its low-debt advantage among G7 peers. The government’s strategy will be implemented responsibly, with a sustainable approach for future generations.
- The government will continue to maximize the financing of COVID-19-related debt through long-term issuance.
- Before the pandemic, 15 per cent of the bonds issued by the government were issued at maturities of 10 years or greater. In 2020, federal government allocations of long bonds rose to almost 30 per cent. The government is now proposing to increase that proportion to over 40 per cent.
- This will protect Canada from rollover risks and provide more predictability in the cost of servicing debt.
- Does the government’s debt program have sufficient capacity to handle the current planned spending and the possibility of another wave?
- Canada entered the pandemic in a position of fiscal strength and the demand for Government of Canada securities remains strong.
- The government will continue to maximize the financing of COVID-19-related debt through long-term issuance for the benefit of future generations, a fiscally prudent approach that provides security by lowering debt rollover.
Debt Management
Issue
The fundamental objectives of debt management are to raise stable and low-cost funding to meet the financial requirements of the Government of Canada and to maintain a well-functioning market for its securities. For 2021-22, the government will seek to maximize the financing of COVID-19-related debt through long-term issuance.
Talking points
- Canada entered the pandemic in a position of fiscal strength, allowing it to support to Canadians and Canadian businesses through the COVID-19 pandemic.
- The government has and will continue to prudently manage its finances, while retaining its low-debt advantage among its G7 peers.
- Demand for Canada’s securities remains strong.
- Maximizing the financing of COVID-19-related debt through long-term issuance will benefit future generations.
- Canada continues to hold a AAA rating, with a stable outlook, from most credit rating agencies.
If pressed on rising interest rates:
- While interest rates have recently risen, they still remain near historically low levels and the Debt Management Strategy has been crafted to be robust to different interest rate scenarios.
If pressed on Fitch downgrade:
- Canada remains among the top rated countries in the G7, despite Fitch’s downgrade of Canada last year.
Anticipated areas of questioning
- Does the government’s debt program have sufficient capacity to handle the current planned spending and the possibility of another wave?
- Canada entered the pandemic in a position of fiscal strength and the demand for Government of Canada securities remains strong.
- The government will continue to maximize the financing of COVID-19-related debt through long-term issuance for the benefit of future generations, a fiscally prudent approach that provides security by lowering debt rollover.
- How is the Government going to manage rising interest rates?
- Since the beginning of the COVID-19 pandemic, the Government has taken a prudent approach to finance the deficit by significantly increasing its issuance of long-term bonds to unprecedented levels.
- The Debt Management Strategy accounts for the projected increases in interest rate by the private sector and is robust to a wide range of potential interest rate scenarios.
- Despite record borrowings, public debt charges as a per cent of GDP are expected to stay near their lowest level in over a century over the forecast horizon.
- With the forecasted increase to interest rates in Budget 2021, public debt charges are projected to only rise to 1.4 per cent of GDP by 2025-26 to a level of $39.3 billion, substantially lower than the average cost of financing debt over the last two decades.
Supporting Low- and Middle-Income Individuals and Families
Issue
Since taking office in 2015, the Government has taken several actions to support low- and middle-income Canadians through the tax and benefit system.
Talking points
- Supporting the middle class and those working hard to join it has been a key priority of our Government.
- We have reduced taxes for middle class Canadians while raising them on the wealthiest 1%.
- We increased support for families and low-income workers through programs such as the Canada Child Benefit and the Canada Workers Benefit, which have helped lift over 1 million Canadians out of poverty since 2015, including 435,000 children.
- We increased the Guaranteed Income Supplement top‑up benefit for low‑income single seniors, enhanced the GIS earnings exemption, and we are increasing Old Age Security for Canadians aged 75 and older in July 2022.
- We will continue to examine ways to improve the tax and benefit system to ensure it is well targeted and fair.
Supporting Small Businesses During the Pandemic
Issue
The government has taken several actions, through the tax system, to support small businesses and protect jobs during the pandemic.
Talking points
- In the face of the pandemic, the government acted swiftly to support businesses, including small businesses, and protect jobs, adapting as the pandemic evolved.
- We implemented a broad suite of measures for businesses, including the Canada Emergency Wage Subsidy, Canada Emergency Rent Subsidy and Lockdown Support, and the Canada Recovery Hiring Program.
- The Canada Emergency Wage Subsidy has helped more than 5.3 million Canadians keep their jobs, with over $97 billion in support paid out to help employers re-hire workers and avoid layoffs.
- The Canada Emergency Rent Subsidy and Lockdown Support have helped more than 215,000 organizations with over $7 billion in support for rent, mortgage, and other expenses.
- The government is now moving away from broad-based support that was appropriate at the height of lockdows, to a more targeted approach. We introduced legislation to provide continued support through wage and rent subsidies to tourism, hospitality and other hard-hit organizations that have been deeply affected by the pandemic, until May 7, 2022.
Fighting Tax Evasion and Avoidance
Issue
Since taking office in 2015, the Government has taken several actions to combat tax evasion and avoidance.
Talking points
- Our Government is committed to a fair tax system where everyone pays their fair share.
- To that end, we have made significant investments to strengthen the Canada Revenue Agency’s ability to crack down on tax evasion and combat tax avoidance.
- In each of our budgets, we have taken legislative actions to close tax loopholes.
- Canada continues to work with its international partners to address corporations and wealthy individuals inappropriately shifting profits offshore and using other schemes.
- Canada is one of 137 countries that recently entered into a historic agreement on a global minimum tax regime that would ensure that income earned by the foreign subsidiaries of large multinational corporations is subject to tax at a rate of at least 15%.
- This new minimum tax regime is aimed at reducing the incentives for such corporations to shift income into offshore companies located in low-tax jurisdictions.
- The Government will continue to crack down on international tax evasion and aggressive tax avoidance, through all available avenues.
Housing
Issue
Housing affordability remains a growing concern for many Canadians as housing prices are rapidly increasing across the country. This issue is most acute in Toronto and Vancouver and their surrounding regions.
Talking points
- With rent increasing and housing prices continuing to rise, we recognize that housing affordability is a growing concern for many Canadians.
- Addressing housing affordability for all Canadians is an important, complex issue that will require a comprehensive policy approach. More information on our plan and next steps will be released in due course.
- Considering shared jurisdiction, we understand that this plan will need a coordinated approach with other levels of government.
If pressed on actions to date:
- In 2017, the government launched the National Housing Strategy, an ambitious 10-year plan that will invest over $72 billion to address the housing challenge.
- As of March 2021, over $19.6 billion in funding commitments have been made under the National Housing Strategy, supporting the creation of 75,600 new housing units and the repair of 189,400 existing housing units.
Background
In 2017, the government commited over $72 billion to the National Housing Strategy (NHS), a 10-year plan to address homelessness and improve the affordability, quality, and availability of housing.
The NHS currently targets:
- Building 160,000 new homes
- Renovating and modernizing 300,000 homes
- Removing 530,000 families from housing need
- Cutting chronic homelessness by 50% (note: the government has since committed to eliminating chronic homelessness)
In May 2021, Minister Hussen tabled the first triennial report to Parliament on NHS implementation to date, indicating NHS is largely progressing as planned and the overall expected results for most initiatives slightly exceed their original targets.
In addition, the Governments of Canada and British Columbia partnered to launch the Canada-B.C. Expert Panel on the Future of Housing Supply and Affordability, tasked with identifying and evaluating federal and provincial measures to increase the supply of housing and improve affordability. The Panel published its Final Report in June 2021, and our Government is actively reviewing its recommendations.
Trade Irritants with the U.S.
Issue
Recent or planned U.S. measures (e.g., tax credits favouring U.S.-made electric vehicles, increased softwood lumber duties) threaten integrated supply chains and the free and open Canada-U.S. trading relationship that is underpinned by the CUSMA.
Talking points
- U.S. protectionist policies run counter to CUSMA obligations and are inconsistent with shared objectives on supply chain collaboration.
- The Government is very concerned with the protectionist elements of the proposed U.S. tax credits for electric vehicles.
- Canada continues to work diligently towards an outcome that does not discriminate against Canadian-made vehicles and batteries.
- Canada is also disappointed by the increased duties on softwood lumber as well as the proposed expansion of Buy America provisions.
- We are engaging at all levels with U.S. officials and stakeholders to highlight the negative impact that U.S. protectionist measures can have, not just on the industry in Canada, but for jobs and consumers on both sides of the border.
- The Government of Canada will always defend the interests of Canadians against U.S. measures that harm Canadian businesses and workers.
Background
The U.S. has recently considered or implemented several measures that threaten the Canada-U.S. trading relationship, including:
- Proposals before Congress for tax credits for electric vehicles that would discriminate against Canadian-produced electric vehicles and batteries.
- A recent Department of Commerce finding resulted in the doubling of trade remedy duties being applied to most Canadian exports of softwood lumber.
- The infrastructure bill recently signed by President Biden included an expansion of Buy America provisions that would restrict access to the U.S. procurement market for Canadian suppliers.
The Prime Minister, Deputy Prime Minister, Canada’s Ambassador to the U.S., Minister Ng, and other Ministers have engaged with the U.S. administration, congressional leaders, and other U.S. interlocutors to express Canada’s concerns and work towards a favourable resolution of these issues for Canada.
Other Issues
Equalization (AB referendum, floor payments)
Issue
On October 18, 2021, 62% of Albertans voted “yes” to a referendum about removing section 36(2) on the principle of Equalization from the Constitution. On November 18, 2021, the Legislative Assembly of Alberta passed a motion to amend the Constitution as outlined in the referendum.
Talking points
- The Government of Canada believes in a strong role for Alberta in the federation, and values Albertans’ contributions to our national debates, including on constitutional issues.
- The principle of Equalization is enshrined in Canada’s Constitution and who we are as a country.
- Equalization helps ensure that all provinces can give their residents a fair chance at success.
- It enables provinces to deliver education, world-class health care and other essential services that Canadians rely on. Every province has benefitted from the program at some point.
- The Equalization formula is reviewed every 5 years to ensure that the program continues to serve its purpose. The next renewal must take place by 2024. Our government is open to discussing the program with the Government of Alberta, as well as all provincial governments, to ensure that Equalization continues to be there for Canadians.
If pressed:
- Amending the Consititution would require resolutions of the Senate, the House of Commons and the legislatures of at least seven provinces representing at least 50 per cent of the population of all the provinces.
Background (if required)
Premier Kenney has been using the referendum as leverage to fight for a “fair deal” for Alberta and it has been framed in the context of Alberta citizens’ large net fiscal contribution to the federation and perceived lack of support on pipelines and resource development.
Following the referendum, Premier Kenney has stated that it is unlikely that the Constitution will actually be amended, given the requirements of the amending formula, but that he expects this vote to pressure the federal government to act on a range of issues that concern Alberta, including Bills C-48 (Oil Tanker Moratorium Act), C-69 (Impact Assessment Act) and the cancellation of several pipelines.
Alberta has contrasted the generosity of Equalization, which grows in line with the economy despite declining disparities among provinces, to the low level of support it received through the Fiscal Stabilization program. Alberta argues that the recent changes to Fiscal Stabilization were inadequate and that Alberta should receive an additional $2.4 billion in retroactive payments.
Equalization entitlements for 2022-23 have not yet been announced but must be shared with provinces before December 31, 2021. Think tanks such as the Fraser Institute and academics such as Trevor Tombe have been critical that the Equalization payout continues to increase while disparities amongst provinces are falling. Trevor Tombe has projected floors of $2.5 billion in 2022-23.
Anticipated areas of questioning
- Will the Government provide more support to Alberta through the Fiscal Stabilization Program?
- The government has nearly tripled the cap on Fiscal Stabilization from $60 per capita to about $170 per capita in 2020-21, and the cap is indexed to grow with economic growth per person in future years.
- In addition, the Minister of Finance has the discretion to grant interest-free loans to provinces for eligible revenue declines above the cap.
- Provinces must submit claims in order to receive Fiscal Stabilization payments. No applications have yet been made for 2020-21.
- Since the onset of the pandemic, the Government of Canada has undertaken a coordinated federal-provincial-territorial response to fight COVID-19 and has provided unprecedented levels of support to provinces and territories including through the nearly $20 billion Safe Restart Agreement. Alberta received $2.55 billion through various measures of Canada’s COVID-19 Economic Response Plan. The Government also provided $1 billion to the Government of Alberta and a $200 million loan to the Alberta Orphan Well Association, to clean up orphan and inactive oil and gas wells. This helped maintain approximately 5,200 jobs in Alberta alone.
- Why is Equalization growing while the disparities it is meant to address are declining?
- Since 2009-10, the total Equalization payout has been set in legislation to grow in line with a three-year moving average of national nominal GDP growth to provide stable and predictable funding for the program.
- The Government will continue to consult with all provinces on Equalization in the lead-up to the next renewal of the program, which must take place before March 31, 2024.
Provincial/territorial request to increase the Canada Health Transfer
Issue
Since September 2020, provincial and territorial premiers have been calling for an immediate and significant increase to the Canada Health Transfer (i.e., $28 billion growing at a minimum of 5 per cent).
Talking points
- This year the Government is providing over $43 billion through the Canada Health Transfer, the largest federal transfer program to provinces and territories.
- The Government has been there from the beginning of the pandemic to ensure that health care systems receive the additional funding they need to manage COVID-19.
- The Government is providing more than 8 out of every 10 dollars spent during the pandemic. This includes $4.5 billion in one-time top-ups to the Canada Health Transfer to address immediate health system pressures.
If pressed:
- Once we are out of the pandemic, the Government will be there to discuss long-term health care funding with provinces and territories to ensure that Canadians continue to receive the care that they deserve.
Background
- The Canada Health Transfer (CHT) is the largest major transfer to provinces and territories. It provides long-term predictable funding for health care and supports the principles of the Canada Health Act.
- Since 2017-18, the CHT has been legislated to grow in line with a three-year moving average of nominal Gross Domestic Product (GDP) growth, with total funding guaranteed to increase by at least 3.0 per cent annually. CHT payments are made on an equal per capita basis.
- Provinces and territories are not required to report to the Government on how CHT funds are disbursed.
- In the decade prior to the pandemic (2010-11 to 2019-20), CHT growth exceeded that of provincial and territorial health expenditures (CHT grew on average by 5.1 per cent annually, compared to PT health expenditure growth of 3.8 per cent).
Anticipated areas of questioning
- What is the federal government doing to help provinces and territories and ensure that Canadians get the healthcare that they deserve?
- Our Government has been there from the beginning of the pandemic to ensure that health care systems receive the additional funding they need to manage COVID-19. This includes:
- $13.8 billion of the nearly $20 billion Safe Restart Agreement went to support health care, including testing capacity and procurement of personal protective equipment;
- $9 billion to support vaccine procurement;
- $4.5 billion in one-time top-ups to the CHT to address immediate health system pressures; and
- $1 billion to support provincial and territorial immunization plans and rollout.
- Our Government is also providing significant funding for health care outside of the CHT. This includes through a number of bilateral agreements with provinces and territories, such as $11 billion over ten years to support better home care and mental health initiatives (started in 2017-18).
CPP contribution rate increase
Issue
The maximum Canada Pension Plan (CPP) contributions are set to increase by 10.6% in 2022 due to both the CPP Enhancement and the increase in the Yearly Maximum Pensionable Earnings (YMPE). This primarily affects contributors who will have earnings above $64,900 in 2022 (about a third of all contributors).
Talking points
- The federal government remains committed to ensuring that every Canadian has a secure and dignified retirement.
- As the Canada Pension Plan (CPP) is self-financed by employer and employee contributions, freezing the contribution increases would mean reducing future benefits for Canadians who are currently working.
- The CPP enhancement represents a major step in improving retirement outcomes for workers and reducing the uncertainty that many Canadians feel about being able to save for retirement.
- It addresses important challenges faced by young Canadians saving for retirement, such as declining workplace pension plans and prolonged periods of low interest rates, and it is important that we stay the course at this critical time.
- Any changes to the CPP, including changes to the Yearly Maximum Pensionable Earnings (YMPE) or contribution rates, would need the formal approval of the Parliament of Canada and seven out of ten provinces representing at least two-thirds of the population.
Background
- The maximum employer and employee contributions to the CPP for 2022 will be $3,500 each and the maximum self-employed contributions will be $7,000. The maximums in 2021 were $3,166 and $6,333 respectively.
- The maximum contribution increases for 2022 ($334 for employer/employee and $667 for the self-employed) are a combination of increases to the Yearly Maximum Pensionable Earnings (YMPE) and legislated increases to contribution rates from the CPP enhancement.
- The CPP enhancement is raising the maximum CPP retirement pension by 50 per cent over time. To fund these enhanced benefits, annual CPP contributions are being increased modestly over seven years, starting in 2019. The CPP enhancement increases the employer and employee contribution rates to 5.70 per cent in 2022 (up from 5.45 per cent in 2021) and the self-employed contribution rate to 11.4 per cent (up from 10.9 per cent).
- This represents a maximum annual increase in 2022 of $150 for an employer or an employee and $300 for the self-employed (i.e., for those earning at or above the upper earnings limit); the increase would be lower for workers below the upper earnings limit (about two-thirds of all contributors).
- The YMPE for a calendar year is the limit to which employed and self-employed earnings are subject to contributions. It increases each year by the percentage increase, as of June 30 of the preceding year, in the 12-month average of weekly earnings of the Industrial Aggregate (as published by Statistics Canada).
Anticipated areas of questioning
- Why wouldn’t the Government freeze the increase in CPP contribution rates during a pandemic, like it did for EI?
- The CPP enhancement is raising the maximum CPP retirement pension by 50 per cent over time. Young Canadians just entering the workforce will see the largest increase in benefits.
- Freezing these contribution rate increases would mean reducing future benefits for working Canadians, in particular younger workers. In addition, any such change would need provincial approval given the shared federal-provincial responsibility for the CPP.
- Why is the upper earnings limit for the CPP (i.e., the YMPE) increasing so fast?
- The growth in the YMPE in 2021 and 2022 was around 5%, much higher than the usual growth rate between 1% and 2%. This is a function of the impact the pandemic has had on employment, which has impacted lower-income workers more than other groups. As a result, with fewer lower income workers in the calculation of average weekly earnings, the YMPE has increased faster than normal.
- Of note, the increase in the YMPE does not affect workers earning under the YMPE (around two-thirds of all contributors). Moreover, the job market for low-income workers began to rebound in the summer of 2021, after the June 30 cutoff for the 2022 YMPE calculation.
Border Carbon Adjustments (BCA)
Issue
The Government is exploring and consulting on the possibility of implementing border carbon adjustments to address carbon leakage risks.
Talking points
- The Department of Finance is currently exploring border carbon adjustment as a potential tool to address carbon leakage risks, and is engaging with Canada’s key international partners, as noted in the Fall economic Statement in November 2020.
- In Budget 2021, the Government also announced consultations with stakeholders and continued engagement with international partners.
- Finance Canada is working in close collaboration with Environment and Climate Change Canada and Global Affairs Canada on this issue.
If pressed:
- While consultations were suspended for the election period, these are expected to resume in the near future.
- There are no timelines for the completion of this work at this time.
Background
The Government first notified its exploration of border carbon adjustments (BCAs) as a potential tool to address carbon leakage risks in the Fall Economic Statement (FES) in November 2020. In Budget 2021, the Government also announced consultations in two phases with selected stakeholders in the summer and the public in the fall. Both the FES and Budget 2021 noted engagement with international trading partners, with specific mention of the U.S. and the European Union.
Consultations were launched in August 2021, with a paper outlining key considerations. However, the consultations were suspended for the election period.
While no country currently has BCAs in place, the EU is considering a legislative proposal for such as mechanism. In addition, international organizations are increasingly turning their attention to issues around BCAs and carbon leakage (e.g., the OECD and the IMF have published either assessments or proposals on these topics).
Anticipated areas of questioning
- When will the Government decide on whether it will move ahead with border carbon adjustments?
- Analysis remains ongoing and there are no timeline for a decision at this time.
- Would border carbon adjustments apply to all imports?
- There are no decisions, including on design details, at this point. Ongoing analysis is focused on areas where there are greater risks of carbon leakage, which includes a narrower set of industries in the emission-intensive and trade exposed sectors.
- Will Canada apply border carbon adjustment measures to the imports from all countries? Would imports from the U.S. or EU be excluded?
- There are no decisions, including on design details, at this point. However, the Government has been clear that we are looking at coordinating our efforts with like-minded partners.
Trans Mountain
Trans Mountain Expansion Project
Issue
Status of the Trans Mountain Expansion Project (TMEP).
Talking points
- In the nine months ended September 30, 2021, TMC generated $349 million in revenue and $164 million in earnings before interest, taxes, and depreciation (“EBITDA”).
- As with all major capital projects, TMC is making investments and incurring expenses in the short term in order to receive higher profits in the future. TMC’s level of profitability has not changed since the government became the owner.
- TMC will recuperate Trans Mountain Expansion Project costs once it is in-service and generating revenue.
- The Government of Canada does not intend to be the long-term owner of the Trans Mountain Corporation, and intends to launch a divestment process after the TMEP is further de-risked.
- As of the end of November, the project was around 50 per cent complete, with construction around 40 per cent complete.
- The project is expected to generate $73 billion in increased revenues for producers over 20 years once in service. Government revenues are expected to increase by $46 billion over the course of the project's construction and the first 20 years of operation.
Background (if required)
- CDEV is the parent company of Canada TMP Finance Ltd. (TMP Finance), which is the financing and parent company for TMC. To maintain commercial discipline in the project, the Government charges TMP Finance commercial interest rates through the Export Development Canada (EDC) Canada Account.
- TMP Finance provides these funds to TMC on a 55 per cent debt, 45 per cent equity basis. TMC generates income only on its operating assets and pays interest to TMP Finance only for its debt (55 per cent of its capital). As a result, TMP Finance itself has to cover the interest cost owing to EDC arising from the equity portion, which it borrows from its construction credit facility through EDC.
- Canada Account transactions are funded from the Consolidated Revenue Fund (CRF) at the Government of Canada’s borrowing cost. The Government, via the lender EDC, receives the spread between TMP Finance’s interest rate of 4.7 per cent and its own borrowing cost.
- While TMP Finance faces a financial draw from its financing and ownership of TMC during construction of the Trans Mountain Expansion Project, the Government will recuperate these amounts once the Project is in service and generating revenue. Once in service, TMC is expecting to generate $1.5 billion per year in EBITDA and will begin repaying its construction-related debt, including any interest it incurred carrying the equity portion of TMC.
Anticipated areas of questioning
- What impacts are the recent floods in British Columbia having on Trans Mountain?
- TMC temporarily shut-down operations of the existing pipeline after the flooding event. TMC restarted operations on December 5, 2021 at reduced capacity.
- TMC expects to deliver more than 75 per cent of normal volumes to customers over the month of December. This will increase over the coming weeks as TMC advances additional emergency work to bring the system to full capacity.
- Trans Mountain is responding the impact of the flood on the pipeline. Its response includes more than 400 people, seven helicopters and some 100 pieces of heavy equipment focused on getting the pipeline restarted.
- Work on the Trans Mountain Expansion Project continues along unaffected parts of the pipeline corridor and at Terminals.
- What is the status of construction on the Trans Mountain Expansion Project?
- As of the end of November, the project was around 50 per cent complete, with construction around 40 per cent complete.
- The amount spent on the project to date, approximately $10 billion, reflects a Trans Mountain decision from early in project execution to pre-acquire materials and equipment before those were needed in construction and to stockpile those materials. These materials and equipment are now being deployed in the construction process.
- How does the Trans Mountain Expansion Project relate to Canada’s pledge to cap oil and gas emissions as made at COP26 in Scotland?
- The Government has announced its intention to cap emissions on the oil and gas sector. The operation of the expanded Trans Mountain pipeline system will in no way affect those caps. Transporting traditional energy by pipeline is the lowest-emission way to move crude oil, lower than rail and road. The Government remains committed that it will not be a long-term owner of Trans Mountain Corporation.
- Moreover, the Government remains committed to use any proceeds from Trans Mountain to support the transition to a low carbon economy.
Funding for Indigenous Engagement on Economic Participation in Trans Mountain
Issue
Funding provided for Indigenous engagement on economic participation in Trans Mountain.
Talking points
- Since 2019, the Department of Finance has engaged with Indigenous groups who are potentially impacted by the Trans Mountain Expansion Project on the topic of Indigenous economic participation in Trans Mountain.
- The second step of the engagement process was held from June 2020 to July 2021. Due to COVID-19, this second step was extended into the 2021-22 fiscal year. Funding enabled the Department to continue to carry out and complete the planned engagement process.
- As part of the engagement process, to support Indigenous groups in their participation, the Department of Finance has provided participant funding, available to every Indigenous group invited to participate.
- The engagement process has been guided by core principles, including that potentially-impacted Indigenous communities could have an opportunity for meaningful economic participation in the Project, and that the participation of Indigenous communities could help their economic development, in keeping with the spirit of reconciliation.
If pressed:
- The engagement process has been with the 129 Indigenous groups identified as potentially impacted by the Trans Mountain Expansion Project on the 2019 Crown Consultation list.
- Participating Indigenous groups are eligible for between $50,000 and $70,000 in participant funding.
- As of October 30, 2021, the Department of Finance has signed Contribution Agreements with 44 participating Indigenous groups.
Background (if required)
- The first step of the engagement process took place from July to September, 2019. A “Step 1 What We Heard Report” was published online.
- The second step of the engagement process was held from June 2020 to July 2021.
- The engagement process has been run on four principles:
- That the potentially impacted Indigenous communities could have an opportunity for meaningful economic participation in the Project;
- That the participation of Indigenous communities could help their economic development in keeping with the spirit of reconciliation;
- That the Government invested in Trans Mountain (i.e., the corporation and its assets) to benefit all Canadians; and,
- That the Project would be built and operated on a commercial basis
- The second step of the engagement process focused on two objectives:
- Building consensus on the form of economic participation preferred by participating Indigenous groups (equity and/or revenue sharing), and
- Identifying or supporting the formation of one or more entities to represent participating Indigenous groups in negotiations with Canada.
- The second step of the engagement process, specifically, included bilateral meetings, information sessions, and multilateral discussions concerning potential Indigenous economic participation in Trans Mountain.
Supplementary Estimates B
2021-22 Supplementary Estimate (B)
Finance 2021-22 Supplementary Estimate (B)
Issue
These Supplementary Estimates (B) reflect a net increase of $157.8 million in planned budgetary expenditures and $2.7 billion in non-budgetary expenditures for the Department of Finance.
Talking points
- The total budgetary increase stems from a $14.7 million increase in Vote 1 program expenditures and a $143.1 million increase in statutory expenditures, which is a result of the Additional Fiscal Equalization Offset Payment of $130.1 million to Nova Scotia and the $13 million payment to the Canadian Commercial Corporation.
- The $130.1 million payment is to ensure that Nova Scotia is not penalized by the timing of a recalculation of past royalties attributable to an arbitration settlement that raised Nova Scotia’s offshore revenues for the purposes of Equalization in 2018-19 and thus affects Nova Scotia’s Equalization entitlements until 2022-23.
- The non-budgetary increase of $2.7 billion is a result of $2.4 billion in payments to the Canada Enterprise Emergency Funding Corporation to purchase shares to provide a source of funds for the Large Employer Emergency Financing Facility (LEEFF) and $361.7 million (US$287.71) for financial assistance to the International Development Association.
- As part of the 19th replenishment of the World Bank Group's International Development Association, the Government of Canada decided to provide a concessional loan of up to US$575.42 million in addition to Canada’s annual grant contribution. The loan is to be disbursed in two instalments of US$287.71 million in 2021-22 and in 2022-23.
If pressed:
- The Large Enterprise Emergency Financing Facility (LEEFF) provides bridge financing to large Canadian employers, whose needs through the pandemic are not being met through conventional financing, in order to keep operations going. LEEFF was set up as part of the government’s COVID-19 Economic Response. The Minister is able to purchase shares in the corporation under section 60.2(2)(a) of the Financial Administration Act. Share purchases fund the financing provided to LEEFF participants.
- The financial assistance to the International Development Association is to support a range of development activities in the world’s poorest countries, such as primary education, basic health services, clean water and sanitation, agriculture, business climate improvements, infrastructure, and institutional reforms. These interventions pave the way toward equality, economic growth, job creation, higher incomes, and better living conditions.
Background (if required)
Vote 1
- Funding of $9.7 million for Indigenous engagement on the Trans Mountain Expansion Project and for the Participant Funding Program to support the second step of the Department’s engagement process, which was extended into 2021-22 due to COVID-19.
- Funding for government advertising programs of $4.6 million to support the development of a multimedia advertising campaign in order to continue the planning and executing of the Government of Canada’s COVID-19 Economic Support and Recovery campaign.
- Funding of $0.4 million to develop insurance-based strategies for addressing broader natural disaster protection gaps, including for earthquakes, by leveraging Canada’s robust private insurance market and responding to evolving protection gaps and insurance issues as climate-related perils intensify over time.
Statutory
- The $13 million payment to the Canadian Commercial Corporation is to administer the Canada-US Defence Production Sharing Agreement for 2021-22 and help Canadian companies win US defence contracts.
- Budget 2021 legislation amended the Nova Scotia and Newfoundland and Labrador Additional Fiscal Equalization Offset Payments Act to authorize the Minister of Finance to make an additional fiscal equalization offset payment to Nova Scotia for the 2020-21 fiscal year and to extend that Minister’s authority to make additional fiscal equalization offset payments to Nova Scotia for any fiscal year between April 1, 2021 and March 31, 2023. This ensured that Nova Scotia was not penalized by the timing of a recalculation of past royalties attributable to an arbitration settlement that raised Nova Scotia’s offshore revenues for the purposes of Equalization in 2018-19 and thus affects Nova Scotia’s Equalization entitlements until 2022-23.
- As no amount was included in the 2021-22 Supplementary Estimates (A) (as Bill C-30 had not yet received Royal Assent), these Estimates include $130.1 million for both 2020-21 and 2021-22. The amounts included are as follows: $85,626,000, which was accrued by the federal government in 2020-21 but paid to Nova Scotia in 2021-22 (July 14, 2021); and $44,437,000, relating to 2021-22 and which will be paid in March 2022.
Non Budgetary
- The $2.4 billion payment to the Canada Enterprise Emergency Funding Corporation (CEEFC) to purchase shares is to provide a source of funds for the Large Employer Emergency Financing Facility (LEEFF). The CEEFC is a subsidiary of Canada Development Investment Corporation that was formed to administer the LEEFF as part of Canada’s COVID-19 Economic Response Plan.
Anticipated areas of questioning
- Why has the Government decided to provide a loan to the International Development Association in addition to its annual grant contribution instead of increasing its total grant contribution?
- The International Development Association welcomes the use of concessional loans as a means to supplement donor grant contributions.The Government of Canada decided to use this approach for the 19th replenishment of IDA because the conditions available for the provision of a loan ensured a more efficient use of Canada’s international assistance resources, while resulting in increased volume of development finance for the world’s poorest countries.
FINTRAC 2021-22 Supplementary Estimate (B)
Issue
The Financial Transactions and Reports Analysis Centre of Canada (FINTRAC) is seeking $2.0 M in 2021-22 Supplementary Estimates B for two items (includes $565K salary; $1.47M O&M).
Talking points
- FINTRAC is seeking $2M through two reprofiles of $1M each.
- One reprofile of $1.0M will support stabilization of critical IT infrastructure.
- One reprofile of $1.0M will support the implementation of legislative amendments announced in Budget 2021 to enable FINTRAC to: build its virtual currency expertise and supervision capacity; supervise armoured car companies; and develop and administer a cost recovery scheme for its compliance activities.
Background
- Funding for the critical IM/IT infrastructure system:
- FINTRAC is Canada’s financial intelligence unit and anti-money laundering and anti-terrorist financing regulator.
- The increasing demands on FINTRAC’s operations and programs are placing significant pressure on FINTRAC’s outdated IM/IT infrastructure and legacy systems,*Redacted*
- FINTRAC seeks a reprofile of $1M to support stabilization of information technology (IM/IT) infrastructure system.
- Funding for operational pressures:
- FINTRAC seeks a reprofile of $1M in operating funding to support legislative amendments announced in Budget 2021. This is a reprofile of lapsed operating funding from 2020-21.
- Legislative amendments announced in Budget 2021 include the implementation of a cost recovery scheme, adding armoured cars companies as a new reporting entitiesy sector regulated byof FINTRAC, and to enhance FINTRAC’s ability to regulate businesses that deal in virtual currency. Includes $565K in salary and $470K in O&M.
Anticipated areas of questioning
- Why were these funds not spent last fiscal year?
(1) Funding for the critical IM/IT infrastructure system:
- Unforeseen delays in implementation resulted in an O&M lapse, within the challenge of covid-19.
- The swift pivot to remote work and the configuration changes to enable on-site work required a substantial percentage of IM/IT resources. Other IM/IT projects were re-prioritized.
(2) Funding for operational pressures:
- Work on these initiatives started in 2021-22. Disruption caused by the COVID-19 pandemic led to delays in certain staffing and procurement processes.
- Why is this a priority for FINTRAC? What are the benefits?
(1) Funding for the critical IM/IT infrastructure system:
- Stabilizing the IM/IT infrastructure is critical to enable FINTRAC to *Redacted*
(2) Funding for operational pressures:
- FINTRAC requires capacity to implement the legislative changes announced in Budget 2021.
Canadian Commercial Corporation (CCC)
Issue
Budget 2021 announced $13 million in annual funding for the Canadian Commercial Corporation (CCC) to administer the Canada-US Defence Production Sharing Agreement.
Talking points
- The $13 million in annual funding announced in Budget 2021 will allow CCC to support Canadian businesses win more US defence contracts, grow their business, and support Canadian jobs.
- In recent years, CCC has helped over 80 businesses across Canada sell their products to the US Department of Defense each year, directly supporting more than 5,500 jobs in Canada and $1 billion in annual exports.
- This funding is part of the Government’s commitment to supporting Canadian exporters and maintaining a strong and constructive bilateral defence trade relationship with the United States.
If pressed:
- CCC does not charge fees for transactions with the US Department of Defense as part of an agreement with the US DoD, and so operates at a net loss. This funding allows CCC to operate on a sustainable financial footing and further support Canadian exports.
Background (if required)
- The Canadian Commercial Corporation is a Crown corporation that supports Canadian exporters by facilitating government-to-government contracting with foreign government buyers.
- CCC’s largest business line is for sales to the US Department of Defence (US DoD), under the Canada-US Defence Production Sharing Agreement (DPSA). The DPSA is a bilateral defence trade agreement with the United States that allows Canadian exporters to access the procurement market of the US DoD on an equal footing with American suppliers. In 2019-2020, CCC facilitated $928 million in sales to the US DoD under the DPSA.
- CCC does not charge service fees for DPSA transactions, per an agreement with the US Government. As such, CCC operates at a net loss. That loss used to be offset by an annual appropriation. However, a decision was taken in 2014 to gradually phase out the appropriation and to cross-subsidize DPSA transactions through market diversification strategies. These efforts have had limited success and have contributed to an erosion of CCC’s equity base, creating an unsustainable funding model.
- In Budget 2021, it was announced that $13 million in annual funding for CCC would be restored to support DPSA administration from 2021-2022. The funding will allow CCC to help Canadian companies win more US defence contracts, grow their business, and support Canadian jobs.
- This $13 million provided in the 2021-2022 Supplementary Estimates (B) is the first year of this funding being implemented.
Anticipated areas of questioning
- Why can’t CCC support these exports itself?
- CCC does not charge fees for transactions under the Defence Production Sharing Agreement (DPSA), per an agreement with the US Government. As such, CCC operates at a net loss.
- Efforts to cross-subsidize this business line through market-diversification strategies have had limited success, creating an unsustainable financial position for CCC.
- This funding will allow CCC to help Canadian companies win more US defence contracts, grow their business, and support Canadian jobs.
- How does this support for Canada’s defence sector align with the government’s commitment to promote international peace and security?
- The United States is Canada’s closest ally, and we stand shoulder to shoulder in our mutual support for a rules-based international order.
- This funding allows CCC to facilitate Canadian businesses’ access to the procurement market of the US Department of Defense on an equal footing with American suppliers, in sectors as diverse as health, infrastructure, ICT, and defence.
- In doing so, this funding supports Canadian exporters and Canada’s commitment to our defence relationship with the United States.
Federal Payments to Western Provinces for Enhanced Oil and Gas Well Clean-up
Issue
Payments to the Government of Alberta, the Alberta Orphan Well Association, Government of Saskatchewan and Government of British Columbia for enhanced orphan and inactive oil and gas well clean-up.
Talking points
- The Government of Canada provided funding to Western provinces to sustain jobs in the energy sector while cleaning up the environment.
- These payments were made as part of Canada’s COVID-19 Economic Response Plan and in response to the economic hardship faced by the regional economies that are dependent on the energy sector.
- It is estimated that these payments will sustain over 8,000 jobs and clean up approximately 40,000 oil and gas wells.
- Provinces are administering the clean-up programming, and have submitted annual reports communicating progress to date in each province.
If pressed:
- The payments have oversight from joint federal-provincial monitoring committees, which allow the provinces to provide regular updates to the federal government on the results achieved from the payments.
- As part of these measures, the Governments of Alberta and Saskatchewan have committed to strengthen their provincial regulatory regimes to limit the creation of new orphan wells.
Anticipated areas of questioning
- When were the payments made and under what authorities?
- The payment of $200 million to the Government of British Columbia was made on August 31, 2020. The payment of $400 million to the Government of Saskatchewan and payment of $200 million (repayable) to the Alberta Orphan Well Association were made on September 30, 2020. These payments were approved to be made under paragraph 60.2(2)(b) and subsection 60.2(6) of the FAA.
- The payment of $1 billion to the Government of Alberta was made on December 18, 2020. This payment was approved to be made through the Appropriation Act No. 5, 2020-21, which received Royal Assent on December 10, 2020.
Key Figures and Statistics
Finance Quick Facts
Economic Fact Sheet
Economic Snapshot
Population: 38.2 million (2021Q3)
Nominal GDP: $2.207 trillion (2020)
Share of Global Economy: 1.4% (2020)
Real GDP/Capita: $54,749 (2021Q3)
Monetary Policy Rate: 0.25% (October 2021)
Employment to Population Ratio: 61.4% (November 2021)
Unemployment Rate: 6.0% (November 2021)
Total Employment: 19.316 million (November 2021)
Job Recovery: 106% of COVID-19 job losses recovered, compared to 83% in the U.S (as of November 2021)
Household Debt-to-Income Ratio: 173.1% (2021Q2)
Sources: Statistics Canada, Bank of Canada, IMF October 2021 World Economic Outlook Database, Department of Finance.
Economic Indicators
| Real GDP growth (%) | 2020 | 2021 | 2022 | 2023 | 2024 | 2025 | 2020-2025 |
|---|---|---|---|---|---|---|---|
| Budget 2021 | -5.2 | 5.8 | 4.0 | 2.1 | 1.9 | 1.8 | 1.7 |
| Note: 2020 is actual. | |||||||
Canada saw a sharp 17% decline in real GDP between February and April 2020 – the largest and most sudden contraction since the Great Depression.
Canada’s real GDP remains 1.4% below pre-pandemic levels as of September 2021.
Real GDP in sub-industries such as air transportation, accommodation and food services, arts, entertainment and recreation services most impacted and still far below pre-pandemic levels (as of September).
Real gross domestic product (GDP) rebounded 41.7% in the third quarter of 2020, 9.3% in the fourth quarter and a further 5.5% in the first quarter of 2021, following the unprecedented 38.0% drop in the second quarter. Growth turned modestly negative (-1.1%) in the second quarter of 2021, amid global supply-chain disruptions and the third wave of the pandemic, but returned to robust growth of 5.4% in the third quarter, supported by economic reopening .
Labour Market Recovery
Canadian employment recovery has strongly outperformed US employment recovery, 106% vs. 83% of lost jobs regained as of November 2021.
While unemployment has exceeded Europe and the US, much of that is a result of statistical fuzziness. Using American measurement guidelines, the Canadian unemployment rate would have been 4.8% in November, much closer to the U.S. rate (4.2%).
Employment Statistics
Unemployment Rate: 6.0% (November 2021)
Labour Force Participation Rate: 65.3% (November 2021)
The number of unemployed Canadians fell by 121,800 in November (-8.9%) to 1.24 million. The unemployment rate was 6.0% in November, down 0.7 percentage points from October. As a result of the initial COVID-19 economic shutdown in 2020, the unemployment rate had more than doubled from 5.7% in February 2020 to a record high of 13.7% in May 2020.
The labour force participation rate remained at 65.3% in November, and is now 0.2 percentage points below its pre-COVID-19 level.
Employment rose by 153,700 in November, following a gain of 31,200 in October. As a result, employment has now surpassed its pre-COVID February 2020 level by 185,800 jobs. However, 155,000 workers continued to work less than half their usual hours in November.
As of November 2021, more than all of the 3 million jobs lost at the peak of the pandemic have now been recouped.
Current EI Premium Rate
$1.58 per $100 of insurable earnings (2020)
In 2020-21, EI premium revenues increased slightly to $22.4 billion, due to declining employment income because of the crisis, as well as a decrease in the EI premium rate from $1.62 in 2019 per $100 of insurable earnings to $1.58 in 2020.
The 2021 EI premium rate is also set at $1.58 per $100 of insurable earnings for employees and $2.21 for employers, who pay 1.4 times the employee rate, which is unchanged from the 2020 premium rate. The maximum insurable earnings (MIE) for 2021 is $56,300, up from $54,200 in 2020. With the current premium rate and MIE, an employee pays a maximum annual EI premium of $889.54 and an employer contributes up to $1244.23 to EI annually in 2021.
CPP Contribution Rate
The maximum pensionable earnings under the Canada Pension Plan (CPP) for 2022 will be $64,900 – up from $61,600 in 2021. The new ceiling was calculated according to the CPP legislated formula that takes into account the growth in average weekly wages and salaries in Canada.
Contributors who earn more than $64,900 for 2022 are not required or permitted to make additional contributions to the CPP.
The basic exemption amount for 2022 remains at $3,500. The employee and employer contribution rates for 2022 will be 5.70% (up from 5.45% in 2021) and the self-employed contribution rate will be 11.4% (up from 10.9% in 2021). The increase in contribution rates is due to the continued implementation of the CPP enhancement (i.e., year four of the seven-year phase-in).
The maximum employer and employee contribution to the plan for 2022 will be $3,500 each and the maximum self-employed contribution will be $7,000. The maximums in 2021 were $3,166 and $6,333 respectively.
Household Balance Sheets
The net worth of Canadian households rose 3.7% in the second quarter of 2021, following an increase of 6.0% in the previous quarter. This reflects financial asset appreciation and record investments in mutual funds. Residential real estate assets continued to rise.
The household debt-to-disposable income ratio (seasonally adjusted) rose to 173.1% in the second quarter from 172.6% in the previous quarter, remaining below pre-pandemic levels. Debt payment deferrals and strong income support programs have limited the need for many Canadians to take on more debt.
Inflation
The Consumer Price Index (CPI) rose 4.7% on a year-over-year basis in October, up from a 4.4% increase in September. The increase met market expectations of 4.7%. Month-over-month, the CPI (adjusted for seasonality) rose 0.5% in October, down slightly from 0.6% in September.
The acceleration in year-over-year inflation in October was largely driven by higher energy prices, particularly gasoline. Excluding energy, CPI increased 3.3% year-over-year in October, the same pace as in September. Core measures of inflation were unchanged in October, and now range from 1.8% to 3.3%.
The recent rise in inflation in part reflects the steep prices declines experienced at the beginning of the pandemic last year, which accentuate the year over year reading (known as the base-year effect). However, the increase also reflects strong housing demand, disruptions in supply chains, higher commodity prices for food and energy, and higher prices associated with the start of the re-opening process.
Total inflation should remain elevated over the near-term. However, as base year and temporary pandemic-related factors wane, inflation is expected to settle closer to the target range in 2022.
| Sep-21 | Oct-21 | |
|---|---|---|
| Total CPI Inflation | ||
| Year-over-year, not seasonally adjusted | 4.4 | 4.7 |
| Month-over-month, seasonally adjusted | 0.6 | 0.5 |
| Core Inflation – Bank of Canada definitions | ||
| CPI-common | 1.8 | 1.8 |
| CPI-median | 2.9 | 2.9 |
| CPI-trim | 3.3 | 3.3 |
Select Sectoral Information
Manufacturing
The sector suffered an economic decline of 27% between February and April 2020 and has since recovered to 94% of its pre-COVID-19 level (as of September 2021). The sector lost 300,000 jobs between February and April 2020 and has since recovered 312,000 (as of November 2021).
Retail
The sector suffered an economic decline of 29% between February and April 2020 and has since recovered to 103% of its pre-COVID-19 level (as of September 2021). The sector (including wholesale trade) lost 586,000 jobs between February and April 2020 and has since recovered 665,000 (as of November 2021).
Transport
The sector suffered an economic decline of 31% between February and April 2020 and has since recovered to 84% of its pre-COVID-19 level (as of September 2021). The sector lost 144,000 jobs between February and April 2020 and has since recovered 135,000 (as November 2021).
Hospitality
The sector suffered an economic decline of 63% between February and April 2020 and has since recovered to 88% of its pre-COVID-19 level (as of September 2021). The sector lost 609,000 jobs between February and April 2020 and has since recovered 407,000 (as of November 2021).
| Employment | Unemployment | ||||||
|---|---|---|---|---|---|---|---|
| Nov 2021 Level 000's |
Feb 2020 to Apr 2020 Change 000's |
Feb 2020 to Nov 2021 Change 000's |
Nov 2021 Monthly Change 000's |
Nov 2021 per cent |
Feb 2020 to Nov 2021 Change p.p. |
||
| Canada | 19,316 | -2,989 | 186 | 154 | 6.0 | 0.3 | |
| Newfoundland and Labrador | 229 | -35 | 4 | 9 | 10.4 | -2.0 | |
| Prince Edward Island | 83 | -12 | 1 | 3 | 8.0 | 0.0 | |
| Nova Scotia | 470 | -75 | 3 | 4 | 8.1 | 0.1 | |
| New Brunswick | 366 | -50 | 0 | 1 | 8.5 | 1.2 | |
| Quebec | 4,365 | -826 | 11 | 46 | 4.5 | 0.0 | |
| Ontario | 7,605 | -1,081 | 114 | 68 | 6.4 | 0.9 | |
| Manitoba | 660 | -90 | -4 | 2 | 5.1 | 0.0 | |
| Saskatchewan | 563 | -72 | -10 | 1 | 5.2 | -1.1 | |
| Alberta | 2,279 | -337 | 10 | 15 | 7.6 | 0.1 | |
| British Columbia | 2,697 | -411 | 55 | 5 | 5.6 | 0.5 | |
| 2020 | 2021 | |
|---|---|---|
| Budget 2021 – April 2021 | -5.4 | 5.8 |
| Bank of Canada MPR – October 2021 | -5.3 | 5.1 |
| IMF World Economic Outlook – October 2021 | -5.3 | 5.7 |
| OECD Economic Outlook – September 2021 | -5.3 | 5.4 |
| PBO Economic and Fiscal Outlook – May 2021 | -5.4 | 6.2 |
| Fall Economic Statement 2020 – November 2020 | -5.8 | 4.8 |
| 2020 Economic and Fiscal Snapshot – July 2020 | -6.8 | 5.5 |
| Indicator | Peak to Trough Decline (%) | Change since February 2020 (%) | Last Month of Data |
|---|---|---|---|
| MLS Home Sales | -62% | 21% | October |
| Housing Starts | -24% | 13% | October |
| Retail Sales | -31% | 6% | September |
| Employment (LFS) | -16% | 1% | November |
| Hours Worked (LFS) | -28% | 0% | November |
| Monthly GDP | -17% | -1% | September |
| Goods Imports | -28% | -4% | September |
| Goods Imports | -27% | -9% | September |
| Manufacturing Sales | -33% | -10% | September |
| 28-Feb-20 | 31-Mar-20 | 2-Dec-21 | 31-Mar-20 (Change from Feb. 28, 2020, Per cent) |
2-Dec-21 (Change from Feb. 28, 2020, Per cent) |
|
|---|---|---|---|---|---|
| Bank of Canada Target Rate (%) | 1.75 | 0.25 | 0.25 | -1.50 | -1.50 |
| 3–Month Treasury Bills (%) | 1.49 | 0.26 | 0.05 | -1.23 | -1.43 |
| 10–Year Government Bonds (%) | 1.13 | 0.70 | 1.51 | -0.44 | 0.38 |
| S&P TSX (Canada) | 16263 | 13379 | 20762 | -17.7 | 27.7 |
| S&P 500 (U.S.) | 2954 | 2585 | 4577 | -12.5 | 54.9 |
| WTI Crude Oil ($US/barrel) | 44.76 | 20.48 | 66.50 | -54.2 | 48.6 |
| WCS Crude Oil ($US/barrel) | 31.11 | 5.08 | 48.80 | -83.7 | 56.9 |
| 2020Q1 | 2020Q2 | 2020Q3 | 2020Q4 | 2021Q1 | 2021Q2 | 2021Q3 | Change from 19Q4 to 20Q2 (%) |
Change from 19Q4 to 21Q3 (%) |
|
|---|---|---|---|---|---|---|---|---|---|
| Canada | -8.4 | -37.4 | 41.1 | 9.1 | 4.9 | -3.2 | 5.4 | -13.0 | -1.4 |
| France | -20.9 | -43.9 | 97.3 | -4.3 | 0.3 | 5.3 | 12.6 | -18.4 | -0.1 |
| Germany | -6.9 | -34.4 | 41.4 | 3.0 | -7.3 | 8.3 | 6.9 | -11.6 | -1.1 |
| Italy | -21.0 | -42.4 | 78.7 | -6.3 | 1.1 | 11.1 | 11.0 | -17.9 | -1.3 |
| Japan | -2.3 | -28.2 | 23.5 | 11.8 | -4.1 | 1.5 | -3.0 | -8.5 | -2.2 |
| U.K. | -10.4 | -58.1 | 90.2 | 4.5 | -5.3 | 23.9 | 5.1 | -21.7 | -2.1 |
| U.S. | -5.1 | -31.2 | 33.8 | 4.5 | 6.3 | 6.7 | 2.1 | -10.1 | 1.4 |
| Source: Haver Analytics. Note: Historical GDP data for Canada for the previous three years were revised with the release of the 2021Q3 National Accounts. |
|||||||||
Fiscal Fact Sheet (Budget 2021)
Fiscal Snapshot
Projected 2021-22 Deficit $154.7 billion
Projected 2021-22 Federal Debt: $1,233.8 billion
Debt Management
Current Federal Debt (2019-20): $721.4 billion
Projected Federal Debt: $1,079.0 billion (2020-21); $1,233.8 billion (2021-22)
Public Debt Charges: $20.4 billion (2020-21); $22.1 billion (2021-22)
Public Debt Charges as a percentage of GDP: 0.9% (2020-21); 0.9% (2021-22)
- Pre-pandemic, 15 per cent of the bonds issued by the government were issued at maturities of 10 years or more (long bonds). For 2020-21, federal government allocations of long bonds increased to about 29 per cent of total bonds issued. The government is now proposing to increase that proportion to 42 per cent for the 2021-22 Debt Management Strategy.
- Since March 2020, Canada has issued more long-term debt to finance emergency support to Canadians and Canadian businesses throughout the pandemic. The 2021-22 debt strategy will result in the estimated average term to maturity of domestic marketable bonds and treasury bills to rise to nearly 8 years by 2023-24, well above the historical average of 5.9 years observed between 1981-82 and 2019-20. Average term to maturity was 6.1 years for 2019-20.
- % of foreign owned debt: According to Statistics Canada survey data, as of June 30, 2021, the share of Government of Canada market debt held by non-residents was 24 per cent.
Sources of Borrowing
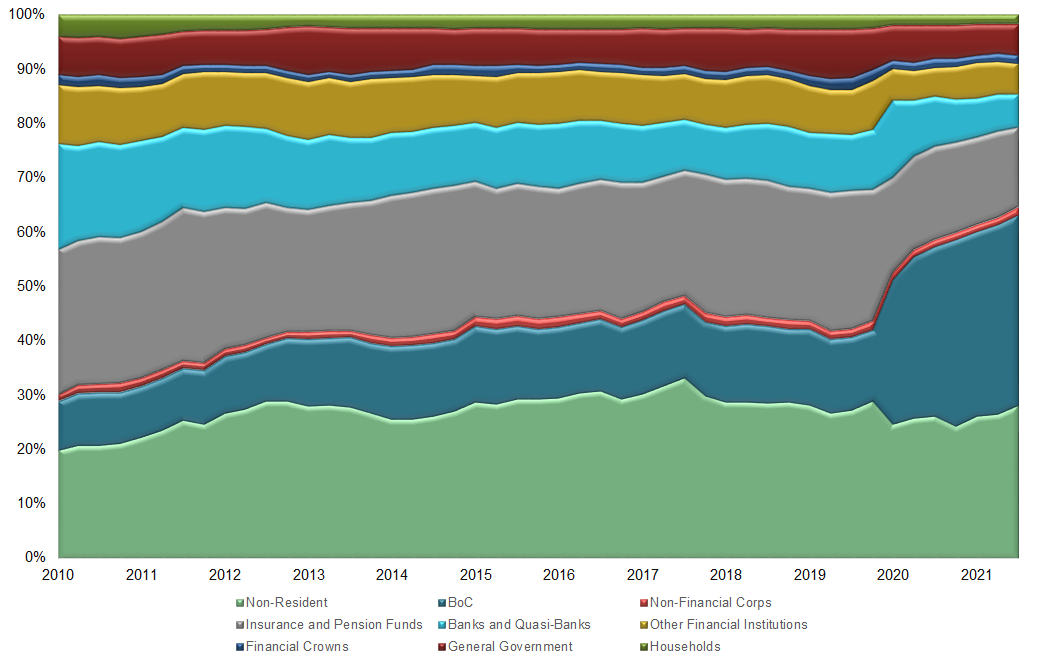
Debt Historical Comparison
1992 Budget (for 1991-92)
Debt Servicing Costs: $41.5B
As a % of GDP: 6.1%
| Canada | Germany | UK | USA | France | Italy | Japan | G7 avg. |
|
|---|---|---|---|---|---|---|---|---|
| 2020 Net Debt | 34.7 | 50.1 | 91.8 | 98.7 | 102.6 | 142.3 | 167.0 | 98.2 |
| 2021 Net Debt Projection | 34.9 | 54.4 | 97.2 | 101.9 | 103.3 | 142.2 | 171.5 | 100.8 |
| Source: IMF October 2021 World Economic Outlook | ||||||||
Economic Indicators Fact Sheet
| 2020 | 2020Q4 | 2021Q1 | 2021Q2 | 2021Q3 | July 2021 |
Aug 2021 |
Sept 2021 |
Oct 2021 |
Nov 2021 |
Change From Pre-Pandemic Peak | |
|---|---|---|---|---|---|---|---|---|---|---|---|
| Year-over-year growth (%)1 | Period-over-period growth at annualized rates (%)1 |
Period-over-period growth (%)1 |
Change from Feb.20201 | ||||||||
| Output | |||||||||||
| Real GDP at Basic Prices | -5.1 | 8.2 | 5.0 | -1.0 | 4.5 | 0.3 | 0.6 | 0.1 | -1.4% | ||
| Labour market | |||||||||||
| Employment (Change, 000s) | -975 | 433 | 44 | 113 | 338 | 94 | 90 | 157 | 31 | 154 | +186K |
| Unemployment Rate (Level, %) | 9.6 | 8.8 | 8.4 | 8.0 | 7.2 | 7.5 | 7.1 | 6.9 | 6.7 | 6.0 | +0.3 p.p. |
| Labour Force Participation Rate (Level, %) | 64.1 | 65.1 | 64.9 | 64.9 | 65.3 | 65.2 | 65.1 | 65.5 | 65.3 | 65.3 | -0.2 p.p. |
| Retail Sales | |||||||||||
| Nominal | -1.7 | 7.8 | 8.4 | -2.6 | 11.4 | -0.4 | 1.8 | -0.6 | +9.0% | ||
| Real | -2.0 | 5.7 | 6.2 | -6.0 | 6.3 | -0.5 | 1.1 | -1.1 | +5.8% | ||
| Manufacturing Sales | |||||||||||
| Nominal | -11.7 | 8.6 | 27.7 | 9.9 | 2.7 | -1.1 | 1.1 | -3.0 | +2.9% | ||
| Real | -10.3 | 4.3 | 4.1 | -12.5 | -3.6 | -1.6 | 1.2 | -4.2 | -10.3% | ||
| International Merchandise Trade | |||||||||||
| Exports, Real | -7.9 | 2.6 | 4.7 | -19.7 | -19.7 | 0.3 | 2.0 | -3.9 | -8.8% | ||
| Imports, Real | -8.6 | 11.2 | 2.9 | -0.3 | -6.9 | 1.3 | -2.2 | -4.3 | -3.9% | ||
| Terms of Trade | -5.7 | -9.3 | -24.2 | -18.5 | 10.0 | 2.2 | 2.7 | -0.3 | +13.0% | ||
| Housing | |||||||||||
| Housing Starts2 (annualized level, 000s) |
219 | 240 | 306 | 280 | 262 | 273 | 262 | 250 | 237 | +14.0% | |
| Sales of Existing Homes2 | 12.5 | 0.0 | 55.5 | -42.9 | -38.5 | -4.1 | 0.1 | 1.5 | 8.6 | +32.0% | |
| MLS Benchmark Price (year-over-year percent change) | 8.7 | 12.2 | 17.3 | 24.2 | 21.8 | 22.4 | 21.4 | 21.6 | 23.4 | +17.1 p.p. | |
| Population | |||||||||||
| Total Population3 (year-over-year percent change) | 0.9 | 0.4 | 0.4 | -1.1 p.p. | |||||||
| Immigration (annualized level, 000s) | |||||||||||
| Permanent Admissions4 | 185 | 165 | 282 | 298 | 490 | 476 | 454 | 540 | +4.6K | ||
| International Students4 | 273 | 216 | 275 | 346 | 838 | 475 | 1180 | 858 | +37.6K | ||
| Temporary Worker Permit Holders4 | 385 | 559 | 579 | 485 | 503 | 491 | 547 | 471 | +42.3K | ||
| Confidence (change in index points) | |||||||||||
| Conference Board Consumer | -31.0 | -3.5 | 17.6 | 12.0 | 7.3 | 1.6 | -7.7 | -3.5 | 3.2 | -5.0 | -12.4 points |
| Bloomberg-Nanos Consumer | -6.5 | 2.4 | 5.7 | 6.1 | -0.8 | 0.2 | -1.7 | -3.1 | -1.7 | 0.3 | +3.5 points |
| Business Confidence3 | -2.1 | 3.3 | 1.5 | 1.2 | 0.8 | +4.0 points | |||||
| CPI Inflation (year-over-year percent change) | |||||||||||
| Total | 0.7 | 0.8 | 1.4 | 3.4 | 4.1 | 3.7 | 4.1 | 4.4 | 4.7 | +2.5 p.p. | |
| Core (CPI common) | 1.5 | 1.4 | 1.4 | 1.7 | 1.8 | 1.7 | 1.8 | 1.8 | 1.8 | +0.0 p.p. | |
| Household Balance Sheet | |||||||||||
| Net worth3 (percent change, non-annualized) | 5.9 | 4.6 | 6.0 | 3.7 | +21.7% | ||||||
| Debt-to-disposable income ratio3 | 171.0 | 174.0 | 172.6 | 173.1 | -7.9 p.p. | ||||||
| Notes 1 Unless otherwise indicated. 2 Pre-pandemic peak is 2019 average level. 3 Pre-pandemic peak is 2019Q4. 4 Change from pre-pandemic peak compares January to July 2021 to January to July 2019. Figures are annualized. |
|||||||||||
| November 2021 | Change from Pre-Pandemic Value | % Change from Pre-Pandemic Value (Feb 2020 = 100%) | |
|---|---|---|---|
| Employment (Level, 000) | 19,316 | +186K | 101% |
| Working less than 50% usual hours (000) | 967 | +155K | 119% |
| Unemployment Rate | 6.0% | +0.3 p.p. | 105% |
| Excess Unemployment (000) | -- | +98K | -- |
| Long-Term Unemployment Rate | 1.5% | +0.6 p.p. | 173% |
| Employment-Population Ratio (15+) | 61.4% | -0.4 p.p. | 99% |
| Employment-Population Ratio (15-64) | 74.9% | 0.5 p.p. | 101% |
| Labour Force Participation Rate | 65.3% | -0.2 p.p. | 100% |
| Total Hours Worked (Level, 000,000) | 632 | 0.1% | 100% |
| Share of involuntary part-time workers | 3.3% | -0.3 p.p. | 92% |
| 2020Q4 | 2021Q1 | 2021Q2 | 2021Q3 | Peak to Trough Decline (2019Q4- 2020Q2) | Change From Pre-Pandemic Peak (2019Q4-2021Q3) | |
|---|---|---|---|---|---|---|
| United States | 4.5 | 6.3 | 6.7 | 2.1 | -10.1 | 1.4 |
| Canada | 9.1 | 4.9 | -3.2 | 5.4 | -13.1 | -1.4 |
| Japan | 11.8 | -4.1 | 1.5 | -3.0 | -8.5 | -2.2 |
| France | -4.1 | 0.2 | 5.2 | 12.6 | -18.4 | -0.1 |
| Germany | 3.0 | -7.3 | 8.3 | 6.9 | -11.6 | -1.1 |
| Italy | -6.3 | 1.1 | 11.1 | 11.0 | -17.8 | -1.3 |
| United Kingdom | 4.5 | -5.3 | 23.9 | 5.1 | -21.7 | -2.1 |
| 2021Q3 | 2021Q4 | 2021 | 2022 | 2023 | |
|---|---|---|---|---|---|
| Bank of Canada MPR – October 2021 | 5.5 | 4.0 | 5.1 | 4.3 | 3.7 |
| IMF World Economic Outlook – October 2021 | 5.7 | 4.9 | -- | ||
| OECD Interim Economic Assessment – September 2021 | 5.4 | 4.1 | -- | ||
| Budget 2021 – April 2021 | 6.3 | 5.0 | 5.8 | 4.0 | 2.1 |
| PBO Economic and Fiscal Outlook – March 2021 | 5.6 | 3.7 | 1.8 |
| 2021Q3 | 2021Q4 | 2021 | 2022 | 2023 | |
|---|---|---|---|---|---|
| Bank of Canada MPR – October 2021 | 4.1 | 4.8 | 3.4 | 3.4 | 2.3 |
| IMF World Economic Outlook – October 2021 | 3.2 | 2.6 | -- | ||
| OECD Interim Economic Assessment – September 2021 | 3.1 | 2.8 | -- | ||
| Budget 2021 – April 2021 | 2.0 | 2.0 | 2.2 | 2.0 | 2.1 |
| PBO Economic and Fiscal Outlook – March 2021 | 2.1 | 1.7 | 2.0 |
| Feb. 28, 2020 | March 31, 2020 | December 3, 2021 | March 31, 2020 Change from Feb. 28, 2020 |
December 3, 2021 Change from Feb. 28, 2020 |
|
|---|---|---|---|---|---|
| Bank of Canada Target Rate (%) | 1.75 | 0.25 | 0.25 | -1.50 p.p. | -1.50 p.p. |
| 3-Month Treasury Bills (%) | 1.49 | 0.26 | 0.04 | -1.45 p.p. | |
| 10-year Government Bonds (%) | 1.13 | 0.70 | 1.43 | -0.44 p.p. | 0.30 p.p. |
| S&P TSX (Canada) | 16263 | 13379 | 20594 | -17.7% | 26.6% |
| S&P 500 (U.S.) | 2954 | 2585 | 4521 | -12.5% | 53.0% |
| WTI Crude Oil ($US/barrel) | 44.76 | 20.51 | 66.26 | -54.2% | 48.0% |
| WCS Crude Oil ($US/barrel) | 31.11 | 5.08 | 47.13 | -83.7% | 51.5% |
Alberta Economic and Fiscal Factsheet
Economic Performance and Outlook
- Alberta’s real GDP fell 7.9% in 2020, while nominal GDP decreased by 16.1%, both representing the worst declines among provinces (Chart 1).
- For 2021, the provincial government’s latest forecast predicts that real GDP will rebound 6.1%, compared with a private sector forecast of 5.6%. Nominal GDP growth should also post a solid rebound of 18.1%.
- These forecasts are consistent with high-frequency indicators pointing towards a solid recovery in 2021 (Chart 2).
- Real GDP growth is expected to slow in 2022, though remain robust, at 5.1%. The private sector forecast is for growth of 4.7% in 2022 (Chart 3).
- The unemployment rate was 7.6% in November, the sixth highest among provinces, but only 0.1 percentage point above its pre-pandemic rate of 7.5% (Chart 4). Renewed vigor in the energy sector should support employment going forward.
Real GDP Growth by Province, 2020
per cent
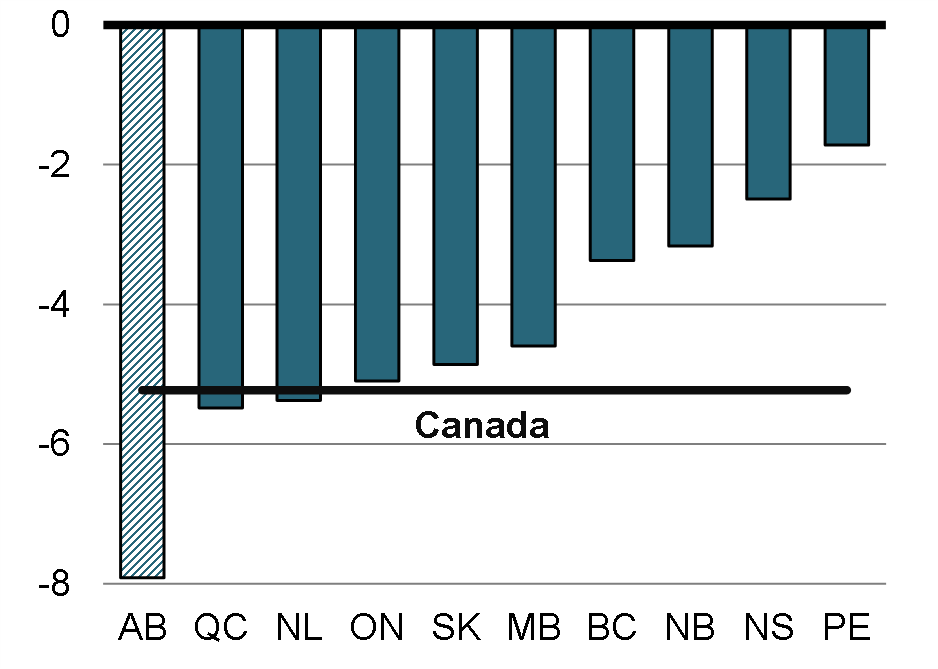
Alberta Activity Index and Real GDP Growth
per cent, year-over-year
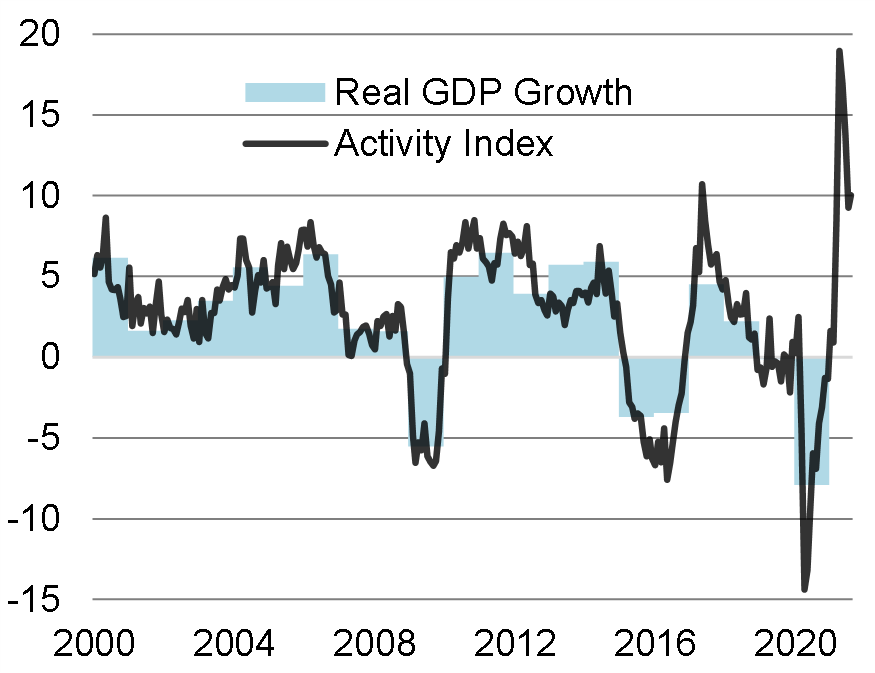
Private Sector Forecast for Real GDP Growth
per cent
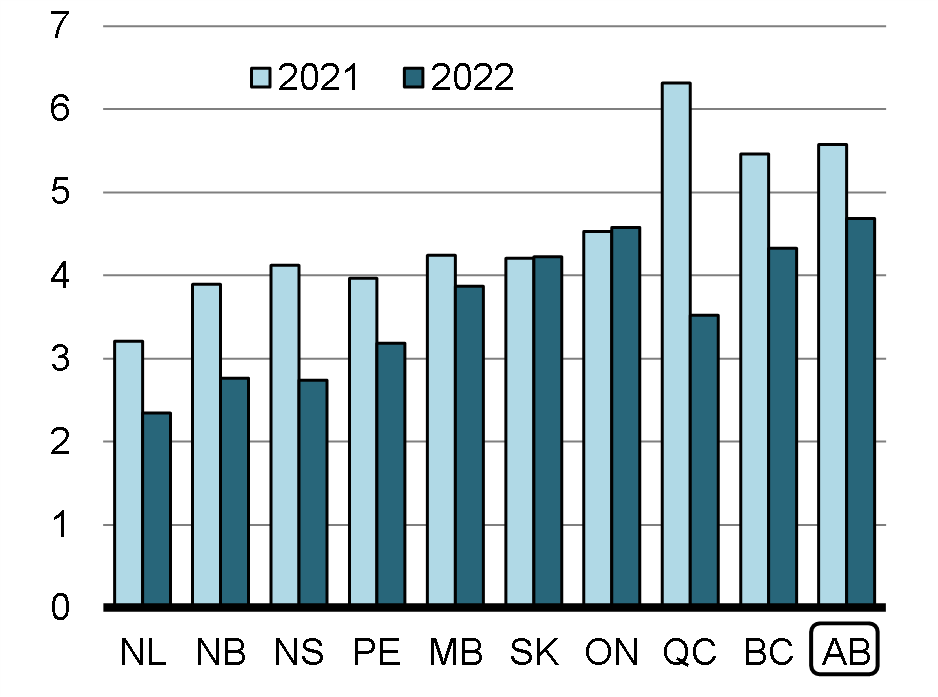
Unemployment Rates by Province, November
per cent
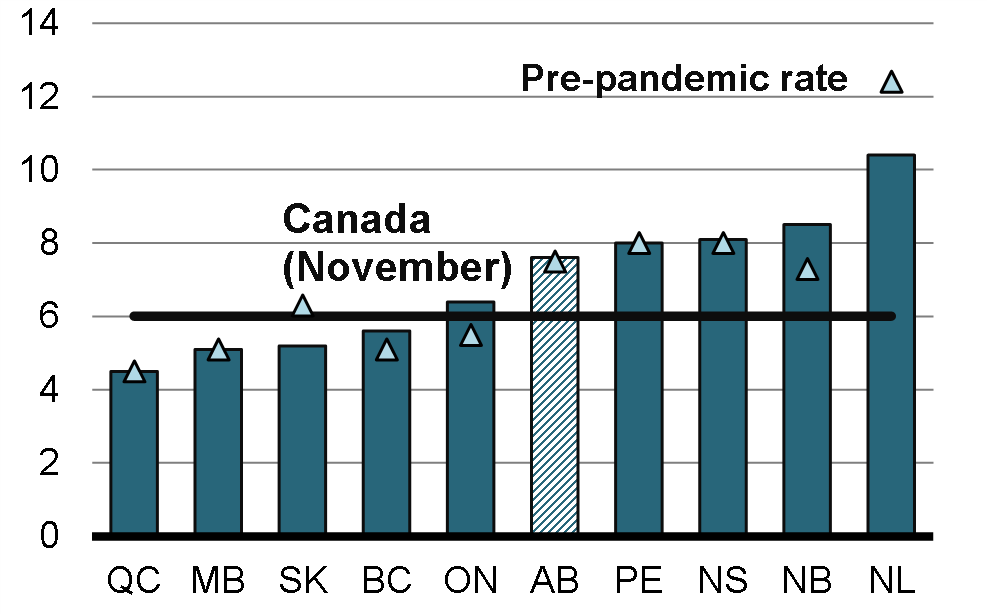
Fiscal Situation
- Alberta had the largest deficit-to-GDP ratio in 2020-21 (5.8%), but the budgetary balance is set to improve significantly in 2021-22, to a deficit of around 1.7% of GDP based on latest fiscal estimates.
- Oil prices pose risk to this estimate, both upside and downside, depending on how they evolve over the next few months. Alberta’s latest oil prices assumptions of $70.50/barrel (WTI) for FY2021-22 are slightly below the average of actual prices so far this fiscal year, though the emergence of the Omicron variant has led to a sharp decline in prices over the last two weeks. See next section for a more detailed outlook of the sector.
- Despite registering the biggest provincial deficits since 2018-2019, Alberta still has a low net debt relative to other provinces, third only to Saskatchewan and British Columbia.
- Positively, it also has more room to raise revenues than most other provinces, having relatively low income tax rates and no provincial sales tax.
Budgetary Balance by Province, 2020-21
per cent
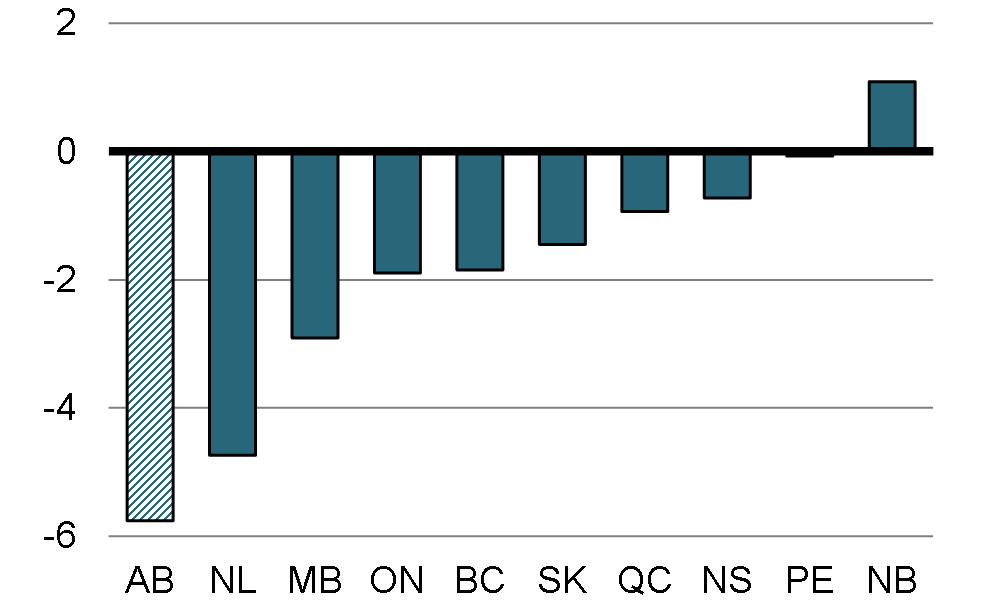
Net Debt by Province, 2020-21
per cent
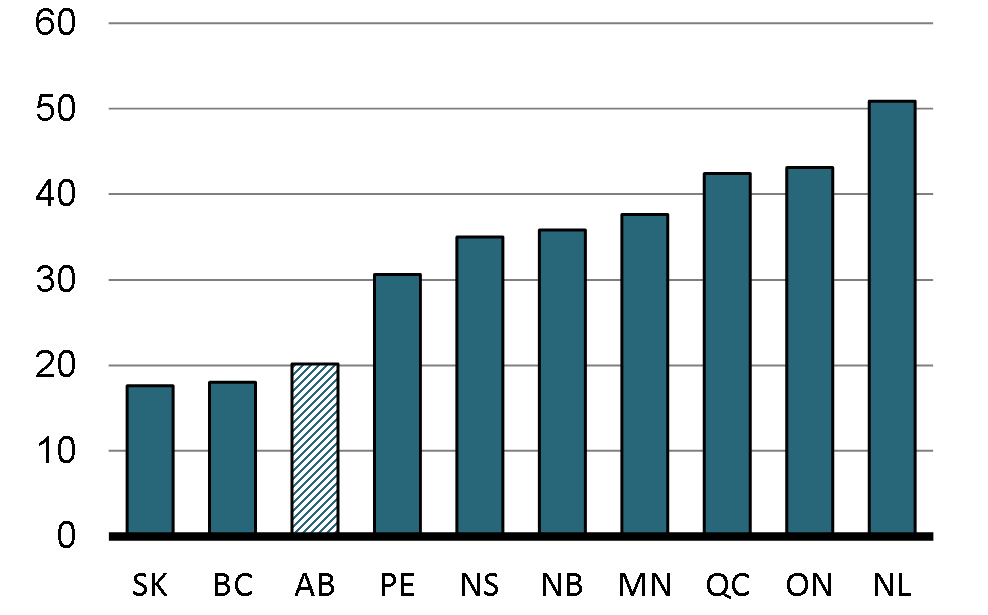
State of the Oil Sector
- The Canadian oil sector is experiencing a solid recovery in 2021, buoyed by prices that have risen to multi-year highs and the launch of the first new pipeline in many years, the expanded Line 3 that connects the hubs of Hardisty, Alberta to Superior, Wisconsin.
- In recent weeks however, the emergence of the Omicron variant has led to sharp declines in oil benchmarks, as markets grew concerned that the newly-designated variant of concern could lead to fresh lockdowns and more travel curbs, which would lower demand for oil.
- As of December 2, WTI prices are 21% below their recent peak, while WCS prices have fallen even further, by roughly one-third.
- Nevertheless, our short-term outlook for the sector remains mostly positive. Assuming the impacts of the Omicron variant are temporary, we expect prices to return to elevated levels as demand continues to increase, particularly if aviation recovers more strongly in the months ahead.
- Canadian producers will also benefit from the expected launch of the TransMountain expansion, though the timing remains uncertain.
- While the sector is highly profitable and generating solid cash flows at the moment, it is not expected to be the engine of growth it once was. Major companies are choosing to increase dividends and share buybacks rather than invest to increase production given the uncertainty surrounding the long-term outlook, as countries will seek to increasingly decarbonize their economy going forward.
Year-to-Date Oil prices
USD per barrel
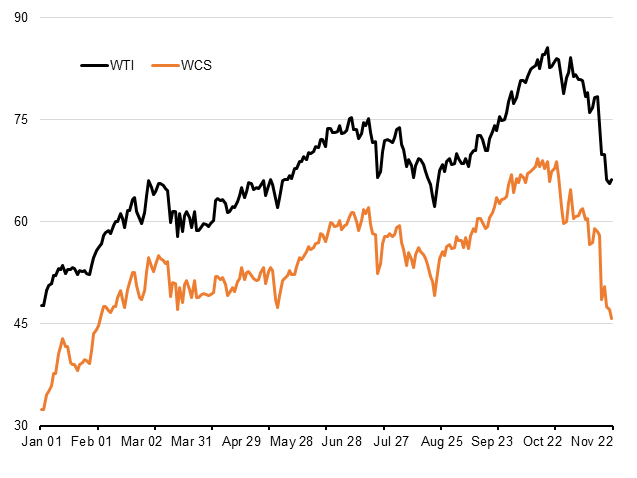
Canadian Crude Oil Monthly Production
Millions of barrels
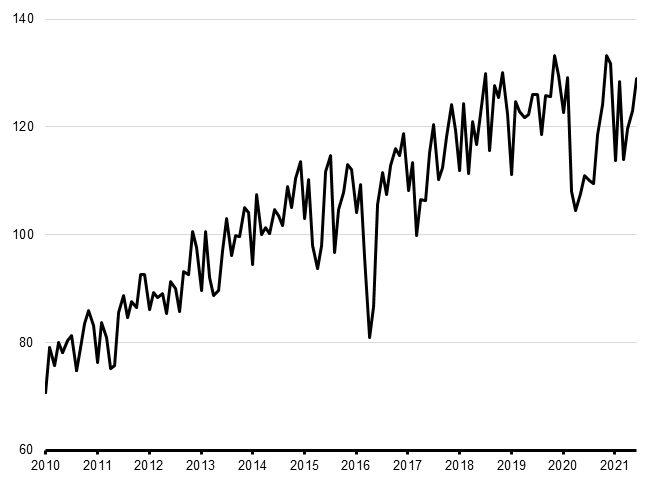
Parliamentary and Media Environment
Party Leaders and Finance Critics
Opposition Leaders
| Political Affiliation | MP / Député | Constituency |
|---|---|---|
| Conservative (CPC) | Erin O'Toole | Durham |
| Bloc Québécois (BQ) | Yves-François Blanchet | Beloeil—Chambly |
| New Democratic Party (NDP) | Jagmeet Singh | Burnaby South |
CPC Leader
The Honourable Erin O'Toole
Durham
Ontario
Erin O’Toole has been a Member of Parliament since 2012, representing Durham. He has since served in a number of positions, most notably as Leader of the Conservative Party of Canada since August 2020.
The Leader has significant experience with Parliamentary committees, associations and delegations, serving as Vice-Chair of the Standing Committee of Foreign Affairs and International Development. During the Conservative Government of the 41st Parliament, Mr. O’Toole served as Parliamentary Secretary to the Minister of International Trade before becoming the Minister of Veterans Affairs.
Work
Private Members’ Business
Mr. O’Toole did not have any Private Members’ Bills or Motions in the previous Parliament (43rd Parliament).
During the 42nd Parliament, 1st Session, he introduced Bill C-405 “An Act to amend the Pension Benefits Standards Act, 1985 and the Companies’ Creditors Arrangement Act (pension plans)”. The bill was introduced and received First Reading on June 1, 2018, and was defeated at second reading in the House of Commons on November 28, 2018.
Interventions
Standing Committees
As a party leader, Mr. O’Toole did not make any interventions at Standing Committees during the last session of the previous Parliament. Mr. O’Toole did, however, make four interventions at the Special Committee on COVID-19 (COVI). Two of these interventions surrounded his concerns about illegal border crossings at Roxham Road. His other two interventions were calls for increases in Old Age Security and Canada Summer Jobs funding. All four interventions were questions directed at Ministers.
Question Period
Mr. O’Toole made 419 interventions during Question Period in the 43rd Parliament. Below is a selection of interventions related to Finance.
43rd Parliament, 2nd Session
- CEWS 2020-12-09 Asked how much money was given to profitable large corporations.
- Economic Update 2020-12-02 Asked about economic recovery and a safe reopening plans.
- Consumer Price 2021-06-16 Noted concern for rising consumer price and home ownership.
- Inflation 2021-05-14 Noted 10-year high in cost of living and attributed inflation to government spending.
- Asia Infrastructure Investment Bank 2021-02-17 Noted government funding in the Asian Infrastructure Investment Bank.
- CERB 2020-12-09 Raised concern for changing CERB criteria and related confusion.
43rd Parliament, 1st Session
- CUSMA 2019-12-12 Raised concern for the Canadian aluminum industry.
BQ Leader
Yves-François Blanchet
Beloeil—Chambly
Quebec
Yves-François Blanchet has been the Leader of the Bloc Québécois, and has served as the MP for Beloeil–Chambly since 2019. Before entering federal politics, Mr. Blanchet took part in provincial politics as a Member of the National Assembly (MNA) for the Parti Québécois (PQ) from 2008 until 2014.
Aside from the Special Committee on the COVID-19 Pandemic of the 43rd Parliament, the Member does not have experience with Parliamentary committees and delegations as he joined Parliament as a Leader of an opposing party, meaning he has not held any Government positions, nor sat on any Standing Committees. However, Mr. Blanchet has served on numerous Parliamentary Associations and Interparliamentary Groups, including the Canada-France Inter-Parliamentary Association.
Work
Private Members’ Business
Mr. Blanchet did not have any Private Members’ Bills or Motions in the previous Parliament (43rd Parliament).
Interventions
Standing Committees
As a party leader, Mr. Blanchet did not make any interventions at Standing Committees during the last session of the previous Parliament. Mr. Blanchet did, however, make 76 interventions at the Special Committee on COVID-19 (COVI). Many of his comments claimed the parameters of the COVID-19 benefits, particularly the Canada Emergency Wage Subsidy, were to the benefit of the governing Liberal Party. Nonetheless, Mr. Blanchet’s other comments on the Government’s COVID-19 benefits highlighted their necessity. Mr. Blanchet also made extensive comments calling for an increase in the Canada Health Transfer.
Question Period
Mr. Blanchet made 192 interventions during Question Period in the 43rd Parliament, a majority of which were related to Quebec. Below is a selection of interventions related to Finance.
43rd Parliament, 2nd Session
- Old Age Security 2021-06-23 14:29 asked whether the government would increase old age security for all seniors 65 and older.
- Health Transfers 2021-06-23 14:31 asked whether the government would increase health transfers to provinces to protect their healthcare systems.
- CERB Fraud 2021-05-05 14:28 inquired whether victims of CERB fraud would have to pay the CRA for their lost rebate.
- Canada Emergency Wage Subsidy 2020-07-21 14:24 inquired whether the wage subsidy would continue to be collected by the Liberal party.
43rd Parliament, 1st Session
- Employment Insurance Sickness Benefits 2020-07-20 14:23 asked whether the government would increase EI benefits to 50 weeks for those who are seriously ill.
- Tax Return 2020-02-04 14:25 Inquired whether the government would allow Quebec residents to file their taxes under a single tax return.
NDP Leader
Jagmeet Singh
Burnaby South
British Columbia
Jagmeet Singh served as an Ontario MPP from 2011 until 2017, a part of the Legislative Assembly of Ontario, representing the Bramela–Gore–Malton region. On October 1, 2017, he became leader of Canada’s NDP and has served as the MP for Burnaby South since 2019.
Prior to his political career, Mr. Singh was a criminal defence lawyer. Similar to the BQ leader, Mr. Singh does not have extensive experience with Parliamentary committees, associations and delegations as he joined Parliament as a Leader of an opposing party, meaning he has not held any Government positions, nor sat on any Standing Committees or Parliamentary associations. However, as was the case for all MPs, Mr. Singh did participate in gatherings of the Special Committee on the COVID-19 Pandemic.
Work
Private Members' Business
Mr. Singh did not have any Private Members' Bills or Motions in the previous Parliament (43rd Parliament).
Interventions
Standing Committees
As a party leader, Mr. Singh did not make any interventions at Standing Committees during the last session of the previous Parliament. Mr. Singh did, however, make 131 interventions at the Special Committee on COVID-19 (COVI). His interventions covered a wide array of topics including diverting police funds for mental health services, the difficulties in accessing EI, missing and murdered Indigenous women and girls, the extension of COVID-19 benefits, the Black Lives Matter movement, and appropriate pandemic protections for long-term care residents. Mr. Singh did not have a particular focus in his interventions, instead choosing to pose questions to the Prime Minister and other Ministers on a wide variety of subjects.
Question Period
Mr. Singh made 253 interventions during Question Period in the 43rd Parliament. The Member focused numerous subjects, such as the housing crisis, health transfers, universal pharmacare and dental care, and COVID recovery. Below is a selection of interventions related to Finance.
43rd Parliament, 2nd Session
- Canada Recovery Benefit 2021-06-23 14:32 asked the government to reverse their decision to cut the CERB benefit by $800 and whether the government would continue to pursue CERB clawbacks for self-employed workers.
- Bank fees 2021-05-27 14:28 inquired whether the government would stop increases in banking fees while banks have already increased their profits during the pandemic.
- Federal Paid Sick Leave 2021-04-29 14:27 urged the government to fix the existing federal paid sick leave program to prevent workers from spreading the virus at work.
- Tax Changes 2021-04-15 14:26 asked whether the budget would include tax increases for the ultra-rich.
- Canada Emergency Rent Subsidy 2020-11-23 14:30 asked whether the government would help small businesses with a subsidy designed for businesses instead of landlords.
- Deficit 2020-09-29 14:32 inquired about the current deficit and about who would end up paying for it after the pandemic.
Opposition Critics
| Political Affiliation | MP / Député | Constituency |
|---|---|---|
| Conservative Party of Canada (CPC) | Pierre Poilievre | Carleton, ON |
| Bloc Québécois (BQ) | Gabriel Ste-Marie | Joliette, QC |
| New Democratic Party (NDP) | Daniel Blaikie | Elmwood—Transcona |
CPC Opposition Critic
Pierre Poilievre
Carleton
Ontario
Pierre Poilievre was first elected as the MP for Carleton in 2004 and has since served in a number of positions. During the 43rd Parliament, Mr. Poilievre transitioned from Finance Critic to Shadow Minister for Jobs and Industry, but he has since been restored to the former position.
The Member has experience with Parliamentary committees, associations and delegations. During the 43rd Parliament, he was Vice-Chair of the Standing Committee on Industry, Science and Technology (INDU), previously holding the role of Vice-Chair of the Standing Committee on Finance (FINA).
Mr. Poilievre has expressed support for a free market economy and limiting government, while opposing deficit spending and tax increases. He has also focused efforts on growing jobs for people with disabilities.
Work
Private Members’ Business
Mr. Poilievre did not have any Private Members’ Bills or Motions in the previous Parliament (43rd Parliament)
During the 42nd Parliament, 1st Session, he brought forward Bill C-395 “An Act to amend the Federal-Provincial Fiscal Arrangements Act”. The bill was introduced and received First Reading on February 5, 2018 and was defeated at Second Reading on June 6, 2018.
Interventions
Standing Committee on Finance (FINA)
Mr. Poilievre made 498 interventions at the Standing Committee on Finance during the 2nd session of the 43rd Parliament. While Mr. Poilievre has participated in numerous other committees, a selection of some of the main topics covered during FINA can be found below.
Canada Student Service Grant
- The plurality of Mr. Poilievre’s interventions at FINA (125 total) concerned the Canada Student Service Grant and allegations that the Government of Canada had inappropriately awarded WE Charity the right to administer the program. His interventions were primarily questions posed to witnesses in a very pointed manner. Mr. Poilievre’s questions sought primarily to determine whether any unethical behavior had occurred.
Pre-Budget Consultations
- Mr. Poilievre was active in questioning witnesses as part of FINA’s pre-budget consultations. Of particular concern to him was the potential that the budget may run an extremely large deficit. He asked witnesses whether there would be grounds for such a deficit given historical evidence. In addition, Mr. Poilievre seemed concerned with the potential for increased taxes. He even asked the Minister of Finance directly whether taxes would be increasing as a result of the Budget.
Monetary Policy
- Mr. Poilievre participated in the questioning of the Governor of the Bank of Canada during their appearance at FINA. Mr. Poilievre expressed a wide range of concerns on topics including bonds, interest rates, and inflation. His line of questioning focused on whether the Governor was able to defend the Bank’s monetary policy position. An overarching theme in his questioning was the idea that the Bank was simply “printing” money.
Question Period
Mr. Poilievre made 175 interventions during Question Period in the 43rd Parliament. The Member focused on a broad range of topics, including unemployment and job recovery, as well as COVID-19 recovery benefits and a safe reopening. Below is a selection of interventions related to Finance.
43rd Parliament, 2nd Session
- Inflation 2021-06-16 14:52 asked if the government would reduce spending to bring inflation, including housing inflation, under control.
- National Debt 2021-04-26 14:40 expressed concern about government spending and the overall federal debt including a lack of solid fiscal anchors. He further inquired about when the government would return to a balanced budget.
- Canada Emergency Wage Subsidy 2020-12-10 14:39 highlighted concerns that large corporations are taking advantaged of the wage subsidy while laying off workers.
- Tax Increase 2020-12-10 14:42 expressed concern that the government will have to increase taxes to account for higher spending, including capital gains taxes.
- Budget 2020-11-04 14:39 expressed concern the government had not tabled a budget in 2 years.
42nd Parliament, 1st Session
- Pollution Pricing 2019-06-17 14:34 inquired whether the government would follow-through on the carbon price that would drastically increase the cost of gas.
Anticipated Party Positions
- Mr. Poilievre has been vocal about inflation concerns and may continue to criticize policies associated with government spending and increasing deficit.
- The Member has been critical of the Government’s tax policy in the past, especially surrounding tax increases for small businesses. The Member may emphasize CPC tax policy positions, and argue for lowering corporate, small business and personal income tax rates.
- The CPC is expected to continue to advocate for an end to existing COVID-19 recovery measures, and for targeted support for sectors hardest hit, such as the hospitality and tourism sectors.
BQ Opposition Critic
Gabriel Ste-Marie
Joliette
Québec
Gabriel Ste-Marie was first elected in 2015 as the MP for Joliette and will be returning to his role of BQ Finance Critic for the 44th Parliament, 1st session.
Regarding Parliamentary committees, associations and delegations, Mr. Ste-Marie has significant experience from the 43rd Parliament as Vice-Chair of the Standing Committee on Finance (FINA). In addition to committees, Mr. Ste-Marie has served on numerous Parliamentary Associations and Interparliamentary Groups.
Mr. Ste-Marie focuses primarily on the Quebec economy and industry, public finance, the history of economics, and green energy. The Member supports putting a price on pollution, but has criticized the effectiveness of Carbon Pricing.
Work
Private Members’ Business
During the 43rd Parliament, 2nd Session, he brought forward Bill C-224 “An Act to amend An Act to authorize the making of certain fiscal payments to provinces, and to authorize the entry into tax collection agreements with provinces”. The bill was defeated at Report Stage on April 14, 2021.
During the 42nd Parliament, 1st Session, the MP brought forward private members motion M-42 Tax Avoidance which sought to “end the widespread tax avoidance practised by many shell companies set up in Barbados by Canadian companies”, by amending the Income Tax Act and Regulations. The motion was defeated on October 26, 2016.
Interventions
Standing Committee on Finance (FINA)
Mr. Ste-Marie made 582 interventions at the Standing Committee on Finance during the 2nd session of the 43rd Parliament. While Mr. Ste-Marie has participated in numerous other committees, a selection of some of the main topics covered during FINA can be found below.
Budget 2021
- The bulk of Mr. Ste-Marie’s interventions at FINA during the 2nd session of the 43rd Parliament were on the topic of Budget 2021. As part of these interventions, he introduced proposed amendments on behalf of his party. Several of these amendments concerned the structure of proposed COVID-19 benefits including addressing the potential impact on seasonal workers and looking at changing the date benefits would take effect. Mr. Ste-Marie also engaged with witnesses present for questioning related to Budget 2021. His questions covered a wide range of topics including fintech, securities regulation, tourism and business development among others.
COVID-19 Pandemic
- In addition to COVID-19 measures directly related to Budget 2021, Mr. Ste-Marie actively engaged on pandemic-related topics before FINA. This included the questioning of witnesses on topics ranging from pandemic supports for businesses to the impact of ecommerce growth resulting from the pandemic. One of the key positions Mr. Ste-Marie’s communicates in his interventions is that he is a strong supporter of the continuation of COVID-19 benefits where appropriate.
Federal-Provincial Fiscal Relations
- Mr. Ste-Marie intervened and commented extensively on his own Private Member’s Bill when it was presented at FINA (Bill C-224 “An Act to amend An Act to authorize the making of certain fiscal payments to provinces, and to authorize the entry into tax collection agreements with provinces”). The Bill, which would have the Government of Canada devolve some income tax processing responsibilities to Revenu Quebec, was clearly of great importance to him and his party given the interventions made. Among the issues related to the Bill that were discussed, he seemed quite taken with the public service employment implications for those in the regions of Quebec.
Question Period
The Member made 35 interventions during Question Period in the 43rd Parliament. Below is a selection of interventions of interest to Finance.
- Finance Sector 2021-06-11 11:35 expressed concern that the government is attempting to provide funding for a Canada-wide securities commission in Bill C-30 that would hurt Montreal’s financial sector.
- Childcare Funding 2021-04-21 15:01 inquired whether Quebec would receive funding for its existing childcare system.
- Health Transfers 2021-04-20 14:39 asked whether the government would increase its health transfers to Quebec.
- Single Tax Return 2021-04-14 14:59 asked whether the government would support Quebec residents filing a single tax return to allow Quebec to fight tax evasion.
- Budget 2020-11-20 11:37 expressed concern that the government had not provided a budget in almost 2 years.
- Canada Emergency Rent Program 2020-10-08 14:51 asked whether the government would help businesses who are unable to pay their rent, and who have either had to shut down or go into debt.
Anticipated Party Positions
- The BQ is expected to continue to push for Quebec interests and ensure they are considered at all levels.
- Mr. Ste-Marie may also continue to call for a single tax return for Quebec residents.
- The party has also committed to push for more government assistance for small businesses, including support for Quebec’s tourism and hospitality sector.
NDP Opposition Critic
Daniel Blaikie
Elmwood—Transcona
Manitoba
Daniel Blaikie was first elected as the MP for Elmwood-Transcona in 2015 and has since served in a number of positions including NDP Caucus Chair. During the 42nd Parliament, Mr. Blaikie occupied several roles within the NDP, including: International Trade Critic, Critic for Employment, Workforce Development & Disability Inclusion and Democratic Reform Critic.
The Member has experience with Parliamentary committees, associations and delegations. During the 42nd Parliament, he was Vice-Chair of the Special Committee on Economic Relationship between Canada and the United States (CAAM), as well as a member of the Standing Committee on International Trade (CIIT) and the Standing Committee on Procedure and House Affairs (PROC). In addition to committees, Mr. Blaikie has served on numerous Parliamentary Associations and Interparliamentary Groups.
Work
Private Members’ Business
During the 43rd Parliament, Mr. Blaikie introduced Bill C-212 “An Act to amend the Employment Insurance Act (special benefits)”. The bill sought to extend the maximum period for which benefits for illness, injury or quarantine may be paid from 15 weeks to 50. The bill was introduced and received First Reading on February 20, 2020, however never proceeded further and died on the Order Paper upon dissolution of Parliament in August 2021
Mr. Blaikie introduced a number of private members items during the 43rd and 42nd parliaments, however none were directly related to the Finance portfolio.
Interventions
Standing Committee on Procedure and House Affairs (PROC)
Mr. Blaikie made 371 interventions at the Standing Committee on Procedure and House Affairs during the 2nd session of the 43rd Parliament. Throughout these interventions Mr. Blaikie engaged with witnesses, spoke to amendments, and addressed the substance of topics before the committee. Many of his interventions were on topics related to Canada’s electoral process and related studies or legislation the committee was tasked with considering.
Standing Committee on International Trade (CIIT)
Mr. Blaikie made 285 interventions at the Standing Committee on International Trade during the 2nd session of the 43rd Parliament. Many of these interventions involved engagement with witnesses including the questioning of Minister Ng during Main Estimates. Otherwise, Mr. Blaikie’s comments covered several key areas including the implications of trade for Canadian agriculture, green tech and cultural industry. Many of the committee meetings Mr. Blaikie participated in concerned major Canadian trade event including CUMSA and Canada-UK negotiations.
Special Committee on the Economic Relationship Between Canada and the United States (CAAM)
Mr. Blaikie made 79 interventions at the Special Committee on the Economic Relationship Between Canada and the United States during the 2nd session of the 43rd Parliament. Most of his interventions were concerning the compatibility of further natural resource development with Canada’s environmental priorities.
Question Period
The Member intervened in Question Period 15 times during the 43rd Parliament. Interventions of interest to Finance can be found below.
43rd Parliament, 2nd Session
- Canada Recovery Benefit 2021-06-21 14:47 requested confirmation from the government that the benefit was being cut by 40%.
- Canada Recovery Benefit 2021-06-18 11:44 urged the government to confirm extending and maintain the current benefit level was an option and that they explain the decision to cut the budgets of Canadians who are struggling to make ends meet.
- Employment Insurance Benefits 2021-02-16 14:45 sought government commitment to extending the EI sickness benefit to 50 weeks and making it retroactive to January.
- Persons with Disabilities 2020-12-04 12:04 asked the government to work with the NDP to establish a new income support program which would lift all Canadians living with disabilities out of poverty.
Anticipated Party Positions
- While Mr. Blaikie has not spoken to significant finance-related issues, it is expected he will uphold the party’s positions, including policy to support all Canadians, and hold large corporations accountable.
- The NDP is expected to continue fighting against tax havens and loopholes, especially as it relates to large corporations.
- The party is expected to continue pushing for COVID-19 relief measures, while seeking to ensure the wealthiest, and those that have profited from the pandemic, pay their fair share.
Parliamentary Environment Analysis
Background
The following parliamentary environment analysis will provide an overview of key Finance related issues raised in the House of Commons since the beginning of the 1st Session of the 44th Parliament (i.e., since November 22, 2021).
Conservative Party (CPC)
CPC commentary on finance-related issues during the early days of the 44th Parliament has been critical of the Government. In terms of subject matter, it can be categorized into two broad themes: (1) economic trends occurring within the Canadian economy, and (2) government spending and benefits.
Within the first category (economic trends), CPC MPs have made extensive remarks about the impact of inflation on the affordability of goods and housing, arguing the Government has not done enough to combat inflation. Also within this category, CPC MPs have repeatedly highlighted labour shortages being faced by local businesses within their respective ridings and expressed criticism of the Government for not doing enough to combat these trends.
Within the second category (government spending and benefits), CPC MPs have made statements comparing current Government spending and debt to past governments, the latter of which they argued had taken a more fiscally conservative approach. In this regard, they suggested the current government was spending too much.
CPC MPs have also been critical of the format of COVID-19 support benefits for businesses. This includes taking issue with the format of the subsidies which they argued do not meet the needs of businesses and are not fraud-proof, and the lack of benefits for new businesses and individual cultural creators (e.g. musicians).
Finally, CPC MPs expressed concern with GIS repayment being required of seniors who received certain COVID-19 support benefits in error, and urged the Government to immediately rectify the matter.
CPC Potential Areas of Questioning
- Inflation
- Labour Shortages & Vacant Jobs
- High Level of Government Spending & Debt
- Business Supports Format (e.g. subsidy vs other formats, ability to trace transfers to prevent fraud)
- Business Supports for New Businesses and Self-Employed Cultural Creators (e.g. Musicians)
- GIS Repayment Issues
Bloc Québécois (BQ)
BQ MPs' comments have focused on three principal issues. First, they have consistently raised concerns over the lack of business supports for those who are self-employed cultural content creators such as musicians and artists. They argued these individuals should be explicitly supported within the range of proposed benefits. Second, many BQ MPs have been vocal on seniors issues. Specifically, they highlighted the lack of financial support for seniors aged 65-74 and objected to GIS repayment being required of some seniors who received COVID-19-related benefits. Finally, BQ MPs have touched on ongoing labour shortage and argued the Government should do more to address these ongoing concerns.
BQ Potential Areas of Questioning
- Business Supports for Self-Employed Cultural Creators (e.g. Musicians)
- Financial Support for Seniors 65-74 and GIS Repayment Issues
- Labour Shortages & Vacant Jobs
New Democratic Party (NDP)
The NDP’s commentary on finance-related matters has primarily focused on four key issues. First, NDP MPs have objected to reports that certain recipients of GIS and the CCB have been required to return the benefits as a result of their receipt of other COVID-19-related benefits. The NDP’s has argued for repayment requirements to be dropped immediately.
Second, NDP MPs have highlighted the ongoing labour shortage along with other parties. They suggested the problem was due to a mismatched labour force which could be resolved with an increase in skills training programs.
Third, several NDP MPs have taken issues with the format and criteria being pursued for certain COVID-19-related benefits. In particular, they have taken issue with the number of weeks of work currently required for EI, the strict definition of a lockdown as part of the lockdown benefit, and short timelines for repayment of loans under the Canada Emergency Business Account.
Finally, NDP MPs have also raised the issue of the lack of support for self-employed cultural content creators such as musicians. As with the other parties, they have indicated specific supports are needed for this group.
NDP Potential Areas of Questioning
- GIS and CCB Repayment
- Labour Shortage & Job Training
- Criteria for Business and Worker Supports
- Business Supports for Self-Employed Cultural Creators (e.g. Musicians)