
Briefing binder created for the Deputy Minister of Finance on the occasion of his appearance before the Standing Committee on Finance on December 7, 2023 on "Increases in the Cost of Buying or Renting a Home in Canada"
Table of Contents
- CMHC's Mortgage Insurance Fund
- Fall Economic Statement 2023 Housing Measures and Housing Announcements with Provinces and Territories
- Federal Investments in Non-profit Housing
- Foreign Homebuying
- G7 Comparisons
- Housing Affordability
- Housing Statistics
- Short-term Rentals
Background
The CMHC's Mortgage Insurance Fund
Issue
CMHC administers the government's mortgage insurance fund, providing insurance for a fee to private institutions involved in mortgage lending for Canadian housing.
Key Points
- Government-backed mortgage insurance provides first-time homebuyers and other Canadians access to mortgage credit.
- The Minister of Finance sets the minimum standards for mortgage insurance, and various adjustments have been made to support the stability of the housing market.
- Mortgage insurance is provided on a commercial basis by CMHC and two private mortgage insurers, Sagen and Canada Guaranty.
- The Office of the Superintendent of Financial Institutions oversees the risk management practices of these financial institutions.
- Legislated limits exist for both CMHC-insured and privately insured mortgage loans, and these limits are in place to enable Parliament oversight of taxpayer exposure.
- As of March 31, 2023, CMHC's insurance in force stood at $400 billion, well below the legislative limit of $750 billion.
Anticipated Questions and Answers
1. Why does the government guarantee the contracts of private mortgage insurers?
- The Government guarantees the contracts of private mortgage insurers to help provide choice to lenders and facilitate competition in the housing market.
- Private mortgage insurers provide an important buffer of private capital to draw from in the event of mortgage defaults before the Government steps in.
- Private mortgage insurers pay the Government of Canada for the guarantee they receive. These funds go into the Consolidated Revenue Fund and help to fund government programs. Private mortgage insurers pay the government for their guarantee ($33 million in respect of 2022).
Background
- The government has implemented several measures aimed at mitigating risks in the housing market and promoting long-term affordability and financial stability.
- In recent years, the government has introduced changes to the regulations for government-backed insured mortgages such as the mortgage stress test, debt serviceability limits, loan-to-value ratios, and maximum amortization periods. These changes are aimed at ensuring that Canadians only take on mortgages they can afford, and government-backed programs promote safer lending practices.
- The Office of the Superintendent of Financial Institutions (OSFI) also plays an important role. The mortgage insurers, including CMHC, follow OSFI's capital adequacy guidance, ensuring they maintain capital required to withstand economic and housing market downturns.
- The government aims to manage its exposure to the housing market, fostering competition and ensuring adequate access to housing finance for Canadians.
- The 'Mortgage Insurance Fund' properly refers to the government's public mortgage insurance, provided through CMHC. A separate legislation authorizes the Minister of Finance to guarantee mortgage loan contracts written by the two private mortgage insurers – Sagen and Canada Guaranty.
- CMHC administers two funds: The Mortgage Insurance Fund and the Mortgage-Backed Securities Guarantee Fund.
| As at March 31, 2023 | CMHC (Vol 1 – Table 11.8) (pg. 422, English) (pg. 434, French) |
Private mortgage insurers (Vol 1 – Table 11.6) (pg. 417, English) (pg. 429, French) |
Total |
|---|---|---|---|
| Legislative limit | 750 | 350 | 1,100 |
| Insurance-in-force | 400 | 261 | 661 |
|
N.B. CMHC legislative limit was temporarily increased at outset of the pandemic and reverts to pre-COVID level of $600B in 2025. |
|||
Fall Economic Statement 2023 Housing Measures and Housing Announcements with Provinces and Territories
Issue
The Fall Economic Statement 2023 announced new initiatives and funding to address housing affordability and to protect renters and homeowners. Through these and other measures, the federal government is working with other levels of governments to address housing needs.
Key Points
- Through Bill C-56, the government introduced a 100% Goods and Services Tax (GST) Rental Rebate for new purpose-built rental housing to incentivize the construction of more apartment buildings and other types of housing built for long-term rental accommodation.
- The Fall Economic Statement (FES) builds on these actions by providing an additional $15 billion in loan funding to support more purpose-built rentals and an additional $1 billion in contributions to build affordable housing units.
- The federal government is also supporting other levels of government to address housing needs. FES 2023 announced $50 million to support municipal enforcement of restrictions on short-term rentals, while cracking down on non-compliant short-term rentals by denying income tax deductions for expenses incurred to earn income from short-term rentals not being operated in compliance with provincial or municipal short-term rental prohibitions, or licensing, permitting or registration requirements on or after January 1, 2024. Over the last few months, the government has also announced several agreements under the $4 billion Housing Accelerator Fund.
- This is in addition to the billions committed to provinces and territories, through bilateral agreements for the Canada Housing Benefit, the Canada Community Housing Initiative, and funding for Provincial/Territorial housing priorities.
Anticipated Questions and Answers
1. Despite these investments, rents continue to rise. What is the government doing to address this?
- Addressing housing costs requires a national effort to which the government has committed over $82 billion through the 10-year National Housing Strategy launched in 2017. Investments through the Fall Economic Statement bring this total to over $98 billion.
- In addition to this strategy, and these recently announced incremental actions and investments, the federal government is continuing to call on provinces, territories, and municipalities to do everything they can to build more homes, faster.
- The Housing Accelerator Fund is designed specifically to do that. Through these agreements, municipalities are breaking down local zoning barriers and creating the conditions that will help to rapidly increase Canada's housing supply.
2. Why does funding announced in FES for the Apartment Construction Loan Program and the Affordable Housing Fund start in 2025-26?
- These are existing programs that have funding allocated to them already in 2023-24 and 2024-25. These funding top-ups, beginning in 2025-26, provide developers the time needed to plan for new projects that will be made possible through this funding.
- Of the total $25.75 billion over 11 years (2017-18 to 2028-29) already allocated to the Apartment Construction Loan Program prior to this investment, nearly $18 billion has been committed. The remainder is available to support future projects
- Of the over $13 billion over ten years (on a cash basis), beginning in 2017-18, already allocated to the Affordable Housing Fund prior to this investment, $7.49 billion has been committed. The remainder is available to support future projects.
3. Is the federal government trying to ban short-term rentals all together?
- The federal government is taking action to support provinces and municipalities that are cracking down on non-compliant short-term rentals. In other words, tax deductions in computing short-term rental income would be denied for those that operate either in provinces and municipalities where such short-term rentals are prohibited, or not in compliance with applicable provincial or municipal licensing, permitting or registration requirements for short-term rentals.
Background
Fall Economic Statement
- $15 billion in loan funding for purpose-built rentals under the Apartment Construction Loan Program (ACLP). This brings total program funding to over $40 billion, with the goal of supporting over 100,000 homes.
- $1 billion in contributions for the Affordable Housing Fund (AHF). This brings total program funding to over $14 billion, with the goal of supporting 60,000 new housing units and renewing / repairing another 240,000.
- $50 million to support municipal enforcement of restrictions on short-term rentals.
- Denial of expenses in computing income from a non-compliant short-term rental.
- $309 million in additional investments for the Co-Operative Housing Development Program.
- A mortgage charter, which highlights the tailored mortgage relief that the government expects banks to provide to borrowers who are facing financial difficulty with the mortgage on their principal residence.
Other Key Initiatives
- Up to $20 billion in additional low-cost financing available for rental projects through the Canada Mortgage Bond program. This measure will support the building of up to 30,000 new rental units a year.
- Through the Canada Lands Company, more than 29,000 new homes are set to be built on surplus federal lands by 2029. In addition, the Federal Lands Initiative, which heavily discounts the sale of federal properties for affordable housing, is on track to support 4,500 units–at least 30 per cent of which will be affordable.
- $4 billion Housing Accelerator Fund, which incents municipalities to break down local zoning barriers and create the conditions that will help to rapidly increase Canada's housing supply. This measure will support the creation of 100,000 new homes over four years.
- 11 agreements have been signed to date with 10 municipalities and the province of Quebec.
Bill C-56 – the Affordable Housing and Grocery Act
- In addition to introducing changes to the Competition Act to give more power to the Competition Bureau to respond to non-competitive behavior (e.g. price fixing or price gouging), it temporarily enhances the Goods and Services Tax (GST) Rental Rebate (to 100%) for new purpose-built rental housing, to incentivize the construction of more apartment buildings and other types of housing built for long-term rental accommodation.
Housing Announcements with Provinces and Territories
- Under the Housing Partnership Framework, the federal government has signed bilateral agreements with every province and territory outlining how they will work together to help make housing more affordable and accessible through the following initiatives: the Canada Housing Benefit, the Canada Community Housing Initiative, and funding for provincial and territorial housing priorities.
Federal Investments in Non-profit Housing
Issue
Federal investments in community/non-profit housing including to acquire and preserve the existing stock of affordable housing units so that they are not repriced or turned into more expensive projects.
Key Points
- The supply of rental apartments—and all types of housing—has not increased at the same pace as Canadians' housing needs. People are finding it difficult to find the types of rental homes they need at prices they can afford. Rental supply must increase to ensure that renters can find an affordable place to call home.
- Investments announced in the Fall Economic Statement 2023 support this goal. These include:
- A new investment of $309 million into a Co-Operative Housing Development Program, expected to be launched in early 2024;
- $1 billion in new funding for the Affordable Housing Fund; and
- Making co-operative housing corporations that provide long-term rental accommodation eligible for the removal of the GST on new rental housing.
Anticipated Questions and Answers
1. What does the federal government do to support non-profit affordable housing, and protect its existing stock?
- No federal government program directly supports the acquisition of existing affordable housing units.
- However, acquisitions are an eligible expense under other existing programs, such as the $4 billion Housing Accelerator Fund, and the $1.1 billion cost-matched funding to support Provincial/Territorial housing priorities.
- Several federal government initiatives aim to build more affordable homes faster, through new constructions and the repair or renovation of existing units. Doing so is a necessary condition to protecting affordable housing rents. To date, this work includes:
- the $14 billion Affordable Housing Fund, to build 60,000 new affordable homes and repair 240,000 homes;
- the $4 billion Rapid Housing Initiative, which is building more than 12,000 affordable homes for people experiencing homelessness or in severe housing need;
- the $200 million Federal Lands Initiative, to build 4,500 new homes by repurposing surplus federal lands and buildings to housing providers at low or no cost.
Background
In addition to programs announced in the Fall Economic Statement 2023, the National Housing Strategy programs below support the non-profit/community housing sector.
| Initiative | Existing Funding | Description |
|---|---|---|
| New Construction and Modernized Housing Supply | ||
| Housing Accelerator Fund | $4 billion Expires: 2026-27 |
Provides incentive funding to local governments encouraging initiatives aimed at increasing housing supply, with the goal of fast-tracking the creation of 100,000 new homes across the country. 1,814 units fast-tracked (Sept 2023) |
| Support for the Community Housing Sector | ||
| Federal Community Housing Initiative | $618.2 million Expires: 2027-28 |
Funding to support federally administered community housing projects reaching the end of their operating agreements from past social and affordable housing programs. The program has two phases:
47,211 units supported (Sept 2023) |
| Community Based Tenant Initiative | $10 million Expired: 2022-23 |
Funding for local organizations that assist people in housing need to enable participation in housing decision-making. 171 approved applicants (Sept 2023) |
| Community Housing Transformation Centre and Sector Transformation Fund | $68.6 million Expires: 2027-28 |
Technical assistance, tools and financial resources to housing providers. |
| Federal/Provincial/Territorial Initiatives | ||
| Canada Community Housing Initiative | $8.6 billion (including $4.3 billion in PT cost matching) Expires: 2027-28 |
Funding to PTs to provide ongoing support to community housing providers delivering subsidized housing. |
| P/T Priorities Funding | $2.2 billion (including $1.1 billion in PT cost-matching) Expires: 2027-28 |
Funding to address housing priorities including affordability, repair and construction. |
| Legacy Social Housing Funding | ||
| Funding under long-term commitments for existing social housing on- and off reserve | $11.17 billion Expires: 2037-2038 |
Through long-term operating agreements, the federal government renews investments to protect low-income households and stabilize housing provider operations. |
Foreign Homebuying
Issue
The government has taken action to curtail foreign demand for Canadian housing, given concerns that foreign buyers may contribute to pricing some Canadians out of the housing market.
Key Points
- To help ensure that houses are used as homes for Canadians to live in, not financial assets for foreign investors, the government introduced a two-year ban on foreign investment in housing, effective January 1, 2023.
- The ban prohibits people who are neither Canadian citizens nor permanent residents from directly or indirectly purchasing residential property in Canada and establishes penalties for contravention.
- To help ensure that foreign, non-resident owners of underused Canadian housing, pay their fair share of Canadian tax and that housing in Canada is available for the use of Canadians, the government also implemented a national, annual 1 per cent "Underused Housing Tax" (UHT), effective January 1, 2022.
- The UHT applies to residential property in Canada that is owned directly or indirectly, whether in whole or in part, by non-resident, non-Canadians, and is considered vacant or underused.
Anticipated Questions and Answers
1. How effective is the ban? How is it performing?
- The purpose of the ban is to curb foreign demand for Canadian housing, and we expect that it is preventing certain transactions from occurring.
- The government continues to monitor the ban, including its role as one of numerous actions being taken to improve housing affordability for Canadians.
2. Is there any evidence that shows the UHT will improve housing affordability in Canada?
- The Department has no evidence that the Underused Housing Tax (UHT), on its own, will directly impact housing affordability in Canada. However, the UHT is just one among many housing measures the government has introduced. Taken together, the government believes these housing measures will result in improved housing affordability for Canadians.
Background
Foreign Buyer Ban
- In Budget 2022, the government announced its intent to prohibit non-Canadians from purchasing residential property in Canada for two years.
- Legislation to implement the ban, the Prohibition on the Purchase of Residential Property by Non-Canadians Act, came into force on January 1, 2023. Supporting regulations establish exceptions and definitions necessary to fully implement the legislation, as passed by Parliament.
- On March 27, 2023, the government amended the regulations to enhance the ability of newcomers and businesses looking to add to housing supply in Canada, and to further support those seeking to build a life in Canada by pursuing home ownership in their communities.
- The Minister of Housing is responsible for the legislation and regulations implementing the ban. The Canada Mortgage and Housing Corporation administers the ban, including by providing informational resources to industry.
Underused Housing Tax
- The UHT originated from a 2019 election platform commitment of the government. In Budget 2021, the government announced its intention to implement the UHT effective beginning in the 2022 calendar year.
- Legislation to enact the Underused Housing Tax Act was included in the Economic and Fiscal Update Implementation Act, 2021, which received royal assent on June 9, 2022.
- The UHT applies on a calendar year basis to the person that is the legal owner of a "residential property" on December 31 of the calendar year.
- Certain owners are excluded from the scope of the UHT including Canadian citizens and permanent residents of Canada that own residential property directly in their own right.
- All other owners are required to file an annual UHT return in respect of each residential property they own. However, in this return, they may be eligible to claim an exemption from the tax. There are a wide range of exemptions (e.g., if the property is being rented out on a long-term basis or is a vacation property in a qualifying area of Canada).
- The 2022 UHT returns were due on April 30, 2023. However, given a lack of public awareness and understanding of the UHT, on March 27, 2023, the CRA announced it would waive penalties and interest for six months, effectively extending the filing deadline to October 31, 2023. On October 31, 2023, the CRA extended this relief to April 30, 2024.
- As a result, both the 2022 and 2023 UHT returns are due on April 30, 2024.
- On November 21, 2023, the government proposed several changes to the UHT to help facilitate compliance, while ensuring that the tax continues to apply as intended. Draft legislative and regulatory proposals were released on the Department of Finance website for consultation until January 3, 2024. Stakeholder reaction to the changes has been positive.
G7 Comparisons
Issue
How Canada compares to its G7 peers on key macroeconomic and fiscal data.
Key Points
Canada's macroeconomic performance compares well against its G7 peers.
- Canada has had the strongest employment recovery since the pandemic.
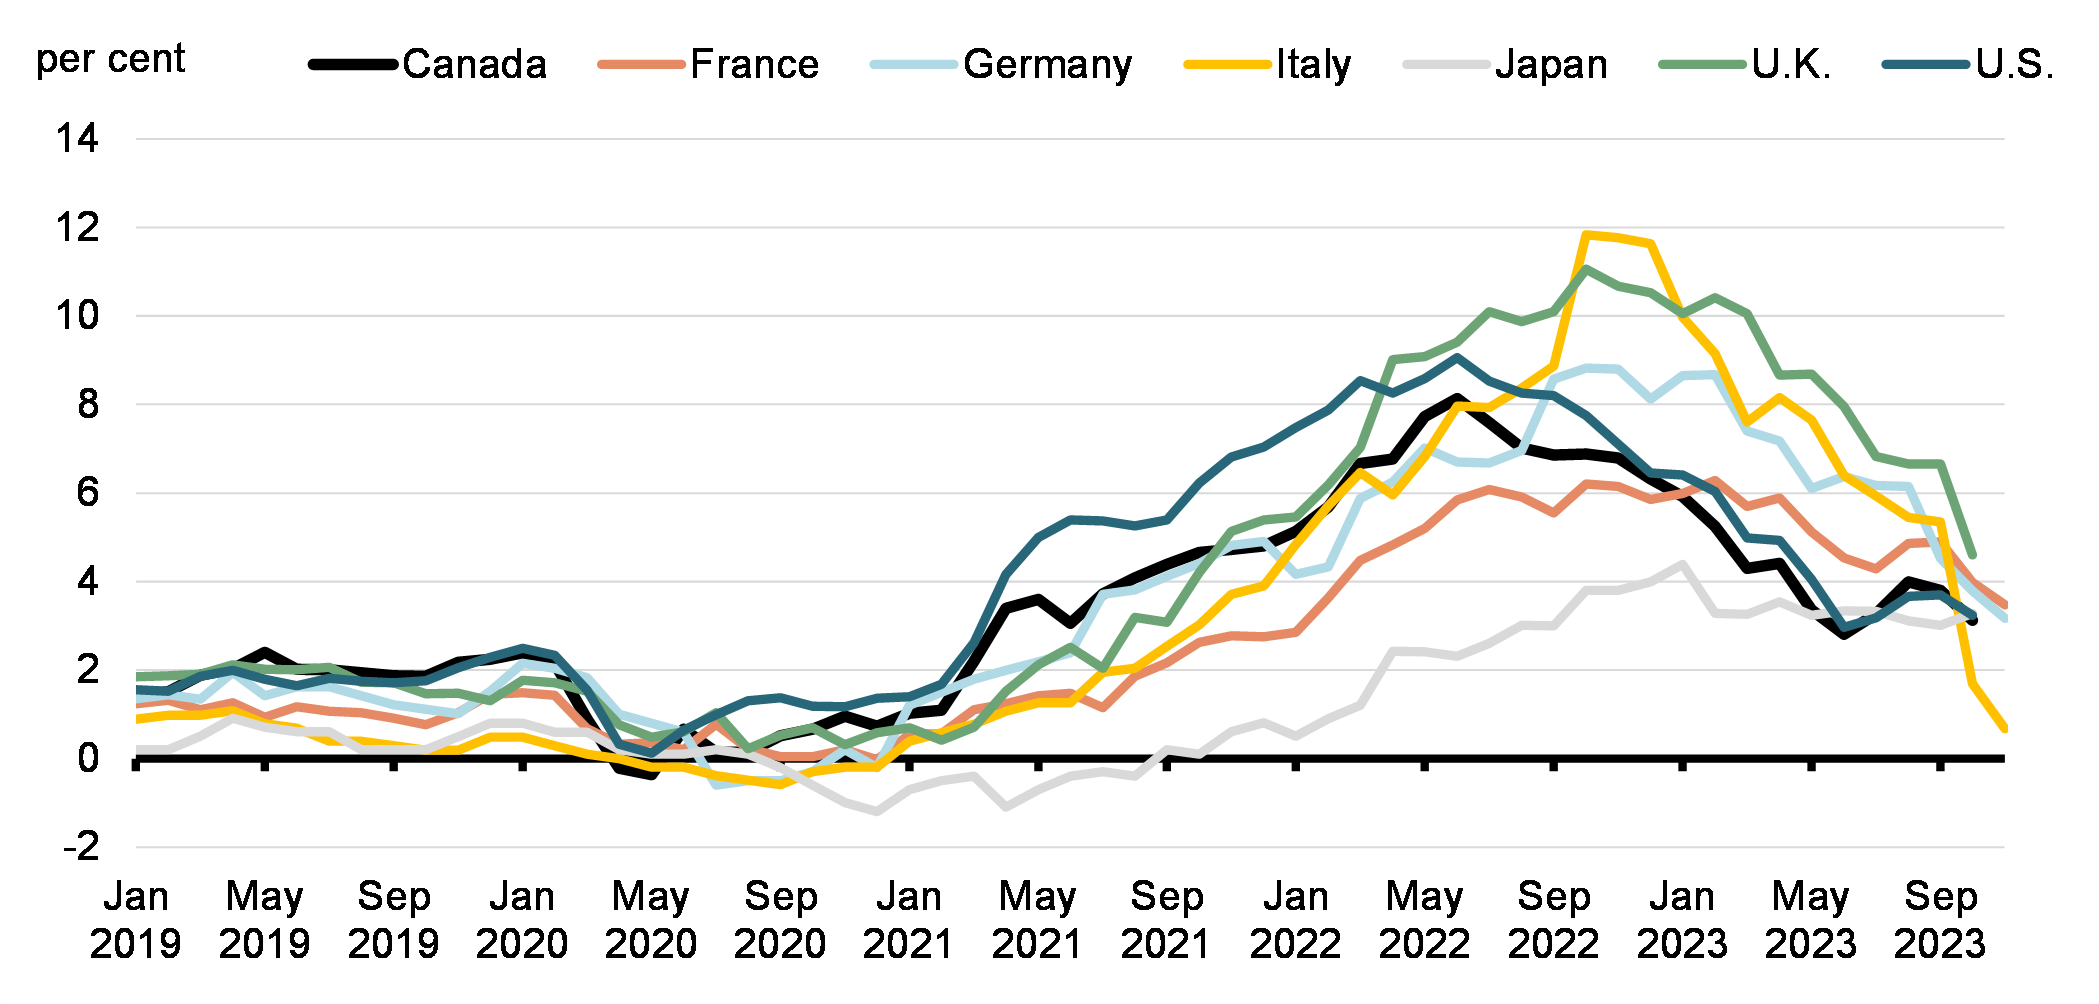
- Over the last year, Canada had one of the lowest rates of inflation among the G7.
- Canada has had the second strongest real GDP recovery since the pandemic.
- Canada is expected to see the fastest growth in the G7 next year, according to the IMF.
Canada is also expected to maintain its fiscal advantage in the G7 with the lowest general government deficit and net debt ratios, according to IMF projections.
Background
| Latest | |
|---|---|
| Canada | 5.7 |
| France | 4.8 |
| U.S. | 3.0 |
| Germany | 2.9 |
| Italy | 2.8 |
| U.K. | -0.3 |
| Japan | -0.2 |
|
Note: Latest data points are: November 2023 (Canada), October 2023 (U.S., Germany, Italy, Japan), June 2023 (U.K.), and 2023Q3 (France). |
|
| September | October* | November | |
|---|---|---|---|
| U.K. | 6.7 | 4.6 | -- |
| France | 4.9 | 4.0 | 3.4 |
| Germany | 4.5 | 3.8 | 3.2 |
| Japan | 3.0 | 3.3 | -- |
| United States | 3.7 | 3.2 | -- |
| Canada | 3.8 | 3.1 | -- |
| Italy | 5.3 | 1.7 | 0.8 |
| *Ranked by October reading | |||
G7 Headline CPI Inflation
| %, quarterly change at annual rate | % change* | ||||
|---|---|---|---|---|---|
| 23Q1 | 23Q2 | 23Q3 | 19Q4-20Q2 | 19Q4-23Q3 | |
| U.S. | 2.2 | 2.1 | 5.2 | -9.1 | 7.4 |
| Canada | 2.5 | 1.4 | -1.1 | -12.7 | 4.2 |
| Italy | 2.3 | -1.5 | 0.4 | -17.0 | 3.4 |
| Japan | 3.7 | 4.5 | -2.1 | -7.5 | 2.4 |
| U.K. | 1.3 | 0.8 | -0.1 | -22.5 | 1.8 |
| France | 0.2 | 2.5 | -0.5 | -17.7 | 1.7 |
| Germany | 0.0 | 0.6 | -0.5 | -10.8 | 0.3 |
| *Ranked by 19Q4 to 23Q3 growth | |||||
| Current Projection* | |||
|---|---|---|---|
| 2022 | 2023 | 2024 | |
| Canada | 3.4 | 1.3 | 1.6 |
| U.S. | 2.1 | 2.1 | 1.5 |
| France | 2.5 | 1.0 | 1.3 |
| Japan | 1.0 | 2.0 | 1.0 |
| Germany | 1.8 | -0.5 | 0.9 |
| Italy | 3.7 | 0.7 | 0.7 |
| U.K. | 4.1 | 0.5 | 0.6 |
| *Ranked by 2024 projection IMF World Economic Outlook (October 2023) | |||
| 2019 | 2020 | 2021 | 2022 | 2023 | 2024 | 2025 | 2026 | 2027 | 2028* | |
|---|---|---|---|---|---|---|---|---|---|---|
| Canada | -0.02 | -10.9 | -4.4 | -0.8 | -0.7 | -0.6 | -0.5 | -0.4 | -0.3 | -0.2 |
| Germany | 1.5 | -4.3 | -3.6 | -2.5 | -2.9 | -1.7 | -0.9 | -0.6 | -0.5 | -0.5 |
| Italy | -1.5 | -9.7 | -9.0 | -8.0 | -5.0 | -4.0 | -3.3 | -2.7 | -2.7 | -2.5 |
| Japan | -3.0 | -9.1 | -6.2 | -6.9 | -5.6 | -3.7 | -2.6 | -2.7 | -2.9 | -3.3 |
| U.K. | -2.2 | -13.0 | -8.3 | -5.5 | -4.5 | -3.9 | -3.7 | -3.7 | -3.5 | -3.5 |
| France | -3.1 | -9.0 | -6.5 | -4.8 | -4.9 | -4.5 | -4.0 | -3.6 | -3.5 | -3.6 |
| U.S. | -5.7 | -14.0 | -11.6 | -3.7 | -8.2 | -7.4 | -7.4 | -7.0 | -6.7 | -7.0 |
| G7 Average | -3.8 | -11.6 | -9.1 | -4.1 | -6.5 | -5.6 | -5.3 | -5.0 | -4.8 | -5.0 |
|
*Ranked by 2028 projection. Note: On a general government basis and National Accounting basis, Canada as a whole was near balance in 2019 (it reflected near-balanced budgetary balances at the federal, provincial and territorial, and local and aboriginal levels and the usual surplus at the CPP/QPP level). Source: IMF WEO (October 2023). |
||||||||||
| 2019 | 2020 | 2021 | 2022 | 2023 | 2024 | 2025 | 2026 | 2027 | 2028* | |
|---|---|---|---|---|---|---|---|---|---|---|
| Canada | 8.5 | 15.7 | 15.4 | 14.2 | 14.6 | 14.6 | 14.5 | 14.4 | 14.2 | 13.8 |
| Germany | 40.7 | 46.1 | 47.2 | 45.8 | 46.5 | 45.7 | 44.4 | 43.2 | 42.4 | 41.7 |
| U.K. | 74.6 | 93.6 | 94.1 | 98.9 | 99.0 | 99.6 | 97.2 | 96.7 | 96.5 | 96.5 |
| France | 88.9 | 101.2 | 100.4 | 101.4 | 99.6 | 100.1 | 100.0 | 100.0 | 100.1 | 100.4 |
| U.S. | 83.1 | 98.3 | 98.3 | 95.1 | 96.7 | 100.7 | 104.0 | 106.6 | 109.0 | 111.6 |
| Italy | 121.7 | 141.5 | 137.4 | 132.7 | 132.6 | 132.5 | 132.4 | 131.9 | 131.3 | 130.6 |
| Japan | 151.7 | 162.3 | 156.7 | 161.5 | 158.5 | 155.8 | 154.0 | 153.5 | 153.2 | 153.2 |
| G7 Average | 86.2 | 99.9 | 97.8 | 95.3 | 95.7 | 97.5 | 98.9 | 100.1 | 101.3 | 102.9 |
|
*Ranked by 2028 projection. Source: IMF WEO (October 2023). |
||||||||||
| 2019 | 2020 | 2021 | 2022 | 2023 | 2024 | 2025 | 2026 | 2027 | 2028* | |
|---|---|---|---|---|---|---|---|---|---|---|
| Germany | 59.5 | 68.7 | 69.0 | 66.1 | 65.9 | 64.0 | 61.8 | 59.9 | 58.6 | 57.5 |
| Canada | 90.2 | 118.9 | 115.1 | 107.4 | 106.4 | 103.3 | 100.6 | 98.6 | 96.6 | 94.7 |
| U.K. | 84.5 | 104.6 | 105.2 | 101.9 | 104.1 | 105.9 | 107.3 | 108.5 | 108.2 | 108.2 |
| France | 97.4 | 114.7 | 113.0 | 111.8 | 110.0 | 110.5 | 110.4 | 110.4 | 110.5 | 110.8 |
| U.S. | 108.7 | 133.5 | 126.4 | 121.3 | 123.3 | 126.9 | 130.3 | 132.9 | 135.1 | 137.5 |
| Italy | 134.2 | 154.9 | 149.9 | 144.4 | 143.7 | 143.2 | 142.8 | 141.9 | 141.0 | 140.1 |
| Japan | 236.4 | 258.6 | 255.1 | 260.1 | 255.2 | 251.9 | 250.6 | 251.1 | 251.9 | 252.8 |
| G7 Average | 118.3 | 140.4 | 133.9 | 128.0 | 127.8 | 128.9 | 130.5 | 131.7 | 132.8 | 134.3 |
|
*Ranked by 2028 projection. Canada was ranked third in 2022, the latest year for which actual data are available. It is projected to remain third this year before climbing to the second rank from 2024 onward. Source: IMF WEO (October 2023). |
||||||||||
Housing Affordability
Issue
Federal investments in housing supply and affordability supports.
Key Points
- No single measure will solve Canada's housing affordability challenge, yet we know that building more supply faster is key. And this will require a great national effort.
- For its part, the federal government has committed over $82 billion through the National Housing Strategy to build a new generation of housing in Canada. This includes the $4 billion Housing Accelerator Fund, which addresses systemic barriers to scaling up supply in Canada with the goal of creating at least 100,000 new homes in four years.
- The Fall Economic Statement builds on this with an additional $15 billion in loan funding for purpose-built rentals under the Apartment Construction Loan Program and $1 billion under the Affordable Housing Fund. With previous investments, these programs will deliver 160,000 new homes and repair and renew another 240,000.
- The government is also directly supporting individuals to afford their home. The recently released Mortgage Charter will ensure banks are working with Canadians so they can afford their mortgages. Through the Canada Housing Benefit the government is cost matching $2 billion in PT rent relief funding to households in need.
Anticipated Questions and Answers
1. How does the Fall Economic Statement get Canada closer to housing affordability?
Among other actions, the Fall Economic Statement 2023 proposes:
- $15 billion in loan funding for purpose-built rentals under the Apartment Construction Loan Program. This brings total program funding to over $40 billion, with the goal of supporting over 100,000 homes.
- $1 billion in contribution funding to help build affordable housing units under the Affordable Housing Fund. This brings total program funding to over $14 billion, with the goal of supporting 60,000 new housing units and renewing / repairing another 240,000.
These actions build on recently announced measures, such as removing the Goods and Services Tax (GST) from new purpose-built rental housing projects, including Co-Ops, and unlocking up to $20 billion in additional low-cost financing available for rental projects.
This year, the government also launched the $4 billion Housing Accelerator Fund. To date, 11 agreements have been signed. Through these agreements, municipalities are breaking down local zoning barriers and creating the conditions that will help to rapidly increase Canada's housing supply.
2. Why does funding for the Apartment Construction Loan Program and the Affordable Housing Fund start in 2025-26?
These are existing programs that have funding allocated to them already in 2023-24 and 2024-25. These funding top-ups, beginning in 2025-26, provide developers the time needed to plan for new projects that will be made possible through this funding.
Of the total $25.75 billion over 11 years already allocated to the Apartment Construction Loan Program (2017-18 to 2028-29) prior to this investment, nearly $18 billion has been committed. The remainder is available to support future projects.
Of the over $13 billion over ten years (on a cash basis), beginning in 2017-18, already allocated to the Affordable Housing Fund prior to this investment, $7.49 billion has been committed. The remainder is available to support future projects.
Background
The National Housing Strategy includes the programs below. Amounts have been updated to reflect funding proposed in the Fall Economic Statement 2023. With these amounts, the Strategy would represent $98+ billion with goals including the creation of nearly 200,000 new housing units and repairing 300,000 housing units (not characterized as such in FES 2023).
Initiative |
Existing Funding |
Description |
|---|---|---|
New Construction and Modernized Housing Supply |
||
Affordable Housing Innovation Fund |
$759.1 million Expires: 2027-28 |
Loans, forgivable loans, contributions, and financing options that support the development of innovative approaches to affordable housing.
26,639 units committed (Sept 2023) |
Apartment Construction loan program (formerly Rental Construction Financing Initiative) |
$40.75 billion Expires: 2031-32
|
Low-cost loans to incentivize the construction of 100,000 purpose-built rental housing that meets minimum affordability, energy efficiency and accessibility requirements.
46,968 units committed (Sept 2023) |
Affordable Housing Fund (formerly National Housing Co‑Investment Fund) |
$14.17 billion
|
Low-cost loans and contributions for the construction of 60,000 new housing, as well as the renovation of existing stock (240,000). All projects must meet minimum affordability, energy efficiency and accessibility requirements. 31,589 units committed (Sept 2023) Nearly 128,959 repairs committed (Sept 2023) |
Rapid Housing Initiative |
$4 billion Expires: 2023-24 |
Contributions to facilitate the rapid creation of up to 12,000 new permanent affordable, supportive, or transitional housing units for vulnerable Canadians.
15,612 units committed (Sept 2023) |
Federal Lands Initiative |
$202 million Expires: 2027-28 |
Transfer of surplus federal lands and buildings to housing providers at low- or no-cost for the creation of affordable housing.
3,393 units committed (Sept 2023) |
Housing Accelerator Fund*
|
$ 4 billion Expires: 2026-27 |
Provides incentive funding to local governments encouraging initiatives aimed at increasing housing supply, with the goal of fast-tracking the creation of 100,000 new homes across the country.
1,814 units fast-tracked (Sept 2023)
|
Support for the Community Housing Sector |
||
Federal Community Housing Initiative |
$618.2 million Expires: 2027-28 |
Funding to support federally administered community housing projects reaching the end of their operating agreements from past social and affordable housing programs. The program has two phases:
47,211 units supported (Sept 2023)
|
Community Based Tenant Initiative |
$10 million Expired: 2022-23 |
Funding for local organizations that assist people in housing need to enable participation in housing decision-making.
171 approved applicants (Sept 2023)
|
Community Housing Transformation Centre and Sector Transformation Fund |
$68.6 million Expires: 2027-28 |
Technical assistance, tools and financial resources to housing providers.
|
Reaching Home – Canada's Homelessness Strategy |
||
Reaching Home |
Nearly $4 billion Expires: 2027-28 |
A community-based program aimed at preventing and reducing homelessness that provides funding to urban, Indigenous, rural, and remote communities to help them address their local homelessness needs.
As of Sept 2023, 59,309 people placed in more stable housing; 108,965 people who received shelter or shelter diversion services
|
Improving Homeownership Options |
||
First-Time Home Buyer Incentive |
$1.25 billion Expires: 2023-24 |
Launched September 2019, a shared-equity mortgage with the Government of Canada that helps qualified first-time homebuyers reduce their monthly mortgage payments without adding to their financial burdens. |
Shared Equity Mortgage Providers Fund |
$100 million Expires: 2023-24 |
Repayable pre-construction loans and loans to shared equity mortgage providers to provide shared-equity mortgages to eligible first-time home buyers to help eligible Canadians achieve affordable homeownership. |
Human Right-Based Approach to Housing |
||
National Housing Council |
$63 million Expires: 2027-28 |
Will further housing policy by providing advice to the Minister of Housing on the effectiveness of the NHS with the goal of improving housing outcomes. |
Federal Housing Advocate |
The Federal Housing Advocate has a mandate that includes consulting with vulnerable groups and working with those affected by systemic housing issues. |
|
Data, Innovation, and Research |
||
Housing Supply Challenge |
$300 million Expires: 2024-25 |
Launched in 2020, an innovative program that invites citizens, stakeholders and experts to propose solutions to the barriers to new housing supply. |
Innovation, Research, and Data Initiatives |
$241 million Expires: 2027-28 |
Enhancing research and data collection to better understand Canada's housing markets, fill data gaps and encourage more external housing-related research. |
Federal/Provincial/Territorial Initiatives |
||
Canada Community Housing Initiative |
$8.6 billion (including $4.3 billion in PT cost matching) Expires: 2027-28 |
Funding to PTs to provide ongoing support to community housing providers delivering subsidized housing. |
Support for Northern Housing |
$300 million Expires: 2027-28 |
Stable and predictable funding to territorial governments to help offset the higher cost of construction in the north and improve housing conditions. |
Canada Housing Benefit |
$4 billion (including $2.0 billion in PT cost-matching)
(Excludes $583.6 million for the one-time top-up to the Canada Housing Benefit and $315 million provided in B21 for women and children fleeing violence)
Expires: 2027-28 |
Direct support to households in housing need, delivered by PTs. |
P/T Priorities Funding |
$2.2 billion (including $1.1 billion in PT cost-matching) Expires: 2027-28 |
Funding to address housing priorities including affordability, repair and construction. |
Legacy Social Housing Funding |
||
Funding under long-term commitments for existing social housing on- and off reserve |
$11.17 billion Expires: 2037-2038 |
Through long-term operating agreements, the federal government renews investments to protect low-income households and stabilize housing provider operations. |
Background on Housing Statistics
Activity and Prices
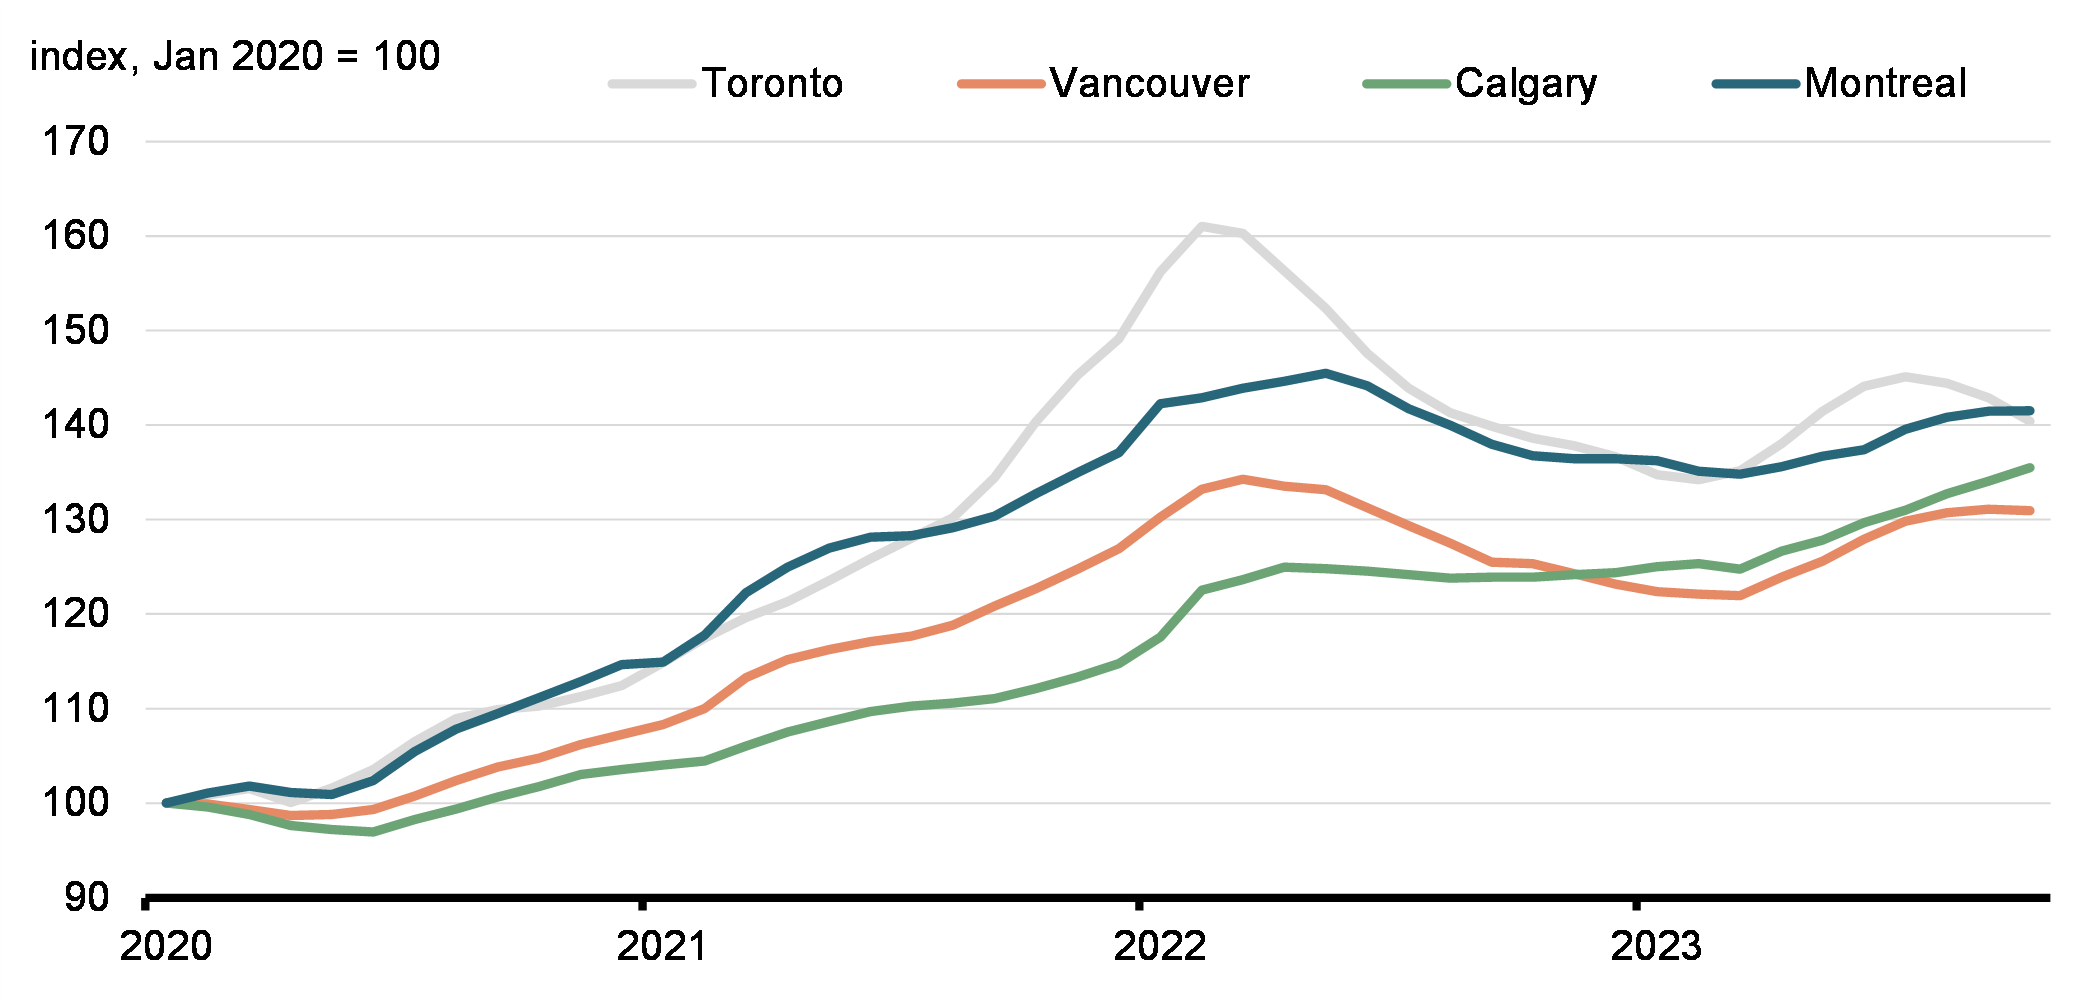
- After peaking 56% above 2019 levels in 2022, housing re-sales now sit 13% below their 2019 levels. Sales have fallen for four straight months after a short-lived recovery during the spring.
- Canada's housing market has moved from sellers' territory into "balanced" conditions at the national level, with sales-to-new-listings at 50%, compared to 85% during the peak in 2022. Ontario and B.C. have seen the most loosening and are now in or close to buyer's territory, while other areas remain more resilient, particularly the Prairies.
- Resale prices are still 38% above their February 2020 levels but down from +55% at the peak in 2022. Prices have declined for the last two months and are expected to ease further over the next several months given loose conditions in Ontario and B.C.
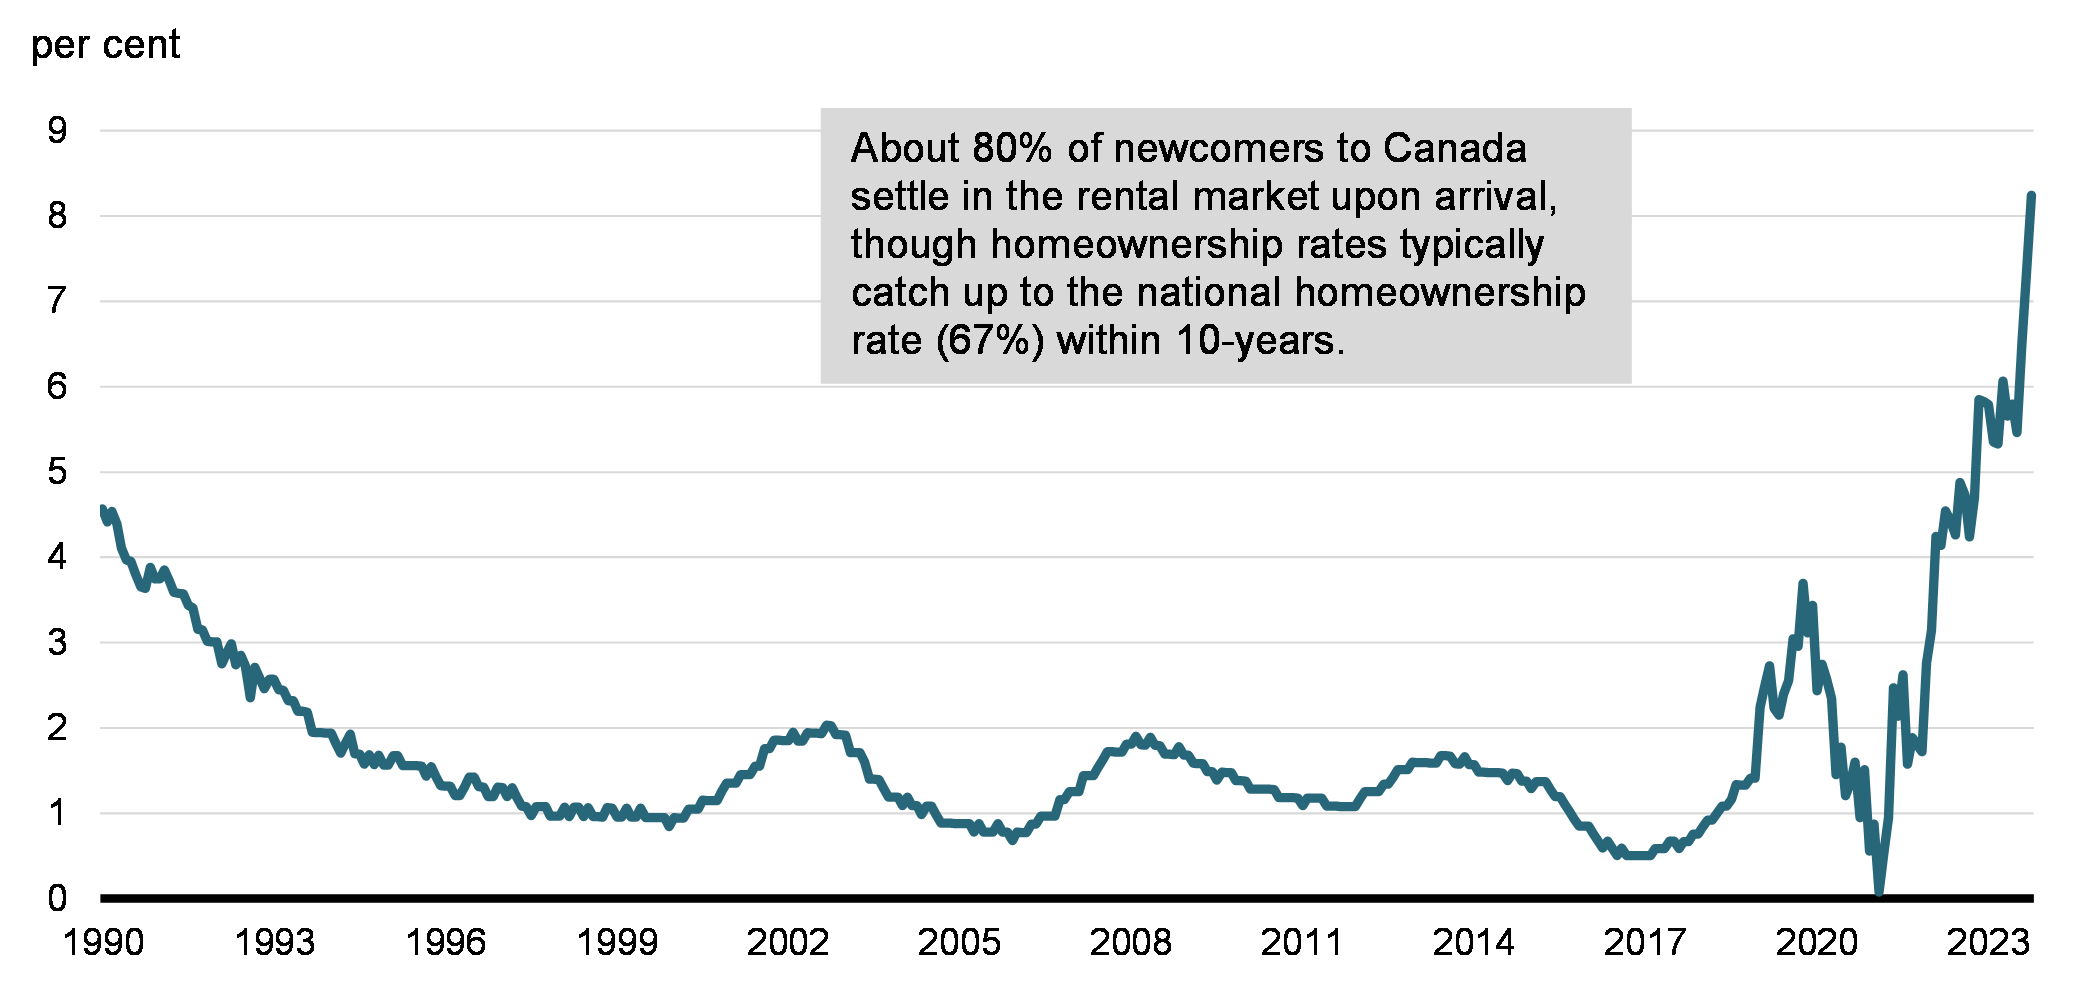
- With strong demand from aspiring homeowners and rising number of new immigrants, the national rental vacancy rate reached 1.9% in 2022, its lowest level since 2001.
- Average asking rents across Canada increased 9% year-over-year in October and 34% since 2019 (rentals.ca). Halifax (46%), Calgary (45%) and Vancouver (42%) have seen the largest rent increases since 2019.
- Year-over-year rent increases in the consumer price index have been more moderate because it considers new as well as existing leases, but recently accelerated to 8.2% in October, the highest pace in several decades.
Activity by Market Segments
- In 2023Q1, first-time home buyers accounted for 43% of sales, repeat buyers were at 27% and investors at 30% (Bank of Canada).
- The share of first-time home buyers has fallen from its pre-pandemic level of 48%, while repeat buyers also represent a lower share (31%) as upgrades are becoming more expensive.
- The share of investors has increased relative to pre-pandemic (21%), although this is expected to fall as mortgage rates and rents have increased the monthly carrying costs.
- The share of investors (including corporations) has reached up to 40% for condos in Ontario and B.C. and up to 90% for multi-units in Ontario (Statistics Canada's Canadian Housing Statistics Program, 2020).
- The share of homes purchased and then flipped within 6 months has remained low, at no higher than 1.25% of total national sales.
- Calgary and Vancouver have the highest share of sales by flippers (2.4% and 2.0% as of 2023Q2) (Bank of Canada, Teranet).
Affordability
- The Bank of Canada's affordability index, which represents what a typical household would put towards housing related expenses as a share of its disposable income, sits at 50% – its highest level since 1990. Affordability has significantly deteriorated as buyers grapple with higher mortgage rates and still-high home prices.
- Prior to 2020, this affordability ratio reached a low of 27% in the early 2000s, has averaged 34% between 2010 and 2019, and was at 36% in 2019.
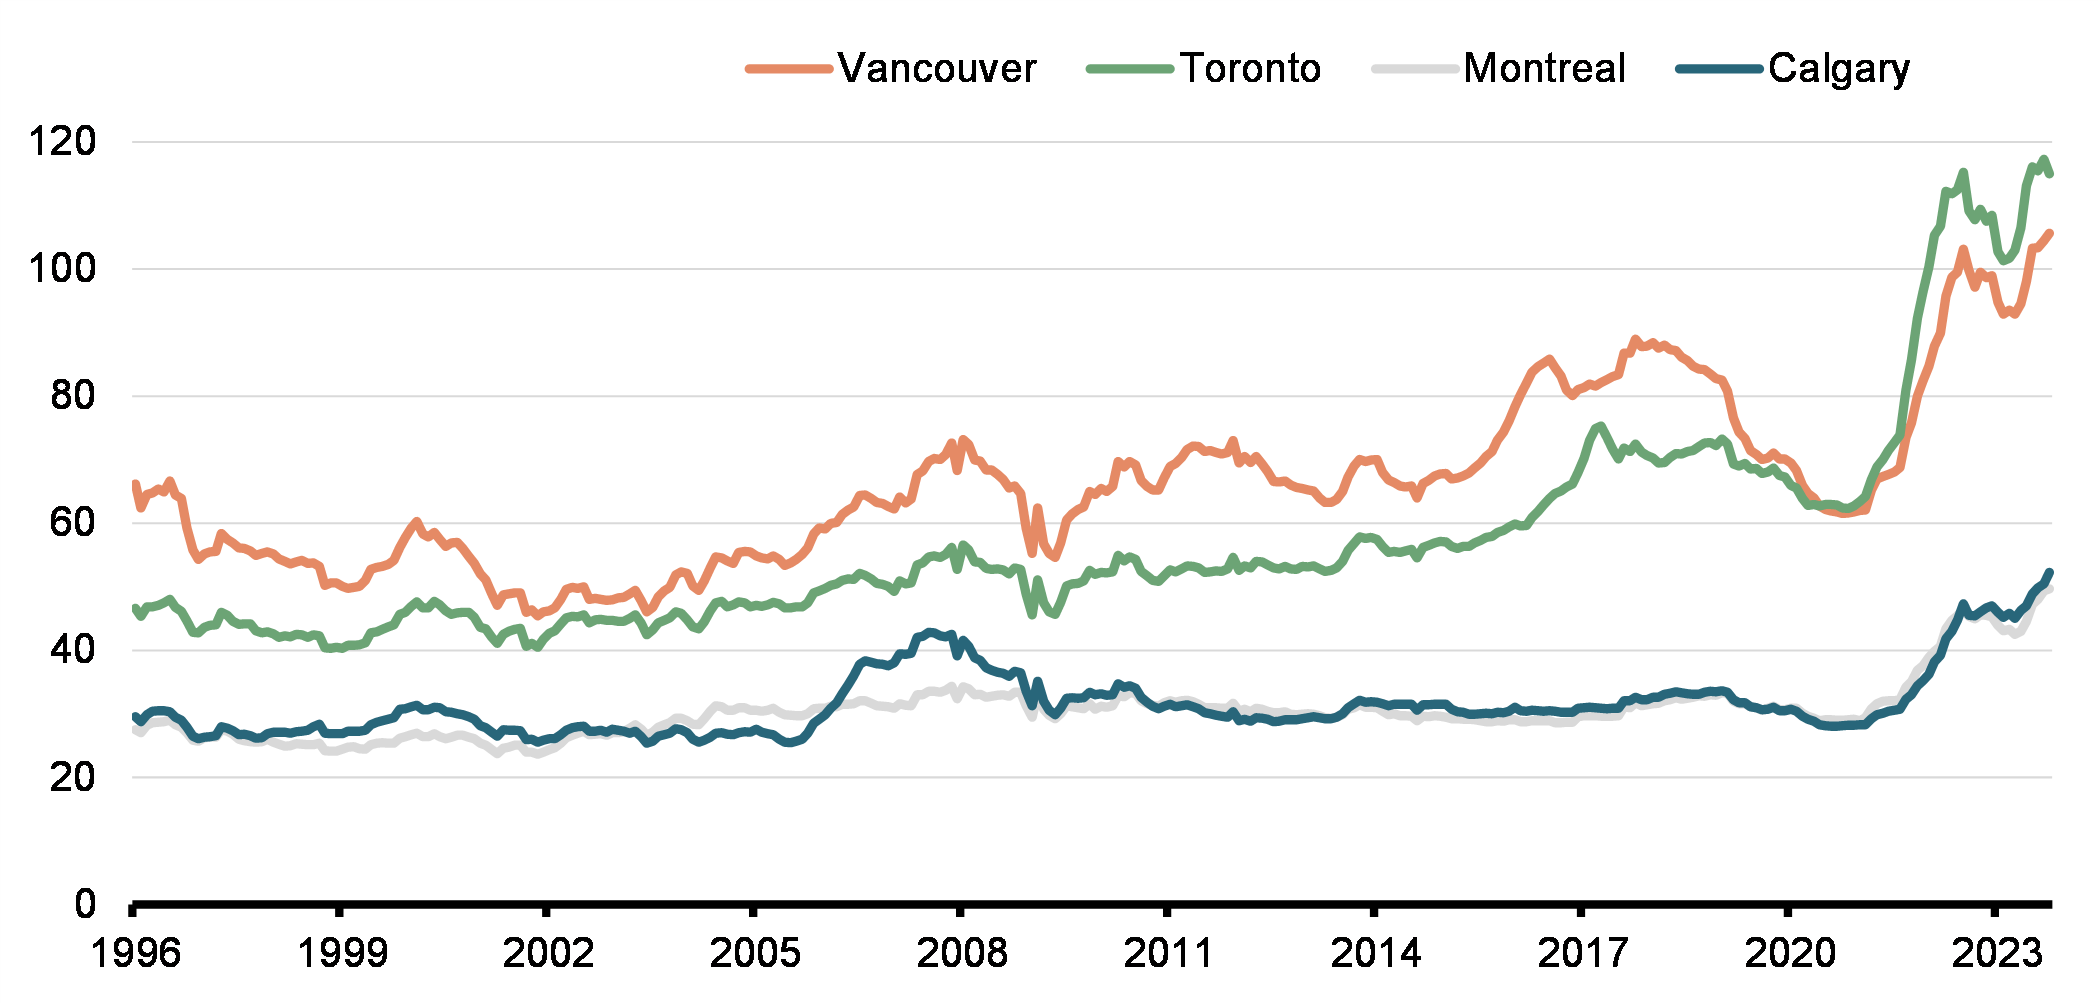
- Based on internal calculations, unaffordability is much worse in Toronto (115% ratio) and Vancouver (106% ratio) compared to the rest of the country (in the 40-50% range in other major CMAs).
- While the cost-to-income ratio started notably picking up in 2016 in both cities, there was a sharp deterioration over the pandemic, with Toronto surpassing Vancouver as the least affordable city since 2020.
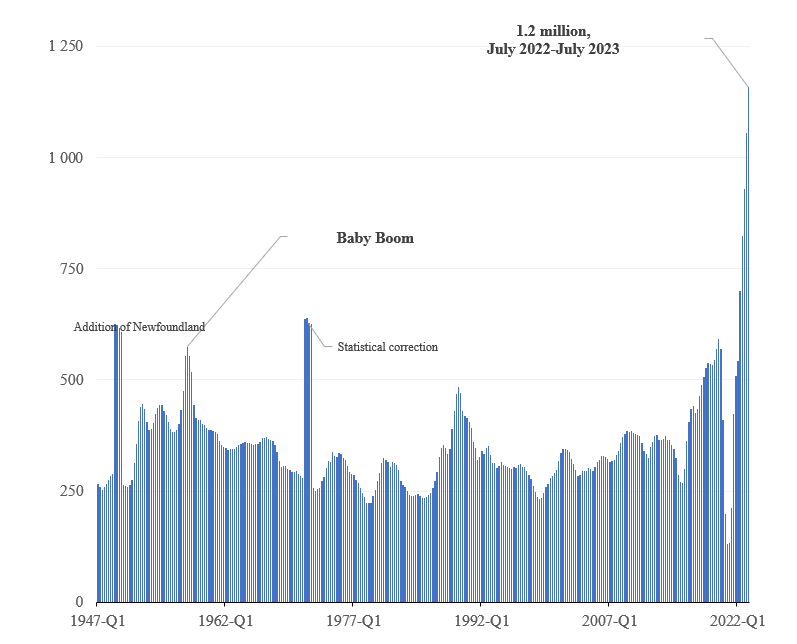
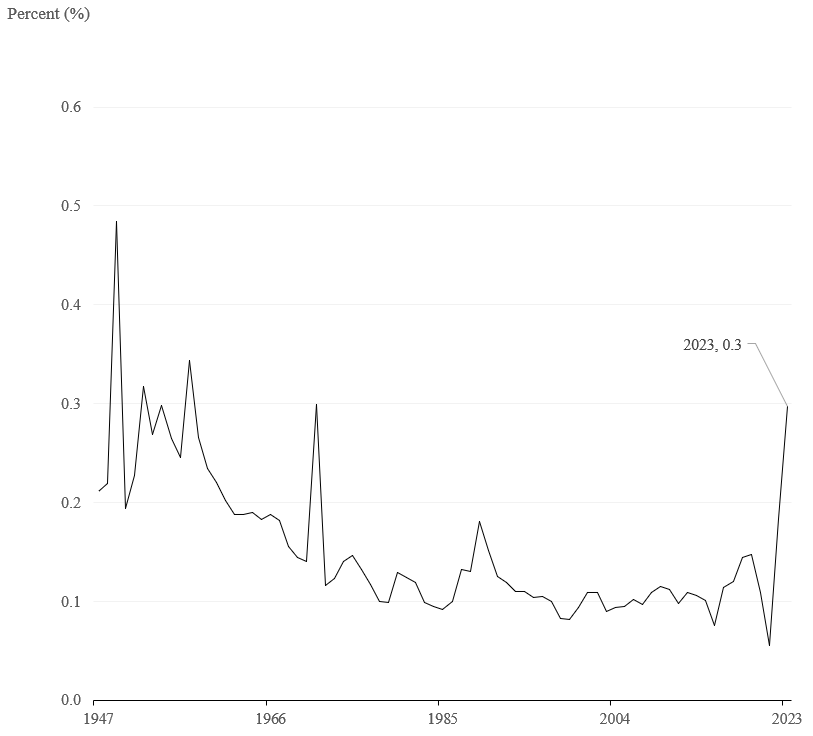
- Canada's population grew by 1.2 million people (or 3.0%) since July 2022 – more than triple its average gain over a 12-month period since 1947 and the highest growth rate since the Baby Boom in the 1950s. The recent population growth (3.0%) is well above the 2015-2019 average of 1.2%.
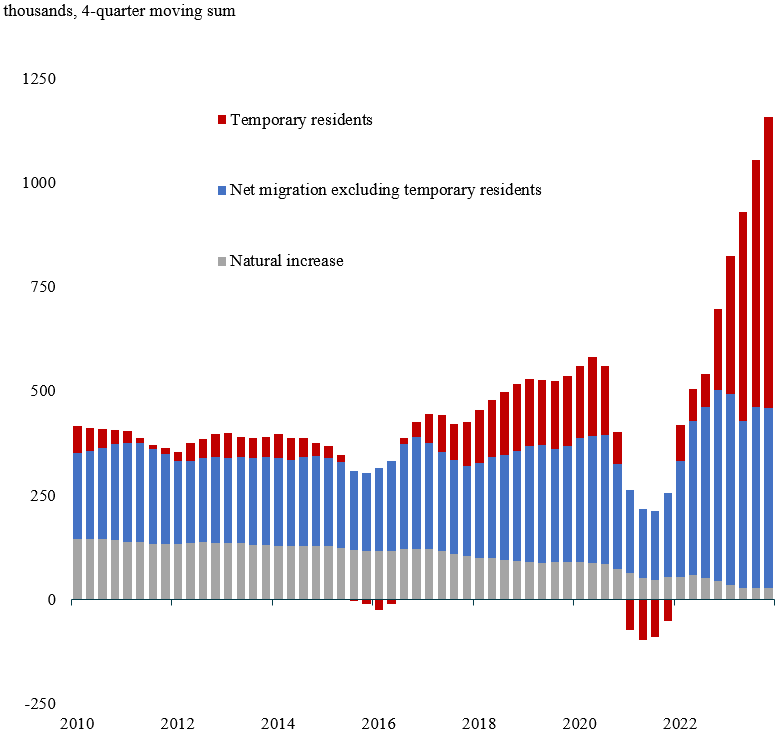
- Of the 1.2 million increase in population, 60% came from temporary residents (700,000), 37% came from permanent residents (433,000) and 2% (28,000) came from net births (Charts in annex).
- Among the new temporary residents, 58% are foreign workers (402,000), 27% are international students (189,000) (including people who hold both a study and work permit), and 11% are asylum claimants (80,000). The remaining 4% are dependents.
- The share of population growth driven by temporary residents (60%) is the highest for any four quarter period since 1972. The average contribution from 2015 to 2019 was about 20%.
Housing Supply
- Housing starts have fallen from their peak in 2021 but remain elevated relative to 2019 levels (+22%). This is true across all economic regions, except Quebec.
- In particular, rental starts have been quite strong, up 57% relative to 2019 levels, driven by builders responding to strong demand, support from government programs, and various steps taken to reduce barriers to housing supply.
- The pace of rental construction is nearly 1.5 times its pre-pandemic pace, from about 4,000 units per month in 2019 to 6,000 units per month so far in 2023 and is by far the highest it has been since at least 1990.
- Rentals are averaging roughly 36% of all starts, compared to 30% in 2019.
- Building costs are 64% higher for single-detached homes and 49% higher for apartment buildings since the start of 2020. These costs have increased at a higher pace than headline inflation (+16%).
- The time to build has increased over the years, up from roughly 5 months in the 1990s to 11 months in 2023 for a single-detached home, and up from 11 months to 24 months for an apartment unit.
- During 2023, CMHC updated its estimate for the supply gap – the number of homes required to restore affordability to roughly 2003-04 levels – and reiterated that roughly 5.1 million new homes will be needed by 2030 (1.6 million expected to be built by 2030 plus a 3.5 million remaining supply gap).
- For context, Canada has never completed more than 1.9 million homes over an 8-year period across its history.
Interest Rates and Mortgages
- Current mortgage rates: lowest advertised insured 5-year fixed rate is 5.29% (vs 1.7% during the pandemic) and 5-year variable rate is 5.95% (vs 1.28% during the pandemic).
- Based on September private sector survey projections, households could see some relief over the coming year, with short-term interest rates expected to fall by about 150 basis points by the end of 2024.
- Assuming a similar decline in variable mortgage rates, that could represent a roughly $550 decrease in the monthly payment on an average-priced home ($745,800 in October), or about $6,600 per year. (September 2023 Survey of Private Sector Economists; Canada Real Estate Association)
- About 63% of households own a home (35% with a mortgage, 28% without) (Financial System Review 2022, Bank of Canada) while 27% of households are renters.
- The share of households with a mortgage (35%) is similar to peers but in the upper range: United States (39%), New Zealand (34%), Australia (32%), UK (28%), France (23%), Germany (18%), Italy (11%).
- Among households with a mortgage (Financial System Review 2023, Bank of Canada):
- 9% are variable rate variable payment loans;
- 17% are variable rate fixed payment loans;
- 25% are fixed rate loans with term of less than five years, and;
- 50% are fixed rate loans with term of five or more years.
- The share of mortgage loans which will see an increase in monthly mortgage payments is expected to rise to 47% by the end of 2023, 65% by the end of 2024, and 84% by the end of 2025 (Financial System Review 2023, Bank of Canada).
- The median payment increases over the 2023–26 period will be about 20% (Financial System Review 2023, Bank of Canada). The increase is notably higher for variable rate mortgages with variable payments which will see payments in 2023 rise by almost 50% above their payment in February 2022 (Financial System Review 2023, Bank of Canada).
Mortgage Underwriting Standards
- The Minister of Finance sets eligibility rules for mortgage default insurance, which include the minimum down payment, minimum qualifying rate, the maximum amortization period, and the one-million-dollar property value limit.
- These rules balance access to mortgage credit and household indebtedness risks. They also manage access to the government guarantee while limiting taxpayer exposure to the housing market.
- The minimum qualifying rate increases borrower resiliency and reduces vulnerabilities associated with high household debt, and risks to financial stability by better positioning borrowers to be able to make their mortgage payments if interest rates or other expenses rise, or if there is a loss of income due to personal circumstances.
- The Government closely monitors the effects of its mortgage finance policies, which may be adjusted if conditions warrant.
- For fixed-payment products, the largest increases will be seen for those who renew in 2025 and 2026 when their term ends. Fixed-rate mortgages will see an increase of between 20% and 27% while variable-rate fixed payment mortgages will see an increase of 40% to 45%.
- Higher interest rates are expected to have a modest impact on the ability of households to make debt payments. The key driver of household financial stress, historically, is unemployment.
Annex
| Historical average | Pre-pandemic level | Oct-2023 | Change from recent peak | Change from pre-pandemic | |
|---|---|---|---|---|---|
| Housing starts, 6-month moving average | 191,000 | 210,000 | 256,000 | -7% | +22% |
| Sales of existing homes(annualized) | 418,000 | 491,000 | 425,000 | -37% | -13% |
| MLS Benchmark Price ($) | - | $542,000 | $746,000 | -11% | +38% |
Notes: Starts and sales are annualized levels. Starts is 6-month moving average. Year-over-year price change uses non-seasonally adjusted data. Pre-pandemic level for sales and starts is 2019 average. Pre-pandemic level for prices is February 2020. Recent peak is in 2022. Source: Canadian Real Estate Association, CMHC |
|||||
| Cumulative Growth | Average annual growth | |
|---|---|---|
| 2010-2019 | 57.3% | 5.2% |
| 2015-2019 | 22.8% | 5.3% |
| 2020-2023* | 38.1% | 9.0% |
| *Using October 2023 | ||
| Levels | month-over-month % | year-over-year % | % ch. | ||
|---|---|---|---|---|---|
| 2019 | Latest | October | October | Since 2019 | |
| Resale Market | |||||
| Sales (units) | 491,149 | 424,920 | -5.6 | -0.7 | -16.5 |
| Prices (MLS BMK Price) | $538,500 | $745,800 | -0.8 | 1.1 | 37.7 |
| Asking Rents | |||||
| National | $1,579 | $2,109 | -0.3 | 8.6 | 33.6 |
| Toronto | $2,621 | $3,016 | 0.1 | 4.0 | 15.1 |
| Vancouver | $2,341 | $3,325 | -3.4 | 9.1 | 42.0 |
| Montreal | $1,620 | $2,034 | 0.6 | 3.6 | 25.6 |
| Calgary | $1,338 | $1,944 | -0.6 | 15.2 | 45.3 |
| New Construction | |||||
| Housing Starts (6mma) | 209,909 | 256,280 | 0.9 | -7.3 | 22.1 |
Toronto |
33,536 | 56,951 | -4.2 | 21.6 | 69.8 |
Vancouver |
27,459 | 33,398 | -6.9 | 24.1 | 21.6 |
Montreal |
26,756 | 16,181 | 4.1 | -41.9 | -39.5 |
Calgary |
10,183 | 22,501 | 9.7 | 13.7 | 121.0 |
| Purpose Built Rentals | 44,801 | 70,285 | -1.6 | -4.2 | 56.9 |
Toronto |
3,529 | 10,203 | 0.7 | 96.3 | 189.1 |
Vancouver |
6,338 | 10,288 | -1.7 | 12.0 | 62.3 |
Montreal |
13,150 | 8,480 | -7.9 | -50.2 | -35.5 |
Calgary |
740 | 4,585 | 3.1 | 7.1 | 519.4 |
| Units Under Construction | 231,683 | 345,533 | 1.7 | 5.4 | 49.1 |
Toronto |
73,106 | 106,751 | 0.9 | 10.9 | 46.0 |
Vancouver |
43,997 | 60,027 | 2.5 | 26.3 | 36.4 |
Montreal |
28,372 | 33,396 | -0.5 | -21.5 | 17.7 |
Calgary |
10,750 | 22,585 | 1.9 | 23.8 | 110.1 |
| Building Cost Index | 110.4 | 173.3 | 57.0 | ||
| Time to build (months) | 10 | ||||
| Affordability | |||||
| 5-year fixed | 2.49 | 5.29 | -8 bps | 59 bps | 280 bps |
| 5-year variable | 2.65 | 5.95 | 80 bps | 330 bps | |
| Bank of Canada Index | 35.8 | 49.8 | 14 ppts | ||
| CPI Rent (year-over-year %) | Vacancy Rate in CMHC rental Universe | |||||
|---|---|---|---|---|---|---|
| 2021 | 2022 | 2023 | 2021 | 2022 | Lowest ever | |
| Canada | 2.8 | 5.8 | 8.2 | 3.1 | 1.9 | 1.7 |
| Newfoundland | 3.1 | 5.6 | 7.6 | 3.4 | 2.8 | 1.0 |
| PEI | 11.1 | 9.0 | -0.4 | 1.5 | 0.8 | 0.3 |
| Nova Scotia | 6.7 | 4.4 | 14.6 | 1.2 | 1.0 | 1.0 |
| New Brunswick | 5.3 | 7.3 | 9.0 | 1.7 | 1.9 | 1.7 |
| Quebec | 2.3 | 5.4 | 9.1 | 2.5 | 1.7 | 1.2 |
| Ontario | 3.5 | 6.9 | 7.0 | 3.4 | 1.8 | 0.8 |
| Manitoba | 2.6 | 5.2 | 5.4 | 5.0 | 2.9 | 0.9 |
| Saskatchewan | 1.6 | 1.5 | 5.7 | 6.2 | 4.1 | 1.2 |
| Alberta | -0.6 | 3.1 | 9.9 | 6.8 | 3.9 | 0.9 |
| BC | 2.9 | 6.8 | 9.1 | 1.4 | 1.3 | 0.7 |
|
Note: 2023 uses October 2023 data. Rental universe is the total apartments and condos surveyed by CMHC. |
||||||
| Canada, BoC Index | Vancouver | Toronto | |
|---|---|---|---|
| October 2023 | 106% | 115% | |
| 2023-Q2 | 50% | 95% | 108% |
| Historical average** | 37% | 66% | 57% |
| 2010 to 2019 average | 34% | 74% | 60% |
*Assumes 20% down payment, amortization period of 25 years and benchmark house price. **Historical average is 1981 to 2023 for Canada and 1996 to 2023 for Vancouver and Toronto. |
|||
Unaffordability metric by city: Housing related costs as a share of median total income of 25–34-year-old households
CPI rent year-over-year increase
(i.ie, for all renters rather than just new occupants)
Cumulative growth in home prices, by major CMA
Population growth, 12-month period
Population growth rate, annual change as of July 1
Population growth components
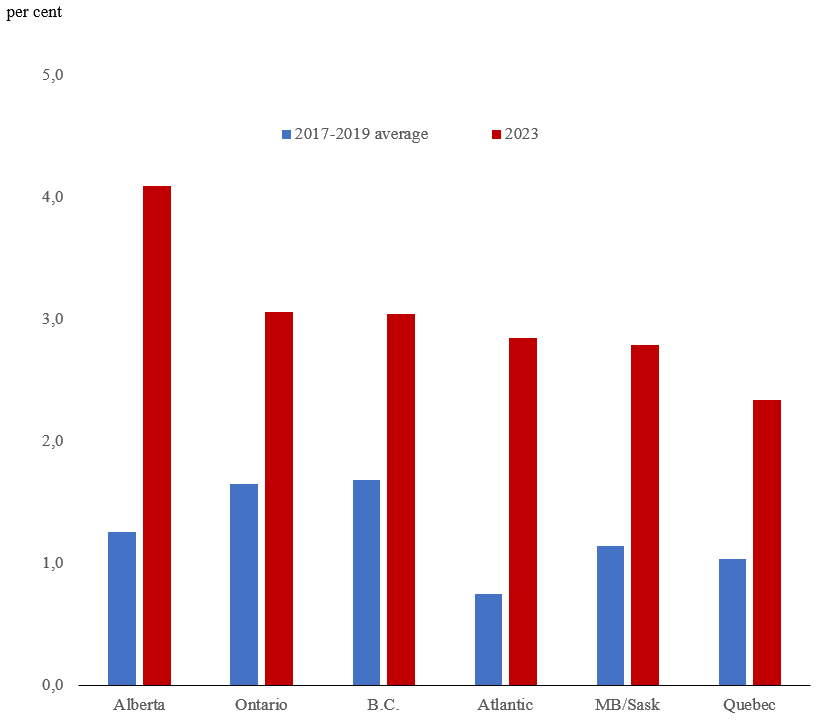
Population growth, regional
Cracking Down on Non-Compliant Short-term Rentals
Issue
The federal government is taking action to support municipalities that are cracking down on non-compliant short-term rentals.
Key Points
- Canada needs more long-term housing for Canadians to live in. The federal government is taking action to support municipalities that are cracking down on non-compliant short-term rentals which are keeping homes for Canadians off the market.
- Some provinces, including Quebec and British Columbia, and municipalities such as Toronto, Montréal, and Vancouver, have already taken action, and the federal government is taking steps to support their work.
- The 2023 Fall Economic Statement (FES) proposes $50 million over three years, starting in 2024-25, to support municipal enforcement of restrictions on short-term rentals.
- Further, the 2023 FES announced that, starting January 1, 2024, the federal government intends to deny income tax deductions for expenses incurred to earn income from short-term rentals not in compliance with provincial or municipal short-term rental prohibitions, or licensing, permitting or registration requirements.
- This will support municipalities with strict regulatory regimes that are having a significant and measurable impact in returning short-term rentals back to the long-term housing market.
Anticipated Questions and Answers
1. Who will be eligible to receive this funding?
It is intended to support municipalities with strict regulatory regimes.
Details on eligibility and application process to be announced later.
2. Which municipalities or provinces have laws regulating short-term rentals?
Some provinces, including Quebec and British Columbia, and municipalities such as Toronto, Montréal, and Vancouver, have already taken action to crack down on short-term rentals.
3. What are some examples of strict regulatory regimes?
For example, some jurisdictions have adopted limits on properties that can be listed as short-term rentals, only allowing principal residences, or specifying a maximum number of rooms that can be individually rented. Others have adopted new taxes on short-term rentals, or require licensing fees to be paid.
4. Will provinces that regulate short-term rentals also have access to this fund?
The funding is intended to support municipal enforcement of restrictions on short-term rentals.
5. Is the federal government trying to ban short-term rentals all together?
The federal government is taking action to support provinces and municipalities that are cracking down on non-compliant short-term rentals. In other words, those that operate in provinces and municipalities that do not permit their operation or those that are not compliant with applicable provincial or municipal licensing, permitting or registration requirements.
Background
In Montréal, Toronto, and Vancouver alone, there were an estimated 18,900 homes being used as short-term rental properties in 2020—a number that has almost surely increased in recent years. These are not spare bedrooms in someone's home—they are entire houses and apartments that are being used for tourists to rent—in many cases, only for a few days a week.
Committee Member Biographies
About the Committee
The mandate of the Standing Committee on Finance, as established under Standing Order 108 of the Standing Orders of the House of Commons, is to examine and enquire into all matters referred to it by the House and to send for persons, papers and records, as it operates in accordance with its mandate.
Standing committees are empowered to study and report on all matters relating to the mandate, management and operation of the department or departments of government that are assigned to them from time to time by the House. For the Standing Committee on Finance, these include the Department of Finance and the Canada Revenue Agency.
The committee also has the responsibility to consider budgetary policy, as outlined in Standing Order 83.1, including studies on proposals for the government's budgetary policy and the budget itself. The committee normally undertakes its pre-budget consultations during the first sitting week of September and presents its report by the third last sitting day in December, as outlined in Standing Order 28(2).
In each parliamentary session, the committee's work may include:
- pre-budget consultations;
- briefing sessions by departmental officials on federal programs;
- examination of planned expenditures of the Department of Finance and the Canada Revenue Agency;
- a review of Order in Council appointments;
- a review of Monetary Policy Reports of the Governor of the Bank of Canada;
- a review of the Minister of Finance's economic and fiscal updates;
- consideration of proposed legislation;
- special studies on topics within the Committee's mandate; and
- consideration of reports of subcommittees.
Liberal Party

Yvan Baker
Liberal, Etobicoke Centre (Ontario)
Biography
Yvan Baker has been the Member of Parliament for Etobicoke Centre since 2019. As a former Member of Provincial Parliament for Etobicoke Centre, he successfully advocated for the tunneling of the Eglinton West LRT, Silver Creek School for children with special needs, prevented the GTAA from permanently diverting flights over Etobicoke, and secured expansions of local hospitals and schools.
Prior to being elected, Mr. Baker taught MBA students at York University's Schulich School of Business while operating his own management consulting practice. Before this time, Mr. Baker was a consultant with The Boston Consulting Group in Toronto and New York. His work extended to clients in the public sector and Fortune 500 companies in a range of sectors including financial services, retail, energy, and telecommunications.
Mr. Baker has volunteered for a variety of charitable and humanitarian organizations: Leave Out Violence as Board Director; the Emerging Leaders Network where he worked with civic leaders on projects promoting Toronto's economic and social prosperity; and Global Grassroots where he supported emerging women leaders in Rwanda on projects that address issues such as lack of access to water, domestic violence, and health education. Mr. Baker was awarded the Queen's Diamond Jubilee Medal in recognition of his service to the community.
Analysis
Mr. Baker's questions in committee typically focus on the impact of pollution pricing or the Russo-Ukrainian war on a given sector. He often asks witnesses to provide international comparisons in respect to Canada's fiscal situation, social wellbeing, and climate initiatives. He has also expressed a strong interest in national standards for long-term care homes, noting that facilities in his riding were hard hit by the pandemic and staffing issues.
In September 2023, Mr. Baker gave a notice of motion for the committee to study the current state of Canadian pension funds and the plan investments of Canadians retirement savings abroad.
Private Members' Bills and Motions
In November 2021, Mr. Baker re-introduced Bill C-204, An Act respecting Ukrainian Heritage Month, from the previous Parliament. The bill currently sits outside the Order of Precedence.

Rachel Bendayan
Parliamentary Secretary to the Deputy Prime Minister and Minister of Finance
Liberal, Outremont (Quebec)
Biography
Rachel Bendayan has been the Member of Parliament for Outremont since a by-election in February 2019. She currently serves as Parliamentary Secretary to the Deputy Prime Minister and Minister of Finance. Previously, Ms. Bendayan served as Parliamentary Secretary to the Minister of Tourism and Associate Minister of Finance and as Parliamentary Secretary to the Minister of Small Business, Export Promotion and International Trade.
For nearly ten years, Ms. Bendayan built a legal practice at Norton Rose Fulbright in the fields of litigation and international arbitration, specializing in international trade law. She also taught at the Faculty of Law of the Université de Montréal. She later served as Chief of Staff to the federal Minister of Small Business and Tourism.
Analysis
In other committees, Ms. Bendayan has expressed interest in tariffs, exports, and bilateral trade with the United States. Ms. Bendayan has so stressed the importance of protecting Canada's supply chains in international trade agreements.

Julie Dzerowicz
Liberal, Davenport (Ontario)
Biography
Julie Dzerowicz is the first female Member of Parliament for Davenport following her election in 2015. She currently serves as chair of the Canadian NATO Parliamentary Association and vice-chair of the Canadian Section of ParlAmericas.
Ms. Dzerowicz attributes to her parents the importance of hard work and education to achieving one's full potential. She is the child of immigrant parents who fled their respective countries from war and came to Canada to find a safe place to live and raise their children.
Prior to her work in Parliament, Ms. Dzerowicz spent more than 20 years in senior level positions in banking and biotechnology. A long-time environmentalist, she co-founded the environmental organization Project Neutral in 2010 to help individuals and communities reduce their carbon emissions. Ms. Dzerowicz received her MBA from the University of British Columbia—completing her degree at the London Business School—and her Bachelor of Commerce at McGill University.
Analysis
In committee, Ms. Dzerowicz regularly asks how Canada can stimulate business investment and address interprovincial trade barriers. Her questions have focused on ways to address climate change and advance green technologies, often asking how international initiatives can be applied in Canada (e.g., United States Inflation Reduction Act). She has sought information on the Bank of Canada's negative equity position.
Private Members' Bills and Motions
In the 43rd Parliament, Ms. Dzerowicz introduced Bill C-273, An Act to Establish a National Strategy for a Guaranteed Basic Income, which dropped from the Order Paper at Second Reading with the 2021 election. The bill aimed to enable basic income implementation pilots on a large scale in provinces and territories as well as help the federal government develop practices to better implement national programs.

Peter Fonseca, Chair
Liberal, Mississauga East-Cooksville (Ontario)
Biography
Peter Fonseca has been the Member of Parliament for Mississauga East-Cooksville since 2015. He is a former Olympian who represented Canada in the 1996 Olympic Games as a marathon runner.
Mr. Fonseca was a Member of Provincial Parliament representing Mississauga East and later Mississauga East-Cooksville between 2003-11. During that time, he served as a cabinet minister, leading portfolios on Labour and Tourism and Recreation.
For almost 20 years, he has lived with his family in his riding of Mississauga East-Cooksville where his wife, Christine Fonseca, is the Councillor for Ward 3 on the Mississauga City Council.Analysis
As chair, Mr. Fonseca's participation in committee is focused on maintaining decorum and outlining procedures. He typically does not intervene to express his views on a given matter or ask questions of witnesses.
In the House, he has advocated for small businesses and permanent residency for temporary foreign workers.
Private Members' Bills and Motions
In the 44th Parliament, Mr. Fonseca introduced motion M-75 to implement Polish Heritage Month every May. The motion was placed in the Order of Precedence as of September 2023.

Joanne Thompson
Liberal, St. John's East (Newfoundland and Labrador)
Biography
Joanne Thompson has been the Member of Parliament for St. John's East since 2019. Ms. Thompson is Chair of the National Seniors Caucus.
Ms. Thompson is a strong advocate for social justice, entrepreneurship, and supporting communities. She attributes this passion from her time volunteering at St. Clare's Hospital at a young age. Prior to her election, Ms. Thompson worked as a registered nurse while attending Memorial University part-time. She continued her career in community health until 1990 when she turned her focus to building a family business with her husband while studying to qualify as a graduate gemologist.
Ms. Thompson also served as the Executive Director of The Gathering Place, a community health centre serving vulnerable populations in downtown St. John's. During her time there, The Gathering Place added an overnight shelter and saw an increase in available services over a four-year period.
Analysis
Ms. Thompson has expressed interest in ways to address climate change including its impacts on her riding and Newfoundland and Labrador. She has spoke to the importance of rural economic development to support Canadians living in small communities. Moreover, she is a strong advocate for seniors, particularly around prevention of mistreatment and abuse.

Patrick Weiler
Liberal, West Vancouver—Sunshine Coast—Sea to Sky Country (British Columbia)
Biography
Patrick Weiler has been the Member of Parliament for West Vancouver – Sunshine Coast – Sea to Sky Country since 2019. Mr. Weiler is the co-chair of the All-Party Parliamentary Tourism Caucus.
Before entering politics, Mr. Weiler was an environmental and Aboriginal lawyer and international development professional. During his career, he supported governments in improving the management of aquatic ecosystems as well as the governance of natural resource sectors on behalf of the United Nations and other international development agencies. Mr. Weiler represented First Nations, municipalities, small businesses, and non-profits on environmental and corporate legal matters within this riding, throughout British Columbia and around the world.
Mr. Weiler has a Juris Doctor degree from the University of British Columbia's Faculty of Law and a Bachelor of Arts program at McGill University.
Analysis
Mr. Weiler is an advocate for action on climate change. He is supportive of initiatives to mitigate greenhouse gas emissions under Canada's obligations in the Paris Agreement, build resilient communities, and ensure Canadian business seize economic opportunities in the transition to the clean economy.
Private Members' Bills and Motions
This session, Mr. Weiler introduced M-83, Old Growth Forest Protection. The motion encourages the creation of an Old Growth Nature Fund to leverage co-financing from public and private sources to finance the protection and conservation of the remaining old growth forest in Canada as well as a ban on the export of old growth logs and related wood products. The motion was placed on notice as of May 2023.
In the 43rd Parliament, Mr. Weiler also worked closely with the Minister of Environment and Climate Change on Bill C-12, An Act respecting transparency and accountability in Canada's efforts to achieve net-zero greenhouse gas emissions by the year 2050.
Conservative Party

Adam Chambers
Opposition Critic for National Revenue
Conservative, Simcoe North (Ontario)
Biography
Adam Chambers has been the Member of Parliament for Simcoe North since 2021. He currently serves as Opposition Critic for National Revenue.
Before his election, Mr. Chambers practiced law until he became a senior advisor to Minister Jim Flaherty at the Department of Finance. From this experience, he developed an appreciation of the value of public service and the importance of fiscal responsibility.
Since 2015, he has been a board member of the Waypoint Centre for Mental Health Care in Penetanguishene to promote mental health awareness and give back to the community. Mr. Chambers is also a founding board member of Building Up, a non-profit whose mission is to create employment opportunities in the skilled trades for at-risk youth. Prior his election, he was also Assistant Vice President at one of Canada's largest financial institutions.Analysis
Mr. Chambers focuses his questions on the effectiveness of government processes to administer payments and programs. He initiated a short study in committee for the Department of Finance to provide an economic analysis report on the implementation of the Select Luxury Items Tax Act (introduced in Bill C-19, Budget Implementation Act, 2022, No. 1). In June 2023, Mr. Chambers gave a notice of motion for the committee to study open banking and real payments.
He often asks how the government can combat inflation and better spend its revenue. His other areas of interest include the prevention of money laundering, Canada's competitiveness in the manufacturing sector, and the inflationary impact of government spending.
Private Members' Bills and Motions
In June 2022, Mr. Chambers introduced Bill C-289, An Act to amend the Criminal Code (identity verification), which was defeated at Second Reading in the House of Commons. The bill aimed to combat money laundering by making it an offence for any person or business to provide false information to financial institutions to conceal illegal sources of money or the identity of account holders.

Jasraj Singh Hallan, Vice-Chair
Opposition Critic for Finance and Middle Class Prosperity
Conservative, Calgary Forest Lawn (Alberta)
Biography
Jasraj Singh Hallan has been the Member of Parliament for Calgary Forest Lawn since 2019. He currently serves as Opposition Critic for Finance and Middle Class Prosperity.
As former Opposition Critic for Immigration, Refugees and Citizenship, Mr. Hallan's parliamentary activities have largely focused on issues related to Canada's immigration system, application backlogs and processing time, and temporary foreign workers. He is also a member of the Special Committee on Afghanistan.
Mr. Hallan was raised in northeast Calgary, where he earned an accounting diploma from the Southern Alberta Institute of Technology. He has a certified Master Builder designation and ran a homebuilding business in Calgary.
Analysis
Mr. Hallan is a strong supporter of Canada's natural resources sector, namely oil and gas, questioning government regulation of the sector and the cancellation of the Keystone XL pipeline. In committee, he regularly asks witnesses about the sector's economic contributions to Canada (particularly that of Alberta's) and the impact of phasing out fossil fuels on jobs and the economy.
In line with his party's position, Mr. Hallan is a vocal opponent to additional government spending, the tripling of the "carbon tax," and "payroll taxes" (i.e., increasing premiums on CPP and EI contributions). He regularly asks about domestic causes and impacts of inflation, specifically noting its impact on small businesses and students.
Private Members' Bills and Motions
In the 43rd Parliament, Mr. Hallan introduced Bill C-304, An Act to amend the Criminal Code (grooming), which dropped from the Order Paper with the 2021 election. The bill aimed to make grooming an aggravating factor when a court imposes a sentence for certain sexual offences. It would also consider grooming as a practice where the offender has communications or conducts relations with victims with the intention of leading them to participate in the offence.

Philip Lawrence
Conservative, Northumberland-Peterborough South (Ontario)
Biography
First elected in 2019, Philip Lawrence is the Member of Parliament for Northumberland–Peterborough South. He currently serves as the Associate Opposition Critic for Finance and Middle Class Prosperity (Tax Reform).
Prior to his election, Mr. Lawrence practiced tax law before working in financial services for over ten years. He obtained a law degree from Osgoode Hall Law School and an MBA from the Schulich School of Business.
Analysis
In line with his party's position, Mr. Lawrence is a vocal opponent to additional government spending, the tripling of the "carbon tax," and "payroll taxes" (i.e., increasing premiums on CPP and EI contributions). He occasionally questions witnesses on the economic contributions of Canada's natural resources sector, namely oil and gas, as well as the impact of phasing out fossil fuels on jobs and the economy. His other areas of interest include domestic causes for inflation and the inflationary impact of various government initiatives.
Private Members' Bills and Motions
Mr. Lawrence is currently sponsoring Bill S-216, An Act to amend the Income Tax Act (use of resources of a registered charity). This bill aims to permit charities to provide their resources to a person who is not a qualified donee provided they take reasonable steps to ensure those resources are used exclusively for a charitable purpose. In June 2022, Mr. Lawrence introduced Bill C-281, An Act to amend the Department of Foreign Affairs, Trade and Development Act, the Justice for Victims of Corrupt Foreign Officials Act (Sergei Magnitsky Law), the Broadcasting Act and the Prohibiting Cluster Munitions Act, which is at Second Reading in the Senate.
In the 43rd Parliament, Mr. Lawrence introduced Bill C-206, An Act to amend the Greenhouse Gas Pollution Pricing Act (qualifying farming fuel), which passed through the House of Commons with support from the NDP, Bloc Quebecois and Green Party. The bill was dropped from the Order Paper at Second Reading in Senate with the 2021 election.

Marty Morantz
Conservative, Charleswood-St. James-Assiniboia-Headingley (Manitoba)
Biography
Marty Morantz has been the Member of Parliament since 2019. He currently serves as the Associate Opposition Critic for Finance and Middle Class Prosperity (Affordable Government).
Prior to his election to the House of Commons, Mr. Morantz served as City Councillor for Charleswood-Tuxedo-Whyte Ridge ward in Winnipeg from 2014-18. During this time, he served as the chair of the finance and infrastructure committees. He was also a member of the Executive Policy Committee.
Mr. Morantz and his family have made contributions to the Saul Morantz Building at the Simkin Centre, the Canadian Museum for Human Rights, and the University of Winnipeg. They have also established the Nathan Morantz Respite Care Fund in support of respite services in Manitoba and autism research.
Previously, Mr. Morantz served on the boards of Shalom Residences Assisted Living, the Refit Centre Foundation, Community Respite Services, Manitoba Families for Effective Autism Treatment (MFEAT), the Jewish National Fund, Young Adult Division, the Jewish Federation (CJA) Charitable Allocations Committee, and the Special Needs Steering Committee at the Gray Academy.
He has a degree in political studies from the University of Manitoba and a law degree from Osgoode Hall Law School. He practiced law as a partner at Levene Tadman LLP in Winnipeg. During his tenure, Mr. Morantz acted as senior counsel to several large financial institutions and real estate management firms.
Analysis
In line with his party's position, Mr. Morantz is a vocal opponent to additional government spending, the tripling of the "carbon tax," and "payroll taxes" (i.e., increasing premiums on CPP and EI contributions). He has questioned unannounced spending mentioned in the Fall Economic Statement and Budget 2023, and often asks for comparative figures between the federal government's estimates and that of the Parliamentary Budget Officer. Other areas of questioning include domestic causes for inflation and the inflationary impact of various government initiatives.
Private Members' Bills and Motions
In February 2022, Mr. Morantz introduced Bill C-240, An Act to amend the Income Tax Act (donations involving private corporation shares or real estate), which was defeated at Second Reading in the House of Commons. The bill aimed to provide an exemption from capital gains tax in respect of certain arm's length dispositions resulting from the donation of real estate or private corporation shares to charities.
Bloc Québécois

Gabriel Ste-Marie, Vice-Chair
Conservative, Joliette (Québec)
Biography
Gabriel Ste-Marie has been the Member of Parliament for Joliette since 2015. He currently serves as the Bloc Québécois Critic for Finance and the Treasury Board.
In Parliament, Mr. Ste-Marie has worked on initiatives to address tax evasion and tax loopholes. He has defended Quebec's supply-managed producers in the House of Commons, calling for their full compensation for losses related to free trade agreements with Europe, the Pacific and North America.
Prior to his election, Mr. Ste-Marie was researcher at the Contemporary Economics Research Institute and lecturer at the Université du Québec à Montréal. He worked for France Inter in 2017. He also worked in Washington, DC, to garner support for Quebec's aluminum steel industries.Analysis
In committee, Mr. Ste-Marie's questions often relate to the effectiveness and efficiency of government programs, notably the impact of funding on government service delivery and related statistics/numbers. He regularly asks how a respective program/initiative will affect Quebec and its programs.
Mr. Ste-Marie is vocal advocate for seniors, particularly those in the low-income bracket. In line with his party's position, he advocates to lower Old Age Security to 65 years and over. His interests also include combatting tax evasion, strengthening general anti-avoidance rules, promoting competition in Canada, and labour market issues.
Private Members' Bills and Motions
In the 42nd Parliament, Mr. Ste-Marie introduced motion M-42 in 2016 to end tax evasion in Barbados by Canadian companies. The motion was defeated in a recorded vote.
New Democratic Party

Daniel Blaikie
New Democratic Party, Elmwood-Transcona (Manitoba)
Biography
Daniel Blaikie has been the Member of Parliament for Elmwood-Transcona since 2015. He currently serves as the NDP Critic for Finance, Employment and Workforce Development and Democratic Reform.
He previously worked as an advisor to the Manitoba Minister of Health during the NDP government of Gary Doer (1999-2009).
An electrician by trade, Daniel earned his certification as a construction electrician after completing a Bachelor of Arts from the University of Winnipeg and a master's degree in philosophy from Concordia University. Mr. Blaikie was also a proud member of the International Brotherhood of Electrical Workers and active member of the labour movement.
Analysis
In line with his party's position, Mr. Blaikie is a vocal opponent of "profiteering" of grocery store chains and the oil and gas industry. He's asked that the Canada Recovery Dividend (introduced in Bill C-32, Fall Economic Statement Implementation Act, 2022) extend to the oil and gas sector. Other areas of questioning include enhancing the government's transparency around costs/revenues and ways to address and recoup revenue from tax avoidance and offshore tax havens. In September 2023, Mr. Blaikie initiated a committee study public policy decisions and market forces that have led to steep increases in the cost of buying or renting a home in Canada.
Private Members' Bills and Motions
In September 2022, Mr. Blaikie introduced Bill C-298, An Act to amend the Income Tax Act (economic substance), which currently sits outside the Order of Precedence. The bill aims to deem certain avoidance transactions to be a misuse of provisions providing for tax benefits.
He also introduced Bill C-225, An Act to amend the Bankruptcy and Insolvency Act, the Companies' Creditors Arrangement Act and the Pension Benefits Standards Act, 1985 (pension plans and group insurance plans), which currently sits outside of the Order of Precedence. It is based on similar bills introduced by former NDP MP Scott Duvall and aims to ensure employees received pension plans and group insurance plans if a company becomes bankrupt. Similar to his own bill, Mr. Blaikie supported CPC MP Marilyn Gladu's Bill C-228, An Act to amend the Bankruptcy and Insolvency Act, the Companies' Creditors Arrangement Act and the Pension Benefits Standards Act, 1985, and introduced an amendment to guarantee termination and severance pay to employees. While this amendment was adopted in committee, it was ruled out of order by the Speaker and removed from the bill.
Deputy Prime Minister's Opening Remarks
Parliamentary Environment Analysis
Standing Committee on Finance
Public policy decisions and market forces that have led to increases in the cost of buying or renting a home in Canada
Background
- On September 21, the Standing Committee on Finance (FINA) adopted a motion moved by NDP MP Daniel Blaikie (Elmwood—Transcona) to undertake a broad study of housing that focuses on the perceived causes of current shortages, including federal policies. The committee gave itself until February 2024 to report on this study, which will keep this issue on FINA's agenda over that time, in between dealing with Budget-related business.
- The substantive mandate of the study is sufficiently broad, allowing members leeway to ask virtually any housing-related questions:
- [P]ublic policy decisions and market forces that have led to steep increases in the cost of buying or renting a home in Canada, including but not limited to, the acquisition of buildings with affordable units by large corporate or institutional investors mandated to maximize shareholder profit, the acquisition of residential properties for the purpose of running a short-term rental business, the acquisition of multiple residential properties for the generation of passive income, the tax treatment afforded to entities that buy, sell or lease residential properties, the rules governing the provision of mortgages for the purchase of residential properties in Canada, the terms and conditions of Canada Mortgage and Housing Corporation mortgage insurance, barriers to housing supply and the funding of new social and affordable housing by governments in Canada.
- To date, FINA has held six meetings on the study. The committee heard from officials from the Department of Finance, Infrastructure Canada, and the Canada Mortgage and Housing Corporation (September 28), the Governor of the Bank of Canada (October 30), and various stakeholders.
- Members may leverage testimony from stakeholders in their questioning of the Deputy Prime Minister and officials, including ways the federal government can address supply shortages, advance a national housing strategy, support cooperative and social housing projects, as well as expected outcomes of recent government announcements. Given the presence of the Deputy Prime Minister, members may take the opportunity to ask questions about the Government's affordability plans referenced in the 2023 Fall Economic Statement (FES), including but not limited to housing measures. Questions could also be expected in relation to Bill C-59, An Act to implement certain provisions of the fall economic statement tabled in Parliament on November 21, 2023 and certain provisions of the budget tabled in Parliament on March 28, 2023.
- Members may also ask questions regarding differences in approach and projected outcomes between the government's housing measures (i.e., FES 2023) and CPC Leader Pierre Poilievre's (Carleton) Private Members Bill C-356, An Act respecting payments by Canada and requirements in respect of housing and to amend certain other Acts (currently at Second Reading in the House).
- *Redacted*.
Conservative Party (CPC)
- The CPC has been vocal in their dissatisfaction with the federal government's housing initiatives, attributing rising costs of living to increased government spending. Members have argued that the government's housing measures do not go far enough to address affordability in a meaningful way. In the same vein, the party is also likely to voice their strong opposition to the price on pollution and position it as a key driver of inflation and higher costs generally.
- Members may also voice concerns around regulatory barriers to the construction of new homes, particularly in a higher interest rate environment. MP Adam Chambers (Simcoe North) has repeatedly sought information from witnesses on the financial impact on construction and consumers of the National Energy Code of Canada for Buildings (NECB) 2020, developed by Canadian Commission on Building and Fire Codes with the support of Natural Resources Canada. Similarly, MP Philip Lawerence (Northumberland—Peterborough South) has repeatedly raised concerns about Canada's GDP per capita and productivity levels, stating that "Canada has a productivity crisis". He has argued that low productivity and lack of capital investment is a barrier to the construction of new homes.
- The CPC is supportive of federal action aimed at building new housing and limiting real estate speculation. Although the party recently supported Bill C-56, An Act to amend the Excise Tax Act and the Competition Act at second reading and in committee, members may request studies from officials that demonstrate how the bill will result in more affordable homes and groceries (in reference to the bill's short title). In past meetings on this study, members have sought information on the impact of banning short-term rentals and the level of foreign real estate investment in Canada.
- Members may use debate to ask officials about the merits of CPC Leader's Bill C-356, which aims to provide a 100 per cent GST rebate on the construction of new rental homes priced below the local market average. Moreover, it aims to establish a target for competition of new homes in high-cost cities and create conditions around access to federal funding to prevent construction delays.
Some Anticipated Areas of Questioning
- Has the government calculated the cost of the NECB 2022 building code on housing construction and its impact on homebuyers?
- How many Canadians will default on their mortgages because of high interest rates?
- Does the government have plans to create a public database on foreign homebuying and short-term rentals?
Bloc Québécois (BQ)
- The BQ has spoken to the urgency of addressing affordability issues as Canada faces a "housing crisis". Members are expected to criticize the speed at which the government has implemented housing relief measures and the lack of long-term vision to address affordability issues. In a press release on November 21, the party argued that the FES 2023 does not propose structural measures to address the urgency of the housing crisis and rise in homelessness. They were also critical that measures would not take effect until 2025-26.
- The BQ perceives housing as the sole responsibility of the provinces—and by extension, municipalities—arguing that the federal government should not "dictate to Quebec how to spend its money" and administer its respective housing programs. Members have referred to the Canada-Quebec Housing Agreement as a reason for removing conditions on federal transfers because of three-year delays in providing funding to housing projects. In that regard, Bloc members may also use debate to seek guarantees that Quebec maintains jurisdiction over its housing initiatives.
- The BQ has raised concerns over the lack of affordable and social housing available to Quebec residents, especially to seniors and low-income individuals. As strong advocates for seniors, members may use debate to question the government's plans to provide affordable housing to these groups.
Some Anticipated Areas of Questioning
- Given the housing crisis, why do certain housing measures announced by the Government not come into effect until 2025-26?
- How is the government working with Quebec, and other provinces, to address high housing and rental costs?
- What incentives will the government create to ensure property owners offer lower rent, especially if market prices remain the same?
New Democratic Party (NDP)
- The NDP is a vocal proponent for affordable housing in Canada in line with the party's platform commitments. That said, members may perceive the government's housing initiatives as not going far enough and underscore the urgency of implementing new measures to alleviate financial burdens on Canadians. In that vein, members may reiterate comments by NDP Leader Jagmeet Singh (Burnaby South), who expressed disappointment over the FES 2023 saying it does not meet the urgency of what Canadians need.
- MP Blaikie has said that market-based initiatives alone will not improve the housing market. He has advocated for a clear national housing strategy that include non-market initiatives and a social housing strategy. While the MP supported the passage of Bill C-56, he has noted that the bill as part of an incomplete housing strategy. Regarding the FES 2023, MP Blaikie also questioned why new investments for social housing would not take effect until 2025-26.
- The NDP believes that the federal government has a key role to play in building affordable housing, particularly social and cooperative housing. Members may use debate to advocate for the inclusion of social housing measures. MP Blaikie has also recommended the inclusion of a non-profit acquisition fund that allows charitable organizations to buy affordable social housing when other organizations decide to sell them. Similarly, the MP has repeatedly sought information on the number of nonprofit housing projects funded, in part or wholly, by the federal government, and whether projects have stalled due to a higher interest rate environment.
- A key concern for the NDP relates to real estate speculation and profiteering. Members may seek guarantees that the government will protect tenants to ensure developers do not raise prices or evict them.
Some Anticipated Areas of Questioning:
- Why hasn't the government renewed operating agreements on social and affordable housing? What would be the financial impact of losing this type of housing all together?
- Has the government conducted analysis on the impact of a non-profit acquisition fund?
Liberal Party (LPC)
- The LPC is expected to promote existing government initiatives aimed at addressing housing affordability such as the First Home Savings Account, Housing Accelerator Fund, and tax on assignment sales. Additionally, members may seek to clarify responsibilities of each level of government in respect to housing.
- Members may also ask officials to speak to Canada's economic position compared to peer countries as well as how global factors impact inflation. In various studies, MP Yvan Baker (Etobicoke Centre) has sought information on the Russo-Ukrainian War impacts supply chains and costs in Canada.
- Members can be expected to ask officials about the unintended consequences of CPC Bill C-356. MP Patrick Weiler (West Vancouver—Sunshine Coast—Sea to Sky Country) has been critical of the Conservative-led bill, saying it was "weak and would actually substantially increase federal bureaucracy". Similarly, MP Baker criticized Bill C-356 in committee and has sought confirmation that the bill is less effective and would result in the construction of fewer homes.
Some Potential Areas of Questioning:
- How will the adoption of Bill C-56 address housing affordability and the supply gap challenge?
- What is the difference in impact between the government's Bill C-56 and Conservative Bill C-356?
- Can you speak to the positive impact of government housing initiatives such as the First Home Savings Account?