
Standing Committee on Public Accounts (PACP) Department of Finance Appearance on the Public Accounts of Canada 2024
FES 2024 Fiscal Facts
Budget 2024 Fiscal Objectives
Budget 2024 reaffirmed the government's commitment to its fiscal anchor to "reduce the federal debt-to-GDP ratio over the medium term".
Budget 2024 also committed that "moving forward, as part of its responsible economic plan, the government will keep deficits below 1 per cent of GDP beginning in 2026-27 and future years."
1. The Canadian economy is expected to see stronger growth
- Inflation is back to the 2 per cent target, the Bank of Canada has lowered its policy rate by a cumulative 1.75 per cent this year, and the economy is achieving a soft landing. Nevertheless, higher interest rates have slowed demand and the economy is operating below its capacity, as intended.
- With inflation expected to remain close to 2 per cent, further monetary policy easing is expected. Short-term interest rates are expected to decline into next year reaching a level consistent with the middle of the Bank of Canada's estimated range for neutral policy at 2.75 per cent.
- Private sector economists expect below-potential growth to continue into the last quarter of 2024. Growth should then strengthen to around 2 per cent in the second half of 2025, with falling interest rates and the associated pickup in household and business spending.
- Overall, private sector economists expect growth to pick up from 1.3 per cent in 2024 to 1.7 per cent in 2025, compared to 0.7 per cent and 1.9 per cent, respectively, in Budget 2024.
- Reflecting upward revisions to the near-term outlook for real GDP, the level of nominal GDP (tax base) is expected to be higher by $17 billion in 2024 and by $9 billion, on average, per year from 2025 through 2028 compared to budget 2024.
- In the near-term, compared to Budget 2024 projections, the projected deficit-to-GDP ratio rises to 1.6 per cent of GDP in 2024-25.
- This is driven in part by time-limited affordability relief, specifically the $1.6 billion GST holiday in 2024-25, and somewhat lower projected tax base growth relative to Budget 2024 estimates.
2. Debt metrics are broadly aligned with where we were in Budget 2024, and the fiscal anchor is respected
- Federal debt, expressed as a function of the economy, for the past and current fiscal year are projected to be the same as in Budget 2024. That is, even with the higher-than-expected deficit in 2023-24.
- This is partly due to the fact that the economic growth was stronger than Statistics Canada had projected over 2021 and 2023, suggesting that the economy's recovery from the pandemic was even stronger than previously thought.
- Over the rest of the forecast, the federal debt-to-GDP ratio is expected to decline in each and every year of the forecast horizon, from 41.9 per cent in 2024-25, down to 38.6 per cent in 2029-30.
Federal Debt-to GDP Ratio, 2016-17 to 2029-30
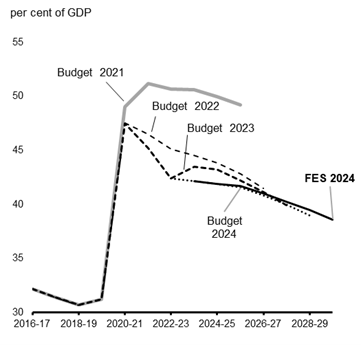
*Chart redacted*
3. The government has achieved its forward deficit objective
- The government's fiscal management has been both prudent and responsible. In Budget 2024, it set out to "keep deficits below 1 per cent of GDP beginning in 2026-27 and future years."
- Consistent with this ongoing fiscal objective, the 2024 Fall Economic Statement projects a deficit-to-GDP ratio of 0.9% per cent of GDP in 2026-27. In future years, the deficit-to-GDP ratio is expected to continue to decline, to 0.6% of GDP in 2029-30.
4. The 2023-24 near-final deficit is larger than projected in Budget 2024, but this was anticipated to some extent—and is behind us
- PBO projected a $46.8B deficit in 2023-24 in its last update (October – see table that follows).
- Commentators already expect that the final 23-24 result will be well above $40 billion.
- One-time and exceptional factors, such as Indigenous contingent liabilities and legacy COVID costs, are driving most of the variance.
- A working group of experts will be convened by Ministers to advise on the government's accounting of future potential contingent liabilities related to reconciliation. The advice will inform the presentation of contingent liabilities in Budget 2025.
| 2023-2024 | 2024-2025 | 2025-2026 | 2026-2027 | 2027-2028 | 2028-2029 | 2029-2030 | |
|---|---|---|---|---|---|---|---|
| *Information redacted* | |||||||
| PBO Balance | -46.8 | -46.4 | -39.0 | -30.0 | -28.5 | -23.8 | -22.5 |
| *Information redacted* | |||||||
| 2023-2024 | 2024-2025 | 2025-2026 | 2026-2027 | 2027-2028 | 2028-2029 | 2029-2030 | |
|---|---|---|---|---|---|---|---|
| *Information redacted* | |||||||
| PBO Revenue | 461.0 | 496.6 | 513.6 | 535.8 | 560.3 | 583.0 | 605.8 |
| *Information redacted* | |||||||
| 2023-2024 | 2024-2025 | 2025-2026 | 2026-2027 | 2027-2028 | 2028-2029 | 2029-2030 | |
|---|---|---|---|---|---|---|---|
| *Information redacted* | |||||||
| PBO Expenses | 452.8 | 485.9 | 497.0 | 509.1 | 527.6 | 545.2 | 564.7 |
| *Information redacted* | |||||||
5. Public debt charges remain low historically
- As a share of GDP, public debt charges are sustainable, remain near historic lows and are well below the peak of 6.5 per cent of GDP in the 1990s.
- Responsive: As a share of revenue (the Dodge Ratio), public debt charges are expected to be fairly stable, increasing slightly from 10.9 per cent in 2024-25 to 11.3 per cent by 2029-30.
- It is important to recognize that much of the incremental borrowing will support long-term investments in Canada's prosperity and should pay dividends for future generations.
| Projection | |||||||
|---|---|---|---|---|---|---|---|
| 2023–2024 | 2024–2025 | 2025–2026 | 2026–2027 | 2027–2028 | 2028–2029 | 2029–2030 | |
| Public debt charges | 47.3 | 53.7 | 54.2 | 57.6 | 62.0 | 66.3 | 69.4 |
| % of GDP | 1.6 | 1.8 | 1.7 | 1.7 | 1.8 | 1.9 | 1.9 |
| % of revenue | 10.3 | 10.9 | 10.5 | 10.7 | 11.0 | 11.3 | 11.3 |
Dodge Ratio (PDC as % of Revenues)

Public Debt Charges as % of NGDP

6. Canada continues to demonstrate world-leading fiscal responsibility
- Canada's projected net debt-to-GDP ratio for 2024 is just 14.4 per cent, compared to the G7 average, excluding Canada, of 103.8 per cent.
- Canada's net debt burden is still lower today than in any other G7 country prior to the pandemic—an advantage that Canada is forecasted to maintain through 2026 (Chart 50 and Table 3).
- Canada's economic plan has also delivered the fastest fiscal consolidation in the G7 since the depths of the pandemic, resulting in Canada having the smallest deficit in the G7 as a share of the economy this year, tied with Germany, and over the next two years (Chart 51 and Table 3).
IMF General Government Net Debt, G7 Countries

IMF General Government Budgetary Balance, G7 Countries
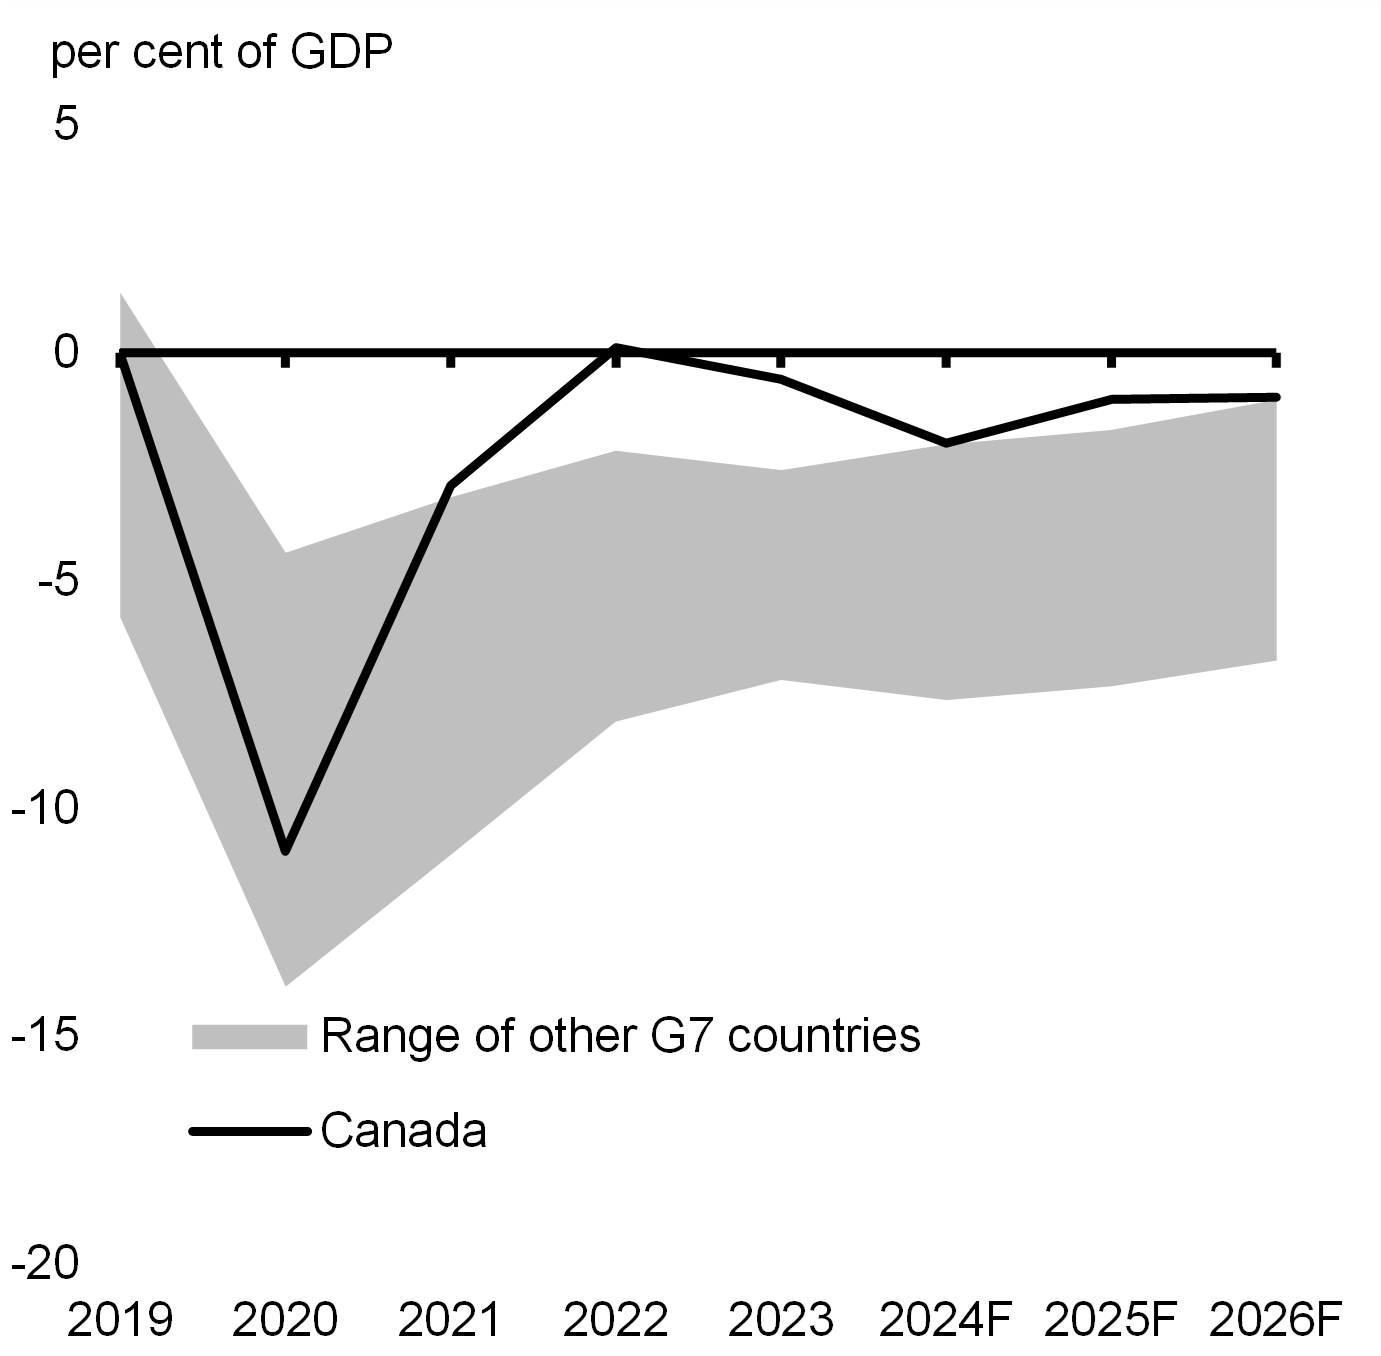
Notes: The internationally comparable definition of "general government" includes the central, state, and local levels of government, as well as social security funds. For Canada, this includes the federal, provincial/territorial, and local and Indigenous government sectors, as well as the Canada Pension Plan and the Quebec Pension Plan.
Source: International Monetary Fund, October 2024 Fiscal Monitor.
| Projection | ||||||||
|---|---|---|---|---|---|---|---|---|
| 2019 | 2020 | 2021 | 2022 | 2023 | 2024 | 2025 | 2026 | |
| Budgetary Balance | ||||||||
| Canada | 0.0 | -10.9 | -2.9 | 0.1 | -0.6 | -2.0 | -1.0 | -1.0 |
| Germany | 1.3 | -4.4 | -3.2 | -2.1 | -2.6 | -2.0 | -1.7 | -1.0 |
| Italy | -1.5 | -9.4 | -8.9 | -8.1 | -7.2 | -4.0 | -3.8 | -3.5 |
| United Kingdom | -2.5 | -13.1 | -7.9 | -4.7 | -6.0 | -4.3 | -3.7 | -3.5 |
| France | -2.4 | -8.9 | -6.6 | -4.7 | -5.5 | -6.0 | -5.9 | -5.8 |
| Japan | -3.0 | -9.1 | -6.1 | -4.4 | -4.2 | -6.1 | -3.0 | -2.8 |
| United States | -5.8 | -13.9 | -11.0 | -3.9 | -7.1 | -7.6 | -7.3 | -6.7 |
| Net Debt | ||||||||
| Canada | 8.7 | 16.1 | 14.3 | 15.6 | 13.1 | 14.4 | 14.6 | 14.7 |
| Germany | 39.6 | 45.1 | 46.0 | 46.2 | 45.1 | 45.6 | 45.7 | 45.1 |
| United Kingdom | 75.8 | 93.1 | 91.7 | 89.8 | 91.5 | 91.6 | 92.4 | 93.4 |
| United States | 82.7 | 97.8 | 97.3 | 93.2 | 95.7 | 98.8 | 101.7 | 104.1 |
| France | 89.0 | 101.6 | 100.5 | 101.0 | 101.7 | 104.1 | 107.1 | 109.4 |
| Italy | 121.2 | 140.8 | 133.4 | 126.9 | 124.1 | 126.6 | 128.7 | 130.5 |
| Japan | 151.7 | 162.0 | 156.3 | 149.8 | 154.2 | 155.8 | 153.9 | 152.5 |
|
Notes: The internationally comparable definition of "general government" includes the central, state, and local levels of government, as well as social security funds. For Canada, this includes the federal, provincial/territorial, and local and Indigenous government sectors, as well as the Canada Pension Plan and the Quebec Pension Plan. Country ranking is based on metric value in 2024. Source: International Monetary Fund, October 2024 Fiscal Monitor. |
||||||||
- Canada's fiscal situation compares very well to a broader group of 30 other advanced economy peers, posting world-leading low deficit- and net debt-to-GDP ratios (Charts 52 and 53).
- The combined deficit of federal and other levels of government (PT, local, Indigenous) would be slightly larger absent the small, usual and fairly stable surpluses run by the CPP/QPP.
- This represents a sharp contrast with the country's fiscal situation during the 1980s and early 1990s when the accumulation of relatively large deficits led to a rapid rise in Canada's net debt burden and a deteriorating fiscal advantage relative to many its advanced economy peers.
- Underpinning Canada's long tradition of fiscal responsibility are AAA credit ratings from Moody's, S&P, and DBRS Morningstar, as well as AA+ from Fitch. Canada is one of only two G7 economies, along with Germany, to have an AAA rating from at least two of the three major global credit rating agencies. Canada's AAA credit ratings help maintain investors' confidence and keep Canada's borrowing costs as low as possible.
IMF General Government Net Debt, Canada and 30 Other Advanced Economies

IMF General Government Budgetary Balance, Canada and 30 Other Advanced Economies

(Supplementary – not in FES) IMF General Government Gross Debt, Canada and 30 Other Advanced Economies

*Chart redacted*
Notes: The internationally comparable definition of "general government" includes the central, state, and local levels of government, as well as social security funds. For Canada, this includes the federal, provincial, territorial, and local and Indigenous government sectors, as well as the Canada Pension Plan and the Quebec Pension Plan. "30 Other Advanced Economies" are: Australia, Austria, Belgium, Croatia, Czech Republic, Denmark, Estonia, Finland, France, Germany, Iceland, Ireland, Israel, Italy, Japan, Korea, Latvia, Lithuania, Luxembourg, New Zealand, Netherlands, Portugal, Slovak Republic, Slovenia, Spain, Sweden, Switzerland, Taiwan, United Kingdom, United States. For greater readability, budgetary balance data points for Ireland in 2010 (-32.1) and for Iceland in 2016 (12.5) have been excluded from the other advanced economies range calculations. Norway, a statistical outlier due to its significant net asset position (+129.1 of GDP in 2024), has been excluded from the group.
Source: International Monetary Fund, October Fiscal Monitor.
7. Canada's cost of borrowing is low compared to peers
- Canada's cost of borrowing is lower than both the United States and the United Kingdom—a reflection of our prudent fiscal stewardship.
- Canada's public debt charges would be significantly higher if facing the interest rate environment in the U.S. or U.K. (Chart 46).
- U.S. rates are about 76 basis points higher which would mean debt charges about $16.5 billion higher per year.
- The U.K. has rates that are 70 basis points higher which would be $15.0 billion higher per year.
Canadian federal public debt charges under the higher interest rates of the U.S. and U.K.

8. FES 2024 Investments will boost net-zero growth
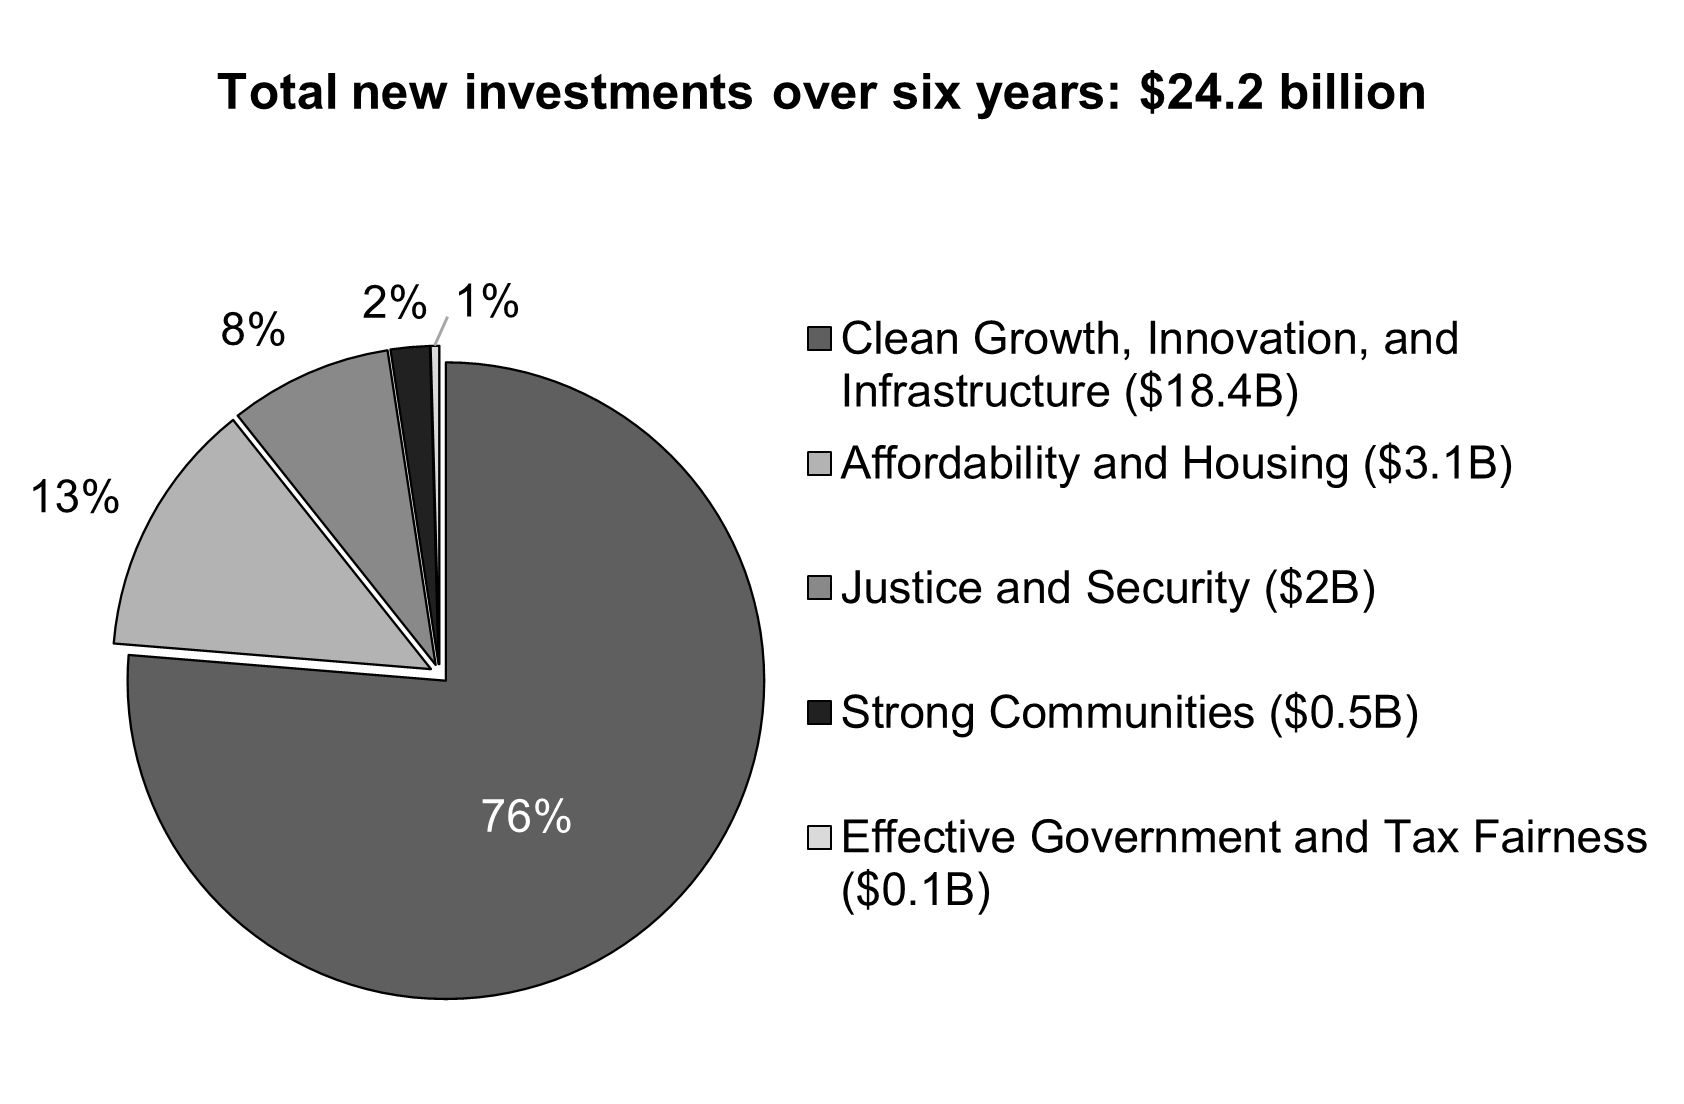
- The 2024 Fall Economic Statement includes about $24.2 billion in new measures in priority areas, such as affordability and housing; and investing in net-zero growth, productivity, and innovation (Chart 42). The latter category represents three-quarters of new investments, and includes:
- $17.4 billion to extend the Accelerated Investment Incentive;
- $1.1 billion to boost the Scientific Research and Experimental Development tax incentive program; and,
- A suite of actions to unlock pension fund investments in in Canada, including a total of $2 billion in federal co-investment through venture capital and mid-cap growth financing.
- Already, Canada has the lowest marginal effective tax rate (METR) in the G7, and a 5.2 percentage point competitive advantage over the average U.S. METR.
2024 Fall Economic Statement New Investments by Priority Area
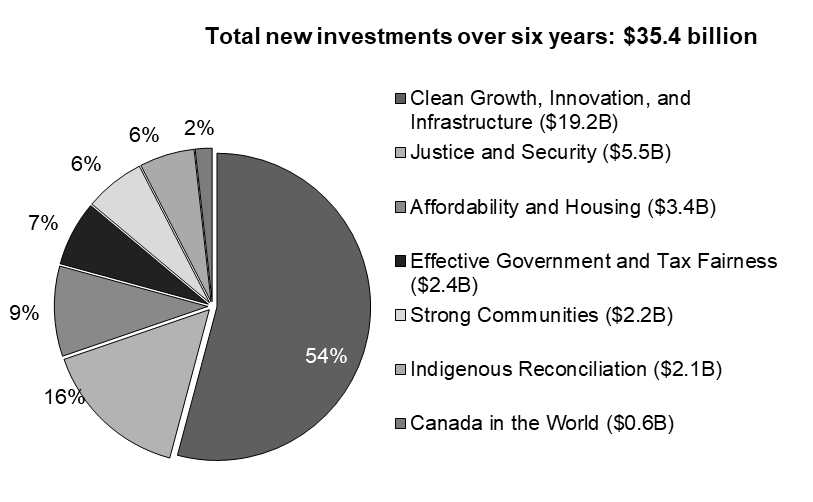
2024 Fall Economic Statement & Policy Actions taken since Budget 2024 New Investments by Priority Area
9. Preparing Canada's economy for uncertainty ahead
- The government is bolstering the Canadian economy's capacity to withstand geopolitical risk by strengthening trading relationships with trusted allies, investing in stronger manufacturing growth in North America, and putting tariffs on imported goods from China that benefit from unfair practices.
- Canada's $6.4 billion investment to build the Gordie Howe Bridge, connecting Detroit and Windsor is just one example of investments to strengthen trade.
- There is a considerable degree of uncertainty surrounding the future of U.S. trade policy. The government is taking active steps towards protecting the Canadian economy from trade disruptions, and Canada remains committed to working with the U.S. on issues of common interest.
- The government is taking a Team Canada approach, including re-convening the Canada-U.S. Cabinet Committee and consulting with provinces and territories.
- The 2024 Fall Economic Statement proposes to provide a $1.3 billion comprehensive border security package and announces the government's intention to introduce legislation to uphold the integrity of our immigration and asylum systems.
- Over the past six years, the government has also announced over $1.9 billion in investments to reinforce our border and ensure the secure flow of people and goods to and from Canada.
Comparison of Final and Budgeted Results
The table below sets out the variances between budgeted and actual revenues, expenses, and deficits over the past ten years.
- The table shows that 2023-24 is exceptional in terms of the magnitude and/or direction of both the revenue and expense variances, resulting in a significantly higher-than-projected deficit.
- The expense variance in 2023-24 reflects a continuation of the significant growth in Indigenous claims expenses observed in recent years, as well as provisions on loans and receivables stemming from novel COVID benefit programs. *Sentence redacted*.
| 2023-24 | 2022-23 | 2021-22 | 2020-21 | 2019-20* | 2018-19 | 2017-18 | 2016-17 | 2015-16 | 2014-15 | 2013-14 | |
|---|---|---|---|---|---|---|---|---|---|---|---|
| Final Results | |||||||||||
| Revenues | 459.5 | 447.8 | 413.3 | 316.4 | 334.1 | 332.2 | 313.6 | 293.5 | 295.5 | 282.3 | 271.7 |
| Expenses | 521.4 | 483.1 | 503.5 | 644.2 | 373.5 | 346.2 | 332.6 | 311.3 | 296.4 | 280.4 | 276.8 |
| Deficit | -61.9 | -35.3 | -90.2 | -327.7 | -39.4 | -14.0 | -19.0 | -17.8 | -1.0 | 1.9 | -5.1 |
| Budget in yr forecast | |||||||||||
| Revenues | 465.1 | 437.3 | 394.4 | 296.2 | 341.0 | 332.2 | 309.6 | 292.1 | 291.2 | 279.3 | 264.0 |
| Expenses | 505.1 | 480.2 | 508.2 | 650.3 | 375.3 | 347.1 | 329.0 | 315.1 | 296.6 | 281.3 | 280.5 |
| Deficit | -40.0 | -43.0 | -113.8 | -354.2 | -34.3 | -14.9 | -19.4 | -23.0 | -5.4 | -2.0 | -16.6 |
| Difference | |||||||||||
| Revenues | -5.5 | 10.6 | 18.9 | 20.2 | -6.9 | 0.0 | 4.0 | 1.4 | 4.3 | 3.0 | 7.7 |
| Expenses | 16.3 | 2.9 | -4.7 | -6.1 | -1.8 | -0.9 | 3.6 | -3.8 | -0.2 | -0.9 | -3.7 |
| Deficit | -21.8 | 7.7 | 23.6 | 26.5 | -5.1 | 0.9 | 0.4 | 5.2 | 4.4 | 3.9 | 11.5 |
| Difference as % of final | |||||||||||
| Revenues | -1.2% | 2.4% | 4.6% | 6.4% | -2.1% | 0.0% | 1.3% | 0.5% | 1.4% | 1.1% | 2.8% |
| Expenses | 3.1% | 0.6% | -0.9% | -1.0% | -0.5% | -0.3% | 1.1% | -1.2% | -0.1% | -0.3% | -1.3% |
| Deficit | 35.3% | -21.7% | -26.2% | -8.1% | 12.9% | -6.6% | -2.3% | -29.4% | -442.7% | -204.7% | -222.3% |
|
*Budget forecast for 2019-20 corresponds to July 2020 Economic and Fiscal Snapshot. Shaded columns = budgets tabled after March 31st. A negative amount represents actual results that were lower than forecast, while a positive amount represents results that were higher than forecast. |
|||||||||||
Projected Deficits
Key points
- The government recorded a $61.9 billion deficit in 2023-24, $21.9 billion higher than the $40.0 billion projected for the year in Budget 2024.
- The Fall Economic Statement 2024 projects a $48.3 billion deficit for this year, or 1.6 per cent of GDP.
- The deficit to GDP ratio is expected to decline to 1.2 per cent in 2025-26, 0.9 per cent in 2026-27 and remain below 1 per cent thereafter.
- The government continues to deliver on its on its fiscal anchor, enabling Canada's federal debt-to-GDP ratio to decline in each year, reaching 38.6 per cent in 2029-30 – about 9 per cent lower than its recent peak of 47.5 per cent in 2020-21.
| 2018-19 | 2019-20 | 2020-21 | 2021-22 | 2022-23 | 2023-24 | 2024-25 | 2025-26 | 2026-27 | 2027-28 | 2028-29 | 2029-30 | |
|---|---|---|---|---|---|---|---|---|---|---|---|---|
| Economic and Fiscal Update 2019 | ||||||||||||
| Budgetary Balance ($ billions) | -14.0 | -26.6 | -28.1 | -22.1 | -18.4 | -16.3 | -11.6 | |||||
| Federal Debt (% GDP) | 30.8 | 31.0 | 31.0 | 30.8 | 30.4 | 29.8 | 29.1 | |||||
| Budget 2021 | ||||||||||||
| Budgetary Balance ($ billions) | -39.4 | -354.2 | -154.7 | -59.7 | -51.0 | -35.8 | -30.7 | |||||
| Federal Debt (% GDP) | 31.2 | 49.0 | 51.2 | 50.7 | 50.6 | 50.0 | 49.2 | |||||
| Economic and Fiscal Update 2021 | ||||||||||||
| Budgetary Balance ($ billions) | -327.7 | -144.5 | -58.4 | -43.9 | -29.1 | -22.7 | -13.1 | |||||
| Federal Debt (% GDP) | 47.5 | 48.0 | 47.3 | 46.9 | 46.2 | 45.3 | 44.0 | |||||
| Budget 2022 | ||||||||||||
| Budgetary Balance ($ billions) | -327.7 | -113.8 | -52.8 | -39.9 | -27.8 | -18.6 | -8.4 | |||||
| Federal Debt (% GDP) | 47.5 | 46.5 | 45.1 | 44.5 | 43.8 | 42.8 | 41.5 | |||||
| Fall Economic Statement 2022 | ||||||||||||
| Budgetary Balance ($ billions) | -90.3 | -36.4 | -30.6 | -25.4 | -14.5 | -3.4 | 4.5 | |||||
| Federal Debt (% GDP) | 45.5 | 42.3 | 42.2 | 41.6 | 40.4 | 38.9 | 37.3 | |||||
| Budget 2023 | ||||||||||||
| Budgetary Balance ($ billions) | -90.2 | -43.0 | -40.1 | -35.0 | -26.8 | -15.8 | -14.0 | |||||
| Federal Debt (% GDP) | 45.2 | 42.4 | 43.5 | 43.2 | 42.2 | 41.1 | 39.9 | |||||
| FES 2023 | ||||||||||||
| Budgetary Balance ($ billions) | -35.3 | -40.0 | -38.0 | -39.0 | -26.0 | -22.4 | -17.6 | |||||
| Federal Debt (% GDP) | 41.7 | 42.4 | 42.7 | 42.2 | 41.2 | 40.2 | 39.1 | |||||
| Budget 2024 | ||||||||||||
| Budgetary Balance ($ billions) | -35.3 | -40.0 | -39.8 | -39.9 | -30.8 | -26.8 | -20.0 | |||||
| Federal Debt (% GDP) | 41.7 | 42.1 | 41.9 | 41.5 | 40.8 | 40.0 | 39.0 | |||||
| FES de 2024 | ||||||||||||
| Budgetary Balance ($ billions) | -61.9 | -48.3 | -42.2 | -31.0 | -30.4 | -27.8 | -23.0 | |||||
| Federal Debt (% GDP) | 42.1 | 41.9 | 41.7 | 41.0 | 40.2 | 39.5 | 38.6 | |||||