
Budget 2024 and Finance Issues Raised in Parliament
On this page:
- Bank of Canada Negative Equity
- Canada Disability Benefit (CDB)
- Capital Gains Inclusion Rate
- Government Contracting
- Consumer-Driven Banking
- Debt Management Strategy
- Projected Deficits
- Economic Growth Comparisons – G7
- Housing Affordability and Immigration Growth
- Budget 2024 - Major Transfers to Provinces and Territories in 2024-25
- Mortgage Delinquencies
- Price on Pollution and the Canada Carbon Rebates
- Public Debt Charges
Bank of Canada Negative Equity
Issue
Bank of Canada losses and negative equity may be raised during the Deputy Minister's appearance before the Standing Senate Committee on National Finance (NFFN).
Key points
- In March 2020 during COVID, the Bank of Canada (Bank) introduced the Government of Canada Bond Purchase Program (GBPP) to provide liquidity to the Canadian financial system.
- At the peak of the purchase program, the Bank had purchased over $300 billion in Government of Canada bonds. This level is now declining over time as these bonds mature.
- As interest rates rise, the variable interest (based on the policy rate) the Bank pays on the settlement balances it created to purchase government securities under GBPP has exceeded the fixed interest it receives on the bonds it purchased, so the Bank is now incurring net interest losses.
- The accumulation of these losses has resulted in the Bank of Canada reporting a negative equity position on their balance sheet.
- According to the Bank's 2023 annual report, the Bank recorded a net loss of $5.65 billion as of December 31, 2023. The Bank also reported a negative equity (deficiency) position of $5.85 billion as of December 31, 2023.
- Going forward, the size and duration of these losses will depend on the path of interest rates.
- Such losses are not unique to the Bank. Many other central banks, including Australia, the U.K. and U.S., are also experiencing such losses.
- Negative equity is not expected to affect the Bank's ability to conduct monetary policy.
- In time, the Bank will resume generating net income.
- In the Budget Implementation Act, 2023, No. 1 (BIA-1 2023), the government amended the Bank of Canada Act to allow the Bank to withhold remittances until such time as the Bank is no longer reporting a negative equity position on their balance sheet.
Anticipated Questions and Answers:
1. Do you have a breakdown of the net losses of the Bank of Canada according to their latest annual report?
- According to the Bank of Canada's (the Bank's) 2023 annual report tabled on May 2, the Bank recorded a net loss of $5.65 billion in 2023. This net loss is driven mainly by interest expenses of $8.83 billion on the Bank's settlement balances, which was partially offset by the $3.85 billion of interest revenue earned on its bond portfolio. This loss was further compounded by operating expenses of $690 million.
- As interest rates rise, the variable rate of interest (which is based on the Bank's policy rate) that the Bank pays on the settlement balances it created to purchase government securities under Government of Canada Bond Purchase Program increases and currently exceeds the fixed interest it receives on the bonds it purchased. As a result, the Bank is now incurring net interest losses.
- Going forward, the size and duration of these losses will depend on the path of interest rates.
2. How did the Bank of Canada get into a negative equity position?
- In March 2020 during COVID, the Bank of Canada (Bank) introduced the Government of Canada Bond Purchase Program (GBPP) to provide liquidity to the Canadian financial system. At the peak of the purchase program, the Bank had purchased over $300 billion in Government of Canada bonds. These bonds are now declining over time as they mature.
- As interest rates rise, the variable interest (based on the policy rate) the Bank pays on the settlement balances it created to purchase government securities under GBPP has exceeded the fixed interest it receives on the bonds it purchased, so the Bank is now incurring net interest losses.
- The accumulation of these losses has resulted in the Bank of Canada reporting a negative equity position.
- According to the Bank's 2023 annual report, the Bank recorded a net loss of $5.65 billion in 2023. It reported a negative equity (deficiency) position for 2023 of $5.85 billion.
3. What is the government doing to help the Bank of Canada exit their negative equity position?
- In the Budget Implementation Act, 2023, No. 1 (BIA-1 2023), the government amended the Bank of Canada Act to allow the Bank to withhold remittances until the Bank is no longer reporting a negative equity position on their balance sheet.
- Negative equity does not affect the Bank's ability to conduct monetary policy.
Canada Disability Benefit (CDB)
Issue
Media coverage and stakeholder reaction regarding the Budget 2024 announcement of the Canada Disability Benefit generally reflected disappointment relative to expectations, in particular regarding the maximum amount of $2,400 and using the Disability Tax Credit (DTC) certificate as a basis to determine eligibility.
Key points
- The Canada Disability Benefit is a major milestone. Budget 2024 proposed funding of $6.1 billion over six years, beginning in 2024-25, and $1.4 billion per year ongoing, including costs to deliver the benefit.
- The federal government is making this investment to address the inadequacy of disability assistance by many provinces, and it aspires to see the combined amount of federal and provincial or territorial income supports for persons with disabilities grow to the level of Old Age Security and the Guaranteed Income Supplement. That means provinces also need to do more, including exempting CDB payments from counting as income in relation to their supports.
- To address an anticipated financial barrier associated with CDB take-up, Budget 2024 also proposed funding of $243 million over six years, beginning in 2024-25, and $41 million per year ongoing, to cover the cost of the medical forms required for DTC application.
- These investments build on significant existing federal supports under the Disability Inclusion Action Plan.
Background
Amendments in the Budget Implementation Act 2024, No. 1 / Bill C-69
The bill would make amendments to several acts (the Federal Courts Act, Tax Court of Canada Act and the Department of Employment and Social Development Act) regarding the appeals process to help launch the CDB.
Budget 2024 announcement
The proposed design is based on a maximum yearly amount of $2,400 for low-income persons with disabilities age 18 to 64. To deliver the benefit as quickly as possible and ensure nation-wide consistency of eligibility, the CDB would be available to people with a valid DTC certificate. As proposed, it would benefit an estimated more than 600,000 persons with disabilities.
Forthcoming draft regulations will provide more details. There will be meaningful and barrier-free opportunities to collaborate during the regulatory process and ensure the benefit is reflective of the needs of those receiving it. Persons with disabilities will be consulted on key design elements, including maximum income thresholds and phase-out rates. The benefit design will need to fit the investment proposed in Budget 2024.
Selected post-Budget statements by the government
The Prime Minister stated: "...the CDB is a milestone in our strong and unwavering commitment to creating an inclusive Canada. There is always more to do, but $6.1 billion over the coming years is going to make a difference in the lives of some of Canada's most vulnerable. Hundreds of dollars a month, tax-free, will help with the cost of living. We recognize there is more to do. We will be working with province and territories to make sure, first of all, that this disability money is not clawed back, and secondly, that we can do even more in partnership provinces and territories for Canadians."
"This government has recognized for many years that Canadians living with disabilities are facing challenges and disadvantages in our economy and in our communities. That's why we've stepped up regularly over the past years with initiatives to reduce barriers in Canada. We are now moving forward with the CDB at the cost of $6 billion over the coming years, to put hundreds of dollars a month tax-free in to the pockets of individuals with disability. The reality is there is always more to do, but this will help." – Question Period, April 17.
The Deputy Prime Minister stated: "On the disability benefit, this is the first time in the history of Canada that a federal government has put forward a disability benefit. That is a milestone. It's a good thing. It's the right thing to do. It's important to get it right and it is complicated. It's complicated when it comes to working with provinces and territories. When you're laying the foundation for something big, you want to do it properly. We absolutely aspire to do more and we see this as just the first step but an important first step." - News Conference, April 30.
The Minister of Diversity, Inclusion and Persons with Disabilities is quoted: 'defended the plan as a "major milestone" and a "key benefit," but conceded it is a "starting point." "There's always more to do but…, if you look at the budget this is the largest single item that you will see, $6.1 billion…," she said.'– CTV News, April 17.
Significant existing supports under the Disability Inclusion Action Plan
- About $1.7 billion per year to support persons with severe and prolonged mental and physical impairments through the DTC;
- Up to an additional $821 every year through the Canada Workers Benefit (CWB) Disability Supplement, beyond the basic CWB amounts of up to $1,590 for a worker and up to $2,739 for a family;
- Ongoing support for the Registered Disability Savings Plan, which has helped 260,000 persons with disabilities save a total of $8.8 billion since 2008, to provide greater income security;
- $800+ million per year via Canada Disability Savings Grants and Bonds;
- $722 million through the Workforce Development Agreements in 2024-25, approximately 30 per cent of which supports persons with disabilities with training, skills development, and work experience;
- Over $650 million annually through more generous Canada Student Grants and Loans. Students with disabilities also have access to more generous repayment assistance, as well as loan forgiveness for those with severe permanent disabilities.
- $105 million in 2024-25 to support the implementation of an employment strategy for persons with disabilities through the Opportunities Fund;
- About $500 million per year through the Child Disability Benefit provided as a supplement to the Canada Child Benefit for parents of children with severe and prolonged disabilities, providing an average of approximately $3,000 in annual support.
Capital Gains Inclusion Rate
Issue
Budget 2024 proposed to increase the capital gains inclusion rate from one half to two thirds for corporations and trusts, and from one half to two thirds on the portion of capital gains realized in the year that exceed $250,000 for individuals, for capital gains realized on or after June 25, 2024.
Key points
- The government's intention in increasing the inclusion rate is to address the lack of fairness whereby higher income individuals can pay a lower marginal tax rate on capital gains than workers pay on employment income.
- The proceeds of this change will be used to finance transformative investments in housing, innovation, the clean economy, and in younger generations.
- It is estimated that the measure would raise $19.4 billion in federal revenues over the next five fiscal years, including $6.9 billion in 2024-2025.
- The significant revenues in 2024-25 are based on the assumption that several taxpayers will accelerate dispositions prior to June 25 to take advantage of the one-half inclusion rate before the two-thirds inclusion rate goes into effect.
- Additional design details will be released in due course.
- On May 21, the Deputy Prime Minister and Minister of Finance stated that the legislative process for this measure will start before Parliament rises for the summer break.
Anticipated Questions and Answers
How much revenue would this measure generate?
It is estimated that it would generate $19.4 billion over five years, including $6.9 billion in 2024-25.
Would provincial tax revenues also be affected?
Yes, for provinces and territories harmonized with the federal tax base. The province of Québec has also indicated that it intends to harmonize with the federal policy. The Department estimates that provincial revenues could represent up to 60 per cent of federal revenues.
Why is the revenue impact so large in the earlier years and almost nil in the third year?
The capital gains accelerated and reported prior to June 25 are assumed to be gains that otherwise would have been realized in 2025, 2026 and later years. The "pull-forward" of these gains therefore reduces capital gains revenues in future years by assumption.
How many taxpayers would be affected by this measure?
Only 40,000 Canadians with an average income of $1.4 million are expected to pay more personal income tax on their capital gains in any given year.
This number does not include individuals who may be impacted via greater tax paid by a corporation they own or trust of which they are a beneficiary.
Why is this change effective on June 25?
This change gives taxpayers several weeks to determine how to arrange their affairs prior to the new rules taking effect. It also provides time for many taxpayers with transactions underway on Budget Day to conclude them before the transaction takes effect. Taxpayers would have been worse off if the changes had been instead made effective as of Budget Day.
How would employee stock options be affected?
Claimants of the employee stock option deduction would be provided a one-third deduction of the taxable benefit to reflect the new capital gains inclusion rate, but would be entitled to a deduction of one half the taxable benefit up to a combined limit of $250,000 for both employee stock options and capital gains.
How would physicians be affected?
The higher inclusion rate is based on the amount of capital gains reported annually, not occupation.
Canadians, including incorporated physicians, will continue to have access to various tax-sheltered accounts, including Registered Retirement Savings Plans and Tax-Free Savings Accounts. In some cases, physicians may find it advantageous to hold capital assets personally (i.e., not in the corporation) to benefit from the $250,000 threshold annually.
When will the government release more details about the proposed rules?
Additional design details will be released shortly. The legislative process will begin before Parliament rises for the summer break.
Background
Lifetime Capital Gains Exemption (LCGE)
Budget 2024 proposed to increase the LCGE to apply to up to $1.25 million of eligible capital gains. This measure would apply to dispositions that occur on or after June 25, 2024. Indexation of the LCGE would resume in 2026.
Canadian Entrepreneurs' Incentive (CEI)
Budget 2024 also proposed to introduce the Canadian Entrepreneurs' Incentive (CEI). This incentive would reduce the tax rate on capital gains on the disposition of qualifying shares by an eligible individual. Specifically, this incentive would provide for a capital gains inclusion rate that is one half the prevailing inclusion rate, on up to $2 million in capital gains per individual over their lifetime.
The lifetime limit would be phased in by increments of $200,000 per year, beginning on January 1, 2025, before ultimately reaching a value of $2 million by January 1, 2034.
Under the two-thirds capital gains inclusion rate proposed in Budget 2024, this measure would result in an inclusion rate of one third for qualifying dispositions. This measure would apply in addition to any available capital gains exemption.
Computation of the $250,000 Threshold
Any capital gains eligible for the CEI, the LCGE, as well as any capital gains offset by capital losses of prior years, would not be included in the computation of an individual's $250,000 limit and would therefore not be subject to the two thirds inclusion rate.
Government Contracting
Issue
Recent changes have been made to procurement practices to meet evolving requirements and ensure greater oversight and controls over procurement activities within the Department. These changes are also in response to the recent audit findings in audits conducted by the Office of the Comptroller General (OCG) and the Office of the Procurement Ombudsman (OPO) on McKinsey contracts, the OAG audit findings on ArriveCAN as well as current scrutiny from the public and parliamentary committees around the procurement function.
Key points
- Contracting for goods and services at the Department is highly centralized under the guidance of the CFO and DCFO who is also the Senior Designated Official for the management of Procurement.
- The Department has recently increased its oversight over the procurement function by implementing a departmental procurement management framework. There is now a formal procurement planning exercise in place to ensure procurement strategies are aligned with departmental priorities and investment plan and compliant with current policies and legislations.
- Enhanced controls have also been implemented, such as the introduction of a new Procurement Review Board and the inclusion of new internal controls on contracting in the Department's Internal Control Framework over Financial Management.
- Procurement tools, guidance, processes and documentation have been reviewed and updated. This includes the new TB Manager's Guide: Key Considerations When Procuring Professional Services. All delegated managers are required to attest that they have read and understand the Guide, their role and responsibilities and consequences for non-compliance.
Anticipated Questions and Answers
1. How many contracts with McKinsey has the Department of Finance awarded since January 2011.
The Department of Finance identified one contract with McKinsey since January 1, 2011. The contract was awarded on June 22, 2011. The total contract value was $743,000, including taxes, and was to assist the Task Force for the Payments System Review in transforming the various inputs and analyses into a coherent statement about the preferred future for the payments system in Canada (Conceptual Framework for the Evolution of the Canadian Payments System). The independent Task Force, announced in Budget 2010, was appointed by the Government to conduct a comprehensive review of the Canadian payments system and make recommendations to the then Minister of Finance. The task force was asked to review the safety, soundness and efficiency of the payments system; whether there was sufficient innovation in the system; the competitive landscape; whether businesses and consumers were being well served; and whether current payment system oversight mechanisms remained appropriate.
2. How many contracts with Dalian and/or Coradix has the Department of Finance awarded since January 2011.
The Department of Finance identified one contract with Dalian since January 1, 2011. The contract was awarded by Public Services and Procurement Canada (PSPC), on the department's behalf, on March 22, 2012. The total contract value was $216,351.25, including taxes, and was to provide proxy appliances for the department's computer network. The proxy appliances were routers that acted as an "intermediary" between FIN employees and the internet to help prevent cyber-attacks on the Department's networks.
Background
The Department's total contracting activity for Fiscal Year 2023-24 represented 112 contracts and amendments valued over $10K for a total of $8,995,684. This amount includes contracts awarded by FIN and by PSPC or SSC on the Department's behalf. The Department's contracting activity specific to Professional Services is below.
Description |
Transactions |
Value |
|---|---|---|
Language Training |
6 |
$1,008,384 |
HR, Business and Economic Professional Services |
10 |
$986,942 |
Public Opinion Research |
2 |
$236,679 |
Communications Professional Services |
4 |
$147,340 |
Management Consulting |
3 |
$102,830 |
Translation Services |
2 |
$88,804 |
IT Consultants |
2 |
$74,591 |
Protection Services |
2 |
$67,550 |
IT data destruction and credit rating verification |
3 |
$45,968 |
Temporary Help Services |
1 |
$39,917 |
Accounting and Audit Services |
1 |
$39,550 |
Hospitality |
1 |
$23,600 |
Total |
37 |
$2,862,155 |
Note: Values reflect contracting activity, not expenditures. |
||
Consumer-Driven Banking
Issue
In Budget 2024, the government announced that it would introduce Canada's Consumer-Driven Banking Framework to regulate access to financial data. The framework will provide Canadians and small businesses safe and secure access to financial services and products that help them manage and improve their finances, as well as providing a solution to the risks posed by screen scraping. The framework is being introduced in two parts, with elements of governance, scope and technical standards being included in BIA 1 and the remaining pieces including accreditation and common rules for privacy, liability and security to follow in BIA2.
Key points
- An estimated 9 million Canadians currently share their financial data by providing confidential banking credentials to service providers. This process, known as screen-scraping, raises security, liability, and privacy risks to consumers and the financial system.
- To protect consumers, the government has introduced Canada's Consumer Driven Banking Framework. It will enable Canadians and small businesses to securely and efficiently access innovative financial technology products and services that can help them improve their financial outcomes.
- The legislative framework will be introduced in two phases, starting with the first Budget Implementation Act (BIA1).
- BIA1 establishes the Consumer-Driven Banking Act and includes the framework's foundational elements: governance, technical standards, and scope.
- It also includes amendments to the Financial Consumer Agency of Canada Act to create a new Senior Deputy Commissioner position to supervise the framework. This position will report to the Commissioner of the Financial Consumer Agency of Canada (FCAC).
- The remaining framework elements will be finalized and introduced as part of the second Budget Implementation Act (BIA2) in the fall. These include accreditation, safeguards to protect the integrity and security of the consumer-driven banking framework and financial system, and common rules for liability, privacy and security.
- Providing immediate clarity on the foundational elements, responds to industry feedback and will allow the both FCAC and industry to begin preparation for implementing Canada's Consumer-Driven Banking Framework.
- Beginning this Spring, the Department of Finance will engage with industry, federal regulators, provincial/territorial counterparts, and other key stakeholders, including Canadian financial consumers while working to develop the remaining elements of the consumer-driven banking framework. Taken together, the proposed legislation represents a culmination of long-term engagement with industry, consumer groups, and experts and delivers a made-in-Canada solution to the issue of screen-scraping.
Anticipated Questions and Answers
1. Why isn't the whole framework being included in Budget Implementation Act 1?
Introducing foundational elements of the framework in BIA1 will give clarity to stakeholders on governance, scope, and technical standards, areas where there is broad alignment, while also providing the FCAC time to prepare and build capacity for its expanded supervisory mandate.
Introducing these key elements early in the Budget Implementation process will also give industry more time to build toward implementation readiness while the Department of Finance continues to engage with stakeholders to refine more complex elements, such as the accreditation framework and common rules for privacy, security, and liability, to be introduced in BIA2.
2. Why was the Financial Consumer Agency of Canada chosen to oversee consumer-driven banking in Canada?
The decision to name the Financial Consumer Agency of Canada (FCAC) was informed by an extensive review of international jurisdictions and is in line with international best practices. It will ensure Canadians benefit from effective government oversight of financial data sharing.
As an existing consumer protection and market conduct regulator for the financial sector, the FCAC is well placed to oversee an expanded mandate while minimizing cost to government for initial setup of the framework, and reducing the complexity and time required to establish the framework.
Consumer-driven banking enables and empowers consumers to use their own financial data to make more informed financial decisions. The FCAC's existing financial literacy and consumer education mandate make it well placed to help guide consumers who engage in consumer-driven banking.
3. Why wasn't the FCAC provided more funding in Budget 2024?
The Government is providing $1 million initially to FCAC so the agency can prepare for its new responsibilities and to begin development of a consumer awareness campaign. This planning will involve a resource assessment to determine whether additional funding would be required to implement the framework.
The FCAC will transition to a full cost-recovery basis once the framework is in place.
4. How would a federal regulator oversee provincial entities such as credit unions?
To facilitate oversight of provincial entities while respecting jurisdiction, the governance model will permit provincial entities to "opt-in" to participation and be subject to supervision for adherence to common rules by the FCAC for the purpose of consumer-driven banking only.
Once in the framework, all entities will be required to adhere to the common rules. This is with a view to establishing a pan-Canadian system, where all Canadians have equal access and protections, and all participants are subject to and follow the same rules.
Provincial governments will retain the ability to impose additional rules on credit unions.
As work on the legislative framework evolves, the government will continue to work with provincial and territorial governments to address any potential barriers to participation.
5. Wouldn't this create a two-tiered system if a provincial government elected not to allow their credit unions and caisses populaires to participate?
The goal of the framework is to establish one system for all entities and, for Canadians, with a view to ensuring that all Canadians have equal access and protections when sharing their financial data.
The government will continue to work with provincial policy makers and regulators to ensure alignment with existing jurisdiction, avoid duplication and to ensure that credit unions and caisses populaires will not face additional federal barriers to participation in the system.
The Government of Canada is committed to respecting the jurisdiction of provinces, including their right to impose additional rules on their participating entities.
6. Is the federal oversight of provincially-regulated entities for the purpose of participation in CDB constitutional?
The goal of the framework is to establish one system for all entities and, for Canadians, with a view to ensuring that all Canadians have equal access and protections when sharing their financial data.
An opt-in model for provincially regulated credit unions and caisses populaires was deemed the best means of establishing robust oversight, while respecting provincial jurisdiction.
The government will continue to work with provinces to avoid duplication, ensure alignment with existing jurisdiction and to build a Canadian framework for consumer-driven banking that benefits and protects all Canadians equally.
There are existing examples of a blending of jurisdictional responsibility for some aspects of financial institution oversight, for example the administration of the Proceeds of Crime (Money Laundering) and Terrorist Financing Act.
Background
Consumer-driven banking, also known as open banking or consumer-directed finance, refers to frameworks that allow consumers and small businesses to securely transfer their financial data through an application programming interface (API) to approved service providers of their choice. Consumer-driven banking enables consumers to securely use data-driven financial services that can help them better manage their finances and improve their financial outcomes.
For example, through consumer-driven banking, people could access services that allow them to build their credit by reporting their on-time rental payments to credit bureaus, making it easier to qualify for a mortgage.
The 2023 Fall Economic Statement committed the Government of Canada introducing a consumer-driven banking framework through Budget 2024. BIA1 of 2024 introduces implementation legislation for key components of the consumer-driven banking framework, namely governance, scope, and criteria and process for the technical standard. Remaining elements are to follow in legislation through the BIA2.
In line with international best practices, the legislation will expand the mandate of the FCAC to include oversight of consumer-driven banking and establish foundational framework elements related to scope, system participation, safeguards in respect of integrity and national security, and common rules covering privacy, liability, and security.
In addition, the principles and process for the selection of a single technical standard for data sharing will ensure the standard is fair, open, and accessible. This will ensure that the framework meets key public policy objectives for a Canadian consumer-driven banking system, including interoperability with the coming American framework overseen by the U.S. Consumer Financial Protection Bureau.
The development of Canada's Consumer-Driven Banking Framework has been guided by three public policy objectives:
- Safety and Soundness: Ensuring the continued safety and soundness of the financial sector by addressing the security risks arising from existing data sharing practices, such as screen scraping, and establishing oversight of financial data sharing activities;
- Protecting Canadians' Financial Well-Being: Ensuring that Canadians can securely and confidently exercise their right to access, use their financial data to improve their financial outcomes, and benefit from enhanced consumer choice through innovative products and services; and,
- Economic Growth and International Competitiveness: Establishing a cohesive framework, with a clear, fair, and transparent approach to accreditation, to support the continued security and stability of the Canadian financial sector, including existing financial institutions, while enabling innovation and competition.
These policy objectives have guided the development of the government's course of action on six core framework elements, including:
- Governance: Oversight and management of the framework;
- Scope: The types of data and functionalities the system will provide, the participants, and the pace at which the system should expand;
- Accreditation: The requirements and process for participating in consumer-driven banking;
- Common Rules: To protect consumers and govern the areas of privacy, liability, and security;
- National Security: Safeguards to protect the integrity and security of the consumer-driven banking framework and financial system; and,
- Technical Standard: Establishment, maintenance, and oversight of a technical standard (also referred to as pipes) flow of data between Canadians and the financial tools of their choice.
Canada' Consumer-Driven Banking Framework was informed by a series of expert-led recommendations, engagement with other jurisdictions, and extensive consultation with banks, credit unions, financial technology companies, consumer advocacy groups, and Canadians across the country.
Debt Management Strategy
Issue
The government released the Debt Management Strategy (DMS) as part of Budget 2024. The DMS outlined the government's borrowing plan for 2024-25 and announced a series of policy measures intended to support the debt program.
Key points
- Total borrowings in 2024-25 are expected to reach $508 billion, $29 billion higher than in 2023-24.
- This reflects $421 billion for refinancing debt coming to maturity, $102 billion for financial requirements and $16 billion reduction in cashFootnote 1
- The increase in borrowings relative to last year can be explained by a significant increase in maturing debt (mainly issued during the pandemic) and higher financial requirements partly attributable to funding for purchases of Canada Mortgage Bonds (CMBs).
- Despite higher interest rates, debt charges as a share of GDP are projected to remain low (1.8 per cent) in 2024-25, far below the historical average (3.4 per cent since 1981) and below that of G7 peers.
- Budget 2024 announced that the government will seek to amend the Borrowing Authority Act (BAA) to increase the maximum amount of outstanding borrowings to $2,126 billion (assuming all related legislation is passed). These amendments were included in Budget Implementation Act No. 1 tabled on May 2, 2024.
- The government's currently legislated maximum amount under the BAA is $1,831 billion. As at March 31, 2024, the outstanding debt (under section 4 of the BAA) was $1,710 billion. To ensure smooth borrowing activities by the government and Crown corporations, the government will seek Parliament's approval for an increase of the maximum amount.
- The government announced in the Budget that it would introduce a new tenor (1-month) in the Treasury bill sector to support the market's transition to a new short-term reference rate.
- The government successfully issued a $4 billion, second green bond on March 5. Canada is the first sovereign to include nuclear energy in its Green Bond Framework, reflecting the importance of nuclear in Canada's Emissions Reduction Plan, and updated taxonomies and investor preferences more open to nuclear.
Anticipated Questions and Answers
Debt Management Strategy (DMS 2024)
1. Why did the government's borrowing needs increase relative to last year?
- Borrowing needs increased relative to last year due to higher maturing debt (raised during the pandemic) being refinanced and higher financial requirements, which includes funding for the government's purchase of Canada Mortgage Bonds (CMBs).
2. What are the forecasts for debt service charges?
- Debt charges are projected to reach $54.1 billion in 2024-25 or 1.8 per cent of GDP in 2024-25.
- While debt service charges have risen over the past two years (from $22.1 billion in 2021-22 to $47.2 billion in 2023-24) with higher interest rates, debt charges as a per cent of GDP have remained significantly lower than historical standards (average of 3.4 per cent since 1981) and are projected to remain steady around 1.8 per cent until 2028-29.
3. Will increased borrowing cause Canada to breach the Parliamentary Borrowing Authority?
- The 2024-25 borrowing program is expected to remain in line with the legislated maximum borrowing limit of $1,831 billion set out in the Borrowing Authority Act.
4. Will the increase in borrowings impact Canada's AAA credit rating?
- The higher borrowing requirements are not expected to significantly increase Canada's net debt to GDP ratio.
- Budget 2024 surpassed the government's debt-to-GDP fiscal objective, forecasting a significant decline from 2023-24, and onwards. It also reiterated that the government would keep deficits below 1 per cent of GDP beginning in 2026-27 and future years (p.23).
- The IMF's April 2024 World Economic Outlook noted that Canada has the lowest general government net debt-to-GDP ratio in the G7 by a significant margin.
- Most credit rating agencies continue to affirm Canada's AAA credit rating, which also contributes to maintaining low borrowing costs.
5. How do you see Canada's debt program evolving over the next few years?
- Over the next few years, higher refinancing needs and elevated projected financial requirements will contribute to maintaining annual issuance above pre-COVID norms.
- Elevated financial requirements will be partly driven by debt issuance to raise funding for purchases of Canada Mortgage Bonds (CMBs).
- The government will continue to monitor the cost and risk of the debt portfolio and will continue to purse a strategy to minimizing debt charges and risk.
6. Why is the government introducing a 1-month treasury bill (t-bill)?
- During the Fall 2023 DMS consultations, market participants expressed desire to see the government issue 1-month treasury bills to support the Canadian money market during the transition from the soon-to-be retired reference rate, Canadian Dollar Offered Rate (CDOR), to a new short-term reference rate.
- The government announced in the Budget that it would introduce a 1-month t-bill in the debt program in May 2024 on a temporary basis.
Maximum Borrowing Amount
7. What is the Borrowing Authority Act (BAA)?
- Enacted in 2017, the BAA provides the Minister of Finance the authority to borrow money up to a maximum overall amount as set by Parliament and establishes a framework for enhancing the transparency and accountability to Parliament for the government's total borrowings (or outstanding debt).
- The maximum amount applies to the total outstanding debt of the federal government, its agent Crown corporations, and CMBs guaranteed by Canada Mortgage and Housing Corporation. The current BAA maximum amount is $1,831 billion.
8. Why is the government amending the Borrowing Authority Act?
- *Bullet redacted*
- To support smooth borrowings by the government and Crown corporations, the government is seeking an increase in the maximum borrowing amount. The new maximum value will be introduced alongside the tabling of legislation to increase that amount.
Borrowing Authority Report
9. What is the Borrowing Authority Act Report and when will it be published?
- The Borrowing Authority Act report gives a detailed account of the amounts borrowed by the Minister, agent Crown corporations, and Canada Mortgage Bonds guaranteed by Canada Mortgage and Housing Corporation. The report also provides an assessment to parliament on whether the maximum borrowing amount under that Act should be increased or decreased.
- The report was tabled to Parliament on May 2, 2024, before the deadline set by the BAA (May 31, 2024). The report showed that the combined debt stock (total borrowings) was $1,710.3 billion as at March 2024 (details about the calculations can be found in Annex 2).
ESG/Green Bonds
10. What was the rationale for including nuclear energy in Canada's Green Bond Framework?
- The Green Bond Framework was updated to better align with Canada's Emissions Reduction plan, which recognizes the role of nuclear energy in achieving net zero.
- This recognizes that nuclear energy will remain an important part of Canada's energy mix in a low-carbon future and will facilitate investments to meet Canada's climate commitments.
- The Green Bond Framework was also updated to reflect international trends and evolving market expectations with respect to nuclear energy as an eligible use of green bond proceeds.
| 2022-23 Actual |
2023-24 Actual |
2024-25 Planned |
|
|---|---|---|---|
| Treasury bills | 202 | 267 | 272 |
| 2-year | 67 | 86 | 88 |
| 3-year | 20 | 6 | 0 |
| 5-year | 31 | 47 | 60 |
| 10-year | 52 | 47 | 60 |
| 30-year | 14 | 14 | 16 |
| Green bonds | - | 4 | 4 |
| Total bonds | 185 | 204 | 228 |
| Total gross issuance2 | 387 | 471 | 500 |
| Share of Long Bonds (10-Year +) to Total Bonds | 36% | 30% | 33% |
| Share of Treasury bills to Total Issuance | 52% | 57% | 54% |
Notes: Numbers may not add due to rounding. |
|||
Annex 2 – Calculation of the Borrowing Authority Act Maximum Borrowing Amount ($ billions)
Estimated Total Debt Stock at March 31, 2024: $1,710
Incremental Government Borrowings until March 2027: $331
Net Increase of Canada Mortgage Bonds until March 2027: $72*
Incremental Agent Crown Corporation Borrowings until 2027: $9
5% Prudence Buffer: $106
Pre-Double Counting Adjustment, BAA Max Amount: $2,228
Double Counting Adjustment:
Incremental CMBs purchased by government until March 2027: ($97.5)**
5% Prudence Buffer adjustment: ($ 4.9)
Post-Double Counting Adjustment, BAA Max Amount: $2,126
*This reflects gross CMB issuance of $180B, including the $90B to be purchased by the government, and subtracts maturities of $108B.
**This includes $7.5 billion CMBs purchased by the government in February and March 2024.
Projected Deficits
Key points
- The government recorded a $35.3 billion deficit in 2022-23, $7.7 billion lower than the $43.0 billion projected for the year in Budget 2023.
- Budget 2024 projects a $40 billion deficit for 2023-24, or 1.4 per cent of GDP.
- Deficits are then expected to decline over the forecast horizon, reaching $20.0 billion, or 0.6 per cent of GDP, by 2028-29.
- As a result, the government continues to deliver on its on its fiscal anchor, enabling Canada's federal debt-to-GDP ratio to decline over the forecast horizon, reaching 39.0 per cent in 2028-29 –about 8 percentage points lower than its recent peak of 47.2 per cent in 2020-21.
- In addition, in the Fall Statement, the government announced the three fiscal objectives for Budget 2024:
- Maintaining the 2023-24 deficit at or below the Budget 2023 projection of $40.1 billion.
- Lowering the debt-to-GDP ratio in 2024-25, relative to the Fall Economic Statement, and keeping it on a declining track thereafter.
- Maintaining a declining deficit-to-GDP ratio in 2024-25 and keeping deficits below 1 per cent of GDP in 2026-27 and future years.
- Notably, Budget 2024 surpasses the government's debt-to-GDP fiscal objective, forecasting a significant fall from 2023-24, and onwards. Budget 2024 projects that, in 2024-25, the debt-to-GDP ratio will be 41.9 per cent, before declining to 39.0 per cent over the five-year forecast horizon.
- Moving forward, as part of its responsible economic plan, the government will keep deficits below 1 per cent of GDP beginning in 2026-27 and future years.
Anticipated Questions and Answers
1. The government has benefited from a significant uplift in its revenue outlook since the COVID crisis and has managed to spend it all. According to the PBO, the total uplift has been $241.9 billion and total spending $251.6 billion beginning with Budget 2021.
During and since the COVID crisis, the government has consistently invested in Canadians and the Canadian economy, which has consistently outperformed expectations.
The strong economic performance has lifted government revenues, which has, in turn, allowed the government to continue investing in Canadians and the economy while keeping on track with its fiscal anchor of lowering the federal debt-to-GDP ratio over the medium term.
Indeed, the government has taken a prudent and responsible approach to fiscal policy, maintaining Canada's significant fiscal advantage relative to its G7 peers while making substantial investments in areas like child care, housing and the green transition.
2. Last year, the year-to-date budgetary balance as of February was a $3.1 billion surplus and the government ended the year with a $35.3-billion deficit. This year, the government is already running a $17.3-billion deficit as of February, but has committed to a deficit no larger than $40 billion for the year. This does not seem likely.
Last year, the government incurred several large, anticipated expenses late in the year that are either not expected to be repeated this year, or are expected to be substantially lower. These expenses included the $2.7 billion Grocery Rebate, $2.0 billion Canada Health Transfer top-up, and those associated with Indigenous claims.
Realizing a $40-billion is not a certainty, but provided revenues maintain their recent momentum, it is achievable.
| 2022-2023 | 2023-2024 | 2024-2025 | 2025-2026 | 2026-2027 | 2027-2028 | 2028-2029 | |
|---|---|---|---|---|---|---|---|
| Budget 2023 | -43.0 | -40.1 | -35.0 | -26.8 | -15.8 | -14.0 | |
| %GDP | -1.5 | -1.4 | -1.2 | -0.9 | -0.5 | -0.4 | |
| FES 2023 | -35.3 | -40.0 | -38.4 | -38.3 | -27.1 | -23.8 | -18.4 |
| %GDP | -1.3 | -1.4 | -1.3 | -1.2 | -0.8 | -0.7 | -0.5 |
| Budget 2024 | -35.3 | -40.0 | -39.8 | -38.9 | -30.8 | -26.8 | -20.0 |
| %GDP | -1.3 | -1.4 | -1.3 | -1.2 | -0.9 | -0.8 | -0.6 |
| Difference $billions | |||||||
| From FES 2023 | 0.0 | 0.0 | -1.4 | -0.6 | -3.7 | -3.0 | -1.6 |
| From Budget 2023 | 7.7 | 0.1 | -4.8 | -12.1 | -15.0 | -12.8 |
Economic Growth Comparisons – G7
Issue
How Canada compares to its G7 peers on key macroeconomic metrics.
Key points
- Canada's macroeconomic performance compares well against its G7 peers.
- Canada has had the strongest employment recovery since the pandemic.
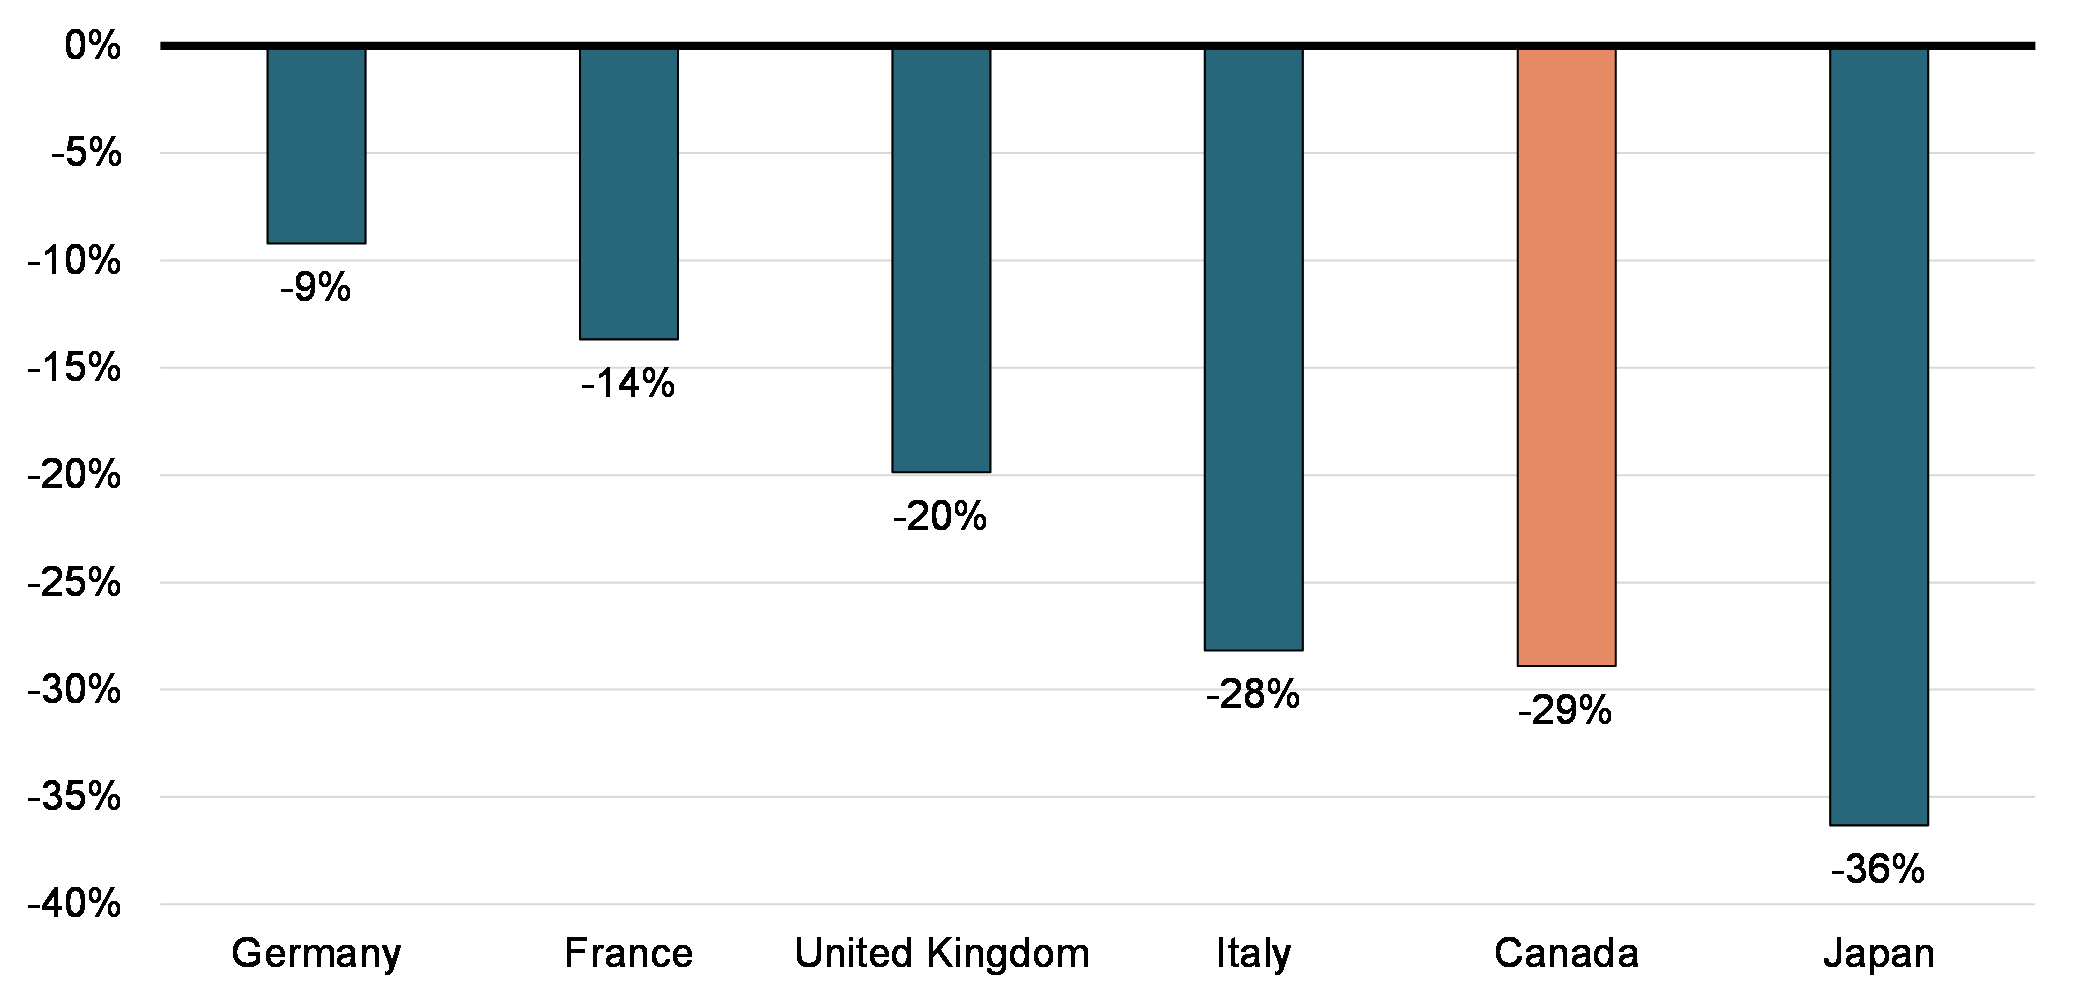
- Canada has had the second strongest real GDP recovery since the pandemic.
- Canada is expected to see the fastest growth in the G7 in 2025 according to the IMF and OECD (tied with the US in 2025).
- Canada's inflation has come down significantly from its June 2022 peak of 8.1 per cent to 2.9 per cent in March 2024.
- *Bullets redacted*
- Between the mid-1980s and 2019, Canada's productivity relative to the U.S. declined from nearly 90 per cent to just 73 per cent.
- Canada's productivity growth has continued to struggle in the post-pandemic period, with negative growth in business sector productivity over much of 2022 and 2023.
- From 2019 to 2022, Canada's productivity growth was in the middle of the G7 and 14th slowest among 38 OECD countries.
- As of 2022, Canada has the second lowest level of productivity in the G7 and is ranked 18th out of 38 OECD countries.
- To help Canada overcome these challenges in a global economy that is transitioning to net zero, the federal government has put in place various measures to spur investment and productivity growth.
- Since Budget 2021, the government has announced new major investment tax credits for clean electricity, clean technology, clean technology manufacturing, hydrogen, and carbon capture, utilization and storage, which totals $93 billion in support.
- The government has also secured more than $46 billion of public and private investments in EV battery assembly and auto supply chain since 2020.
- The Canada Growth Fund, a $15 billion arm's length public investment vehicle, has been launched and will de-risk and bolster private investment in low-carbon projects, technologies, businesses, and supply chains.
Background
| Latest | |
|---|---|
| Canada | 6.1 |
| France | 5.0 |
| Italy | 3.5 |
| Germany | 3.2 |
| U.S. | 1.8 |
| U.K. | 0.7 |
| Japan | 0.0 |
Notes: Last data points are April 2024 (U.S.), March 2024 (Canada, Germany, Italy, Japan), 2023Q4 (U.K., France). Compares to the level of February 2020, except for France and the UK (2019Q4).
|
|
| February | March* | April | |
|---|---|---|---|
| U.S. | 3.2 | 3.5 | -- |
| U.K. | 3.4 | 3.2 | -- |
| Canada | 2.8 | 2.9 | -- |
| Japan | 2.8 | 2.7 | -- |
| France | 3.0 | 2.3 | 2.2 |
| Germany | 2.5 | 2.2 | 2.2 |
| Italy | 0.8 | 1.2 | 0.9 |
*ranked by March |
|||
| 2020-21 actual results | 2021-22 actual results | 2022-23 actual results | 2023-24 actual results | |
|---|---|---|---|---|
| Rate (%) | 70.1 | 73.5 | 75.6 | 75.8 |
| Ranking among OECD | 19th in the OECD (2020 calendar year) | 14th in the OECD (2021 calendar year) | 12th in the OECD (2022 calendar year) | 12th in the OECD (2023 calendar year) |
| %, quarterly change at annual rate | % change | ||||||
|---|---|---|---|---|---|---|---|
| 2023Q1 | 2023Q2 | 2023Q3 | 2023Q4 | 2024Q1 | 19Q4-20Q2 | 19Q4-23Q4 | |
| U.S. | 2.2 | 2.1 | 4.9 | 3.4 | 1.6 | -9.1 | 8.2 |
| Canada | 2.6 | 0.6 | -0.5 | 1.0 | -- | -12.7 | 4.4 |
| Italy | 1.7 | -0.7 | 1.4 | 0.5 | 1.2 | -17.1 | 4.2 |
| Japan | 4.0 | 4.2 | -3.2 | 0.4 | -- | -7.3 | 3.1 |
| France | -0.1 | 2.6 | 0.3 | 0.5 | 0.9 | -17.8 | 1.9 |
| U.K. | 0.7 | 0.0 | -0.5 | -1.2 | -- | -22.5 | 1.0 |
| Germany | 1.1 | -0.3 | 0.6 | -2.0 | 0.9 | -10.8 | 0.1 |
*Ranked by 19Q4 to 23Q4 growth |
|||||||
| %, quarterly change at annual rate | % change* | |||
|---|---|---|---|---|
| 23Q2 | 23Q3 | 23Q4 | 19Q4-23Q4 | |
| U.S. | 1.6 | 4.2 | 2.8 | 6.7 |
| Italy | -0.4 | 1.5 | 0.5 | 5.6 |
| Japan | 4.2 | -2.5 | - | 4.3 |
| France | 2.2 | -0.1 | 0.1 | 0.5 |
| U.K. | -0.8 | -1.5 | -2.2 | -1.5 |
| Germany | -0.7 | 0.2 | -2.4 | -1.7 |
| Canada | -1.8 | -4.0 | -3.2 | -2.5 |
*Ranked by 19Q4 to 23Q4 growth. Data for Japan ends in 2023Q3. Constant US$, OECD PPP. |
||||
| 2003 | 2022* | |||
|---|---|---|---|---|
| Level ($US) | Relative to US | Level ($US) | Relative to US | |
| U.S. | 39,418 | 100 | 77,176 | 100 |
| Germany | 30,322 | 77 | 66,500 | 86 |
| Canada | 32,393 | 82 | 62,160 | 81 |
| France | 28,217 | 72 | 57,160 | 74 |
| U.K. | 30,302 | 77 | 56,742 | 74 |
| Italy | 29,173 | 74 | 55,863 | 72 |
| Japan | - | - | 47,201 | 61 |
*Ranked by 2022 level. Current US$, OECD PPP. |
||||
| Current Projection* | |||
|---|---|---|---|
| 2023 | 2024 | 2025 | |
| Canada | 1.1 | 1.2 | 2.3 |
| U.S. | 2.5 | 2.7 | 1.9 |
| France | 0.9 | 0.7 | 1.4 |
| U.K. | 0.1 | 0.5 | 1.5 |
| Germany | -0.3 | 0.2 | 1.3 |
| Italy | 0.9 | 0.7 | 0.7 |
| Japan | 1.9 | 0.9 | 1.0 |
*Ranked by 2025 projection
|
|||
| Latest | |
|---|---|
| U.S. | 4.3 |
| Germany | 2.3 |
| U.K. | 2.2 |
| Canada | 1.8 |
| Japan | 1.5 |
| Italy | 1.0 |
| France | -3.3 |
*Based on constant US$, OECD PPP. |
|
Productivity Gap with US, G7, 2022
Business-sector Productivity, Canada and US (2019 Q4 = 100)

Housing Affordability and Immigration Growth
Issue
High home prices, rising rents, and elevated mortgage rates have caused a deterioration in housing affordability in Canada. Lack of supply and rapid population growth due to immigration remain key issues.
Key points
- Through Canada's Housing Plan, the government is tackling housing affordability challenges on many fronts.
- It is supporting the development of more housing supply by the private sector through the removal of GST from new rental constructions and an expansion of the Canada Mortgage Bond program. It is also providing over
$55 billion in concessionary financing through the Apartment Construction Loan Program. - It is continuing to invest in growing Canada's stock of affordable housing through the National Housing Strategy. A top-up of $1 billion was provided to the Strategy's flagship Affordable Housing Fund in each of Budget 2024 and the 2023 Fall Economic Statement, bringing total program funding to $15 billion.
- It is working with other orders of government, through provincial and territorial housing agreements and through the now $4.4 billion Housing Accelerator Fund, to address housing challenges, including by removing key barriers to more housing development.
- It is directly supporting individuals afford their homes through the Canada Housing Benefit, which was topped-up by nearly $100 million in 2023-24, and the Canadian Mortgage Charter, which is ensuring banks are working with Canadians to afford their mortgages.
- And, it has taken steps to align permanent and temporary immigration more closely with housing capacity, such as stabilizing new permanent resident admissions and decreasing the number of temporary residents to 5 per cent of the population. While several measures have been introduced to date, further details on how to achieve the 5 per cent target will be announced this fall as part of the Immigration Levels Plan 2025-2027.
Anticipated Questions and Answers
How did the Government come to its estimate of 3.87 million homes to be created through its Housing Plan?
- The reference to 3.87 million new homes includes two components: a net new commitment of 2 million homes on top of a business-as-usual forecast of 1.87 million homes.
- Of the 2 million net new homes, the government is calling on other levels of government to achieve 800,000. A breakdown of the remaining 1.2 million homes to be created through federal measures is not publicly available. However, targets for key federal measures include:
- 750,000 homes fast-tracked through the Housing Accelerator Fund over the next 10 years, with an additional 12,000 to be achieved over the next three years through the Budget 2024 top-up.
- 250,000 homes to be unlocked on public lands, as announced in Budget 2024.
- 60,000 supported by 2031-32 through a combined $30 billion in top-ups to the Apartment Construction Loan Program through FES 2023 and Budget 2024.
- 30,000 additional units annually through the increase to the Canada Mortgage Bond Limit.
- The removal of the Goods and Services Tax on new rental apartment projects and co-ops has been estimated to kickstart the construction of up to 300,000 new homes.
Background
The government continues to invest heavily in housing, including through the measures below.
Budget 2024
- Launching a new Public Lands for Homes Plan, including a $500 million Public Lands Acquisition Fund.
- A further $15 billion in loan funding for purpose-built rentals under the Apartment Construction Loan Program, beginning in 2025-26. Combined with FES 2023 investments, this brings total program funding to over $55 billion, with the goal of supporting over 131,000 homes.
- Providing $6 billion over 10 years, starting in 2024-25, to launch a new Canada Housing Infrastructure Fund, to accelerate the construction and upgrading of housing-enabling infrastructure.
- Topping up the $4 billion Housing Accelerator Fund with an additional $400 million over four years, beginning in 2024-25, in order to fast-track 12,000 additional homes.
- A further $1 billion in funding for the Affordable Housing Fund. This brings total program funding to over $15 billion, with the goal of supporting 60,000 new housing units and renewing / repairing another 240,000.
- Announcing a new $1.5 billion Canada Rental Protection Fund to preserve and grow affordable housing supply.
- Investing $1.3 billion over four years, starting in 2024-25, in Reaching Home: Canada's Homelessness Strategy.
2023 Fall Economic Statement
- $15 billion in loan funding for purpose-built rentals under the Apartment Construction Loan Program beginning in 2025-26.
- $1 billion in contributions for the Affordable Housing Fund (AHF) beginning in 2025-26.
- $50 million to support municipal enforcement of restrictions on short-term rentals.
- Denial of expenses in computing income from a non-compliant short-term rental.
- $309 million in additional investments for the Co-Operative Housing Development Program beginning in 2025-26.
- Canadian Mortgage Charter, which highlights the tailored mortgage relief that the government expects banks to provide to borrowers who are facing financial difficulty with the mortgage on their principal residence (further enhanced in Budget 2024).
Other Recent Initiatives
- $100 million top-up to Reaching Homes in 2023-24 for winter homelessness.
- $98 million top-up to the PT administered Canada Housing Benefit in 2023-24.
- Temporarily enhance the Goods and Services Tax (GST) Rental Rebate (to 100%) for new purpose-built rental housing, to incentivize the construction of more apartment buildings and other types of housing built for long-term rental accommodation.
- Up to $20 billion in additional low-cost financing available for rental projects through the Canada Mortgage Bond program. This measure will support the building of up to 30,000 new rental units a year.
- The government has also taken steps to align permanent and temporary immigration more closely with housing capacity.
- The 2024–2026 Immigration Levels Plan announced the government's intention to welcome 485,000 new permanent residents in 2024, and to stabilize admissions at 500,000 per year beginning in 2025.
- The government also announced its intention to decrease the number of temporary residents to 5 per cent of the population, which is expected to result in approximately 600,000 fewer temporary residents over the next three years.
- 600,000 is a preliminary estimate based on the number of non-permanent residents in Canada as of January 1, 2024 and is subject to change.
- According to Statistics Canada, there were 2.6 million non-permanent residents living in Canada on January 1, 2024 (i.e. work and study permit holders and their family members, and asylum claimants), accounting for 6.5 per cent of the overall population.
- Several measures have been announced to manage temporary immigration inflows, including:
- Modernizing the Safe Third Country Agreement in March 2023, resulting in fewer individuals claiming asylum at irregular border crossings.
- Introducing travel requirements for Mexican visitors as of February 29, 2024, which are intended to relieve pressure on the asylum system.
- Introducing a two-year cap on study permit application intake by province and territory, which is expected to decrease approved study permits by up to 28 per cent from 2023 levels for the groups included under the cap.
- Amending rules for post-graduation work permits so that students attending private colleges with curriculum-licensing agreements are ineligible to apply.
- Tightening restrictions on the number of temporary foreign workers employers can hire for low-wage occupations, and requiring employers to explore every options before hiring temporary foreign workers – including recruiting asylum seekers with valid work permits.
Further details on how to achieve the 5 per cent target will be announced this fall as part of the Immigration Levels Plan 2025-2027, which will be expanded to include specific targets for temporary residents, in addition to regular planning for permanent residents.
Budget 2024 - Major Transfers to Provinces and Territories in 2024-25
Issue
In 2024-25, major transfers to other levels of government will be $99.4 billion.
Key points
- Based on formulas set out in legislation, major transfers to provinces and territories will increase by $4.8 billion in 2024-25:
- $2.7 billion under the Canada Health Transfer;
- $492 million under the Canada Social Transfer;
- $1.3 billion under Equalization;
- $325 million under Territorial Formula Financing.
Anticipated Areas of Questioning
1. How was the envelope of the 2024-25 Canada Health Transfer (CHT) determined?
- CHT is distributed on an equal per capita basis and grows in line with a three-year moving average of nominal gross domestic product (GDP) growth, with funding guaranteed to increase by at least 3 per cent per year in 2024-25.
- The 2024-25 CHT amount is $52.1 billion, which is based on the 2023-24 CHT program payout multiplied by a three-year average of growth in nominal GDP (as it is higher than the 3 per cent legislated guaranteed rate).
- Annual growth (5.38 per cent) is based on the three-year average of GDP growth in 2022 (11.77 per cent), 2023 (1.96 per cent) and 2024 (2.42 per cent). This is larger than the 5 per cent guaranteed growth for CHT announced on February 7, 2023.
2. What were the main drivers of the legislated growth in determining the 2024-25 major transfer payments?
- CHT and Equalization were indexed to grow to the three-year average of nominal GDP growth. In the case of the CHT, there was also a legislated guaranteed rate of 3 per cent growth in 2024-25 (the 5 per cent growth guarantee announced in February 2023 has not been legislated).
- The Canada Social Transfer is legislated to grow at 3 per cent per year.
- Territorial Formula Financing increases are mainly due to growth in provincial/local expenditures, which are major components of the formula.
3. What is the timeline for the renewal of Equalization?
- The authority to make new Equalization and Territorial Formula Financing payments was set to expire on March 31, 2024.
- Following consultations with provincial and territorial governments, Budget 2023 renewed these two programs for a five-year period beginning April 1, 2024, and made technical changes to improve the transparency and accuracy of the calculation of entitlements.
- The next legislative renewal of the Equalization and Territorial Formula Financing must take place before March 31, 2029.
4. What is the Equalization floor payment for 2024-25?
- The floor payment for 2024-25 is $1.1 billion and is allocated equally per capita among seven provinces (NL, PE, NS, NB, QC, ON, MB).
- Floor payments have totaled $8.7 billion since 2018-19 (or $1.2 billion on average over the last 7 years).
5. Will the Government be initiating a review of the CST, as promised in Budget 2012?
- The Canada Social Transfer will provide $16.9 billion to provinces and territories in 2024-25 in support of social programs, notably social assistance, post-secondary education, and early learning and child care. This amount will grow by 3 per cent each year and is allocated on an equal per capita cash basis to provide stable and comparable treatment for all Canadians.
- The Government regularly consults with provincial and territorial partners on federal transfers, including the CST, through meetings of officials and ministers.
- Outside of the CST, the government has made a historic commitment of $30 billion over five years and $8.3 billion ongoing to build a Canada-wide, community-based system of quality child care.
- Engagement is also ongoing to deliver new bilateral agreements related to $200 billion in funding over ten years announced in February 2023 to improve Canada's universal public health care systems and $5.4 billion in funding to help Canadians age with dignity close to home, with access to home care or care in a safe long-term care facility.Engagement is also ongoing to deliver $200 billion in funding over ten years announced in February 2023 to improve Canada's universal public health care systems.
Background
Major Transfers to Other Levels of Government in 2024-25:
Canada Health Transfer ($52.1 billion): The CHT is the largest federal transfer program, providing long-term, predictable funding for health care.
Canada Social Transfer (CST) ($16.9 billion): The CST is a federal transfer that is provided in support of social assistance and social services, post-secondary education, and programs for children.
Equalization ($25.3 billion): Equalization ensures that less prosperous provinces have sufficient revenue to provide reasonably comparable levels of public services at reasonably comparable levels of taxation.
- Budget 2023 renewed Equalization and Territorial Formula Financing for a five-year period beginning April 1, 2024, and made technical changes to improve the transparency and accuracy of the calculation of entitlements. The next renewal of the programs must take place before March 31, 2029.
- Since 2018-19, the fixed envelope for Equalization, based on nominal GDP growth, is resulting in payments exceeding what is required to raise the fiscal capacity of recipient provinces to the national average, including 50 per cent of natural resource revenues. These "floor payments" have totaled $8.7 billion since 2018-19 (or $1.2 billion on average over the last 7 years). The floor for 2024-25 is $1.1billion.
Territorial Formula Financing (TFF) ($5.2 billion): TFF funding enables territorial governments to provide their residents with programs and services comparable to those provided in the rest of Canada.
| 2023-24 | NL | PE | NS | NB | QC | ON | MB | SK | AB | BC | NU | NT | YT | Total |
|---|---|---|---|---|---|---|---|---|---|---|---|---|---|---|
| CHT | 665 | 214 | 1,305 | 1,029 | 10,939 | 19,242 | 1,794 | 1,490 | 5,782 | 6,800 | 50 | 55 | 55 | 49,421 |
| CST | 221 | 71 | 434 | 342 | 3,634 | 6,392 | 596 | 495 | 1,921 | 2,259 | 17 | 18 | 18 | 16,416 |
| Equalization | 0 | 561 | 2,803 | 2,631 | 14,037 | 421 | 3,510 | 0 | 0 | 0 | 0 | 0 | 0 | 23,963 |
| TFF | 0 | 0 | 0 | 0 | 0 | 0 | 0 | 0 | 0 | 0 | 1,971 | 1,611 | 1,252 | 4,834 |
| Total | 886 | 847 | 4,541 | 4,002 | 28,610 | 26,054 | 5,900 | 1,985 | 7,703 | 9,058 | 2,038 | 1,685 | 1,326 | 94,634 |
| 2024-25 | NL | PE | NS | NB | QC | ON | MB | SK | AB | BC | NU | NT | YT | Total |
| CHT | 688 | 228 | 1,379 | 1,085 | 11,455 | 20,289 | 1,889 | 1,565 | 6,164 | 7,172 | 52 | 57 | 58 | 52,081 |
| CST | 223 | 74 | 448 | 352 | 3,719 | 6,587 | 613 | 508 | 2,001 | 2,329 | 17 | 19 | 19 | 16,909 |
| Equalization | 218 | 610 | 3,284 | 2,897 | 13,316 | 576 | 4,352 | 0 | 0 | 0 | 0 | 0 | 0 | 25,253 |
| TFF | 0 | 0 | 0 | 0 | 0 | 0 | 0 | 0 | 0 | 0 | 2,109 | 1,699 | 1,350 | 5,159 |
| Total | 1,130 | 911 | 5,111 | 4,335 | 28,490 | 27,451 | 6,854 | 2,073 | 8,165 | 9,501 | 2,178 | 1,775 | 1,427 | 99,401 |
| Change | NL | PE | NS | NB | QC | ON | MB | SK | AB | BC | NU | NT | YT | Total |
| CHT | 23 | 14 | 74 | 56 | 516 | 1,047 | 95 | 75 | 382 | 373 | 1 | 2 | 3 | 2,660 (5.4%) |
| CST | 3 | 3 | 14 | 11 | 85 | 195 | 17 | 13 | 81 | 70 | 0 | 0 | 0 | 492 (3.0%) |
| Equalization | 218 | 48 | 481 | 266 | -721 | 155 | 843 | 0 | 0 | 0 | 0 | 0 | 0 | 1,289 (5.4%) |
| TFF | 0 | 0 | 0 | 0 | 0 | 0 | 0 | 0 | 0 | 0 | 138 | 89 | 98 | 325 (6.7%) |
| Total | 244 | 65 | 569 | 333 | -120 | 1,397 | 955 | 88 | 463 | 443 | 139 | 90 | 101 | 4,767 (5.0%) |
CHT and CST 2023-24 represent the second estimation. CHT and CST 2024-25 represent the first estimation. Totals may not add due to rounding. Excludes other fiscal arrangements: Statutory Subsisdies, Québec Abatement, Fiscal Stabilization, Nova Scotia Offset, CHT top-up, Transit and Housing, Safe return to Class, Safe Long-Term Care, Canada-wide ELCC, Home Care and Mental Health, Canada Cities and Communities Fund, Hibernia Dividend Backed Annuity Agreements with Newfoundland and Labrador, and Deduction/Reimbursements related to the Canada Health Act. |
||||||||||||||
Mortgage Delinquencies
Issue
Higher interest rates are making it more difficult for some Canadians to make their mortgage payments.
Key points
- The government has a responsibility to support a stable housing market. Prudent mortgage rules help to ensure that Canadians take on mortgages they can afford, even as interest rates rise or life circumstances change.
- Mortgage delinquency rates remain historically low despite higher interest rates, which can make it harder for some Canadians to make their mortgage payments.
- For those Canadians experiencing mortgage hardship, the government is taking action to ensure Canadians know of the tailored relief they can seek from their financial institutions. This includes:
- The Financial Consumer Agency of Canada publishing the Guideline on Existing Consumer Mortgage Loans in Exceptional Circumstances, which assists financial institutions in adopting fair and consistent mortgage relief practices.
- The 2023 Fall Economic Statement introducing the Canadian Mortgage Charter, which underscores the government's expectation for lenders to offer tailored support to Canadians facing financial hardship with their mortgage on their principal residence.
- Budget 2024 enhanced the Canadian Mortgage Charter with more detailed expectations for lenders to proactively contact borrowers, make permanent mortgage relief measures available where appropriate, and provide information to help borrowers make informed decisions, such as before renewal.
- The government, together with federal financial sector agencies, continues to closely monitor the housing and mortgage markets, including the implementation of mortgage relief measures by financial institutions.
Anticipated Questions and Answers
1. How are mortgage borrowers coping with higher interest rates?
- Many homeowners are in a financial position to manage rising interest rates. However, lenders have been proactively reaching out to those borrowers experiencing hardship to present options to help manage situations on a case-by-case basis.
- The Office of the Superintendent of Financial Institutions closely monitors the mortgage portfolios of federally regulated financial institutions for signs of vulnerability.
2. What is the government doing to support mortgage borrowers experiencing financial hardship?
- The government is taking steps to ensure that federally regulated financial institutions provide Canadians with fair and equitable access to mortgage relief measures appropriate to borrower circumstances.
- In July 2023, the Financial Consumer Agency of Canada published its Guideline on Existing Consumer Mortgage Loans in Exceptional Circumstances, which assists financial institutions in adopting fair and consistent approaches when offering relief measures.
- Budget 2024 enhanced the Canadian Mortgage Charter, which underscores the government's expectation for lenders to offer tailored support to Canadians facing financial hardship with their mortgage on their principal residence.
Background
- National mortgage delinquency rates remain historically low and below pre-pandemic levels (0.19 per cent in February 2024 relative to 0.24 per cent in February 2020, according to data from the Canadian Bankers Association).
- According to Bank of Canada data, arrears rates (loans with a missed payment by 90 days or more) for several types of non-mortgage loans now exceed pre-pandemic levels, as per the table below:
- Consumer insolvencies have also come off their pandemic lows, though remain 3 per cent below their 2019 level in 2024Q1, based on Innovation, Science and Economic Development Canada data.
- More generally, based on the Bank of Canada's Survey of Consumer Expectations, consumers are still feeling the negative effects of inflation and interest rates, though the share of consumers feeling worse off has eased in 2024Q1 (36 per cent), down slightly from 2023Q4 (39 per cent)—a sign that the negative impacts of inflation and interest rates are no longer broadening.
- The proportion of household income devoted to debt payments – covering both mortgage and non-mortgage debt – has risen from 13.8 per cent in 2021Q4 to 15.0 per cent in 2023Q4, which is an all-time high.
| 2019Q4 (per cent) |
2023Q4 (per cent) |
|
|---|---|---|
| Auto loans | 0.48 | 0.64 |
| Credit cards | 0.87 | 0.91 |
| Unsecured lines of credit | 0.21 | 0.28 |
Price on Pollution and the Canada Carbon Rebates
Issue
The federal carbon pollution pricing system applies in all jurisdictions that request it or do not have their own pollution pricing system that meets the federal benchmark. The federal government must return all direct proceeds from the federal pollution pricing system within the jurisdiction where they were collected.
Key points
- The federal carbon pollution pricing system applies in jurisdictions that request it or do not have their own system that meets the federal benchmark.
- The Government of Canada does not keep any direct proceeds from carbon pollution pricing. All direct proceeds are returned in the province of origin.
- In provinces where the federal fuel charge applies, the majority of proceeds go straight back into the pockets of individuals and families via the Canada Carbon Rebate, ensuring most households get more money back than they pay as a result of the federal pollution pricing system, with lower-income households benefiting the most. The remainder will be returned via the proposed Canada Carbon Rebate for Small Businesses, and to farmers and Indigenous governments.
- Budget 2024 announced the new Canada Carbon Rebate for Small Businesses to directly return over $2.5 billion in proceeds from the price on pollution from 2019-20 to 2023-24 to an estimated 600,000 small- and medium-sized businesses via an accelerated and automated return process. Rebates will also be provided every year going forward.
- By putting a price on carbon pollution and returning most of the proceeds directly to Canadians, Canada is using the most efficient and affordable way to fight climate change and reduce emissions.
Anticipated Questions and Answers
1. When would eligible businesses receive the new Canada Carbon Rebate for Small Businesses?
- The Minister of Finance will specify payment rates for the 2019-20 to 2023-24 fuel charge years once sufficient information is available from the 2023 taxation year.
- Eligible corporations would need to file their tax return for 2023 by July 15, 2024, to receive a payment.
- Amounts would be automatically paid to eligible businesses via a refundable tax credit once enabling legislation receives Royal Assent, payment rates have been specified by the Minister of Finance and the Canada Revenue Agency has put in place the necessary IT systems.
2. Why is it proposed to deliver pollution pricing proceeds to small- and medium-sized businesses in this manner?
- The broad-based and simple design of the proposed Canada Carbon Rebate for Small Businesses allows payments to be administered quickly and efficiently, which is important given the delays in returning proceeds thus far.
- It ensures proceeds are returned directly to businesses in the jurisdictions where they were collected in a timely manner.
3. How many businesses would be expected to benefit from the Canada Carbon Rebate for Small Businesses, and how much could they receive, on average?
- In order to qualify, the Canadian-Controlled Private Corporation would need to have had less than 500 employees throughout Canada. Based on tax data from 2022, it is estimated that about 600,000 corporations in eligible provinces could benefit. Eligible corporations would ultimately need to file their tax return for 2023 by July 15, 2024 in order to benefit.
- Over $2.5 billion in proceeds were specified to be returned to eligible corporations in respect of the 2019-20 to 2023-24 fuel charge years.
- However, the average rebate amount is difficult to interpret as the amount any specific eligible business would receive depends on several factors, including:
- In which provinces they were operating,
- During which years; and
- How many employees they had in each of those operating years.
- As a result, a large range of rebate amounts are possible.
4. What does the federal carbon pollution pricing system cost households?
- The impacts of pollution pricing on households will vary by province. The average estimated cost per household in 2024-25 ranges from about $540 to $1,160 (as illustrated in Table 13 below).
- As well, the impacts of pollution pricing will vary depending on many factors such as energy and fuel consumption (including source of power generation) and the change in consumption patterns in response to pollution pricing.
- These estimated impacts include both direct costs from the federal fuel charge (i.e., reflecting consumption of fuels to which the federal fuel charge applies) and indirect costs from both the federal fuel charge and the federal Output-Based Pricing System (i.e., costs embedded in goods and services).
- The Canada Carbon Rebate helps offset these costs for households in provinces where the federal fuel charge applies, with average net benefit estimated to range between about $160 to $720, depending on the province.
| 2024-25 | AB | MB | ON | SK | NB | NS | PEI | NL |
|---|---|---|---|---|---|---|---|---|
| Average Cost Impacts per Household | 1,056 | 828 | 869 | 1,156 | 536 | 609 | 628 | 859 |
| Average CCR per Household | 1,779 | 1,193 | 1,124 | 1,505 | 719 | 766 | 801 | 1,162 |
| Average Net Benefit | 723 | 365 | 255 | 349 | 183 | 157 | 173 | 303 |
Notes: |
||||||||
5. What are the total payments the government estimates to make under the CCR in 2024-25?
- Across the eight provinces where the federal fuel charge applies, it is estimated that roughly 13.4 million households will receive the CCR for the 2024-25 fuel charge year.
- Total amounts paid out under the CCR across these provinces in 2024-25 is estimated to be close to $11.7 billion, including base and rural amounts paid to rural Canadians (see Table 14).
| AB | SK | ON | MB | NS | NB | PE | NL | TOTAL | |
|---|---|---|---|---|---|---|---|---|---|
| CCR | 3,024 | 692 | 6,400 | 640 | 341 | 251 | 54 | 263 | 11,665 |
6. Is Saskatchewan paying the fuel charge on natural gas in 2024-25? Will Saskatchewan residents stop getting the Canada Carbon Rebate?
- In response to the federal government's decision to temporarily pause the fuel charge on heating oil, the Saskatchewan government stated publicly that it would stop paying the fuel charge in respect of marketable natural gas as of on January 1, 2024.
- Deliveries of natural gas in Saskatchewan remain subject to the fuel charge, as in any other jurisdiction subject to the federal fuel charge.
- All provincial governments are expected to follow the law, including as it relates to the federal carbon pollution pricing system—which has been upheld by the Supreme Court of Canada.
- The Canada Revenue Agency has rigorous processes in place to ensure that any amounts of fuel charge payable are collected.
- The Canada Carbon Rebate amounts for 2024-25 for provinces subject to the federal fuel charge, including Saskatchewan, have been announced by the federal government on February 14, 2024. Residents of these provinces started to receive their first quarterly payment in April 2024.
7. What amendments are being made to the Greenhouse Gas Pollution Pricing Act (GGPPA)?
- Bill C-69 would amend the information sharing rules under Part 1 of the GGPPA, which enacts the federal fuel charge, to allow communications between officials and public disclosure of confidential information in specific, limited circumstances.
- First, it proposes to provide legislative authority for federal officials to provide other federal officials with confidential information in respect of a provincial Crown, or its provincial Crown agent, for the purposes of formulating and evaluating a response in relation to its stated or actual non-compliance with the fuel charge.
- Second, it proposes to allow the public disclosure of certain information by the Minister of National Revenue in respect of a provincial Crown, or its provincial Crown agent, that is not in compliance, or has publicly stated that it will not comply with the fuel charge, in the spirit of transparency.
- This would facilitate government communications in respect of a provincial Crown or its agent that is non-compliant or has stated that it will not comply with the federal fuel charge.
8. Why was the fuel charge temporarily removed only from heating oil and not also from all heating fuels, including natural gas or propane?
- Carbon pricing is recognized as one of the most effective ways to fight climate change while making life more affordable for Canadians.
- The carbon price is intended to apply to a broad set of emission sources.
- The proposed removal of the fuel charge for light fuel oil used as heating is temporary. This will provide additional support for households to switch to cleaner technologies, such as heat pumps.
9. What is the Government of Canada doing with the proceeds that are not returned to households?
- The remainder of proceeds will be returned to SMEs and Indigenous governments. Starting in 2024-25, 5 per cent of proceeds are allocated to small- and medium-sized enterprises (SMEs) and 2 per cent of proceeds are allocated to Indigenous governments. Prior years had different allocations.
- Budget 2024 proposed to return fuel charge proceeds to small- and medium-sized businesses via an automated and accelerated return process (the new Canada Carbon Rebate for Small Businesses).
- Environment and Climate Change Canada is responsible for returning proceeds to Indigenous governments.
- The government is committed to returning proceeds as expeditiously as possible to both groups.
- If pressed: While some of the 2019-20 proceeds were returned to SMEs and Indigenous groups, proceeds from 2020-21 and onwards have not yet been returned to these groups, as the government has been in the process of determining the return mechanisms.
| NL | PEI | NS | NB | ON | MB | SK | AB | Total | |
|---|---|---|---|---|---|---|---|---|---|
| 2019-20 | n/a | n/a | n/a | n/a | 81.4 | 13.2 | 27.0 | n/a | 121.6 |
| 2020-21 | n/a | n/a | n/a | n/a | 205.9 | 27.0 | 64.7 | 159.2 | 456.8 |
| 2021-22 | n/a | n/a | n/a | n/a | 239.7 | 22.4 | 61.9 | 142.1 | 466.1 |
| 2022-23 | n/a | n/a | n/a | n/a | 299.9 | 28.3 | 82.3 | 179.5 | 590 |
| 2023-24 | 20.1 | 4.4 | 28.5 | 17.1 | 509.3 | 53.0 | 64.7 | 237.4 | 934.5 |
| 2024-25 | 14.1 | 2.9 | 18.3 | 13.4 | 338.6 | 34.3 | 42 | 159.5 | 623.1 |
| Total | 34.2 | 7.3 | 46.8 | 30.5 | 1674.8 | 178.2 | 342.6 | 877.7 | 3192.1 |
Background
Returning Proceeds to Small- and Medium-sized Businesses
In the 2021 Economic and Fiscal Update, the government first announced its intention to return a portion of the proceeds from the price on pollution directly to small and medium-sized businesses in backstop jurisdictions through new federal programming. Prior to this, these proceeds were delivered through the Climate Action Incentive Fund, to which eligible small- and medium-sized businesses could apply to receive funding for energy-saving projects.
Budget 2022 announced that the approach would be to deliver "direct payments to support emission-intensive, trade-exposed small and medium-sized enterprises", and that Environment and Climate Change Canada (ECCC) would be responsible for this.
However, the approach to focus on emissions-intensive and trade-exposed businesses proved challenging from an implementation and administration perspective, and ECCC was not able to set up a federal program.
The Canadian Federation of Independent Businesses (CFIB) expressed a strong desire for fuel charge proceeds to be returned as quickly as possible, and a preference for targeting all small- and medium-sized businesses via the tax system, rather than just those that are emissions-intensive and trade-exposed.
GGPPA Amendments
Bill C-69 would amend the GGPPA to expand the information sharing provisions under the fuel charge in specific, limited circumstances.
Specifically, it would enable federal officials to provide other federal officials with confidential information in respect of a provincial Crown, or its provincial Crown agent, for the purposes of evaluating and formulating a response if the province or its agent is non-compliant or has stated that it will not comply with the federal fuel charge.
This measure would also allow the public disclosure by the Minister of National Revenue of certain information in respect of a provincial Crown, or its provincial Crown agent, that is non-compliant or has publicly stated that it will not comply with the federal fuel charge.
This proposal would facilitate government communications in respect of a provincial Crown or its agent that is non-compliant or has stated that it will not comply with the federal fuel charge.
This proposal would come into force on the date on which the enacting legislation receives Royal Assent.
Canada Carbon Rebate (CCR)
The CCR amount that an individual or family is entitled to is based on place of residence and family composition (See Table 4 below for annual CCR amounts for a family of four in 2024-25). Household income and household fuel consumption do not affect the CCR amount to which an individual or family is entitled.
In addition to the base rebate amount, a rural supplement is provided to those residing outside a Census Metropolitan Area (CMA) as per the most recent Census published in the year prior to the base year for the CCR calculation.
To further recognize rural Canadians' higher energy needs and their more limited access to cleaner transportation options, the government is proposing, through legislative amendments in Bill C-59, to double the rural supplement from 10 per cent to 20 per cent of the base rebate amount, starting in April 2024.
To ensure that all those who are residing in a community that has previously been eligible for the rural supplement remain eligible, the government is also proposing, through legislative amendments in Bill C-59, to continue to use the CMA determinations based on the 2016 Census for the 2024-25 and 2025-26 fiscal years.
As announced in Budget 2024, the government is also working to further expand rural supplement eligibility to more Canadians who need this support and will announce a proposal on better defining rural areas later this year.
| AB | SK | MB | ON | NB | NS | PEI1 | NL | |
|---|---|---|---|---|---|---|---|---|
| Family of Four | $1,800 | $1,504 | $1,200 | $1,120 | $760 | $824 | $880 | $1,192 |
| Rural2 | $2,160 | $1,804.80 | $1,440 | $1,344 | $912 | $988.80 | $880 | $1,430.40 |
1 Amounts for all provinces, except PEI, do not include the rural supplement. As all residents in PEI are considered to be living in a rural or small community, they are receiving the same CCR amount.
|
||||||||
Heating Oil
On October 23, 2023, the Prime Minister announced a temporary three-year pause of the fuel charge under Part 1 of the GGPPA on deliveries of heating oil used exclusively for providing heat to a home, building or similar structure, effective November 9, 2023.
As of April 1, 2027, deliveries of light fuel oil for use as heating oil will once again be subject to the applicable fuel charge at that time – 33.42 cents per litre.
Public Debt Charges
Issue
Public debt charges are rising along with interest rates.
Key points
- As shown in Budget 2024, public debt charges are expected to reach $47.2 billion in 2023‑24, or 1.6 per cent of GDP, primarily reflecting the impact of the projected increase in interest rates by private sector forecasters.
- By the end of the forecast horizon in 2028-29, public debt charges are projected to reach $64.3 billion, or 1.8 per cent of GDP.
- By historical standards, public debt charges remain low. For comparison, public debt charges peaked at 6.5 per cent of GDP in the early 1990s and were 2.1 per cent of GDP in 2007-08 before the financial crisis.
Background
Public debt charge forecasts have been revised upwards since Budget 2023, owing primarily to higher short- and long-term interest rates as forecasted by private sector economists and higher borrowing requirements.
| 2022-2023 | 2023-2024 | 2024-2025 | 2025-2026 | 2026-2027 | 2027-2028 | 2028-2029 | |
|---|---|---|---|---|---|---|---|
| Budget 2023 | 34.5 | 43.9 | 46.0 | 46.6 | 48.3 | 50.3 | |
| FES 2023 | 35.0 | 46.5 | 52.4 | 53.3 | 55.1 | 58.4 | 60.7 |
| Budget 2024 | 35.0 | 47.2 | 54.1 | 54.9 | 57.0 | 60.9 | 64.3 |
| Difference | |||||||
| From FES 2023 | 0.0 | 0.7 | 1.7 | 1.6 | 1.9 | 2.5 | 3.6 |
| From Budget 2023 | 0.5 | 3.3 | 8.1 | 8.3 | 8.7 | 10.6 |
- According to the February Fiscal Monitor, public debt charges through the first 10 months of the fiscal year (2023-24) were $42.9 billion, up 36.5 per cent from the previous year.
| 2023 | 2024 | 2025 | 2026 | 2027 | 2028 | 2023-2027 | |
|---|---|---|---|---|---|---|---|
| 3-month treasury bill rate | |||||||
| Budget 2023 | 4.4 | 3.3 | 2.6 | 2.4 | 2.4 | --- | 3.0 |
| 2023 Fall Economic Statement | 4.8 | 4.3 | 2.9 | 2.7 | 2.6 | 2.6 | 3.5 |
| Budget 2024 | 4.8 | 4.5 | 3.1 | 2.7 | 2.7 | 2.7 | 3.6 |
| 10-year government bond rate | |||||||
| Budget 2023 | 3.0 | 2.9 | 3.0 | 3.1 | 3.1 | --- | 3.0 |
| 2023 Fall Economic Statement | 3.3 | 3.3 | 3.1 | 3.2 | 3.2 | 3.3 | 3.2 |
| Budget 2024 | 3.3 | 3.3 | 3.2 | 3.3 | 3.3 | 3.4 | 3.3 |
Public Debt Charges (1983-84 to 2028-29) (Budget 2024 Forecast)
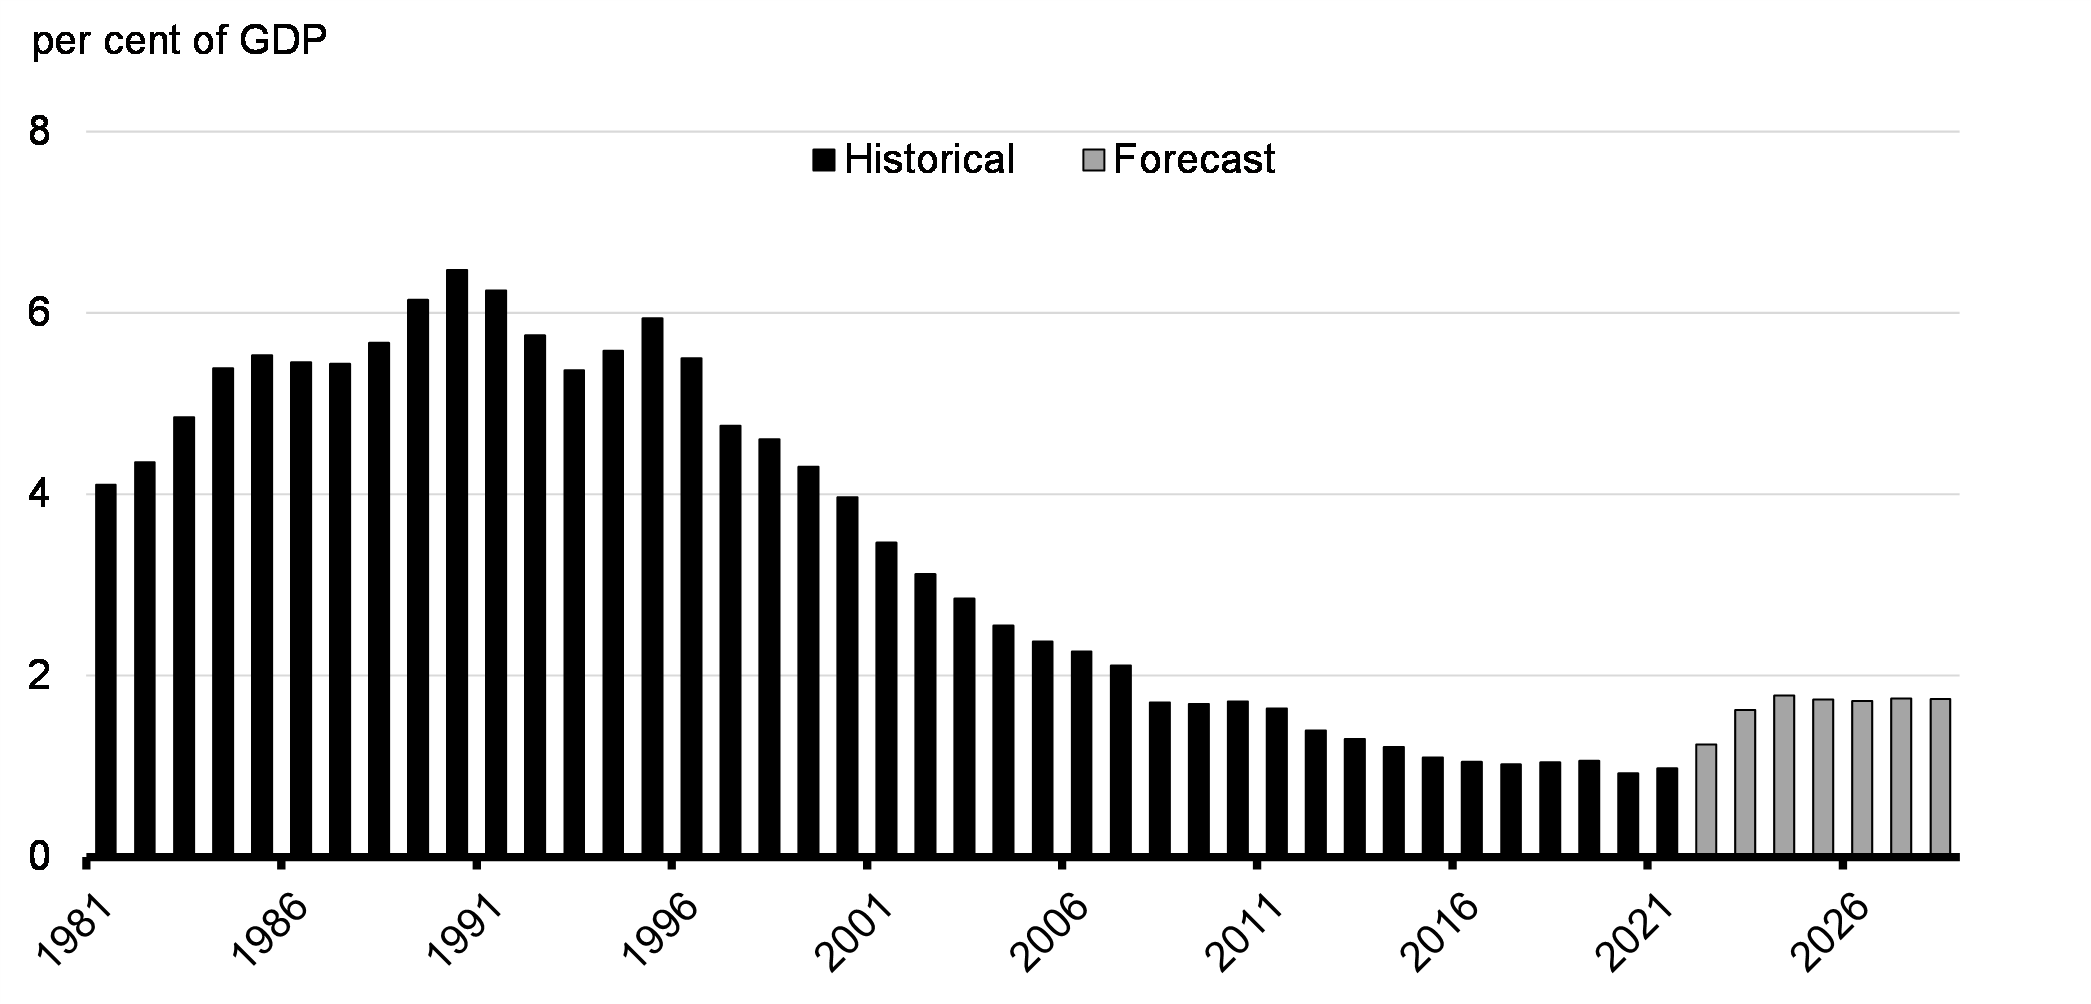
| Fiscal Year |
PDC ($ billions) |
% of GDP | % of Revenue |
|---|---|---|---|
| 1990-91 | 45.0 | 6.5 | 37.6 |
| 1991-92 | 43.9 | 6.3 | 34.8 |
| 1992-93 | 41.3 | 5.8 | 33.2 |
| 1993-94 | 40.1 | 5.4 | 32.4 |
| 1994-95 | 44.2 | 5.6 | 33.8 |
| 1995-96 | 49.4 | 5.9 | 35.2 |
| 1996-97 | 47.3 | 5.5 | 31.5 |
| 1997-98 | 43.1 | 4.8 | 26.8 |
| 1998-99 | 43.3 | 4.6 | 26.2 |
| 1999-00 | 43.4 | 4.3 | 24.6 |
| 2000-01 | 43.9 | 4.0 | 22.6 |
| 2001-02 | 39.7 | 3.5 | 21.6 |
| 2002-03 | 37.3 | 3.1 | 19.6 |
| 2003-04 | 35.8 | 2.9 | 17.8 |
| 2004-05 | 34.1 | 2.6 | 15.9 |
| 2005-06 | 33.8 | 2.4 | 15.1 |
| 2006-07 | 33.9 | 2.3 | 14.2 |
| 2007-08 | 33.3 | 2.1 | 13.6 |
| 2008-09 | 28.3 | 1.7 | 11.9 |
| 2009-10 | 26.6 | 1.7 | 12.0 |
| 2010-11 | 28.6 | 1.7 | 12.0 |
| 2011-12 | 29.0 | 1.6 | 11.8 |
| 2012-13 | 25.5 | 1.4 | 10.0 |
| 2013-14 | 24.7 | 1.3 | 9.2 |
| 2014-15 | 24.2 | 1.2 | 8.6 |
| 2015-16 | 21.8 | 1.1 | 7.5 |
| 2016-17 | 21.2 | 1.0 | 7.3 |
| 2017-18 | 21.9 | 1.0 | 7.0 |
| 2018-19 | 23.3 | 1.0 | 7.0 |
| 2019-20 | 24.4 | 1.1 | 7.3 |
| 2020-21 | 20.4 | 0.9 | 6.4 |
| 2021-22 | 24.5 | 1.0 | 5.9 |
| 2022-23 | 35.0 | 1.2 | 7.8 |
| 2023-24 | 47.2 | 1.6 | 10.1 |
| 2024-25 | 54.1 | 1.8 | 10.9 |
| 2025-26 | 54.9 | 1.8 | 10.6 |
| 2026-27 | 57.0 | 1.8 | 10.6 |
| 2027-28 | 60.8 | 1.8 | 10.9 |
| 2028-29 | 64.3 | 1.8 | 11.0 |
Source: Fiscal Reference Tables, Department of Finance Canada Calculations |
|||