
Marginal Effective Tax Rates
Backgrounder
Executive Summary
Analysts may use different metrics to compare taxation levels across countries. The statutory corporate income tax rate - also called the "headline rate" - provides a high-level measure of income taxes payable by a profitable corporation. However, this method does not account for differences in the definition of taxable income, the availability of tax incentives, as well as other taxes that corporations may have to pay (sales taxes, capital taxes, and so on). For this reason, it can be advantageous to use more comprehensive ways of measuring tax competitiveness. Such metrics include the average effective tax rate and the marginal effective tax rate (METR). This backgrounder focuses on the METR.
The METR is an estimate of the level of taxation on a new business investment, and takes into account federal, provincial and territorial statutory corporate income tax rates, as well as other features of the corporate tax system. These other features include investment tax credits and key deductions, such as capital cost allowances. The METR also takes into account other taxes paid by corporations, such as capital taxes and unrecoverable sales taxes paid on capital purchases.
The METR is particularly useful for making comparisons among nations and sectors of the economy. Since the METR takes many factors into account, it provides a broad indication of overall tax competitiveness that is an important supplement to comparisons of statutory tax rates. METRs also provide a valuable historical perspective.
This backgrounder uses METRs to examine Canada's business tax competitiveness relative to the U.S. and other countries of the Organisation for Economic Co-operation and Development (OECD) as a result of tax changes announced in the 2018 Fall Economic Statement and the important tax changes announced by the United States in December 2017. The conclusions can be summarized as follows:
- METRs in Canada have been on a downward trend since 2000 as a result of federal and provincial actions. The average METR stands at 13.7 per cent in 2019 compared to 44.1 per cent in 2000.
- Canada's average METR is the lowest in the G7 and below the average of the OECD.
- Canada maintains a METR advantage relative to the U.S. of 4.7 percentage points on average. The U.S. tax changes therefore reduced, but did not eliminate, the relative tax advantage for new investments in Canada.
- The Canadian advantage relative to the U.S. largely stems from the wider adoption of value-added taxes in Canada (GST/HST). Value-added taxes do not add to business costs, as taxes paid on capital inputs are creditable to the business. In contrast, many U.S. states apply retail sales taxes on capital inputs.1
- Canada's manufacturing sector remains particularly competitive relative to the U.S., with an average METR of 3.1 per cent, which is 16.4 percentage points below the average U.S. manufacturing METR.
Department of Finance METR Methodology
METRs are estimated on the basis of an economic model of an investment, which relies on a variety of assumptions about economic conditions and the parameters of the investment. In order to compare Canada's METR with that of other countries, the Department of Finance METR model applies the tax system parameters of other countries to Canada's economic structure and conditions (rate of return, inflation, economic depreciation, composition of capital investments, debt/equity ratio, etc.).2 Therefore, it represents what the tax burden in Canada would be if the tax system of another country were put in place in Canada. This isolates the impacts of variances in the tax law from other macroeconomic differences across countries. In practice, the METR of a particular investment would vary based on the specific characteristics of the investment. In most cases, this document focuses on the overall METR associated with a typical or average investment for the economy as a whole. However, it also provides finer estimates of METRs by sector and type of asset.3
METRs are calculated on the assumption that a taxable firm makes an investment that is small relative to its ongoing operations. As a result, it is assumed that the firm can always apply the deductions and credits earned on a new investment against taxable income earned on earlier investments. It is also assumed that the investment just earns a rate of return sufficient to reward the suppliers of capital – a "normal" rate of return.4 Consequently, METRs can be used as a measure of competitiveness, balancing the impact of a range of tax costs against incentives to invest. They are an important supplement to comparisons of statutory income tax rates.
The methodology used to determine the METR is based on the methodology presented in "Marginal Effective Tax Rates on Business Investment: Methodology and Estimates for Canadian and U.S. Jurisdictions," published by the Department of Finance in the 2005 Tax Expenditures and Evaluations report.5 The economic parameters have been updated to reflect the most recent structure of the Canadian economy in terms of industrial structure, the characteristics of the stock of capital, and evolving tax parameters of countries.
Canada's 2018 Fall Economic Statement
On November 21, 2018, the Government announced a set of measures aimed at improving Canadian business competitiveness, as part of the Fall Economic Statement.
The 2018 Fall Economic Statement announced the adoption of immediate expensing of machinery and equipment used in the manufacturing and processing of goods, as well as specified clean energy equipment. Additionally, the Fall Economic Statement announced the Accelerated Investment Incentive, which allows businesses to claim up to three times the amount of the deduction normally applicable in the first year6.
Provinces and territories that are part of a corporate Tax Collection Agreement (all provinces other than Quebec and Alberta) are required to adopt the federal measures, as they affect the amount of taxable income earned by corporations. Following the publication of the 2018 Fall Economic Statement, Quebec announced the introduction of an enhanced capital cost allowance which, similarly to the Accelerated Investment Incentive, allows businesses to claim up to three times the amount of the deduction normally applicable in the first year for investments made before 20287.
Evolution of the Canadian METR and its Components
Chart 1 - Canadian METR by year
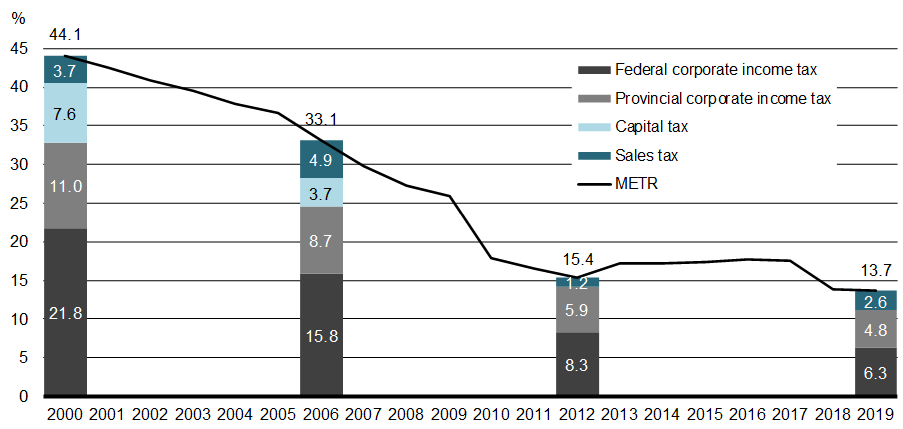
Between 2000 and 2012, the average Canadian METR declined significantly and is now about a third of its 2000 level. Throughout the period from 2012 to the present, Canada has had either the lowest or second-lowest rate in the G7.8
Chart 1 illustrates the overall downward trend in the Canadian METR since 2000. It also shows the components of the Canadian METR by type of tax at different points in time:
- In 2000, the national average METR in Canada was estimated to be 44.1 per cent.
- By 2006, federal and provincial actions had reduced the METR to 33.1 per cent. This was due in part to the elimination of the federal capital tax and the reduction in the federal corporate income tax rate to 22.12 per cent from 29.12 per cent.
- By 2012, the Canadian METR was reduced to 15.4 per cent. This was due to a gradual reduction of the federal corporate income tax rate to 15 per cent from 22.12 per cent (including the corporate surtax), an increase in various capital cost allowance rates (e.g. buildings, computers, machinery and equipment), the harmonization of some provincial retail sales taxes with the Goods and Services Tax (GST) and the elimination of all remaining general provincial capital taxes, as well as other initiatives.
- The Canadian METR now stands at 13.7 per cent, which is the lowest in the G7. The reduction from the 2012 METR was primarily the result of tax changes announced in the 2018 Fall Economic Statement.
In addition, actions implemented by provincial government have also contributed to the decline of Canada's METR, including:
- The elimination of general capital taxes in all provinces by 2012.
- The harmonization of retail sales taxes with the GST (i.e. Ontario in 2010 and Quebec and Prince Edward Island in 2013).
- The gradual reductions in corporate income tax rates in the provinces of New Brunswick, Ontario, Manitoba, Saskatchewan, Alberta, British Columbia and the three territories between 2000 and 2019.
- The introduction of various investment tax credits, in particular in the provinces of Quebec and Manitoba.
U.S. Tax Changes
At the end of 2017, the "Tax Cuts and Jobs Act" was enacted in the U.S., introducing reforms to both personal and corporate tax systems.
On the corporate tax side, the new law includes a number of measures aimed at enhancing business competitiveness. These include a reduction in the federal corporate income tax rate from 35 per cent to 21 per cent, and temporary immediate expensing of capital assets with a normal recovery period of 20 years or less. These measures are partially offset by measures that broaden the tax base, including restrictions on the use of net operating losses, a requirement to amortize R&D expenses over a longer period of time, and limitations on the deduction of net business interest expenses.
States can choose whether or not to incorporate tax changes implemented at the federal level. While some states directly incorporate the provisions of the federal Internal Revenue Code by reference, most states must enact new legislation to adopt federal changes. In the case of the temporary immediate expensing of capital assets with a useful life of twenty years or less, only 16 states accounting for approximately 17 per cent of U.S. GDP adopted these bonus depreciation rules. 9 The U.S. METRs presented in this backgrounder were calculated taking into account the varying degrees of state conformity to the tax changes announced in the U.S..
Canada and G7 Comparison
Chart 2 – International METR comparisons, OECD average10 and G7, 2019
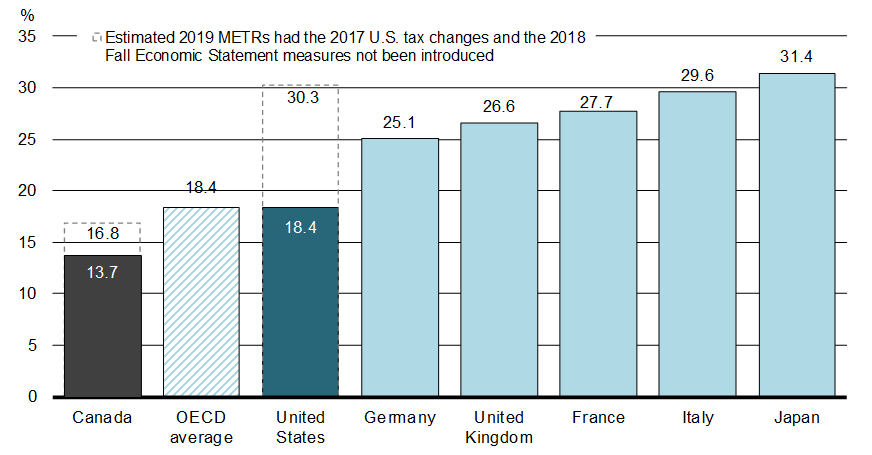
The 2017 U.S. tax changes and the 2018 Fall Economic Statement tax measures led to the most significant reduction in METRs among G7 countries in 2019.11 Chart 2 shows that the average U.S. METR in 2019 remains above the average Canadian METR.12 The U.S. METR is reduced to 18.4 per cent from 30.3 per cent, while Canada's METR is reduced to 13.7 per cent from 16.8 per cent.
Chart 2 also shows that the overall Canadian METR is below the OECD average METR, and is the lowest in the G7.
Looking ahead, coming changes to statutory tax rates in France and the United Kingdom will affect certain METR rankings, but will not affect Canada's position:
- France has legislated a reduction in its highest statutory corporate income tax rate to 25 per cent by 2022, from 33.33 per cent in 2019 (plus a 3.3 per cent surtax). This would reduce France's overall METR to 20.2 per cent; and
- The United Kingdom has legislated a reduction in its statutory corporate income tax rate to 17 per cent in 2020 from 19 per cent in 2019. This would reduce the United Kingdom's METR to 24.0 per cent.
Canada - U.S. Comparison
Given that many businesses have the option of investing in either the U.S. or Canada, this section analyses in more detail the impacts of the 2017 U.S. tax changes and 2018 Fall Economic Statement measures on the U.S. and Canadian METR estimates.
Chart 3 - Decomposition of the METR on Business Investment
(percentage point contribution to the Gap in the Canada-U.S. METR in 2019)
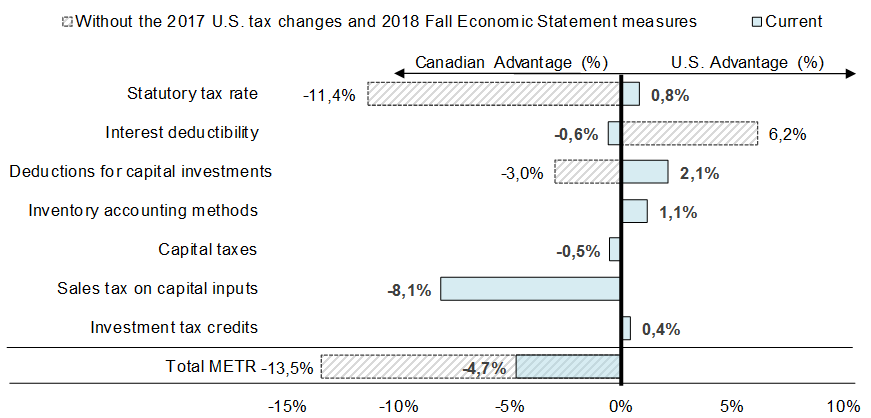
Chart 3 shows the decomposition of the overall Canadian and U.S. METRs, and the sources of each country's competitive advantages.13 Specifically:
- The impact of sales taxes is notable in this decomposition, and shows that Canada's overall METR advantage largely results from the use of valued-added taxes (GST and harmonized sales taxes at the provincial level). In the U.S., unlike Canada, most states and many municipalities14 levy sales taxes on capital goods,15 and U.S. states that impose such taxes represent a large share of the country's overall economy. As a result of the widespread use of retail sales taxes in the U.S., the Canadian METR advantage in that category is considerable (8.1 percentage points).
- The sources of U.S. advantages in the METR decomposition are not significant enough to overcome the impact of sales taxes:
- The drop in the U.S. federal tax rate from 35 to 21 per cent overall gives an average 0.8-percentage-point advantage to the U.S. The weighted average of the federal-state tax rates is estimated at 25.9 per cent in 2019, while the weighted-average federal-provincial corporate income tax rate in Canada is estimated at 26.6 per cent. Prior to the reduction in the rate, Canada had an 11.4 percentage-point advantage on average with respect to the statutory rate.
- The broader accelerated depreciation proposed in the 2018 Fall Economic Statement mitigated the impact of the 100-per-cent immediate expensing for assets with a useful life of less than twenty years included in recently announced U.S. tax changes. The U.S. now has a 2.1 percentage-point advantage in that category.
Chart 4 - Canadian and U.S. METRs by Sector, 2019
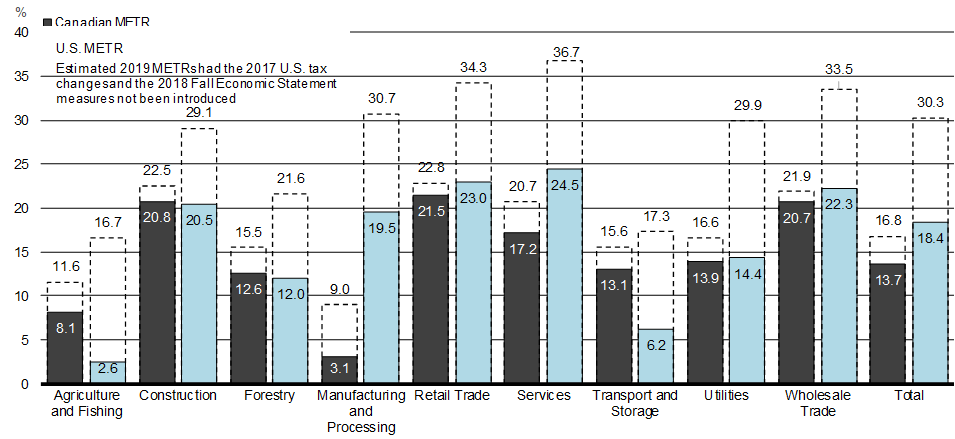
As illustrated in Chart 4, the Canadian and U.S. METRs vary across industries.
- Canada's average METR in the manufacturing sector remains very low compared to that in the U.S., at 3.1 per cent compared to 19.5 per cent.17 The main difference between the two countries comes from the impact of retail sales taxes in U.S. states, which are estimated to add 10.7 percentage points on average to the U.S. METR, but only 2.6 percentage points in Canada. Another factor contributing to the Canadian METR advantage is capital cost allowance rates, which in aggregate are more generous than in the U.S. for long-lived assets (e.g., buildings).
- The transportation and storage, and agriculture and fishing sectors in the U.S. strongly benefit from the temporary immediate expensing provision, since a large share of the business assets in these sectors are short-lived and, as such, are eligible for immediate expensing. The agricultural sector in particular sees the largest gain, since their buildings (e.g., farm buildings) are considered short-lived in the U.S. tax code, and eligible for the immediate expensing measure for the time of its duration.
Conclusion
The METR is a comprehensive metric, which takes into account not only the rate, but also other key features of the tax system of a country that apply to new capital investment.
The Canadian METR is competitive vis-à-vis the U.S. and other G7 and OECD countries as a result of numerous federal and provincial actions introduced since 2000. An important source of the METR advantage compared to the U.S. is the widespread utilization of value-added taxes in Canada. In addition, the measures introduced in the 2018 Fall Economic Statement have reduced the Canadian METR to its lowest level since 2000, at 13.7 per cent. In certain industries, such as manufacturing and processing, the Canadian advantage is even more significant, with a METR of just 3.1 per cent.
Annex 1 METRs by Asset Group
Chart 5 - Canadian and U.S. METRs by Grouping of Assets, 2019
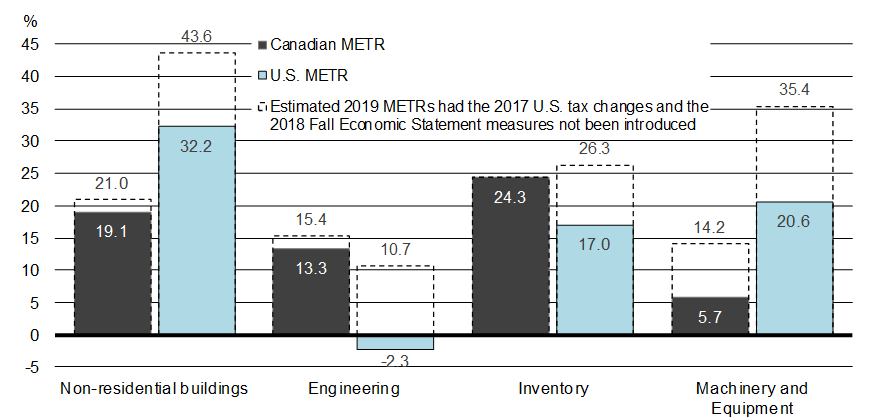
Chart 5 shows a disaggregation of the METR by grouping of assets:
- The overall impact of the U.S. tax changes on the METR for non-residential buildings was relatively small in comparison with other asset groupings, since the large majority of non-residential buildings are ineligible for immediate expensing. In addition, capital cost allowances for non-residential buildings in Canada are more generous than those provided by the U.S. tax system, even in the absence of the Accelerated Investment Incentive. Finally, the overall tax rate on non-residential buildings is affected by the higher effective sales tax rate in the U.S. compared to Canada.
- As a result of allowing immediate expensing for certain assets, the average U.S. METR on engineering assets (e.g., tunnels, bridges, roads) is now negative (-2.3 per cent), indicating that the U.S. tax system is subsidizing investments in such assets.
- The average METR for inventories was reduced to 17.0 per cent from 26.5 per cent in the U.S. following the reduction of its corporate income tax rate. The changes announced in the 2018 Fall Economic Statement had no impact on the Canadian METR for this grouping of assets.
- In the case of machinery and equipment, the Canadian METR remains considerably lower than its U.S. counterpart due to the fact that machinery and equipment is subject to significantly higher taxation via sales taxes in the U.S. tax system.
1 The GST/HST is a value-added tax where businesses get refunded for the sales taxes that they pay. This is often not the case under a retail sales tax where businesses are not able to recover the sales taxes that they pay on their purchases. As such, retail sales taxes increase METR estimates.
2 Part of the variability across METR estimates published by different authors can be explained by the taxes that are included in the calculations and the underlying economic assumptions used. For instance, the Department of Finance METR model includes highly disaggregated non-refundable sales tax information, whereas most METR publications do not. Also, some METR estimates include land transfer taxes and property taxes, which are excluded in the Department of Finance METR model, because it provides an incomplete picture of municipal-level taxes.
3 Some METR publications may include resource or financial sectors in their calculation, however both sectors are excluded from the Department of Finance METR model. Since rents are typically present in these sectors, it is debatable whether METR estimates, which assume no rents, are an appropriate metric.
4 Individual firms may possess scarce assets like intellectual property, innovative production techniques, valuable brand recognition or market protection that enable them to earn above-normal returns. The METR is not adapted to these situations.
5 See "Marginal Effective Tax Rates on Business Investment: Methodology and Estimates for Canadian and US Jurisdictions".
6 The Accelerated Investment Incentive, as well as the immediate expensing for clean energy equipment and for machinery and equipment used in the manufacturing and processing sector, applies to assets acquired after November 20, 2018 and it will be gradually phased out starting in 2024, and no longer in effect for investments put in use after 2027.
7 In the case of computer hardware, manufacturing and processing equipment, clean energy generation equipment and intellectual property, the depreciation rate was increased to 100% and a new permanent additional deduction of 30% was announced.
8 See the 2013, 2014, 2015 and 2016 Budget Plans and 2018 Fall Economic Statement, available on our website.
9 In Italy, the elimination of the Allowance for Corporate Equity (ACE) and the expiration of additional depreciation for certain assets (i.e., "super depreciation") has resulted in a substantial increase in the Italian METR to 29.6 per cent from 16.2 per cent.
10 The U.S. METR estimates assume that limits on interest deductibility, which were significantly tightened under the U.S. tax changes, do not apply.
11 See Annex 1 for a more detailed breakdown of the METR by asset type.
12 Taxation at the municipal/local level has not been included in the METR analysis.
13 Many states offer an exemption or partial exemption on business purchases but, in most cases, these exemptions are limited to a few specific sectors and/or assets. For example, many states provide a sales tax exemption for machinery and equipment purchased by manufacturers and used exclusively in the production process. These exemptions do not extend to other types of assets such as office equipment, vehicles or building materials purchased by the manufacturing sector. Overall, it is estimated that the effective sales tax rate on machinery and equipment is 4.4% in the U.S. and 0.5% in Canada, while on buildings it is 2.6% in the U.S. and 0.5% in Canada.
14 In Canada, capital cost allowance rates are generally set so that deductions are spread out over the useful life of an asset. This promotes the accurate measurement of income for tax purposes, as well as neutrality with respect to investment decisions. Overall, Canada's depreciation allowances are more generous than those in the U.S., in the absence of immediate expensing.
15 The Atlantic Investment Tax Credit contributes to the low Canadian METR in the manufacturing sector. Considering that eligibility for this credit is based on the region of investment, it is also relevant to consider the Canadian METR without the impact of this credit: the exclusion of the Atlantic Investment Tax Credit increases the Canadian METR in the manufacturing sector to 5.5 per cent, which is still significantly lower than the U.S. METR.
16 The Tax Foundation, Fiscal Fact No. 631 "Toward a State of Conformity: State Tax Codes a Year After Federal Tax Reform" published on January 28, 2019 indicates that only 16 states had adopted the immediate expensing provision.
17 OECD average excludes Canada.