
Annual Financial Report of the Government of Canada Fiscal Year 2020-2021
Note to Readers
The financial results in this report are based on the audited consolidated financial statements of the Government of Canada for the fiscal year ended March 31, 2021, the condensed form of which is included in this report.
For the 23rd consecutive year, the government has received an unmodified audit opinion from the Auditor General of Canada on the consolidated financial statements. The complete consolidated financial statements are available on the Public Services and Procurement Canada website.
The Fiscal Reference Tables have been updated to incorporate the results for 2020–21 as well as historical revisions to the National Economic and Financial Accounts published by Statistics Canada.
Report Highlights
- The government posted a budgetary deficit of $327.7 billion for the fiscal year ended March 31, 2021, compared to an estimated deficit of $354.2 billion in the April 2021 budget, mainly reflecting higher-than-expected tax and non-tax revenues and lower-than-expected program expenses.
- The budgetary deficit before net actuarial losses was $312.4 billion for the fiscal year ended March 31, 2021. The budgetary balance before net actuarial losses is intended to supplement the traditional budgetary balance and improve the transparency of the government's financial reporting by isolating the impact of the recognition of net actuarial losses arising from the government's pension and other employee future benefit plans.
- Compared to the 2019–20 fiscal year:
- Revenues decreased by $17.7 billion, or 5.3 per cent, primarily reflecting lower excise taxes and duties, particularly due to COVID-19 shutdowns and the one-time enhanced Goods and Services Tax (GST) credit payment, as well as lower Crown corporation revenues due to the impact of the COVID-19 pandemic and the Bank of Canada's secondary market purchases of Government of Canada securities.
- Program expenses excluding net actuarial losses increased by $270.1 billion, or 79.8 per cent, largely reflecting transfers to individuals, businesses, and other levels of government under the Economic Response Plan.
- Net actuarial losses, which reflect changes in the value of the government's obligations and assets for public sector pensions and other employee and veteran future benefits recorded in previous fiscal years, increased $4.7 billion, or 44.2 per cent. This increase in losses is due in large part to declines in year-end interest rates used in valuing these obligations, as well as increased costs associated with the utilization of disability and other future benefits provided to veterans.
- Public debt charges were down $4.1 billion, or 16.7 per cent, largely reflecting lower interest on the government's public sector pensions and other employee and veteran future benefits, lower interest on treasury bills, and lower Consumer Price Index adjustments on Real Return Bonds.
- The federal debt (the difference between total liabilities and total assets) stood at $1,048.7 billion at March 31, 2021. The federal debt-to-GDP (gross domestic product) ratio was 47.6 per cent, up from 31.2 per cent in the previous year.
- As reported by the International Monetary Fund (IMF), Canada's total government net debt-to-GDP ratio, which includes the net debt of the federal, provincial/territorial and local governments, as well as the net assets held in the Canada Pension Plan and Québec Pension Plan, stood at 33.0 per cent in 2020. This is the lowest level among Group of Seven (G7) countries, which the IMF expects recorded an average net debt of 104.9 per cent of GDP for the same year.
- For the 23rd consecutive year, the government has received an unmodified audit opinion from the Auditor General of Canada on the consolidated financial statements.
| 2020–21 | 2019–20 | |
|---|---|---|
| Budgetary transactions | ||
| Revenues | 316.4 | 334.1 |
| Expenses | ||
Program expenses, excluding net actuarial losses |
608.5 | 338.5 |
Public debt charges |
20.4 | 24.4 |
Total expenses, excluding net actuarial losses |
628.9 | 362.9 |
| Budgetary balance, excluding net actuarial losses | (312.4) | (28.8) |
Net actuarial losses |
15.3 | 10.6 |
| Budgetary balance | (327.7) | (39.4) |
| Non-budgetary transactions | 13.2 | (7.8) |
| Financial source/requirement | (314.6) | (47.2) |
| Net change in financing activities | 341.4 | 46.8 |
| Net change in cash balances | 26.9 | (0.4) |
| Cash balance at end of period | 64.1 | 37.2 |
| Financial position | ||
Total liabilities |
1,652.2 | 1,248.6 |
Total financial assets |
502.4 | 435.7 |
Net debt |
(1,149.8) | (812.9) |
Non-financial assets |
101.1 | 91.5 |
| Federal debt (accumulated deficit) | (1,048.7) | (721.4) |
| Financial results (per cent of GDP) | ||
Revenues |
14.4 | 14.5 |
Total program expenses |
28.3 | 15.1 |
Public debt charges |
0.9 | 1.1 |
Budgetary balance |
(14.9) | (1.7) |
Federal debt (accumulated deficit) |
47.6 | 31.2 |
| Note: Numbers may not add due to rounding. | ||
Economic DevelopmentsFootnote 1
The COVID-19 pandemic brought about the deepest and fastest recession, worldwide, since the Great Depression. During the most acute phase of the crisis, public health measures and extreme uncertainty caused a sudden and unprecedented impact on the global economy over the first half of 2020. The global economy contracted 5.3 per cent in 2020, the largest decline since the 1930s.
The shock to the Canadian economy caused by the spread of COVID-19 was historically sudden and deep. The drop in Canada's real GDP was the fourth largest in the G7 at 13.1 per cent over the first half of 2020, with much of the damage occurring over a very short time from mid-March to the end of April. Over this period, more than 5 million Canadian workers either lost their jobs or saw sharply reduced working hours. The employment rate of Canadians aged 15 to 64 fell from record highs to record lows. Canada's economy was also hit by the plunge in oil prices as demand for fuel collapsed along with travel and restrictions on movement. West Texas Intermediate crude oil prices fell from US$57/barrel in the fourth quarter of 2019 to US$28/barrel in the second quarter of 2020. Similarly, a flight to safety, significant government responses, and global monetary easing all pushed down short- and long-term interest rates to historic lows.
Following the first wave of infections, economic activity and employment rebounded at a faster pace than many had initially expected over the summer of 2020 as restrictions eased, businesses reopened, and Canadians adapted. The Canadian economy saw a bounce-back in real GDP of over 40 per cent (annualized) in the third quarter of 2020, and over three-quarters of the 3 million jobs lost at the peak of the pandemic were recovered by the end of September.
However, subsequent waves of the pandemic and recurrent lockdowns shifted the recovery into slower gear and continued to impact the economy through late 2020 and the first half of 2021. Restrictions re-intensified as cases and hospitalizations surged again in the winter and early spring, hindering tourism, indoor dining, and activities involving large gatherings. This made for highly uneven impacts across sectors, with layoffs concentrated once again in contact-sensitive businesses such as retail, hotels, entertainment, and restaurants, while other industries, such as real estate, financial and professional services, were virtually unaffected.
By the first quarter of 2021, economic activity remained about 2 per cent below its pre-pandemic peak, and nearly one million Canadians were still affected by the pandemic in the labour market through layoffs or significantly reduced hours.
Canada's COVID-19 economic response—including job protections through the Canada Emergency Wage Subsidy (CEWS), liquidity support though programs like the Canada Emergency Business Account (CEBA), and income support through the Canada Emergency Response Benefit (CERB) and the suite of Canada Recovery Benefits—has been key to bridging Canadians and businesses through these challenging times and stabilizing the economy. These fiscal responses were complemented by the Bank of Canada's low interest rate and asset purchases providing significant monetary stimulus. Overall, Canada's comprehensive and flexible response plan helped engineer a near-term economic turnaround at a faster-than-anticipated pace compared to many of its peers in the G7.
Coupled with a successful vaccination rollout that has seen a majority of Canadians already fully vaccinated, government support has helped keep household and business confidence high and put in place strong fundamentals, such as improved balance sheets and elevated savings, that will support the next phase of the recovery.
With these strong fundamentals in place, recent success containing the virus, and a large share of Canadians fully vaccinated, the recovery pace is set to accelerate in the second half of 2021, as provinces scale back the most stringent public health restrictions. Combined with a strengthening recovery in the U.S., this should put the recovery on a strong footing, with the Canadian economy likely to return to its pre-pandemic level before the end of the year.
Still, some challenges and uncertainties remain. Crucially, the health situation will continue to play a key role in shaping the outlook; the spread of more virulent strains that could potentially reduce the effectiveness of vaccines remains a key risk going forward. Unevenness in vaccination worldwide could also hold back activity in some sectors, such as travel. Further, supply-chain bottlenecks and cost pressures may limit growth in some sectors. The government regularly surveys private sector economists on their views on the economy to assess and manage risk. The survey of private sector economists has been used as the basis for economic and fiscal planning since 1994 and introduces an element of independence into the government's forecasts. This practice has been supported by international organizations, such as the IMF.
| 2019 | 2020 | 2021 | 2022 | |
|---|---|---|---|---|
| Real GDP growth | ||||
Budget 2019 |
1.9 | 1.6 | 1.7 | 1.9 |
Budget 2021 |
1.9 | (5.3) | 5.8 | 4.0 |
Actual |
1.9 | (5.3) | – | – |
| Nominal GDP growth | ||||
Budget 2019 |
3.4 | 3.5 | 3.7 | 3.9 |
Budget 2021 |
3.6 | (4.6) | 9.6 | 6.0 |
Actual |
3.6 | (4.6) | – | – |
| 3-month treasury bill rate | ||||
Budget 2019 |
1.9 | 2.2 | 2.3 | 2.4 |
Budget 2021 |
1.7 | 0.4 | 0.1 | 0.2 |
Actual |
1.7 | 0.4 | – | – |
| 10-year government bond rate | ||||
Budget 2019 |
2.4 | 2.7 | 2.8 | 3.1 |
Budget 2021 |
1.6 | 0.7 | 1.5 | 1.8 |
Actual |
1.6 | 0.7 | – | – |
| Unemployment rate | ||||
Budget 2019 |
5.7 | 5.9 | 6.0 | 6.0 |
Budget 2021 |
5.7 | 9.6 | 8.0 | 6.5 |
Actual |
5.7 | 9.6 | – | – |
| Consumer Price Index inflation | ||||
Budget 2019 |
1.9 | 2.0 | 1.9 | 2.0 |
Budget 2021 |
2.0 | 0.7 | 2.2 | 2.0 |
Actual |
2.0 | 0.7 | – | – |
| Note: Historical figures have been restated to reflect revisions in the Canadian System of National Accounts as of the first quarter of 2021, released on June 1, 2021. | ||||
Canada's COVID-19 Economic Response Plan
The unprecedented shift in the government's financial results in 2020–21 reflects the severe deterioration in the economic situation brought on by the COVID-19 pandemic and temporary measures implemented through Canada's Economic Response Plan (ERP) to protect Canadians and businesses from the impacts of the pandemic. Since March 2020, the government has committed over $345 billion—15.7 per cent of 2020 GDP—as part of the ERP to protect the health and safety of Canadians and provide direct support to workers and businesses through the crisis. Canada's ERP focuses on three broad areas of support:
- Health Care System and Safety of Canadians, such as funding to strengthen critical health care systems, purchase personal protective equipment and supplies, and support critical medical research and vaccine developments.
- Support to Individuals, which includes delivering immediate income support to those most affected by the crisis, creating incentives for safe participation in the labour market, and ensuring vulnerable Canadians have access to the supports they need.
- Support to Businesses, such as support for market liquidity to ensure that businesses can continue to access credit, and bridge financing for businesses of all sizes so they can remain solvent and keep Canadians employed.
Combined, these measures make Canada's plan one of the most comprehensive and generous response plans in the world. The government continues to take the necessary steps to ensure timely access to the support that Canadians and businesses need to manage the pressures they are facing as a result of COVID-19, so that the Canadian economy is well-positioned to recover as the pandemic subsides.
The fiscal impact of the ERP on the government's 2020–21 financial results is estimated at over $240 billion, the vast majority of which represents increased transfers to individuals, businesses, and provinces and territories. However, due to challenges in isolating the economic impacts of the COVID-19 crisis and measures introduced under the ERP from other "baseline" transactions and economic activity driving changes in the government's revenues and expenses, it is not possible to provide a precise measure of the total unique impact of COVID-19 on the 2020–21 financial results.
Some of the more significant ERP measures affecting the 2020–21 financial results include:
Spending programs, including:
- $80.2 billion in assistance under the CEWS;
- $63.7 billion under the CERB, including payments to individuals eligible for the Employment Insurance Emergency Response Benefit (EI ERB);
- $16.8 billion under the Canada Recovery Benefit, Canada Recovery Sickness Benefit, and Canada Recovery Caregiving Benefit;
- $13.0 billion in transfers to provinces and territories under the Safe Restart Agreement;
- $13.1 billion under the CEBA incentive; and,
- $1.9 billion in expenses associated with vaccines and personal protective equipment.
Revenue measures and tax liquidity support, including:
- extension of the filing and payment due date for 2019 individual and corporate tax returns to September 30, 2020;
- interest relief on existing tax debts related to individual, corporate, and trust income tax returns from April 1, 2020 to September 30, 2020, and from April 1, 2020 to June 30, 2020 for GST/Harmonized Sales Tax returns;
- $5.4 billion one-time special payment through the GST credit for low- and modest-income families; and,
- cessation of interest accrual and suspension of loan repayments for all student borrowers from March 30, 2020 to September 30, 2020.
In addition to direct support measures, credit and liquidity support has also been made available by a number of Crown corporations, including, for example:
- the Bank of Canada, under several large-scale asset purchase programs to increase liquidity in core funding markets. From March 2020 to March 2021, investments held by the Bank increased by over $300 billion, largely reflecting market purchases of Government of Canada bonds. This growth is offset by a corresponding increase in the Bank's liabilities for bank notes in circulation and deposits.
- Export Development Canada (EDC), which administered the CEBA program on the government's behalf. As of March 31, 2021, loans outstanding under CEBA totalled approximately $45 billion, including the repayment incentive mentioned above.
- Canada Mortgage and Housing Corporation (CMHC), through the Insured Mortgage Purchase Program (IMPP). As of March 2021, CMHC had purchased over $5.8 billion of insured mortgages from financial institutions under the IMPP.
- the Business Development Bank of Canada (BDC), as well as EDC, under a number of other programs including the Business Credit Availability Program (BCAP), which is delivered in collaboration with private sector lenders. As of March 31, 2021, BDC, in collaboration with private sector lenders, had authorized $1.1 billion in loans under BCAP, while EDC had guaranteed approximately $1 billion in loans extended to Canadian companies by financial institutions.
The Government of Canada's debt program increased significantly in 2020–21 in order to make the necessary investments to stabilize the Canadian economy in response to the extraordinary circumstances of the COVID-19 pandemic. Between April 1, 2020 and March 31, 2021, the government's unmatured debt increased by $341.4 billion, largely reflecting an increase in the issuance of marketable bonds and treasury bills. Information regarding the government's most recent Debt Management Strategy, which sets out the Government of Canada's objectives, strategy and borrowing plans for its domestic debt program and the management of its official international reserves, can be found in Annex 2 of Budget 2021.
Further information can be found on Canada's COVID-19 Economic Response Plan Website.
The Budgetary Balance
The government posted a budgetary deficit of $327.7 billion in 2020–21, compared to a deficit of $39.4 billion in 2019–20.
The annual deficit before net actuarial losses represents the difference between the government's revenues and expenses excluding net actuarial losses. By excluding the impact of changes in the value of the government's obligations and assets for public sector pensions and other employee and veteran future benefits recorded in previous fiscal years, this measure is intended to present a clearer picture of the results of government operations during the current fiscal year. The annual deficit before net actuarial losses stood at $312.4 billion for 2020–21, compared to $28.8 billion in 2019–20.
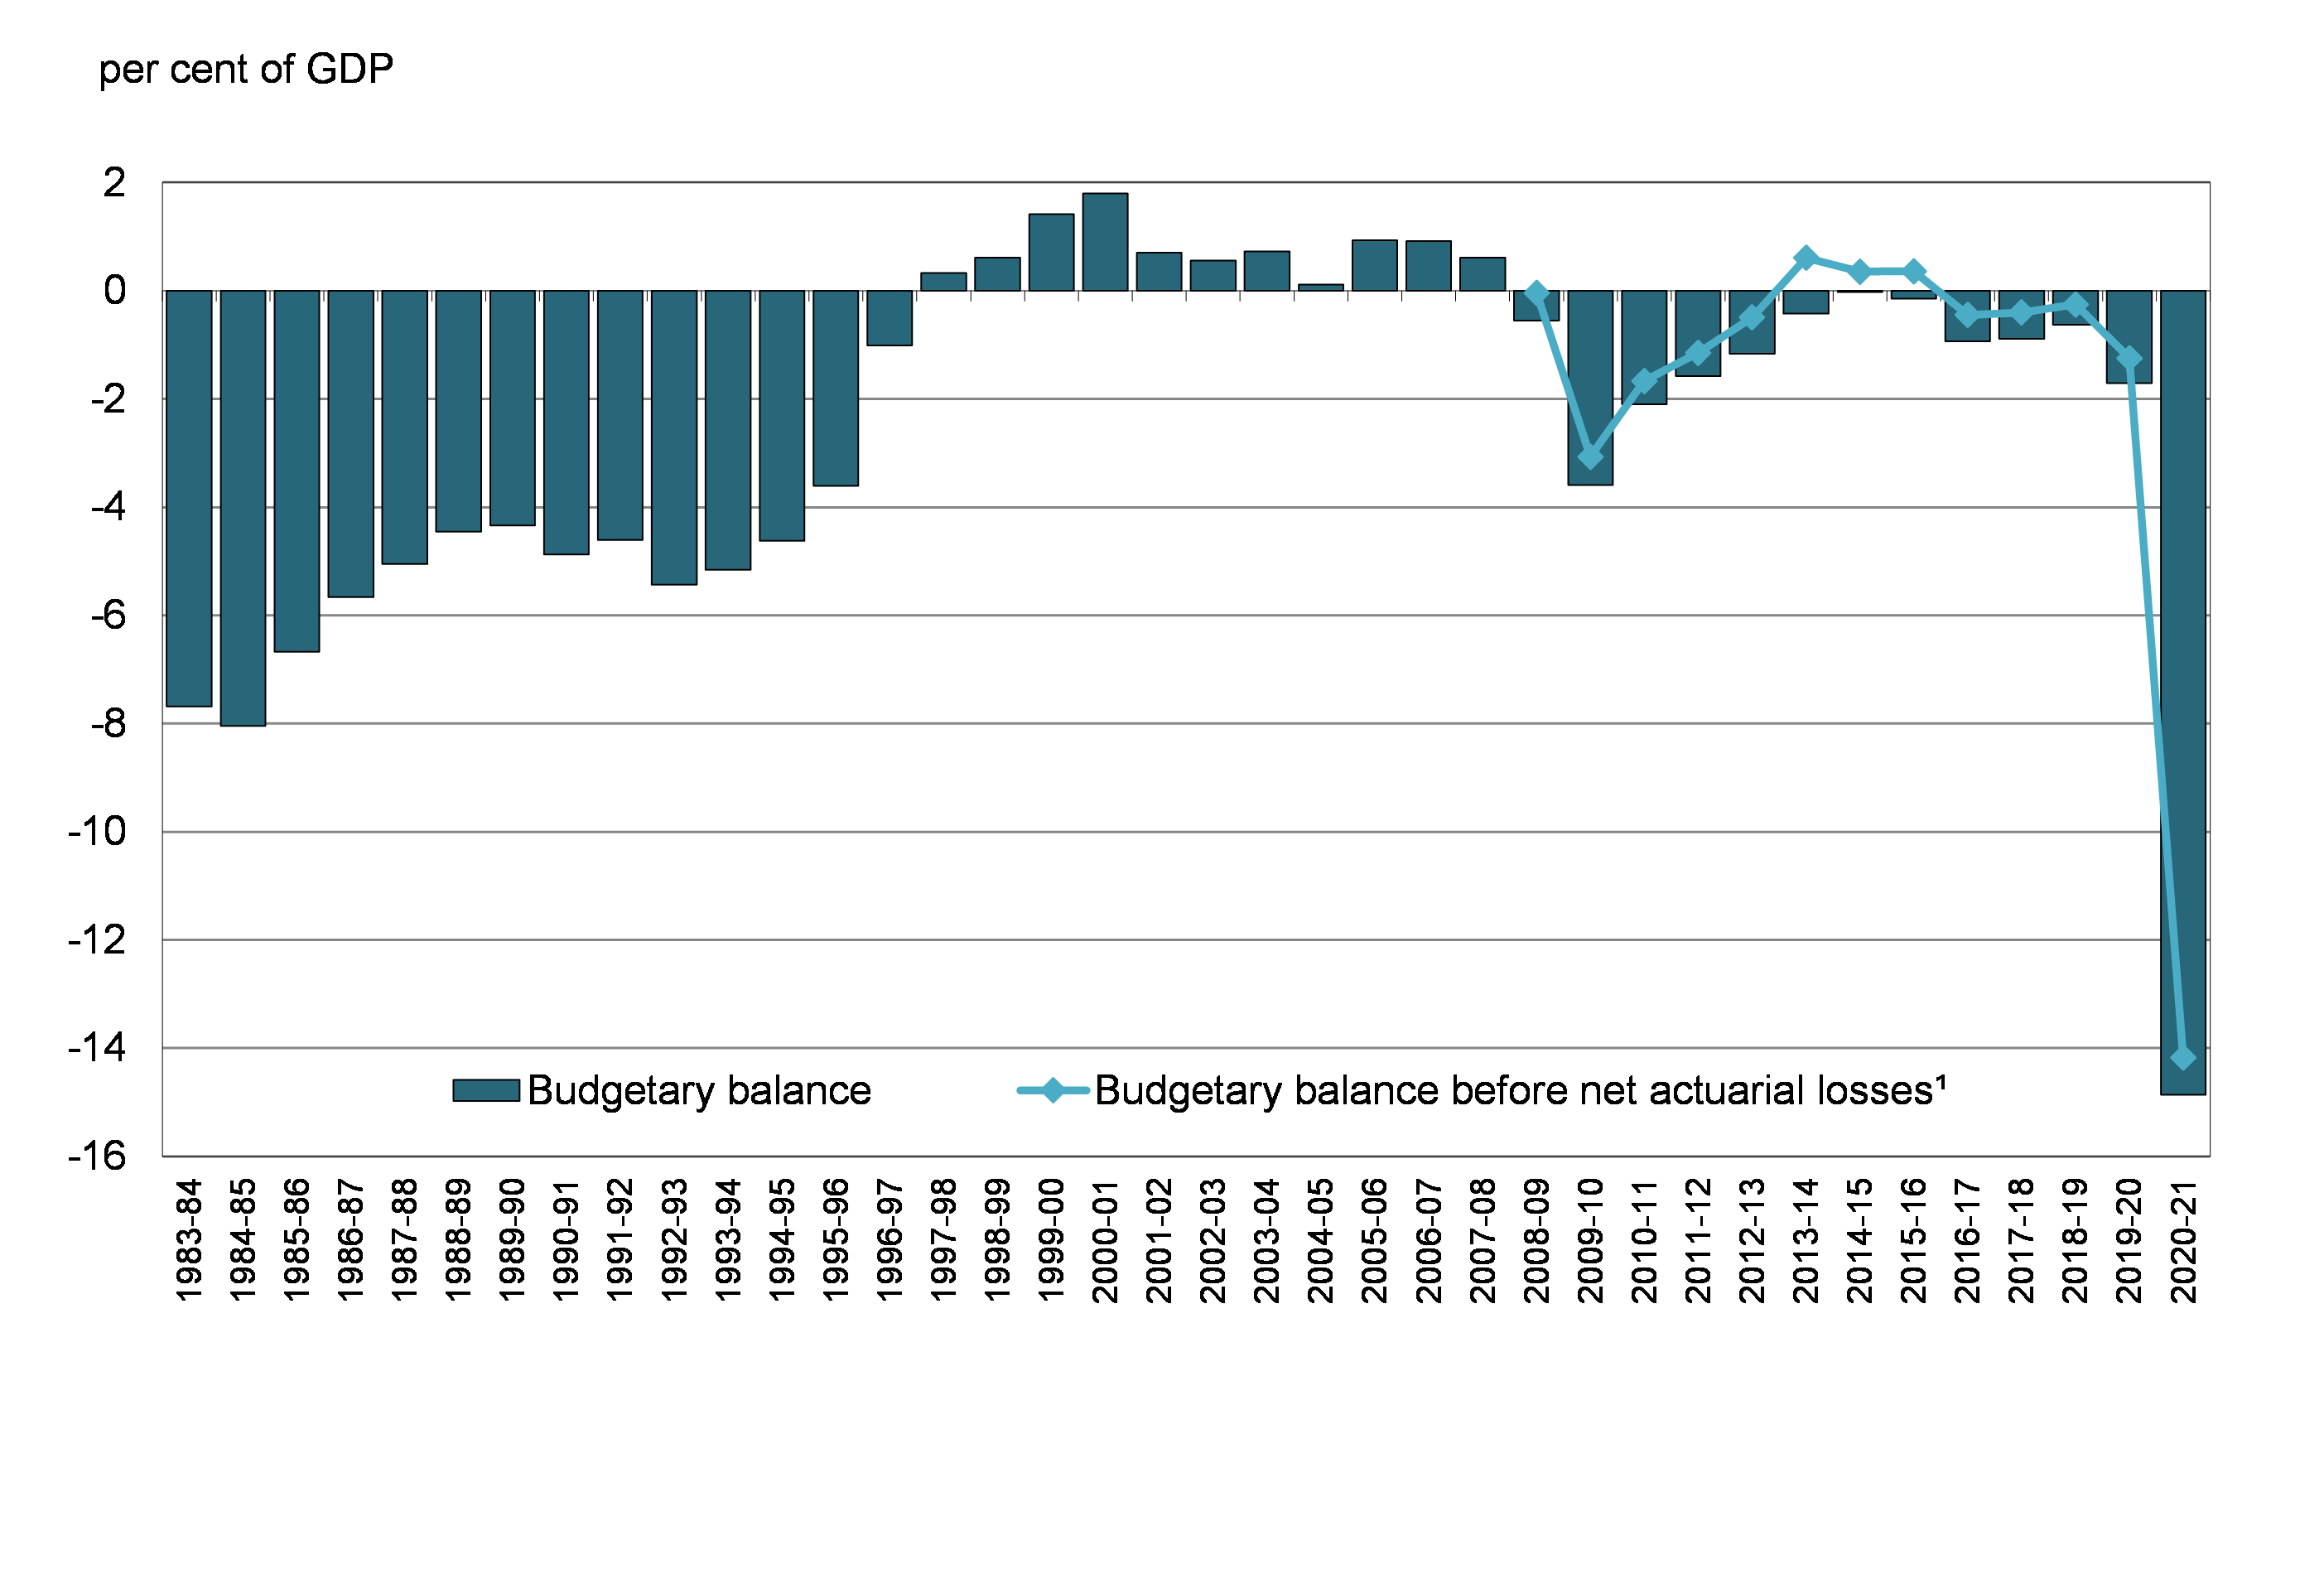
The following graph shows the government's budgetary balance since 1983–84, as well as the budgetary balance before net actuarial losses since 2008–09. To enhance the comparability of results over time and across jurisdictions, the budgetary balance and its components are presented as a percentage of GDP. In 2020–21, the budgetary deficit was 14.9 per cent of GDP, compared to a deficit of 1.7 per cent of GDP in 2019–20. The budgetary deficit before net actuarial losses was 14.2 per cent of GDP, compared to a deficit of 1.2 per cent of GDP a year earlier.
Budgetary Balance
Revenues were down $17.7 billion, or 5.3 per cent, from the prior year, primarily reflecting lower excise taxes and duties, particularly due to COVID-19 shutdowns and the one-time enhanced GST credit payment, as well as lower Crown corporation revenues due to the impact of the COVID-19 pandemic and the Bank of Canada's secondary market purchases of Government of Canada securities.
Total expenses were up $270.7 billion, or 72.5 per cent, from the prior year. Program expenses excluding net actuarial losses increased by $270.1 billion, or 79.8 per cent, primarily reflecting increased transfers to individuals, businesses, and other levels of government under the Economic Response Plan, including the CERB, the CEWS, and transfers under the Safe Restart Agreement. Net actuarial losses increased by $4.7 billion, or 44.2 per cent, from the prior year, due in large part to declines in year-end interest rates used to value the government's unfunded public sector pension and other employee and veteran future benefit obligations and increased costs associated with the utilization of disability and other future benefits provided to veterans in the previous fiscal year. Public debt charges decreased by $4.1 billion, or 16.7 per cent, from the prior year, largely reflecting lower interest on the government's public sector pensions and other employee and veteran future benefits, lower interest on treasury bills, and lower Consumer Price Index adjustments on Real Return Bonds.
Annual deficit before net actuarial losses
The line item "annual deficit before net actuarial losses" was introduced in the 2019–20 Consolidated Statement of Operations and Accumulated Deficit to improve the transparency of the government's financial reporting.
Actuarial losses and gains arise from the annual re-measurement of the government's existing obligations for public sector pensions and other employee and veteran future benefits. The measurement of these obligations involves the extensive use of estimates and assumptions about future events and circumstances, such as discount rates, future inflation, returns on investments, general wage increases, workforce composition, retirement rates and mortality rates. In particular, the unfunded obligations are sensitive to changes in both short- and long-term interest rates, which are used to estimate the value of expected future benefit payments in today's dollars. Unfunded benefit obligations are discounted based on the spot rates of Government of Canada bonds at fiscal year-end (March 31), which can fluctuate significantly from one year to the next, resulting in actuarial gains and losses that flow through the budgetary balance over time.
While these adjustments and revaluations are an important part of providing an accurate picture of the government's Consolidated Statement of Financial Position at any given time, they can also result in large swings in the budgetary balance, which may impair the usefulness and understandability of the government's consolidated financial statements and fiscal projections, including as a measurement of the short-term impact of government spending and taxation choices on the economy.
The annual deficit before net actuarial losses isolates the impact of adjustments and re-measurements of previously recorded public sector pensions and other employee and veteran future benefits and provides a clearer view of the government's planned and actual operating activities in an accounting period, enhancing transparency and accountability.
Comparison of Actual Budgetary Outcomes to Projected Results
The $327.7-billion deficit recorded in 2020–21 was $26.4 billion lower than the $354.2-billion deficit projected in Budget 2021.
Overall, revenues were $20.3 billion higher than forecast due to higher personal and corporate income tax revenues, primarily driven by a faster-than-expected economic recovery. Program expenses, excluding net actuarial losses, were $6.0 billion lower than expected, largely as a result of lower-than-anticipated spending on COVID-related programs, including the CEWS, and lower expenses incurred by year-end for vaccines and personal protective equipment, offset in part by higher-than-expected impacts from claims and litigation. Public debt charges were in line with the projection, while net actuarial losses were $0.1 billion lower than projected.
| Actual ($ billions) |
Budget 20211 ($ billions) |
Difference | ||
|---|---|---|---|---|
| ($ billions) | (per cent) | |||
| Revenues | ||||
Income tax |
||||
Personal |
174.8 | 168.2 | 6.6 | 3.8 |
Corporate |
54.1 | 46.2 | 7.9 | 14.5 |
Non-resident |
8.1 | 8.5 | (0.4) | (4.5) |
Total |
237.0 | 222.9 | 14.1 | 5.9 |
Other taxes and duties |
||||
Goods and Services Tax |
32.4 | 29.8 | 2.6 | 8.1 |
Energy taxes |
4.9 | 4.9 | 0.0 | 0.0 |
Customs import duties |
4.3 | 3.7 | 0.5 | 11.9 |
Other excise taxes and duties |
5.4 | 5.6 | (0.2) | (3.2) |
Total |
47.0 | 44.0 | 2.9 | 6.3 |
Employment Insurance premiums |
22.4 | 22.2 | 0.2 | 1.0 |
Proceeds from the pollution pricing framework |
4.4 | 4.5 | (0.1) | (3.4) |
Other revenues |
5.7 | 2.6 | 3.2 | 55.4 |
Total revenues |
316.4 | 296.2 | 20.3 | 6.4 |
| Program expenses | ||||
Major transfers to persons |
||||
Elderly benefits |
58.5 | 58.8 | (0.3) | (0.5) |
Employment Insurance and support measures |
58.4 | 59.8 | (1.5) | (2.5) |
Children's benefits |
27.4 | 27.6 | (0.2) | (0.8) |
Canada Emergency Response Benefit and Canada Recovery Benefits |
55.8 | 57.3 | (1.5) | (2.7) |
Total |
200.1 | 203.5 | (3.5) | (1.7) |
Major transfers to other levels of government |
||||
Support for health and other social programs |
60.9 | 60.9 | 0.0 | 0.0 |
Fiscal arrangements |
19.3 | 19.3 | (0.0) | (0.1) |
Canada Community-Building Fund |
4.3 | 4.3 | 0.0 | 0.0 |
Home care and mental health |
1.2 | 1.3 | 0.0 | 0.0 |
Other |
20.9 | 20.9 | (0.1) | (0.3) |
Total |
106.7 | 106.7 | (0.1) | (0.1) |
| Canada Emergency Wage Subsidy | 80.2 | 84.6 | (4.4) | (5.5) |
| Proceeds from the pollution pricing framework returned | 4.6 | 4.8 | (0.2) | (4.8) |
| Direct program expenses | 217.1 | 214.9 | 2.2 | 1.0 |
| Total program expenses, excluding net actuarial losses | 608.5 | 614.5 | (6.0) | (1.0) |
| Public debt charges | 20.4 | 20.4 | (0.0) | (0.0) |
| Budgetary outcome/estimate before net actuarial losses | (312.4) | (338.8) | 26.3 | |
Net actuarial losses |
15.3 | 15.4 | (0.1) | (0.7) |
| Budgetary outcome/estimate | (327.7) | (354.2) | 26.4 | |
| Note: Numbers may not add due to rounding. 1 Certain Budget 2021 amounts have been reclassified to conform to the current year's presentation in the consolidated financial statements, with no overall impact on the projected 2020-21 annual deficit. |
||||
Revenues
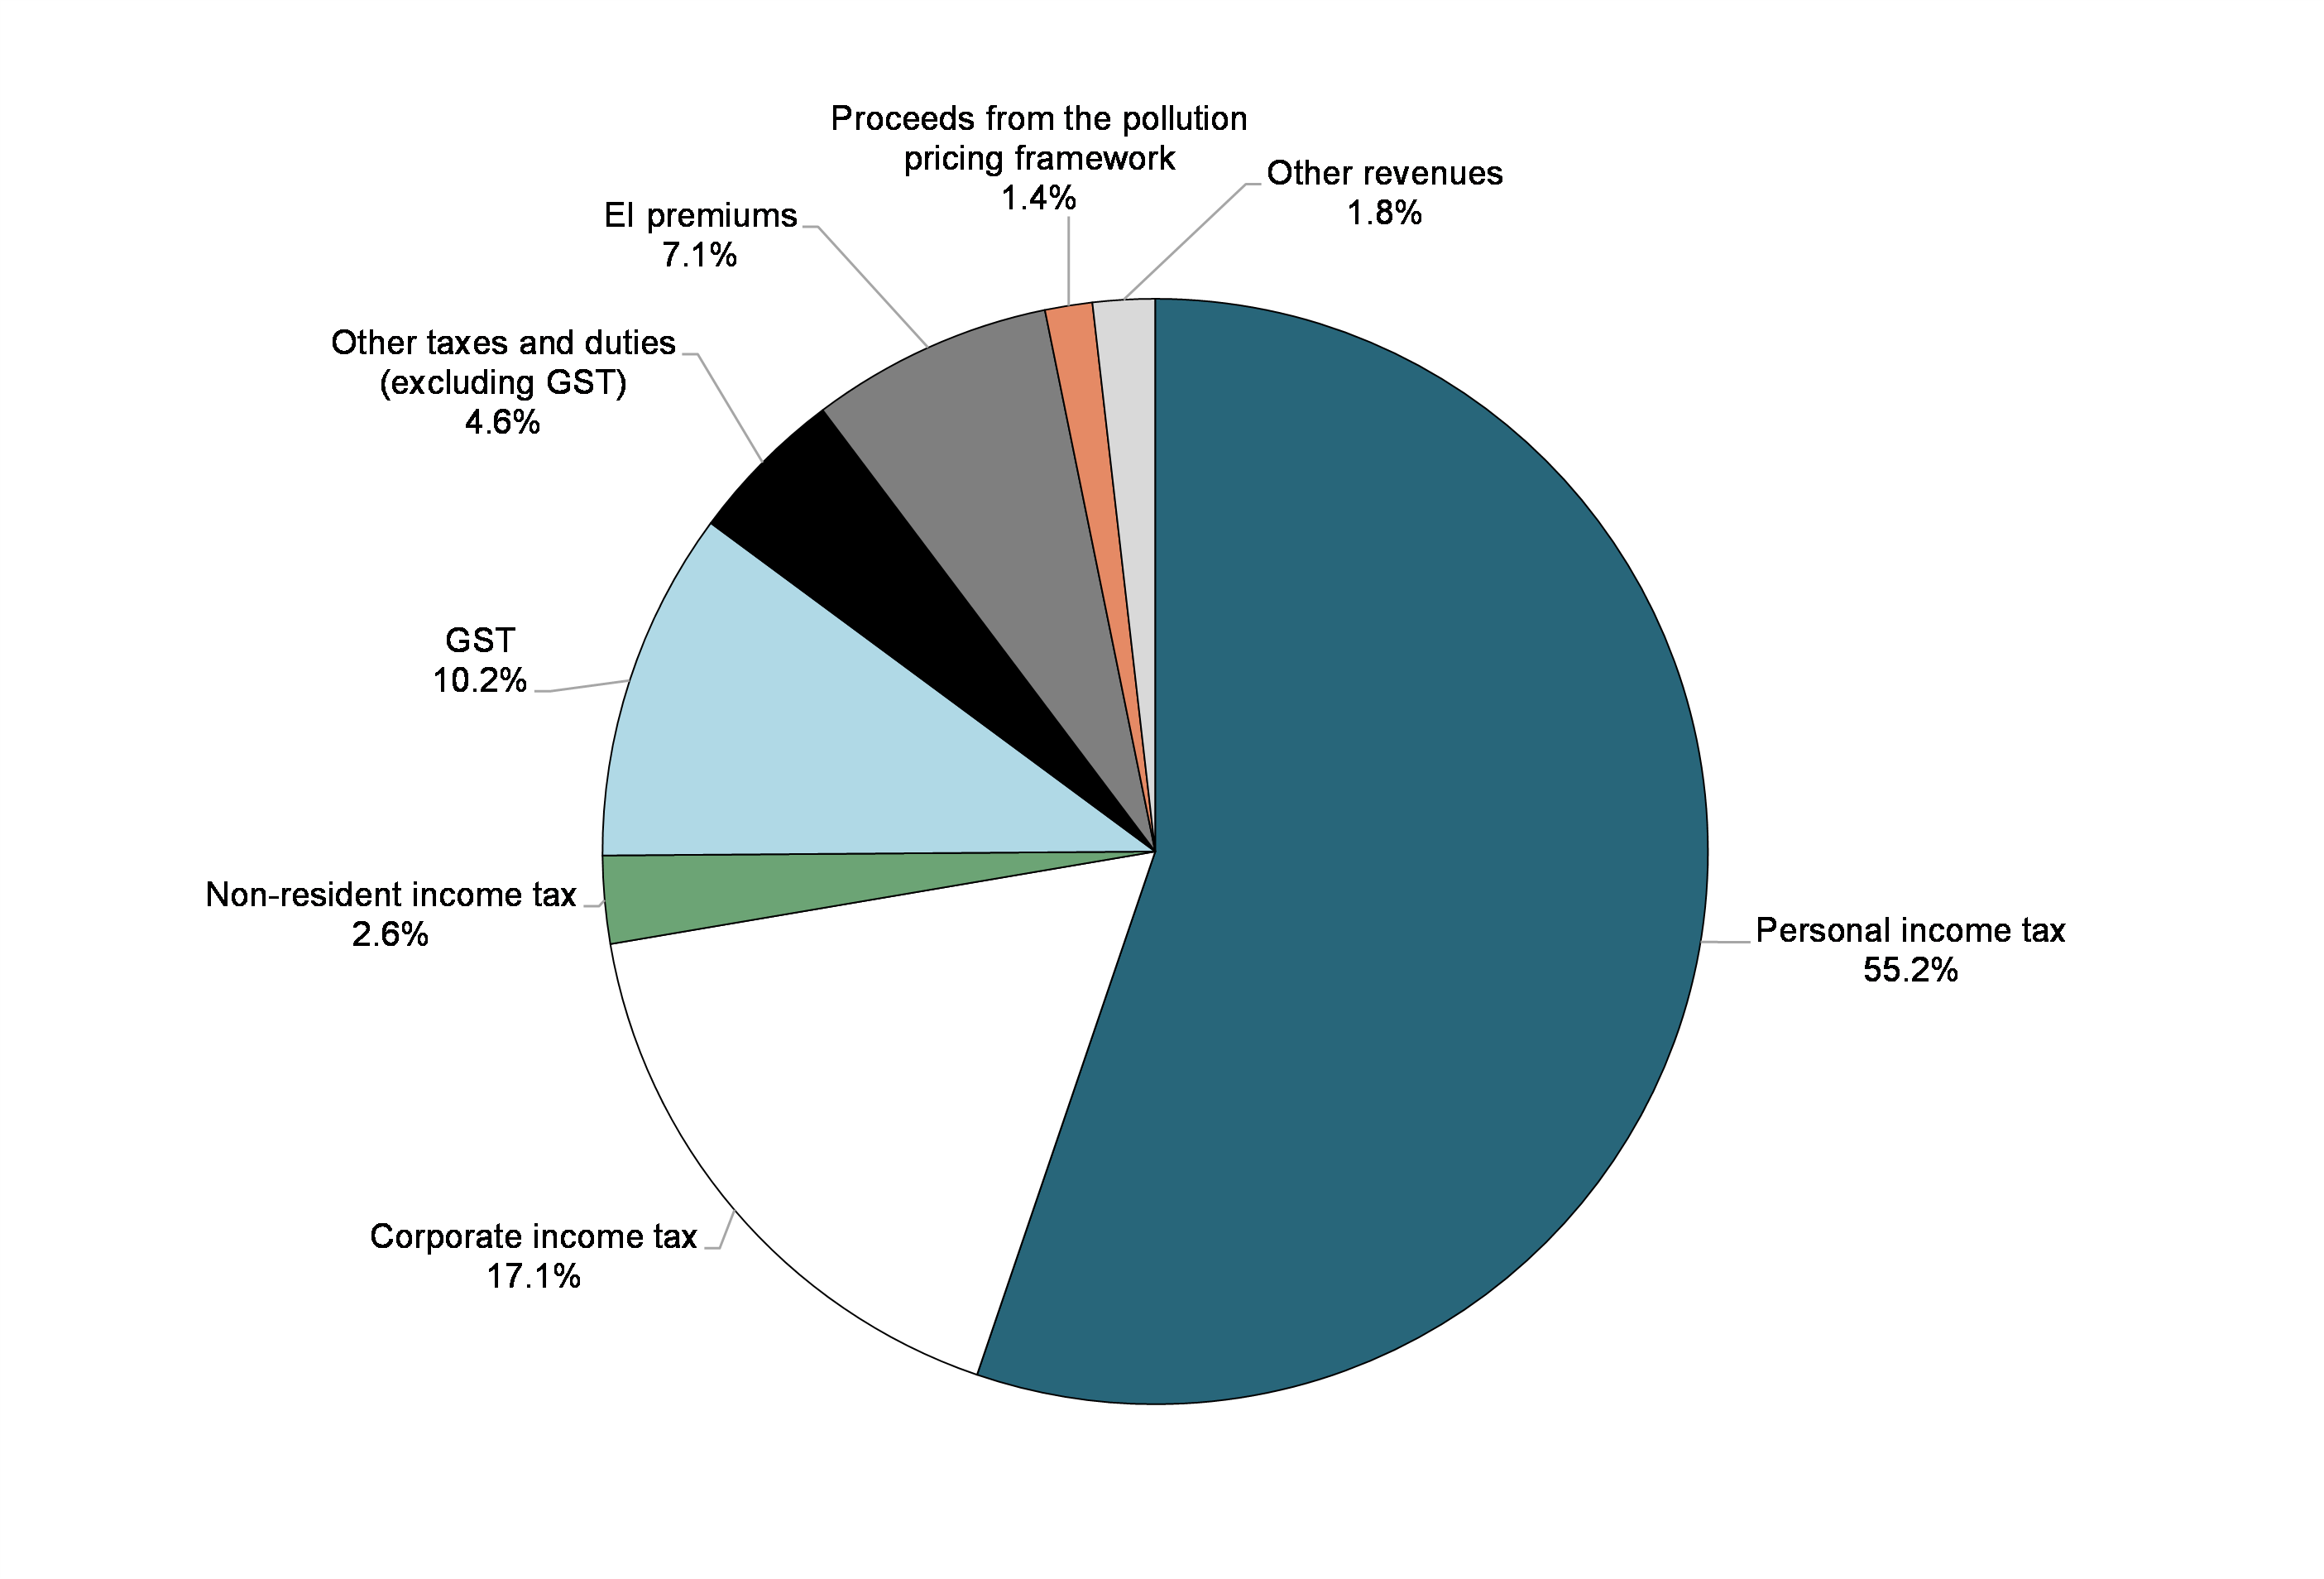
Federal revenues can be broken down into five main categories: income tax revenues, other taxes and duties, Employment Insurance (EI) premium revenues, proceeds from the pollution pricing framework and other revenues.
Within the income tax category, personal income tax revenues are the largest source of federal revenues, and accounted for 55.2 per cent of total revenues in 2020–21 (up from 50.2 per cent in 2019–20). Corporate income tax revenues are the second largest source of revenues, and accounted for 17.1 per cent of total revenues in 2020–21 (up from 15.0 per cent in 2019–20). Non-resident income tax revenues are a comparatively smaller source of revenues, accounting for only 2.6 per cent of total revenues in 2020–21 (down from 2.8 per cent in 2019–20).
Other taxes and duties consist of revenues from the GST, energy taxes, customs import duties and other excise taxes and duties. The largest component of this category—GST revenues—accounted for 10.2 per cent of all federal revenues in 2020–21 (down from 11.2 per cent in 2019–20). The share of the remaining components of other taxes and duties stood at 4.6 per cent of total federal revenues (down from 4.9 per cent in 2019–20).
EI premium revenues accounted for 7.1 per cent of total federal revenues in 2020–21 (up from 6.6 per cent in 2019–20).
Proceeds from the pollution pricing framework accounted for 1.4 per cent of total federal revenues in 2020–21 (up from 0.8 per cent in 2019–20).
Other revenues are made up of three broad components: net income from enterprise Crown corporations and other government business enterprises; other program revenues from returns on investments, proceeds from the sales of goods and services, and other miscellaneous revenues; and foreign exchange revenues. Other revenues accounted for 1.8 per cent of total federal revenues in 2020–21 (down from 8.5 per cent in 2019–20).
Composition of Revenues for 2020–21 (Total: $316.4 billion)
Revenues Compared to 2019–20
Total revenues amounted to $316.4 billion in 2020–21, down $17.7 billion, or 5.3 per cent, from 2019–20. The following table compares revenues for 2020–21 to 2019–20.
| 2020–21 ($ millions) |
2019–20 ($ millions) |
Net change | ||
|---|---|---|---|---|
| ($ millions) | (per cent) | |||
| Tax revenues | ||||
Income tax |
||||
Personal |
174,755 | 167,576 | 7,179 | 4.3 |
Corporate |
54,112 | 50,060 | 4,052 | 8.1 |
Non-resident |
8,107 | 9,476 | (1,369) | (14.4) |
Total |
236,974 | 227,112 | 9,862 | 4.3 |
Other taxes and duties |
||||
Goods and Services Tax |
32,415 | 37,386 | (4,971) | (13.3) |
Energy taxes |
4,894 | 5,683 | (789) | (13.9) |
Customs import duties |
4,254 | 4,853 | (599) | (12.3) |
Other excise taxes and duties |
5,391 | 5,958 | (567) | (9.5) |
Total |
46,954 | 53,880 | (6,926) | (12.9) |
| Total tax revenues | 283,928 | 280,992 | 2,936 | 1.0 |
| Employment Insurance premiums | 22,392 | 22,219 | 173 | 0.8 |
| Proceeds from the pollution pricing framework | 4,380 | 2,655 | 1,725 | 65.0 |
| Other revenues | 5,746 | 28,265 | (22,519) | (79.7) |
| Total revenues | 316,446 | 334,131 | (17,685) | (5.3) |
- Personal income tax revenues increased by $7.2 billion in 2020–21, or 4.3 per cent, reflecting household income growth buoyed in particular by income support measures put in place by the government during the pandemic.
- Corporate income tax revenues increased by $4.1 billion, or 8.1 per cent, reflecting strength in corporate profits following the initial negative shock of the pandemic, and the impact of emergency support measures for Canadian businesses.
- Non-resident income tax revenues are paid by non-residents on Canadian-sourced income. These revenues decreased by $1.4 billion, or 14.4 per cent.
- Other taxes and duties decreased by $6.9 billion, or 12.9 per cent. GST revenues declined by $5.0 billion in
2020–21, or 13.3 per cent, reflecting the temporary shutdown of large portions of the retail sector and the introduction of the one-time enhanced GST credit payment in May 2020. Energy taxes fell by $0.8 billion, or 13.9 per cent, mainly due to lower motive fuel consumption during the COVID-19 pandemic. Customs import duties decreased by $0.6 billion, or 12.3 per cent, largely due to lower imports and the government's waiver of customs duties on medical goods in order to better combat the spread of COVID-19. Other excise taxes and duties were down $0.6 billion, or 9.5 per cent, driven primarily by a significant drop in revenues from the Air Travellers Security Charge. - EI premium revenues increased by $0.2 billion, or 0.8 per cent.
- Proceeds from the pollution pricing framework increased by $1.7 billion, or 65.0 per cent, reflecting the addition of Alberta to the fuel charge system and a higher carbon pollution price in 2020–21.
- Other revenues decreased by $22.5 billion, or 79.7 per cent, largely reflecting a decrease in enterprise Crown corporation profits due to COVID-19, and the impact of Bank of Canada purchases of Government of Canada securities on the secondary market to support liquidity in financial markets.
Pricing Carbon Pollution and Delivering Climate Action Incentive Payments
As part of the federal carbon pollution pricing system, fuel and excess emission charges are collected pursuant to the Greenhouse Gas Pollution Pricing Act and are applicable to jurisdictions that voluntarily adopt the federal carbon pollution pricing system and those that do not meet the federal benchmark requirements. The regulatory charge on fossil fuels ("fuel charge") applied as of April 1, 2019, in Ontario, New Brunswick, Manitoba and Saskatchewan, on July 1, 2019, in Nunavut and in the Yukon, and on January 1, 2020, in Alberta. The fuel charge was subsequently stood down in New Brunswick, as of April 1, 2020, as the province introduced a tax on carbon emitting products that meets the federal benchmark requirements for the sources it covers. As of March 31, 2021, there were $4,219 million of fuel charge proceeds recorded ($2,655 million in 2019–20).
As part of the federal carbon pollution pricing system, the government returns all direct proceeds from the fuel charge to the jurisdiction of origin in the following manner:
- For jurisdictions that voluntarily adopt the federal carbon pollution pricing system, directly to the governments of those jurisdictions. As of March 31, 2021, $19 million ($6 million in 2019–20) was paid or payable;
- For other jurisdictions that do not meet the federal benchmark requirements:
- Directly to individuals and families through Climate Action Incentive (CAI) payments. These payments are provided for under the Income Tax Act and are delivered through the personal income tax system. In 2020–21, $4,547 million ($2,630 million in 2019–20) of CAI payments were made or were payable by the government;
- 2019–20 proceeds were used for federal programming to support schools, hospitals, small and medium-sized enterprises, colleges and universities, municipalities, non-profit organizations, and Indigenous communities. As of March 31, 2021, $98 million ($7 million in 2019–20) was returned.
Accounting for the Bank of Canada's Purchases of Government of Canada Bonds
In response to COVID-19, the Bank of Canada introduced several new facilities and operations to support liquidity and the proper functioning of core funding markets, and to provide monetary stimulus. One of these facilities, the Government of Canada Bond Purchase Program, involves the purchase of Government of Canada nominal and real return bonds in the secondary market.
The Bank of Canada, as an enterprise Crown corporation, is part of the government reporting entity and is included as part of the government's consolidated financial statements. As a result, the purchase of Government of Canada bonds by the Bank on financial markets is accounted for similar to the government's own repurchase and retirement of its debt. That is, a gain or loss, equal to the difference between the carrying value of the debt in the accounts of the government and the price paid by the Bank to acquire the bond is recognized in the government's consolidated financial statements at the date of the Bank's purchase. For 2020–21, the government recorded net losses totalling $19 billion in respect of the Bank's purchases of Government of Canada bonds. This net loss is recorded as part of other revenues on the Condensed Consolidated Statement of Operations and Accumulated Deficit.
This accounting treatment is referred to as a constructive debt retirement. The debt retirement is "constructive" because the debt remains outstanding from the viewpoint of the government and remains an investment from the point of view of the Bank. Similarly, the related interest on the bonds paid by the government to the Bank is reflected as part of public debt charges (expense) and as part the annual profits of the Bank (revenue) included in other revenues.
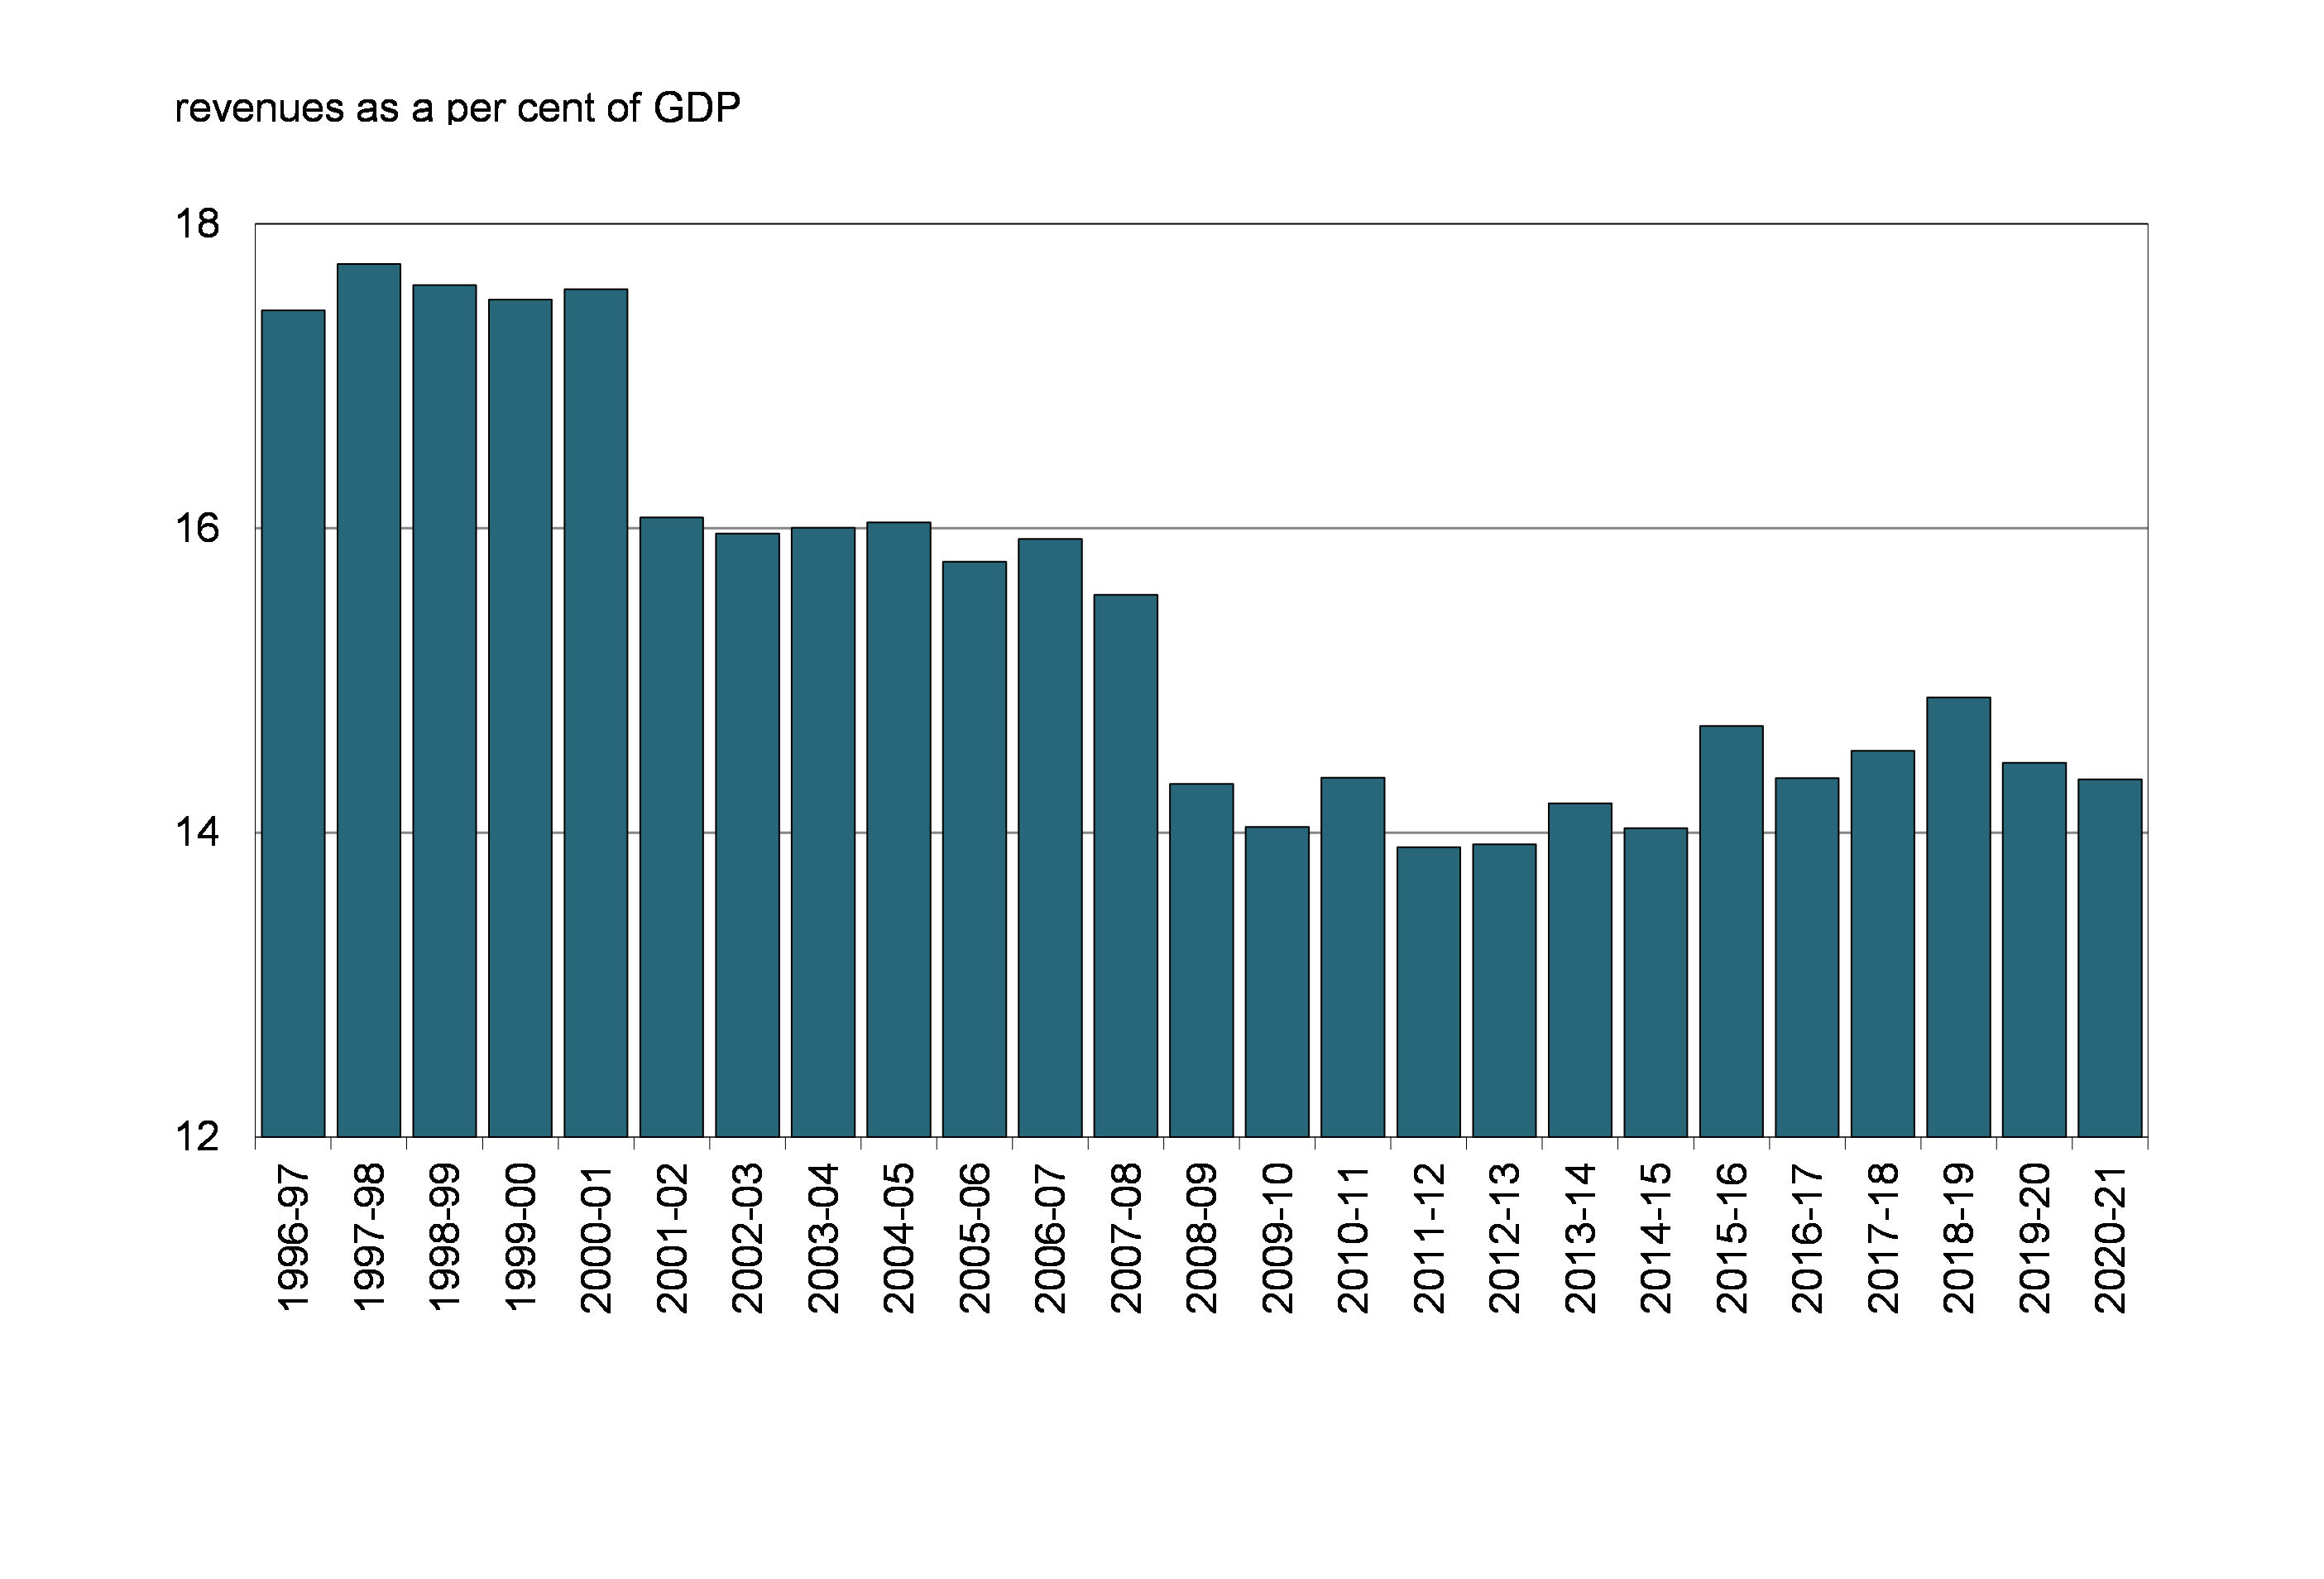
The revenue ratio—revenues as a percentage of GDP—compares the total of all federal revenues to the size of the economy. This ratio is influenced by changes in statutory tax rates and by economic developments. The ratio stood at 14.4 per cent in 2020–21 (down slightly from 14.5 per cent in 2019–20).
Revenue Ratio
Expenses
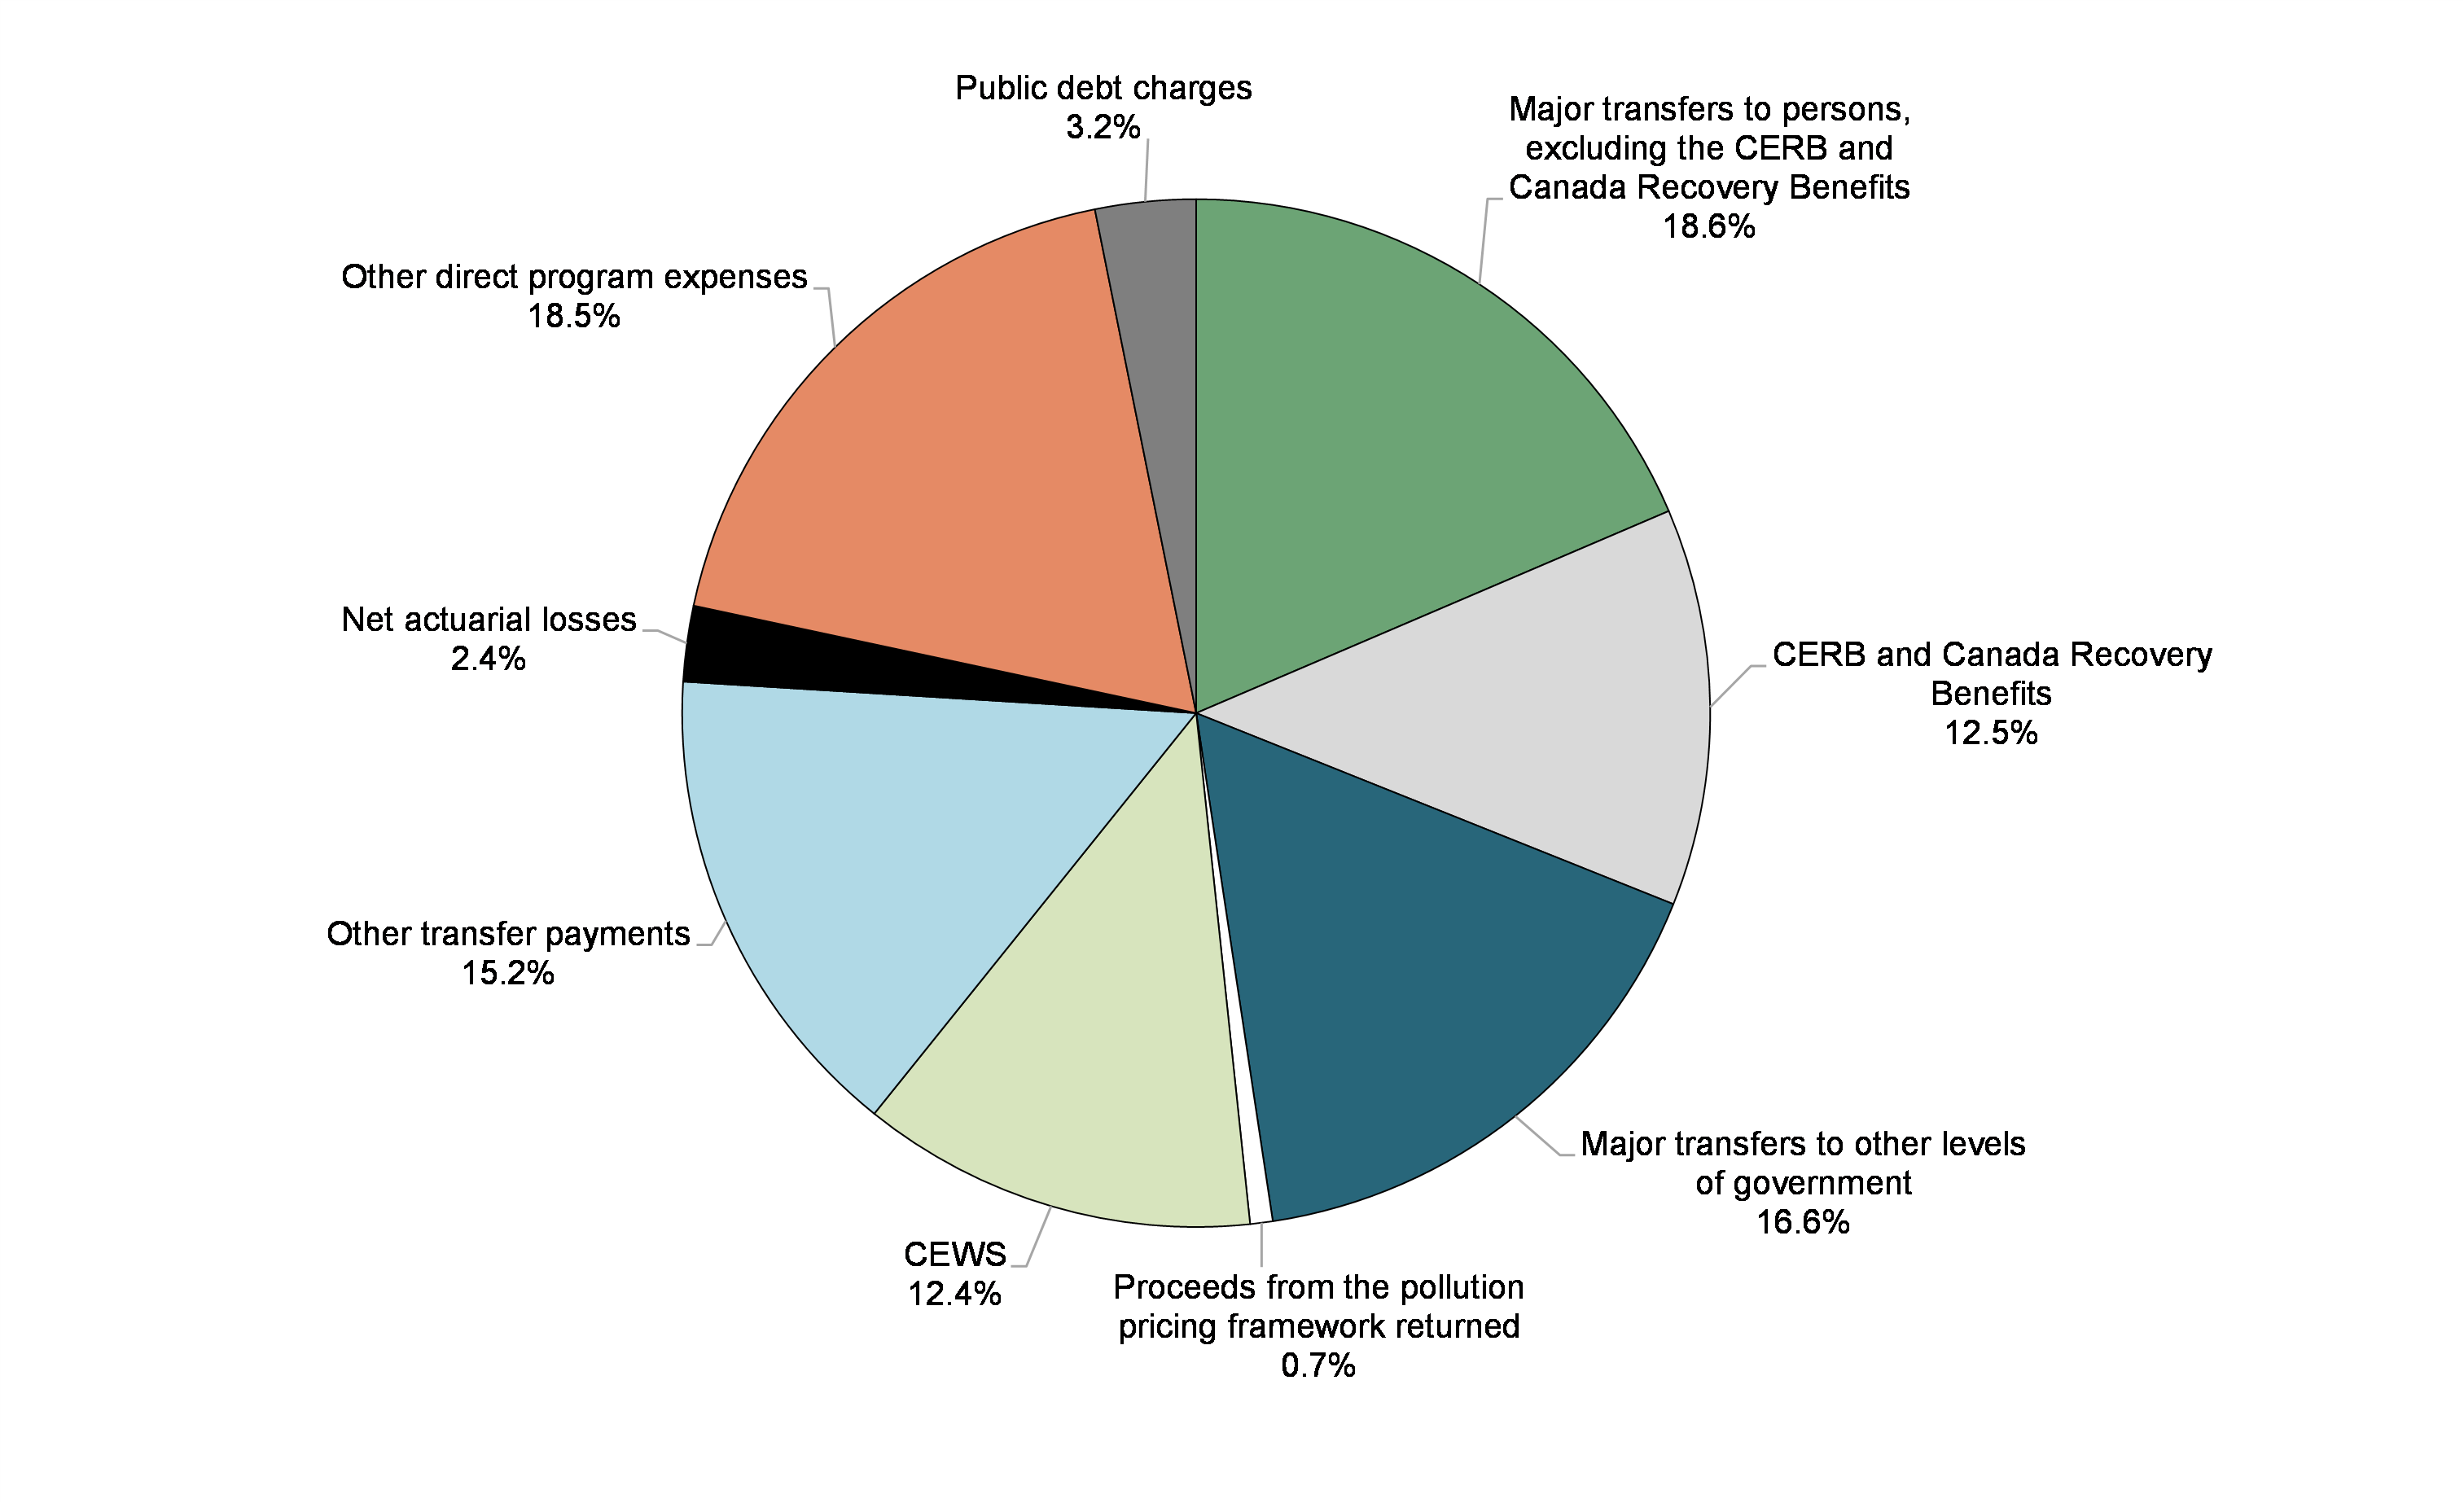
Federal expenses can be broken down into four main categories: transfer payments, which account for the majority of all federal spending, other direct program expenses, public debt charges, and net actuarial losses.
Transfer payments are classified under five categories:
- Major transfers to persons, which made up 31.1 per cent of total expenses (up from 28.7 per cent in 2019–20). This category consists of elderly, EI and support measures, and children's benefits, as well as the CERB and the suite of Canada Recovery Benefits (the Canada Recovery Benefit, the Canada Recovery Sickness Benefit, and the Canada Recovery Caregiving Benefit) introduced under Canada's COVID-19 Economic Response Plan. Taking into account CERB benefits processed through the EI Operating Account, the CERB and Canada Recovery Benefits comprised 12.5 per cent of total expenses, while the other components of major transfers to persons accounted for 18.6 per cent of total expenses.
- Major transfers to other levels of government—which include the Canada Health Transfer, the Canada Social Transfer, the home care and mental health transfers, fiscal arrangements (Equalization, transfers to the territories, a number of smaller transfer programs and the Quebec Abatement), Canada Community-Building Fund (previously Gas Tax Fund) transfers, and a number of one-time transfers to provinces and territories through the Economic Response Plan—made up 16.6 per cent of total expenses in 2020–21 (down from 21.2 per cent in 2019–20).
- The CEWS, which provides payments to eligible employers as part of the Economic Response Plan, made up 12.4 per cent of total expenses in 2020–21. This category also includes the 10 per cent Temporary Wage Subsidy for Employers.
- Proceeds from the pollution pricing framework returned, consisting of payments under the federal carbon pollution pricing system, made up 0.7 per cent of expenses (unchanged from 2019–20).
- Other transfer payments, which include transfers to Indigenous peoples, assistance to farmers, students and businesses, support for research and development, and international assistance, made up 15.2 per cent of expenses (up from 14.6 per cent in 2019–20).
Other direct program expenses, which represent the operating expenses of the government's 131 departments, agencies, and consolidated Crown corporations and other entities, accounted for 18.5 per cent of total expenses in 2020–21. This was down from 25.5 per cent in 2019–20, reflecting the significant increase in transfer payments as a share of spending in the current year as part of Canada's COVID-19 Economic Response Plan.
Public debt charges made up 3.2 per cent of total expenses in 2020–21 (down from 6.5 per cent in 2019–20).
Net actuarial losses made up the remaining 2.4 per cent of total expenses in 2020–21, down from 2.8 per cent in 2019–20.
Composition of Expenses for 2020–21 (Total: $644.2 billion)
Expenses Compared to 2019–20
Total expenses amounted to $644.2 billion in 2020–21, up $270.7 billion, or 72.5 per cent, from 2019–20. The following table compares total expenses for 2020–21 to 2019–20.
| 2020–21 ($ millions) |
2019–20 ($ millions) |
Net change | ||
|---|---|---|---|---|
| ($ millions) | (per cent) | |||
| Major transfers to persons | ||||
Elderly benefits |
58,529 | 56,227 | 2,302 | 4.1 |
Employment Insurance and support measures |
58,356 | 21,750 | 36,606 | 168.3 |
Children's benefits |
27,370 | 24,344 | 3,026 | 12.4 |
Canada Emergency Response Benefit and Canada Recovery Benefits |
55,832 | 4,739 | 51,093 | 1,078.1 |
Total |
200,087 | 107,060 | 93,027 | 86.9 |
| Major transfers to other levels of government | ||||
Federal transfer support for health and other social programs |
60,903 | 55,457 | 5,446 | 9.8 |
Fiscal arrangements and other transfers |
45,750 | 23,718 | 22,032 | 92.9 |
Total |
106,653 | 79,175 | 27,478 | 34.7 |
| Direct program expenses | ||||
Canada Emergency Wage Subsidy |
80,166 | - | 80,166 | n/a |
Proceeds from the pollution pricing framework returned |
4,566 | 2,636 | 1,930 | 73.2 |
Other transfer payments |
97,961 | 54,405 | 43,556 | 80.1 |
Other direct program expenses |
119,089 | 95,191 | 23,898 | 25.1 |
Total direct program expenses |
301,782 | 152,232 | 149,550 | 98.2 |
| Total program expenses, excluding net actuarial losses | 608,522 | 338,467 | 270,055 | 79.8 |
Public debt charges |
20,358 | 24,447 | (4,089) | (16.7) |
| Total expenses, excluding net actuarial losses | 628,880 | 362,914 | 265,966 | 73.3 |
Net actuarial losses |
15,295 | 10,609 | 4,686 | 44.2 |
| Total expenses | 644,175 | 373,523 | 270,652 | 72.5 |
- Major transfers to persons increased by $93.0 billion in 2020–21, reflecting increases across all major categories, including the CERB and Canada Recovery Benefits. Elderly benefits increased by $2.3 billion, or 4.1 per cent, reflecting growth in the number of recipients and changes in consumer prices, to which benefits are fully indexed. EI benefits and support measures increased by $36.6 billion, or 168.3 per cent, reflecting higher unemployment resulting from the crisis. EI benefits and support measures also included $24.6 billion in EI ERB (CERB benefits processed through the EI Operating Account) in 2020–21, for which the EI Operating Account was reimbursed through funding from the government. Children's benefits increased by $3.0 billion, or 12.4 per cent, primarily reflecting the May 2020 Canada Child Benefit top-up payment and the 2021 temporary support for children under six. CERB payments processed outside of the EI Operating Account and Canada Recovery Benefits totalled $55.8 billion, of which $39.0 billion related to the CERB (bringing total transfers under the CERB and EI ERB to $63.7 billion).
- Major transfers to other levels of government increased by $27.5 billion in 2020–21, primarily reflecting a number of COVID-19 support measures to provinces and territories, including $13.0 billion under the Safe Restart Agreement, a $4.0-billion top-up to the Canada Health Transfer to help health care systems recover, $2.9 billion through the COVID-19 Essential Workers Support Fund, a $2.2-billion top-up to the Canada Community-Building Fund (previously the Gas Tax Fund), $2.0 billion through the Safe Return to Class Fund, $1.5 billion in funding to clean up orphan and inactive oil and gas wells, $1.0 billion to assist provinces and territories with immunization campaigns, and $0.3 billion in assistance to support workers in the offshore energy sector. The year-over-year increase also reflects $2.9 billion in legislated growth in the current year under the Canada Health Transfer, the Canada Social Transfer, Equalization transfers and transfers to the territories. These increases were offset in part by a $2.4-billion expense recorded in 2019–20 under the Hibernia Dividend Backed Annuity Agreement between Canada and Newfoundland and Labrador, which did not recur in 2020–21, and $0.5 billion in transfers to provinces and territories in the prior year for public health preparedness, critical health care system needs and to support mitigation efforts associated with COVID-19.
- Direct program expenses increased by $149.6 billion in 2020–21, or 98.2 per cent:
- The Canada Emergency Wage Subsidy, including transfers through the CEWS and the 10 per cent Temporary Wage Subsidy for Employers, totalled $80.2 billion in 2020–21.
- Other transfer payments increased by $43.6 billion, or 80.1 per cent, in 2020–21, in large part reflecting COVID-19 response measures, including the repayment incentive under the CEBA program, the Canada Emergency Rent Subsidy and Canada Emergency Commercial Rent Assistance, the Canada Emergency Student Benefit, the one-time payment for seniors eligible for Old Age Security benefits or the Guaranteed Income Supplement, increased funding through Workforce Development Agreements with provinces and territories, the doubling of Canada Student Grant amounts, and the one-time payment to persons with disabilities. Increases in transfer payments also reflect increased transfers to Indigenous peoples, and compensation for supply-managed dairy producers as a result of market access commitments made under recent international trade agreements.
- Proceeds from the pollution pricing framework returned increased by $1.9 billion, or 73.2 per cent, reflecting a higher carbon pollution price in 2020–21 and the inclusion of Alberta in the federal backstop (and the return of proceeds collected within that province). As well, the increase is affected by the accounting treatment of Climate Action Incentive payments, which requires some of the costs to be borne in the fiscal year prior to the fuel charge being collected because they are delivered through the personal income tax system through returns for the previous tax year. A portion of personal income tax returns are filed and assessed before the end of the fiscal year. As a result, fuel charge proceeds returned in 2020–21 reflect a portion of the Climate Action Incentive payments that were made in respect of fuel charge proceeds generated in 2020–21 and returned through 2019 tax returns, and a portion of the payments made in respect of proceeds to be generated in 2021–22 and returned through 2020 tax returns.
- Other direct program expenses of departments, agencies, and consolidated Crown corporations and other entities increased by $23.9 billion, or 25.1 per cent, in large part due to increases in provisions for contingent liabilities, personnel costs, and purchases of medical and personal protective equipment and vaccines in response to the COVID-19 crisis.
- Public debt charges decreased by $4.1 billion, or 16.7 per cent, reflecting lower interest on the government's pensions and other future benefits, lower interest on treasury bills, and lower Consumer Price Index adjustments on Real Return Bonds.
- Net actuarial losses, which reflect changes in the value of the government's obligations and assets for public sector pensions and other employee and veteran future benefits recorded in previous fiscal years, increased $4.7 billion, or 44.2 per cent, due in large part to declines in year-end interest rates used in valuing unfunded benefit obligations and increased costs associated with the utilization of disability and other future benefits provided to veterans in the previous fiscal year.
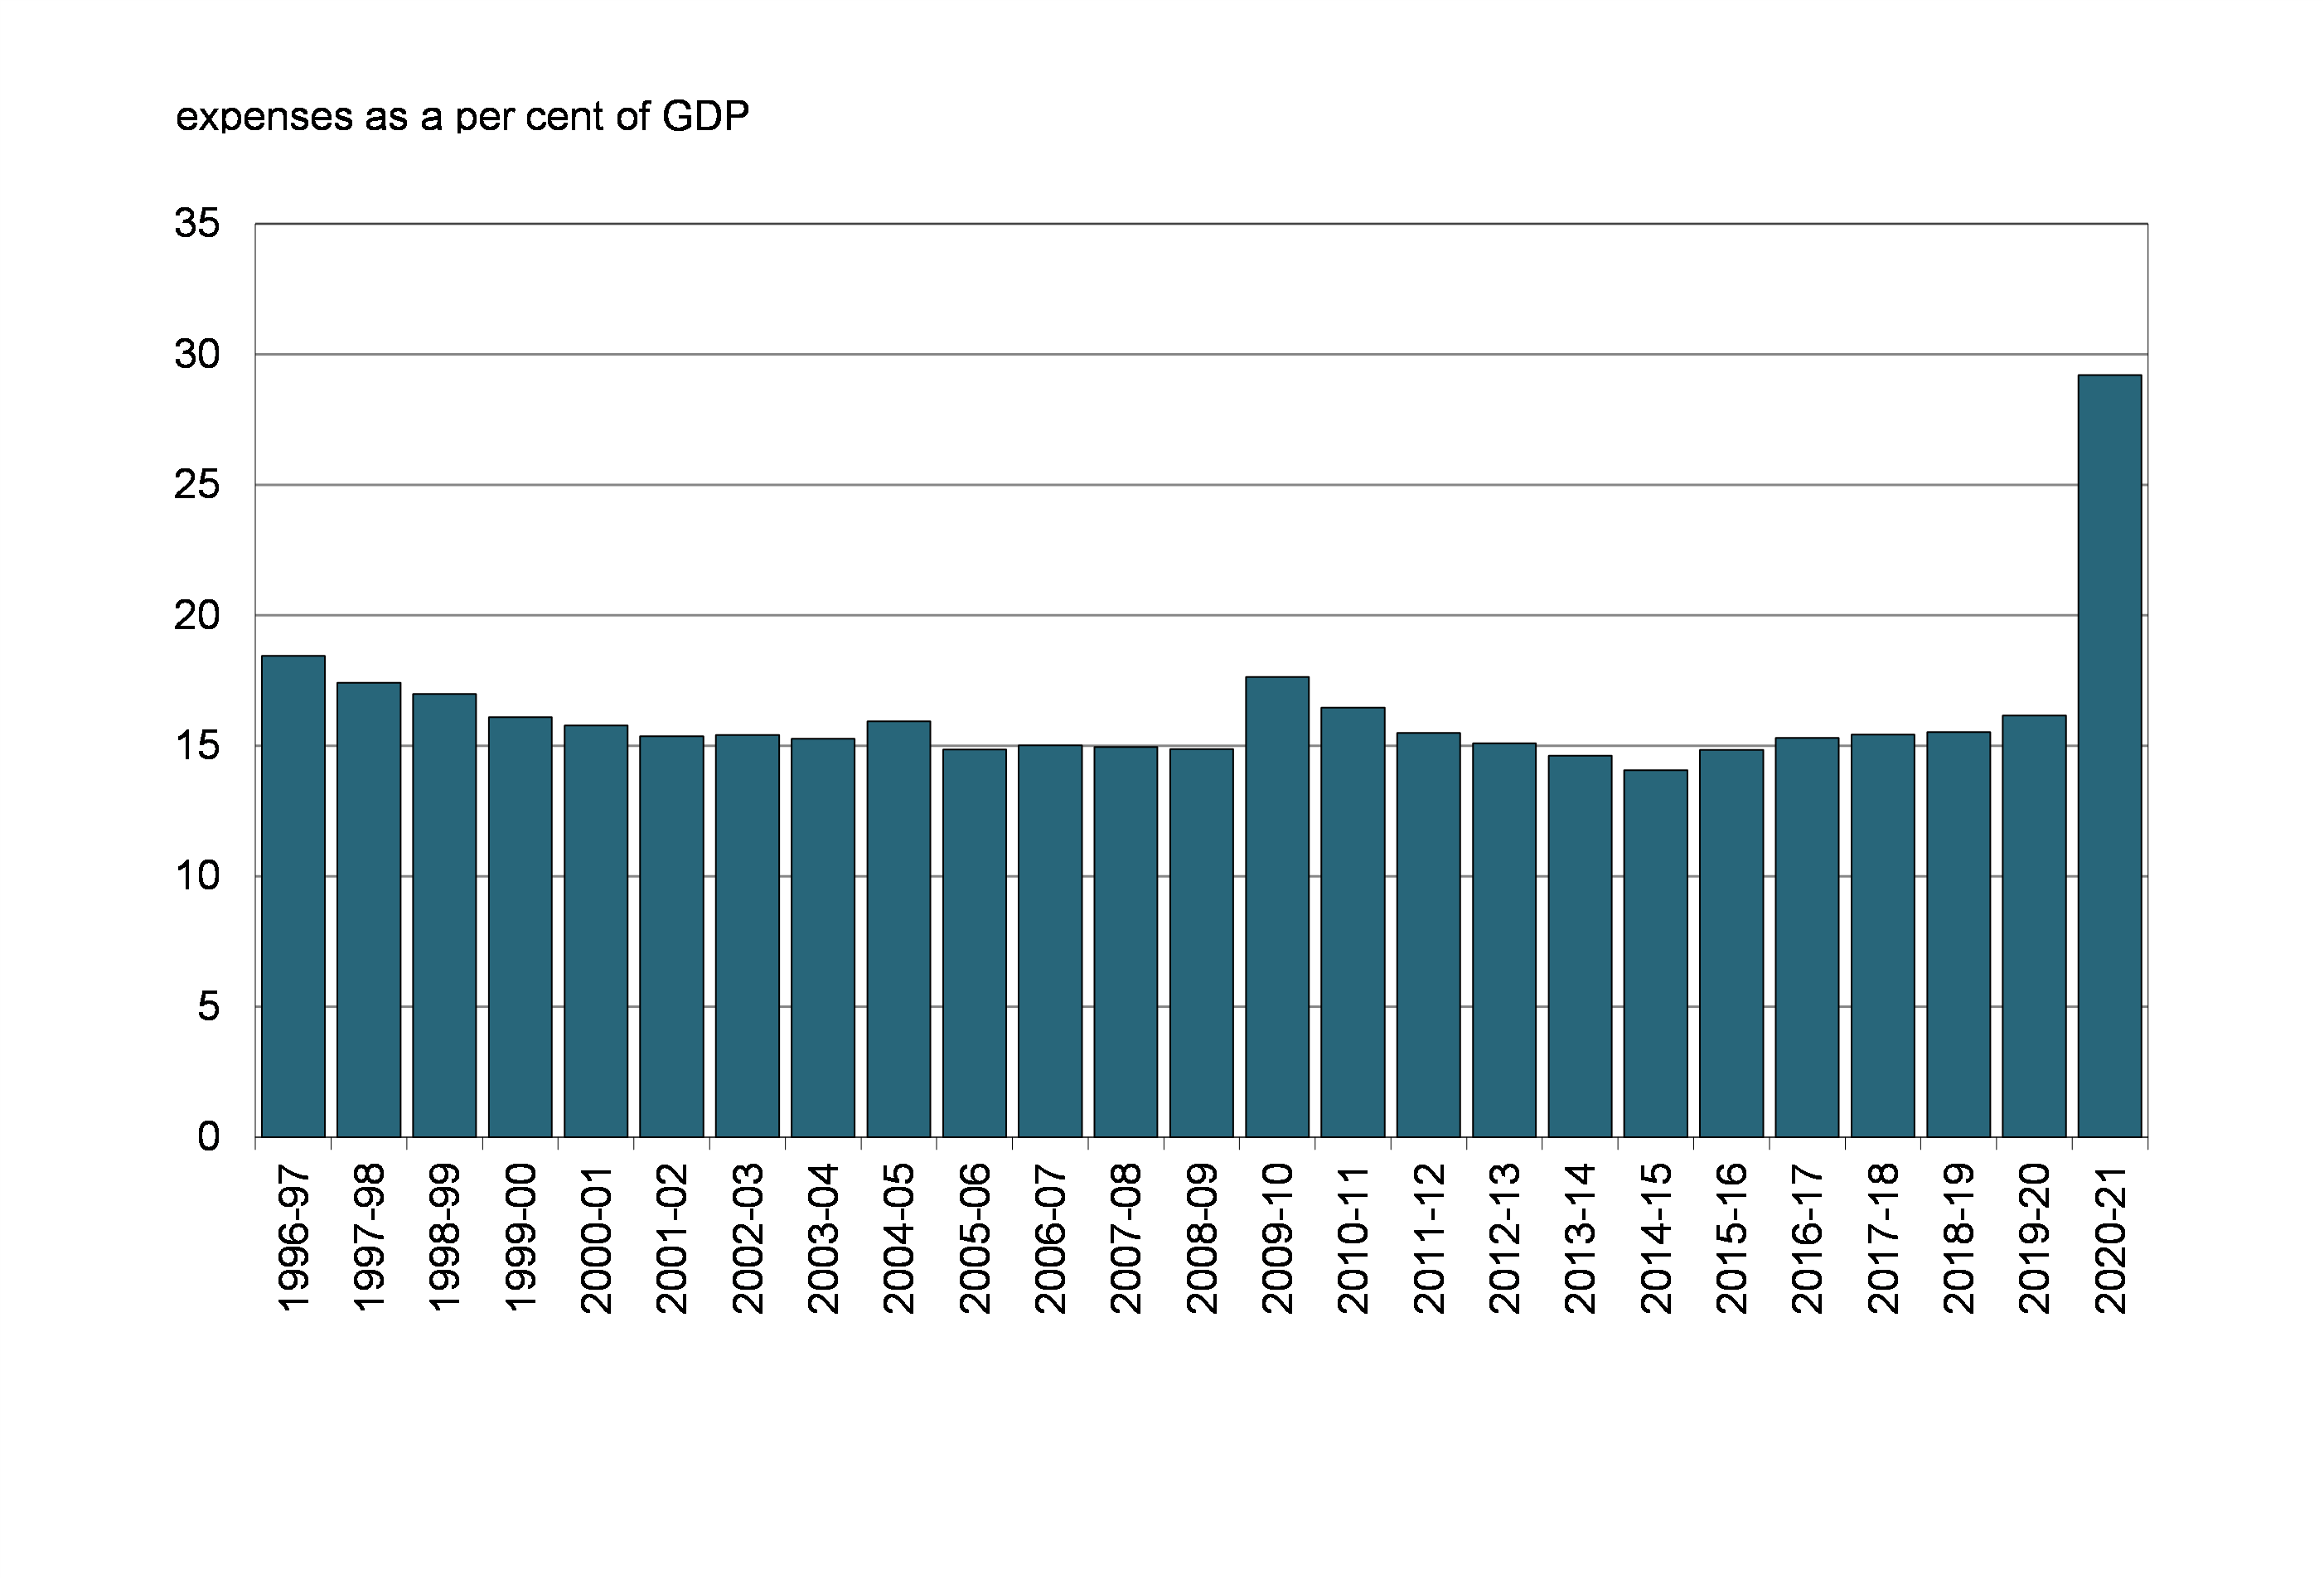
The expense ratio—expenses as a percentage of GDP—compares the total of all federal expenses to the size of the economy. This ratio is influenced by policy actions, economic developments, and changes in interest rates. The ratio stood at 29.2 per cent in 2020–21 (up from 16.2 per cent in 2019–20), largely reflecting temporary COVID-19 response measures.
Expense Ratio
Federal Debt
The federal debt (accumulated deficit) is the difference between the government's total liabilities and its total assets. With total liabilities of $1.7 trillion, financial assets of $502.4 billion and non-financial assets of $101.1 billion, the federal debt stood at $1,048.7 billion at March 31, 2021, up $327.4 billion from March 31, 2020.
The $327.4-billion increase in the federal debt reflects the 2020–21 budgetary deficit of $327.7 billion and $0.3 billion in other comprehensive income.
| 2020–21 | 2019–20 | Net change | |
|---|---|---|---|
| Federal debt at beginning of year | (721,360) | (685,450) | (35,910) |
| Annual deficit | (327,729) | (39,392) | (288,337) |
| Other comprehensive income | 343 | 3,482 | (3,139) |
| Federal debt at end of year | (1,048,746) | (721,360) | (327,386) |
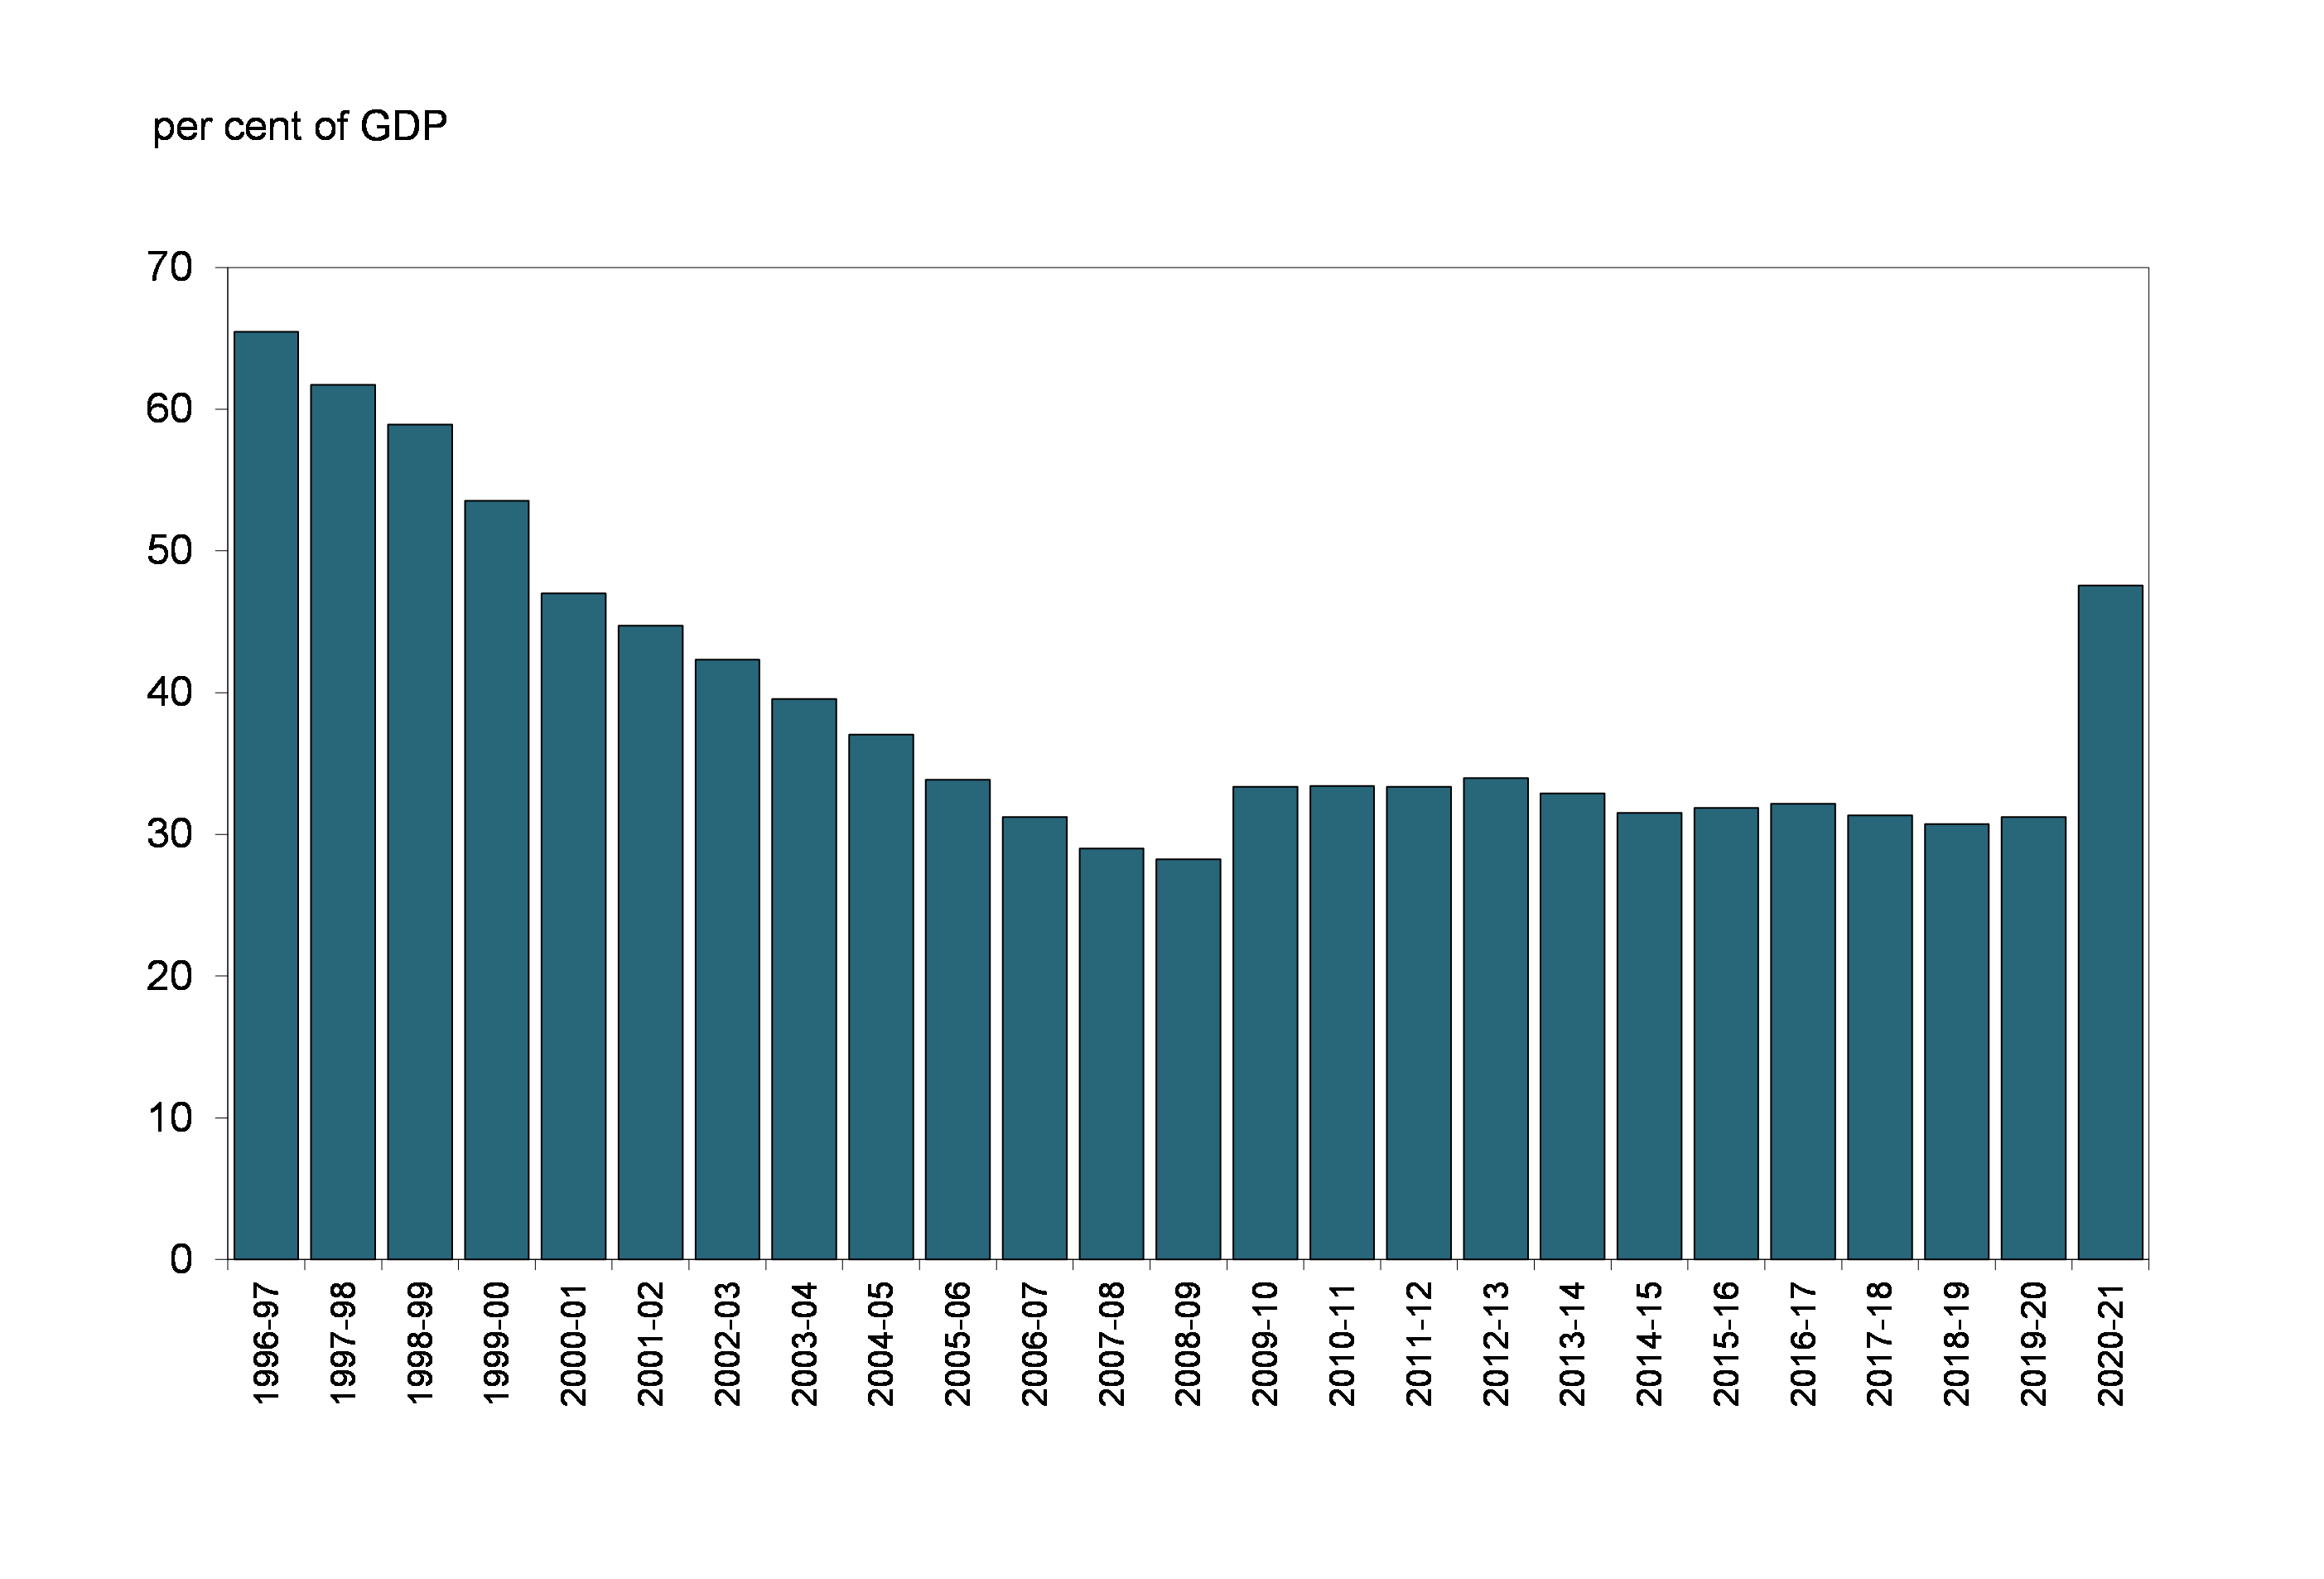
The following chart shows the federal debt since 1996–97. The federal debt stood at 47.6 per cent of GDP in 2020–21, up from 31.2 per cent in 2019–20.
Federal Debt (Accumulated Deficit)
| 2020–21 | 2019–20 | |
|---|---|---|
| Liabilities | ||
Accounts payable and accrued liabilities |
207.4 | 163.8 |
Interest-bearing debt |
||
Unmatured debt |
1,125.2 | 783.8 |
Pensions and other employee future benefits |
312.9 | 295.0 |
Other liabilities |
6.7 | 6.1 |
Total interest-bearing debt |
1,444.8 | 1,084.8 |
Total liabilities |
1,652.2 | 1,248.6 |
| Financial assets | ||
Cash and other accounts receivable |
81.7 | 52.6 |
Taxes receivable |
142.5 | 121.1 |
Foreign exchange accounts |
92.6 | 104.9 |
Loans, investments and advances |
179.3 | 152.5 |
Public sector pension assets |
6.3 | 4.6 |
Total financial assets |
502.4 | 435.7 |
| Net debt | (1,149.8) | (812.9) |
| Non-financial assets | ||
Tangible capital assets |
87.6 | 83.7 |
Inventories |
9.8 | 6.2 |
Prepaid expenses and other |
3.7 | 1.7 |
Total non-financial assets |
101.1 | 91.5 |
| Federal debt (accumulated deficit) | (1,048.7) | (721.4) |
| Note: Numbers may not add due to rounding. | ||
Assets
The government's assets consist of financial assets (cash and other accounts receivable, taxes receivable, foreign exchange accounts, loans, investments and advances, and public sector pension assets) and non-financial assets (tangible capital assets, inventories, and prepaid expenses and other).
At March 31, 2021, financial assets amounted to $502.4 billion, up $66.7 billion from March 31, 2020. The increase in financial assets reflects increases in cash and other accounts receivable, taxes receivable, loans, investments and advances, and public sector pension assets, offset in part by a decrease in foreign exchange accounts.
- At March 31, 2021, cash and other accounts receivable totalled $81.7 billion, up $29.0 billion from March 31, 2020. Within this component, cash and cash equivalents increased by $26.9 billion, reflecting the build-up of a larger cash position for contingency purposes. The balance of cash and cash equivalents includes $20 billion that has been designated as a deposit held with respect to prudential liquidity management. Other accounts receivable increased by $2.2 billion, driven by an increase in dividends receivable from EDC and CMHC at year-end and increased receivables for benefit overpayments, offset in part by lower cash collateral under International Swaps and Derivatives Association agreements in respect of outstanding cross-currency swap agreements.
- Taxes receivable increased by $21.4 billion during 2020–21 to $142.5 billion, reflecting a number of factors, including growth in the personal and corporate income tax revenue streams in 2020–21, growth in amounts owing due to targeted interest relief measures announced in February 2021, and lower receivable balances in the prior year due to the deferrals of tax filing deadlines announced as part of the government's COVID-19 relief measures.
- Loans, investments and advances increased by $26.8 billion in 2020–21.
- Loans, investments and advances in enterprise Crown corporations and other government business enterprises decreased by $5.1 billion in 2020–21. Investments in enterprise Crown corporations and other government business enterprises decreased $6.4 billion. This decrease reflects $13.6 billion in dividends declared or paid to the government in 2020–21 and $11.6 billion in net losses recorded for these entities. The net loss amount is largely attributable to the up-front expensing of premiums paid by the Bank of Canada on its secondary market purchases of Government of Canada securities in 2020–21. Under public sector accounting standards, premiums paid on these bond purchases are expensed immediately, which more than offset interest earned on the securities during the year. These decreases were offset in part by $18.5 billion in capital investments made in 2020–21, in large part to support COVID-19 liquidity and capital relief measures for businesses under the Business Credit Availability Program administered by BDC and EDC, as well as $0.3 billion in other comprehensive income. Net loans and advances to enterprise Crown corporations and other government business enterprises were up $1.3 billion, primarily reflecting $3.7 billion in financing to the Canada Development Investment Corporation from the Canada Account to finance construction activities for the Trans Mountain expansion project. This was offset in part by a $2.4-billion decrease in loans to Crown corporations under the consolidated borrowing framework.
- Other loans, investments and advances increased by $31.9 billion, from $27.4 billion to $59.3 billion. This increase largely reflects loans issued under the CEBA program, which provided interest-free loans of up to $60,000 to small businesses and not-for-profits. Repaying the balance of the loan on or before December 31, 2022 will result in loan forgiveness of up to 33 per cent (or $20,000).
- Public sector pension assets increased by $1.7 billion, largely reflecting an increase in the net assets under the Public Service Pension Fund, which pertains to service accrued on or after April 1, 2000 that falls within the Income Tax Act limits under the Public Service Superannuation Act.
- Foreign exchange accounts decreased by $12.3 billion in 2020–21, totalling $92.6 billion at March 31, 2021, due mainly to foreign exchange losses on the translation of the net assets denominated in foreign currencies to Canadian dollar equivalents as at March 31, 2021, reflecting appreciation in the value of the Canadian dollar, as well as a decrease in net advances to the Exchange Fund Account.
At March 31, 2021, non-financial assets stood at $101.1 billion, up $9.5 billion from a year earlier. Of this growth, $3.9 billion relates to an increase in tangible capital assets, largely reflecting an increase in assets under construction and machinery and equipment; $3.6 billion relates to an increase in inventories, largely reflecting an increase in the stock of personal protective equipment; and, $2.1 billion relates to an increase in prepaid expenses, particularly for vaccines.
Liabilities
The government's liabilities consist of accounts payable and accrued liabilities and interest-bearing debt.
At March 31, 2021, accounts payable and accrued liabilities totalled $207.4 billion, up $43.6 billion from March 31, 2020. This increase reflects growth in other accounts payable and accrued liabilities, amounts payable related to tax, provisions for contingent liabilities, and interest and matured debt, offset in part by slight decreases in deferred revenue, and environmental liabilities and asset retirement obligations.
- Amounts payable related to tax increased by $11.3 billion in 2020–21, from $60.2 billion at March 31, 2020, to $71.5 billion at March 31, 2021. This increase largely reflects COVID-19 transfer payments issued through the tax system payable on March 31, 2021 and issued subsequent to year-end, including transfers under the CEWS and the Canada Emergency Rent Subsidy, as well as lower assessed refunds owing at the end of the prior fiscal year due to extended filing deadlines under the government's Economic Response Plan.
- Provisions for contingent liabilities increased by $19.9 billion, largely reflecting revised estimates for various claims.
- Environmental liabilities and asset retirement obligations decreased by $0.2 billion in 2020–21, reflecting revisions to previously estimated provisions, net of remediation activities undertaken in 2020–21.
- Deferred revenue decreased by $0.1 billion in 2020–21.
- Liabilities for interest and matured debt increased by $0.2 billion from the prior year, reflecting accrued interest on a higher stock of debt at year-end.
- Other accounts payable and accrued liabilities increased by $12.4 billion in 2020–21. Within this component, liabilities under tax collection agreements increased by $7.7 billion, largely reflecting timing differences in payments to provinces and territories. Accounts payable increased by $5.8 billion, due mainly to the accrual of spending measures announced near year-end, including $4.0 billion to provinces and territories to help health systems recover, a
$2.2-billion top-up to the Canada Community-Building Fund, and $1.0 billion to assist provinces and territories with immunization campaigns. Miscellaneous paylist deductions increased by $19 million. These increases were offset in part by a $1.0-billion decrease in accrued salaries and benefits, largely reflecting the payment of retroactive salaries during the year. Notes payable to international organizations and other accounts payable decreased by $0.1 billion each.
Interest-bearing debt includes unmatured debt, or debt issued on the credit markets, pension and other future benefit liabilities, and other liabilities. At March 31, 2021, interest-bearing debt totalled $1,444.8 billion, up $360.1 billion from March 31, 2020. Within interest-bearing debt, unmatured debt increased by $341.4 billion, liabilities for public sector pensions increased by $0.2 billion, liabilities for other employee and veteran future benefits increased by $17.8 billion, and other liabilities increased by $0.7 billion.
The $341.4-billion increase in unmatured debt is largely attributable to a $351.8-billion increase in market debt and related unamortized discounts and premiums, reflecting increased borrowings to meet the government's financial requirements under the COVID-19 Economic Response Plan.
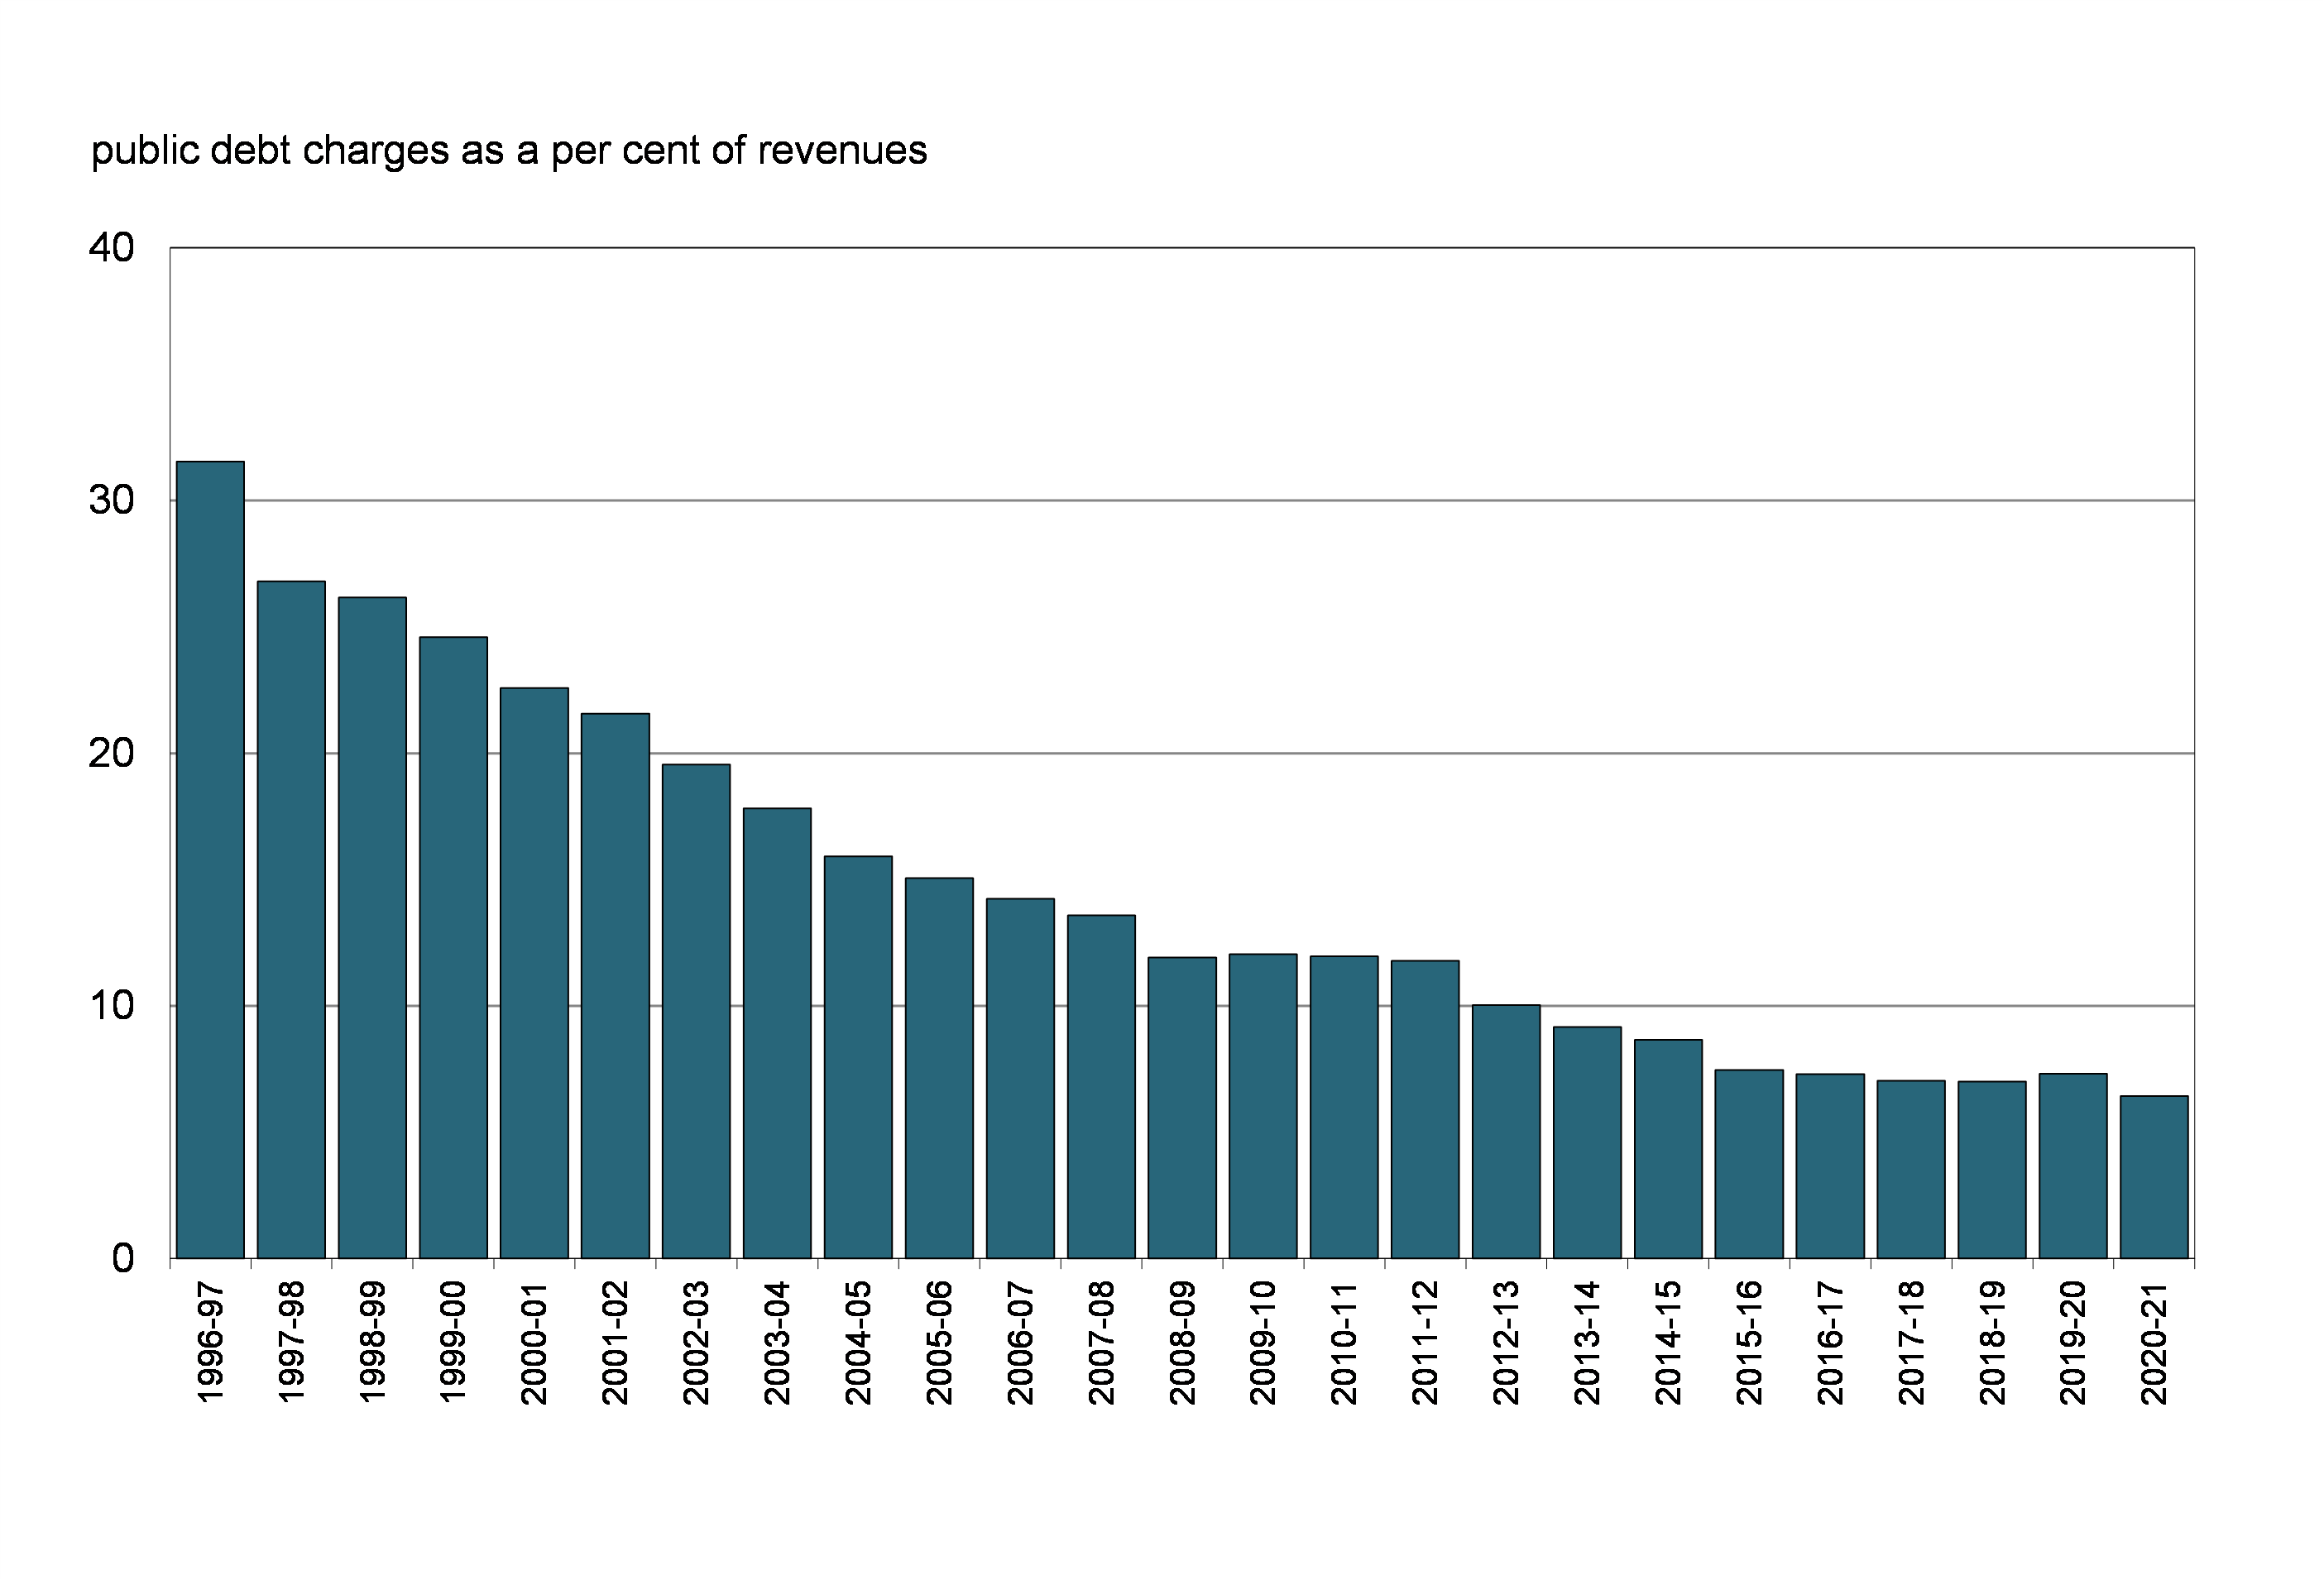
The interest ratio (public debt charges as a percentage of revenues) shows the proportion of every dollar of revenue that is needed to pay interest and is therefore not available to pay for program initiatives. The interest ratio has been decreasing in recent years, falling from a peak of 37.6 per cent in 1990–91 to 6.4 per cent in 2020–21. This means that, in 2020–21, the government spent approximately 6 cents of every revenue dollar on servicing the public debt.
Interest Ratio
International Comparisons of Government Debt
Jurisdictional responsibility (between central, state and local governments) for government programs differs among countries. As a result, international comparisons of government fiscal positions are made on a total government, National Accounts basis. For Canada, total government net debt includes that of the federal, provincial/territorial and local governments, as well as the net assets held in the Canada Pension Plan and Québec Pension Plan.
Canada Has the Lowest Total Government Net Debt Burden Among G7 Countries
G7 Total Government Net Debt, 2020

Canada's total government net debt-to-GDP ratio stood at 33.0 per cent in 2020, according to the IMF. This is the lowest level among G7 countries, which the IMF estimates recorded an average net debt of 104.9 per cent of GDP in that same year.
The following table provides a reconciliation between the Government of Canada's federal debt-to-GDP ratio and Canada's total government net debt-to-GDP ratio used for international debt comparison purposes. Importantly, Canada's total government net debt-to-GDP ratio includes the net debt of the federal, provincial, territorial and local governments as well as the net assets held by the Canada Pension Plan (CPP) and Québec Pension Plan (QPP), and excludes liabilities for public sector pensions and other employee future benefits.
| (per cent of GDP) | ||
|---|---|---|
| Federal debt | 47.6 | |
| Add: | Non-financial assets | 4.6 |
| Net debt (Public Accounts basis) | 52.1 | |
| Less: | Liabilities for public sector pensions | (7.7) |
| Liabilities for other future benefits | (6.5) | |
| National Accounts/Public Accounts methodological differences and timing adjustments1 | (8.2) | |
| Total federal net debt (National Accounts basis) | 29.8 | |
| Add: | Net debt of provincial/territorial and local governments | 20.6 |
| Less: | Net assets of the CPP/QPP | (15.7) |
| Total government net debt2 | 34.7 | |
| Note: Numbers may not add due to rounding. Sources: Statistics Canada and Public Accounts of Canada. 1 Includes timing differences (National Accounts data are as of December 31), differences in the universe covered by each accounting system, and differences in accounting treatments of various transactions such as capital gains. 2 The net debt figure has been revised by Statistics Canada since the publication of the IMF's April 2021 Fiscal Monitor, which is the source for the chart "G7 Total Government Net Debt, 2020". Net debt has been revised from 33.0 per cent to 34.7 per cent. |
||
Financial Source/Requirement
The budgetary balance is the most comprehensive measure of the federal government's fiscal results. It is presented on an accrual basis of accounting, recording government expenses when they are incurred, regardless of when the cash payment is made, and recording tax revenues when earned, regardless of when the cash is received.
In contrast, the financial source/requirement measures the difference between cash coming in to the government and cash going out. It differs from the budgetary balance in that it includes cash transactions in loans, investments and advances, public sector pensions and other employee future benefits, other specified purpose accounts, foreign exchange activities, and changes in other financial assets, liabilities and non-financial assets. These activities are included as part of non-budgetary transactions.
Non-budgetary transactions also include adjustments for the effects of non-cash items included in the budgetary balance and for any accruals of past or future cash receipts or payments. Examples of non-cash items include amortization of tangible capital assets, pension and other employee future benefit expenses not funded in the period, and the recognition of previously deferred revenue.
Non-budgetary transactions resulted in a net source of funds amounting to $13.2 billion in 2020–21, compared to a net requirement of funds of $7.8 billion in 2019–20. The year-over-year increase in the financial source from non-budgetary transactions largely reflects cash transactions and adjustments for non-cash items included in the budgetary balance related to foreign exchange activities and pensions and other accounts. These transactions and adjustments more than offset the increased financial requirement for loans, investments and advances generated by loans to support businesses as part of the COVID-19 Economic Response Plan.
With a budgetary deficit of $327.7 billion and a financial source from non-budgetary transactions of $13.2 billion, there was a total financial requirement of $314.6 billion in 2020–21, compared to a financial requirement of $47.2 billion in 2019–20 (Table 9).
The government financed this financial requirement of $314.6 billion and increased its cash balances by $26.9 billion by increasing unmatured debt by $341.4 billion. Cash balances at the end of March 2021 stood at $64.1 billion.
| 2020–21 | 2019–20 | |
|---|---|---|
| Deficit for the year | (327.7) | (39.4) |
| Non-budgetary transactions | ||
Pensions and other accounts |
||
Public sector pension liabilities |
0.2 | (0.2) |
Other employee and veteran future benefit liabilities |
17.8 | 12.5 |
Other liabilities |
0.7 | 0.1 |
Public sector pension assets |
(1.7) | (2.2) |
Total |
16.9 | 10.3 |
Non-financial assets |
(9.5) | (4.9) |
Loans, investments and advances |
(26.4) | (15.1) |
Other transactions |
||
Accounts payable, receivable, accruals and allowances |
19.9 | 7.1 |
Foreign exchange activities |
12.3 | (5.2) |
Total |
32.2 | 1.8 |
| Total non-budgetary transactions | 13.2 | (7.8) |
| Financial requirement | (314.6) | (47.2) |
| Net change in financing activities | ||
Marketable bonds (Canadian currency) |
278.4 | 27.3 |
Treasury bills |
66.9 | 17.6 |
Retail debt |
(0.2) | (0.7) |
Other |
(3.7) | 2.7 |
Total |
341.4 | 46.8 |
| Change in cash balances | 26.9 | (0.4) |
| Cash at end of year | 64.1 | 37.2 |
| Note: Numbers may not add due to rounding. | ||
Report of the Independent Auditor on the Condensed Consolidated Financial Statements
To the Minister of Finance
Opinion
The condensed consolidated financial statements, which comprise the condensed consolidated statement of financial position as at 31 March 2021, the condensed consolidated statement of operations and accumulated deficit, condensed consolidated statement of change in net debt and condensed consolidated statement of cash flow for the year then ended, and related notes, are derived from the audited consolidated financial statements of the Government of Canada for the year ended 31 March 2021.
In our opinion, the accompanying condensed consolidated financial statements are a fair summary of the audited consolidated financial statements of the Government of Canada, on the basis described in Note 1.
Condensed Consolidated Financial Statements
The condensed consolidated financial statements do not contain all the disclosures required by Canadian public sector accounting standards. Reading the condensed consolidated financial statements and the auditor's report thereon, therefore, is not a substitute for reading the audited consolidated financial statements of the Government of Canada and the auditor's report thereon.
The Audited Consolidated Financial Statements of the Government of Canada and Our Report Thereon
We expressed an unmodified audit opinion on the audited consolidated financial statements of the Government of Canada in our report dated 9 September 2021. That report also includes an Emphasis of Matter paragraph that draws attention to the significant impact of the COVID-19 pandemic on the audited consolidated financial statements as a result of
- actions taken by the Government of Canada to protect public health and reduce economic impacts on individuals and businesses
- uncertainty created by the pandemic
Management's Responsibility for the Condensed Consolidated Financial Statements
Management is responsible for the preparation of the condensed consolidated financial statements on the basis described in Note 1.
Auditor's Responsibility
Our responsibility is to express an opinion on whether the condensed consolidated financial statements are a fair summary of the audited consolidated financial statements of the Government of Canada based on our procedures, which were conducted in accordance with Canadian Auditing Standard (CAS) 810, Engagements to Report on Summary Financial Statements.
Original signed by
Karen Hogan, FCPA, FCA
Auditor General of Canada
Ottawa, Canada
9 September 2021, except as to Note 7, which is as of 19 November 2021.
Condensed Consolidated Financial Statements of the Government of Canada
The fundamental purpose of these condensed consolidated financial statements is to provide an overview of the financial affairs and resources for which the Government is responsible under authority granted by Parliament. Responsibility for the integrity and objectivity of these statements rests with the Government.
| 2021 Budget (Note 3) |
2021 Actual | 2020 Actual | |
|---|---|---|---|
| Revenues | |||
Income tax revenues |
195,250 | 236,974 | 227,112 |
Other taxes and duties |
46,383 | 46,954 | 53,880 |
Employment insurance premiums |
19,930 | 22,392 | 22,219 |
Proceeds from the pollution pricing framework |
4,333 | 4,380 | 2,655 |
Other revenues |
2,925 | 5,746 | 28,265 |
Total revenues |
268,821 | 316,446 | 334,131 |
| Expenses | |||
Transfer payments |
|||
Old age security benefits and related payments |
59,162 | 58,529 | 56,227 |
Major transfer payments to other levels of government |
94,590 | 106,653 | 79,175 |
Employment insurance and support measures |
63,725 | 58,356 | 21,750 |
Children's benefits |
26,966 | 27,370 | 24,344 |
Canada emergency response benefit and Canada recovery benefits |
39,725 | 55,832 | 4,739 |
Canada emergency wage subsidy |
82,305 | 80,166 | - |
Proceeds from the pollution pricing framework returned |
5,160 | 4,566 | 2,636 |
Other transfer payments |
93,954 | 97,961 | 54,405 |
Total transfer payments |
465,587 | 489,433 | 243,276 |
Other expenses, excluding net actuarial losses |
112,147 | 119,089 | 95,191 |
Total program expenses, excluding net actuarial losses |
577,734 | 608,522 | 338,467 |
Public debt charges |
19,459 | 20,358 | 24,447 |
Total expenses, excluding net actuarial losses |
597,193 | 628,880 | 362,914 |
| Annual deficit before net actuarial losses | (328,372) | (312,434) | (28,783) |
Net actuarial losses |
(14,874) | (15,295) | (10,609) |
| Annual deficit | (343,246) | (327,729) | (39,392) |
| Accumulated deficit at beginning of year | (721,360) | (721,360) | (685,450) |
| Other comprehensive income | - | 343 | 3,482 |
| Accumulated deficit at end of year | (1,064,606) | (1,048,746) | (721,360) |
| The accompanying notes are an integral part of these condensed consolidated financial statements. | |||
| 2021 | 2020 | |
|---|---|---|
| Liabilities | ||
Accounts payable and accrued liabilities |
207,397 | 163,833 |
Interest-bearing debt |
||
Unmatured debt |
1,125,186 | 783,751 |
Pensions and other future benefits |
312,947 | 294,974 |
Other liabilities |
6,711 | 6,051 |
Total interest-bearing debt |
1,444,844 | 1,084,776 |
Total liabilities |
1,652,241 | 1,248,609 |
| Financial assets | ||
Cash and accounts receivable |
224,196 | 173,715 |
Foreign exchange accounts |
92,622 | 104,903 |
Loans, investments and advances |
179,278 | 152,502 |
Public sector pension assets |
6,320 | 4,598 |
Total financial assets |
502,416 | 435,718 |
| Net debt | (1,149,825) | (812,891) |
| Non-financial assets | ||
Tangible capital assets |
87,583 | 83,682 |
Other |
13,496 | 7,849 |
Total non-financial assets |
101,079 | 91,531 |
| Accumulated deficit | (1,048,746) | (721,360) |
| Contingent liabilities (Note 4) Contractual obligations and contractual rights (Note 5) |
||
| The accompanying notes are an integral part of these condensed consolidated financial statements. | ||
| 2021 Budget (Note 3) |
2021 Actual | 2020 Actual | |
|---|---|---|---|
| Net debt at beginning of year | (812,891) | (812,891) | (772,124) |
| Change in net debt during the year | |||
Annual deficit |
(343,246) | (327,729) | (39,392) |
Acquisition of tangible capital assets |
(12,423) | (10,127) | (10,286) |
Amortization of tangible capital assets |
6,615 | 5,969 | 5,790 |
Other |
499 | (5,390) | (361) |
Net increase in net debt due to operations |
(348,555) | (337,277) | (44,249) |
Other comprehensive income |
- | 343 | 3,482 |
Net increase in net debt |
(348,555) | (336,934) | (40,767) |
| Net debt at end of year | (1,161,446) | (1,149,825) | (812,891) |
| The accompanying notes are an integral part of these condensed consolidated financial statements | |||
| 2021 | 2020 | |
|---|---|---|
| Cash used by operating activities | ||
Annual deficit |
(327,729) | (39,392) |
Adjustments to reconcile annual deficit to cash used by operating activities |
77,254 | 24,105 |
| (250,475) | (15,287) | |
| Cash used by capital investment activities | (9,910) | (9,441) |
| Cash used by investing activities | (64,078) | (13,052) |
| Cash provided by financing activities | 351,322 | 37,387 |
| Net increase (decrease) in cash and cash equivalents | 26,859 | (393) |
| Cash and cash equivalents at beginning of year | 37,242 | 37,635 |
| Cash and cash equivalents at end of year | 64,101 | 37,242 |
| Supplementary information | ||
| Cash used for interest | 15,094 | 15,803 |
| The accompanying notes are an integral part of these condensed consolidated financial statements. | ||
Notes to the Condensed Consolidated Financial Statements of the Government of Canada
1. Applied Criteria in the Preparation of the Condensed Consolidated Financial Statements
The criteria applied by the Government in the preparation of these condensed consolidated financial statements are as follows:
- These condensed consolidated financial statements are extracted from the audited consolidated financial statements included in Section 2 of Volume I of the Public Accounts of Canada 2021, which are to be tabled in Parliament.
- The condensed consolidated financial statements are in agreement with the related information in the audited consolidated financial statements and contain the information necessary to avoid distorting or obscuring matters disclosed in the related complete audited consolidated financial statements, including the notes thereto.
- As these condensed consolidated financial statements are, by their nature, summarized, they do not include all disclosures required by Canadian public sector accounting standards.
- Readers interested in the disclosure of more detailed data should refer to the audited consolidated financial statements in the Public Accounts of Canada.
2. Summary of Significant Accounting Policies
The reporting entity of the Government of Canada includes all of the government organizations that comprise the legal entity of the government as well as other government organizations, including Crown corporations, which are separate legal entities but are controlled by the government. The financial activities of all of these entities, except for enterprise Crown corporations and other government business enterprises, are consolidated in these financial statements on a line-by-line and uniform basis of accounting after eliminating significant inter-governmental balances and transactions. Enterprise Crown corporations and other government business enterprises, which are not dependent on the government for financing their activities, are recorded under the modified equity method. The Canada Pension Plan (CPP), which includes the assets of the CPP under the administration of the Canada Pension Plan Investment Board, is excluded from the reporting entity because changes to the CPP require the agreement of two thirds of participating provinces and it is therefore not controlled by the government.
The government accounts for transactions on an accrual basis, using the government's accounting policies that are described in Note 1 to its audited consolidated financial statements, which are based on Canadian public sector accounting standards. The presentation and results using the stated accounting policies do not result in any significant differences from Canadian public sector accounting standards.
Financial assets presented on the Condensed Consolidated Statement of Financial Position can provide resources to discharge liabilities or finance future operations and are recorded at the lower of cost or net realizable value. Non-financial assets cannot normally be converted into cash to finance future operations without disrupting government operations; they are recorded at cost less accumulated amortization. Liabilities are recorded at the estimated amount ultimately payable, adjusted for the passage of time, as required. Obligations for pensions and other future benefits are measured on an actuarial basis. Allowances for valuation are established for loans, investments and advances, as well as for loan guarantees and other obligations.
Some amounts in these condensed consolidated financial statements are based on estimates and assumptions made by the government. They are based on facts and circumstances, historical experience, general economic conditions and reflect the government's best estimate of the related amount at the end of the reporting period. Estimates and underlying assumptions are reviewed annually at March 31. Revisions to accounting estimates are recognized in the period in which estimates are revised if revisions affect only that period or in the period of revision and future periods if revisions affect both current and future periods.
Measurement uncertainty that is material exists when it is reasonably possible that a material variance could occur in the reported or disclosed amount in the near term. Near term is defined as a period of time not to exceed one year from March 31. The government has determined that measurement uncertainty exists with respect to the reported amounts for:
- the accrual of tax revenues and the related amounts receivable, other receivables and payables, and the allowance for doubtful accounts;
- expenses;
- the provision for contingent liabilities (Note 4);
- environmental liabilities and asset retirement obligations;
- public sector pensions and other employee and veteran future benefits;
- enterprise Crown corporations and other government business enterprises;
- other loans, investments and advances;
- the expected useful life of tangible capital assets;
- inventory; and
- contractual rights (Note 5).
It is reasonably possible that the government's reassessments of these estimates and assumptions could require a material change in reported amounts or disclosures in the condensed consolidated financial statements.
The COVID-19 pandemic has impacted various estimates, assumptions, and judgments in these condensed financial statements. The government continues to assess and monitor the effects of the COVID-19 pandemic on its financial position, including related estimates and assumptions used in the preparation of its financial statements. The full potential impact of the COVID‐19 pandemic is unknown, as it will depend on future developments that are uncertain, including the duration and depth of the pandemic.
3. Source of Budget Amounts
The budget amounts included in the Condensed Consolidated Statement of Operations and Accumulated Deficit and the Condensed Consolidated Statement of Change in Net Debt are derived from the amounts that were projected for 2021 in the Economic and Fiscal Snapshot 2020 (EFS 2020) as a budget was not tabled in Parliament in 2020. To enhance comparability with actual 2021 results, EFS 2020 amounts have been reclassified to conform to the current year's presentation in the condensed consolidated financial statements, with no overall impact on the projected 2021 annual deficit.
Since actual opening balances of the accumulated deficit and net debt were not available at the time of preparation of EFS 2020, the corresponding amounts in the budget column have been adjusted to the actual closing balances of the previous year.
4. Contingent Liabilities
Contingent liabilities arise in the normal course of operations and their ultimate disposition is unknown. Contingent liabilities are potential liabilities that may become actual liabilities when one or more future events not wholly within the government's control occur or fail to occur. A provision is recorded when the potential liabilities are assessed as likely to become an actual liability and a reasonable estimate of the loss can be made. The government's contingent liabilities include claims comprising pending and threatened litigation, specific claims and comprehensive land claims; guarantees provided by the government; assessed taxes under appeal; callable share capital in international organizations; and, insurance programs of agent enterprise Crown corporations.
- There are thousands of claims, including pending and threatened litigation, specific claims and comprehensive land claims outstanding against the government. While the total amount claimed in these actions is significant, their outcomes are not determinable in all cases. The government has recorded an allowance for claims where it is likely that there will be a future payment and a reasonable estimate of the loss can be made. Significant exposure to a liability could exist in excess of what has been accrued. In situations where the outcome is likely but management cannot reasonably estimate a liability, no amount is accrued. Claims and litigation for which the outcome is not determinable and for which an amount has not been accrued are estimated at approximately $4,791 million ($4,648 million in 2020).
- Guarantees provided by the government include guarantees on the borrowings of enterprise Crown corporations and other government business enterprises, loan guarantees, insurance programs managed by the government or agent enterprise Crown corporations, and other explicit guarantees. At March 31, 2021, the principal amount outstanding for guarantees provided by the government amounts to $583,745 million ($564,298 million in 2020) for which an allowance of $720 million ($761 million in 2020) has been recorded. Of the total amount guaranteed, $314,727 million ($309,909 million in 2020) relates to guarantees on the borrowings of agent enterprise Crown corporations.
- Contingent liabilities include previously assessed federal taxes where amounts are being appealed to the Tax Court of Canada, the Federal Court of Appeal, or the Supreme Court of Canada. As of March 31, 2021, an amount of $4,269 million ($4,373 million in 2020) was being appealed to the courts. The government has recorded, in accounts payable and accrued liabilities or in reduction of cash and accounts receivable, as applicable, the estimated amount of appeals that are considered likely to be lost and that can be reasonably estimated.
- The government has callable share capital in certain international organizations that could require payments to those agencies. At March 31, 2021, callable share capital amounts to $37,781 million ($36,533 million in 2020).
- At March 31, 2021, insurance in force relating to self-sustaining insurance programs operated by four agent enterprise Crown corporations amounts to $1,902,250 million ($1,802,143 million in 2020). The government expects that all four corporations will cover the cost of both current claims and possible future claims.
5. Contractual Obligations and Contractual Rights
The nature of government activities results in large multi-year contracts and agreements, including international treaties, protocols and agreements of various size and importance. Any financial obligations resulting from these contracts and agreements are recorded as a liability when the terms for the acquisition of goods and services or the provision of transfer payments are met.
Contractual obligations that will materially affect the level of future expenditures include transfer payment agreements, agreements for the acquisition of goods and services, operating leases and funding of international organizations. At March 31, 2021, contractual obligations amount to $187,990 million, of which $56,766 million pertains to fiscal year 2022.
The activities of government sometimes involve the negotiation of contracts or agreements with outside parties that result in the government having rights to both assets and revenues in the future. They principally involve sales of goods and services, leases of property, and royalties and profit-sharing arrangements. The terms of these contracts and agreements may not allow for a reasonable estimate of future revenues. For contracts and agreements that do allow for a reasonable estimate, total revenues to be received in the future under major contractual rights are estimated at $33,074 million at March 31, 2021, of which $3,126 million pertains to fiscal year 2022.
6. COVID-19 pandemic
In March 2020, the World Health Organization officially declared the outbreak of COVID-19 as a global pandemic. The COVID-19 pandemic continues to have a significant adverse impact on the global economy. The overall economy continues to navigate the pandemic with continuing uncertainty. As this pandemic is ongoing and the government response is continuing to evolve, the impact on the government's financial results is subject to considerable uncertainty. The condensed consolidated financial statements for the fiscal year end March 31, 2021, reflect the impacts resulting from the COVID-19 pandemic to the extent known and estimable at the reporting date. Between April 1 and June 30, 2021, the government increased its unmatured debt by $54,125 million, reflecting, in large part, borrowings undertaken to continue to meet expenditure requirements under the Economic Response Plan.
Budget 2021 released by the Department of Finance Canada on April 19, 2021, sets out the government's economic and fiscal projections for fiscal years 2021 to 2026. The effects of the pandemic will continue into the foreseeable future, and the government continues to assess and monitor the effects on its financial condition, and provide regular updates on its financial results through regular reporting processes and periodic economic and fiscal updates.
7. Subsequent Events
On September 29, 2021, the Federal Court of Canada issued its decision on Canada's application for a judicial review of the Canadian Human Rights Tribunal's orders regarding compensation under the First Nations Child and Family Services program and Jordan's Principle, as well as the definition of a First Nations child under Jordan's Principle. The Court rejected Canada's arguments and upheld the Tribunal's orders. The decision was appealed by the government on October 29, 2021. As at November 19, 2021, the financial impact on the government's condensed consolidated financial statements of these events was assessed. As a result, the government's best estimate of the contingent liability recognized within the condensed consolidated financial statements reflects information available as of November 19, 2021.