
Archived - Annual Financial Report of the Government of Canada Fiscal Year 2021-2022
Note to Readers
The financial results in this report are based on the audited consolidated financial statements of the Government of Canada for the fiscal year ended March 31, 2022, the condensed form of which is included in this report.
For the 24th consecutive year, the government has received an unmodified audit opinion from the Auditor General of Canada on the consolidated financial statements. The complete consolidated financial statements are available on the Public Services and Procurement Canada website.
The Fiscal Reference Tables have been updated to incorporate the results for 2021–22 as well as historical revisions to the National Economic and Financial Accounts published by Statistics Canada.
Report Highlights
- The government posted a budgetary deficit of $90.2 billion for the fiscal year ended March 31, 2022, compared to a deficit of $327.7 billion in the previous fiscal year. The year-over-year improvement in the budgetary balance reflects the strong recovery of the Canadian economy from the effects of the pandemic, as well as the transition from broad-based supports under Canada’s COVID-19 Economic Response Plan to more targeted measures.
- The budgetary deficit before net actuarial losses was $80.0 billion for the fiscal year ended March 31, 2022. The budgetary balance before net actuarial losses is intended to supplement the traditional budgetary balance and improve the transparency of the government’s financial reporting by isolating the impact of the recognition of net actuarial losses arising from the government’s pension and other employee future benefit plans.
- Compared to projections in Budget 2022, the annual deficit was $23.6 billion lower than the $113.8-billion deficit projected, mainly reflecting higher-than-expected tax revenues and lower-than-expected expenses for COVID-19 programs.
- Compared to the 2020–21 fiscal year:
- Revenues increased by $96.8 billion, or 30.6 per cent, reflecting a broad-based increase in revenue, compared to the previous year when COVID-19 lockdowns and federal government measures, such as the one-time Goods and Services Tax (GST) credit, had resulted in lower revenues.
- Program expenses excluding net actuarial losses decreased by $139.7 billion, or 23.0 per cent, largely reflecting lower transfers to individuals, businesses, and other levels of government under the Economic Response Plan.
- Net actuarial losses, which reflect changes in the value of the government’s obligations and assets for public sector pensions and other employee and veteran future benefits recorded in previous fiscal years, decreased $5.1 billion, or 33.4 per cent. This decrease primarily reflects the amortization in 2021–22 of a decrease in the government’s obligations for pensions and other employee future benefits based on actuarial valuations prepared for the Public Accounts of Canada 2021.
- Public debt charges were up $4.1 billion, or 20.3 per cent, largely reflecting higher Consumer Price Index adjustments on Real Return Bonds, higher interest on the government’s pension and other employee future benefit obligations, and an increased stock of interest-bearing debt.
- The federal debt (the difference between total liabilities and total assets) stood at $1,134.5 billion at March 31, 2022. The federal debt-to-GDP (gross domestic product) ratio was 45.5 per cent, down from 47.5 per cent in the previous year. As noted in Budget 2022, the government remains committed to unwinding COVID-19-related deficits and reducing the federal debt-to-GDP ratio over the medium term.
- As reported by the International Monetary Fund (IMF), Canada's total government net debt-to-GDP ratio, which includes the net debt of the federal, provincial/territorial and local governments, as well as the net assets held in the Canada Pension Plan and Québec Pension Plan, stood at 33.2 per cent in 2021. This is the lowest level among Group of Seven (G7) countries, which the IMF expects recorded an average net debt of 101.2 per cent of GDP for the same year. Canada's total government budgetary deficit-to-GDP ratio was 4.7 per cent in 2021. This was the second-smallest deficit among G7 countries, which the IMF expects recorded an average deficit of 8.4 per cent of GDP for the same year.
- For the 24th consecutive year, the government has received an unmodified audit opinion from the Auditor General of Canada on the consolidated financial statements.
| 2021–22 | 2020–21 | |
|---|---|---|
| Budgetary transactions | ||
| Revenues | 413.3 | 316.4 |
| Expenses | ||
Program expenses, excluding net actuarial losses |
468.8 | 608.5 |
Public debt charges |
24.5 | 20.4 |
Total expenses, excluding net actuarial losses |
493.3 | 628.9 |
| Budgetary balance, excluding net actuarial losses | (80.0) | (312.4) |
Net actuarial losses |
10.2 | 15.3 |
| Budgetary balance | (90.2) | (327.7) |
| Non-budgetary transactions | 8.8 | 13.2 |
| Financial source/requirement | (81.4) | (314.6) |
| Net change in financing activities | 118.1 | 341.4 |
| Net change in cash balances | 36.7 | 26.9 |
| Cash balance at end of period | 100.8 | 64.1 |
| Financial position | ||
| Total liabilities | 1,838.7 | 1,652.2 |
| Total financial assets | 600.3 | 502.4 |
| Net debt | (1,238.4) | (1,149.8) |
| Non-financial assets | 103.9 | 101.1 |
| Federal debt (accumulated deficit) | (1,134.5) | (1,048.7) |
| Financial results (per cent of GDP) | ||
| Revenues | 16.6 | 14.3 |
| Total program expenses | 19.2 | 28.3 |
| Public debt charges | 1.0 | 0.9 |
| Budgetary balance | (3.6) | (14.9) |
| Federal debt (accumulated deficit) | 45.5 | 47.5 |
|
Note: Numbers may not add due to rounding. |
||
Economic DevelopmentsFootnote 1
The Canadian economy staged a strong recovery in 2021 after contracting by 17 per cent and shedding 3 million jobs during the depths of the COVID-19 pandemic in 2020. Workers and businesses have displayed remarkable resilience as the world endured multiple waves of COVID-19. Real GDP returned to pre-pandemic levels earlier than expected, while Canada’s jobs recovery has meanwhile outperformed most of its G7 peers and surpassed expectations.
For 2021 as a whole, real GDP expanded 4.5 per cent, returning to its pre-pandemic level in the fourth quarter of 2021. The economy maintained a healthy momentum heading into 2022, leaving real GDP close to 1 per cent above its pre-pandemic level by the first quarter—the second fastest recovery among G7 peers behind only the United States. The solid economic conditions also helped bring close to 870,000 additional Canadians in employment relative to 2020, contributing to a notable decline in the unemployment rate. Elevated demand, particularly for goods, paired with supply chain bottlenecks, meanwhile drove an increase in consumer prices of 3.4 per cent. This, along with the strength in commodity prices, contributed to the solid rise in Canada’s nominal GDP, the broadest measure of the tax base, which grew 13 per cent in 2021 after contracting by 4.5 per cent in 2020.
Canada entered the 2021–22 fiscal year just as the impacts of the subsequent pandemic waves of fall 2020 and winter 2021 were beginning to subside, providing strong footing to the economy heading into the spring of 2021. Provincial re-openings and the loosening of related public health measures supported a solid rebound in employment, with the economy adding more than 700,000 jobs between June and November 2021, bringing employment back to its pre-pandemic level. Overall, Canada experienced one of the fastest job recoveries among G7 economies.
As the Canadian economy was recovering, the Omicron variant of COVID-19 emerged in late fall, triggering household cautiousness and the reintroduction of targeted restrictions. Public health measures and widespread worker absences related to the Omicron variant slowed economic activity at the beginning of the first quarter of 2022 and led to a loss of 200,000 jobs in January 2022. However, the overall economic impacts were milder and shorter-lived than previous waves, with real GDP and employment rebounding to pre-Omicron levels by February 2022.
By that point, there was growing optimism that, with the worst of the pandemic behind us and higher vaccination rates, economies would return to normal, allowing consumer demand to rebalance away from traded goods, which would support the easing of supply chain bottlenecks globally. The end of February 2022 was however marked by one of the most significant geopolitical developments of the last decades with the invasion of Ukraine by Russia. The war had far-reaching economic impacts, weighing on global activity and resulting in greater volatility in financial markets. Russia and Ukraine are both critical suppliers of many commodities, including energy and food, and with the war disrupting global transportation and imports of these products, this led to sudden increases in the prices of those commodities. These price pressures were rapidly felt by consumers globally. By the end of March 2022, Canadian consumers were paying roughly 25 per cent more for gasoline than they were just three months prior.
It is also against the stronger economic backdrop of spring 2021 that inflation began to accelerate, surpassing the Bank of Canada's target's upper bound of 3 per cent for the first time since 2011. The inflation rate progressively increased and reached 6.7 per cent year-over-year by the end of 2021–22. The war-induced rise in commodity prices paired with rebounding demand and acute supply chain stress pushed inflation to rates not seen since the early 1990s. The Bank of Canada started to tighten monetary policy with a 25 basis points hike in its policy rate to 0.5 per cent in early March 2022. The increase was the first time the Bank has tightened monetary policy since 2018. Since then, the Bank of Canada has raised its policy rate three more times by a combined 200 basis points to 2.5 per cent, while inflation reached 8.1 per cent in June, before decelerating slightly in July.
The economic outlook heading into the last few months of 2022 appears increasingly uncertain and Canada would not be immune from potential setbacks. There are growing concerns that the global economy is becoming more fragile, with signs suggesting that growth in many leading economies is slowing. Moreover, the Russian invasion of Ukraine is still a critical source of macroeconomic risk six months after its onset. In this context, economic forecasts are subject to a particularly wide range of potential outcomes. The survey of private sector economists has been used as the basis for economic and fiscal planning since 1994 and introduces an element of independence into the government’s forecasts. This practice has been supported by international organizations, such as the IMF.
| 2020 | 2021 | 2022 | 2023 | |
|---|---|---|---|---|
| Real GDP growth | ||||
| Budget 2021 | -5.2 | 5.8 | 4.0 | 2.1 |
| Budget 2022 | -5.2 | 4.5 | 3.9 | 3.1 |
| Actual | -5.2 | 4.5 | – | – |
| Nominal GDP growth | ||||
| Budget 2021 | -4.5 | 9.5 | 6.0 | 4.0 |
| Budget 2022 | -4.5 | 13.0 | 8.0 | 4.8 |
| Actual | -4.5 | 13.0 | – | – |
| 3-month treasury bill rate | ||||
| Budget 2021 | 0.4 | 0.1 | 0.2 | 0.5 |
| Budget 2022 | 0.4 | 0.1 | 0.8 | 1.7 |
| Actual | 0.4 | 0.1 | – | – |
| 10-year government bond rate | ||||
| Budget 2021 | 0.7 | 1.5 | 1.8 | 2.1 |
| Budget 2022 | 0.7 | 1.4 | 2.0 | 2.4 |
| Actual | 0.7 | 1.4 | – | – |
| Unemployment rate | ||||
| Budget 2021 | 9.6 | 8.0 | 6.5 | 6.2 |
| Budget 2022 | 9.6 | 7.4 | 5.8 | 5.5 |
| Actual | 9.6 | 7.4 | – | – |
| Consumer Price Index inflation | ||||
| Budget 2021 | 0.7 | 2.2 | 2.0 | 2.1 |
| Budget 2022 | 0.7 | 3.3 | 3.9 | 2.4 |
| Actual | 0.7 | 3.4 | – | – |
|
Note: Figures have been restated to reflect the historical revisions in the Canadian System of National Accounts as of the first quarter of 2022 released on May 31, 2022. |
||||
Canada's COVID-19 Economic Response Plan
The government committed over $350 billion to support Canadians through the pandemic, with major investments in health care, procuring vaccines and personal protective equipment, income support for individuals, and responding to businesses’ urgent needs.
Canada's COVID-19 economic response—including job protections through the Canada Emergency Wage Subsidy (CEWS), liquidity support through programs like the Canada Emergency Business Account (CEBA), and income support through the Canada Emergency Response Benefit and the suite of Recovery Benefits—was key in bridging Canadians and businesses through the COVID-19 shock waves and stabilizing the economy.
The government's 2021–22 financial results show a marked improvement compared to the peak of the COVID-19 crisis reached in 2020–21, and the unprecedented level of temporary COVID-19 response measures at the time. During 2021–22, the federal government wound down its major emergency COVID-19 programs, including the CEWS and CEBA, pivoting to more limited and targeted measures, such as the Tourism and Hospitality Recovery Program and the Hardest-Hit Business Recovery Program.
The fiscal impact of the Economic Response Plan (ERP) on the government's 2021–22 financial results is estimated at over $70 billion, the vast majority of which represents increased transfers to individuals, businesses, and provinces and territories. Some of the more significant ERP measures affecting the 2021–22 financial results include:
- $22.3 billion in assistance under the CEWS;
- $16.5 billion under the Canada Recovery Benefit, Canada Recovery Sickness Benefit, Canada Recovery Caregiving Benefit, and the Canada Worker Lockdown Benefit;
- $6.2 billion in expenses primarily associated with the distribution of vaccines, rapid test kits, therapeutics, and personal protective equipment to the provinces and territories;
- $3.7 billion under the Canada Emergency Rent Subsidy;
- $2.7 billion under the Tourism and Hospitality Recovery Program and the Hardest-Hit Business Recovery Program; and,
- $2.0 billion in transfers to provinces and territories to reduce the backlogs of surgeries and procedures.
Additional details regarding the impact of the ERP on the government’s financial results for 2021–22 are presented in the following sections of this report.
The Budgetary Balance
The government posted a budgetary deficit of $90.2 billion in 2021–22, compared to a deficit of $327.7 billion in 2020–21.
The annual deficit before net actuarial losses represents the difference between the government’s revenues and expenses excluding net actuarial losses. By excluding the impact of changes in the value of the government’s obligations and assets for public sector pensions and other employee and veteran future benefits recorded in previous fiscal years, this measure is intended to present a clearer picture of the results of government operations during the current fiscal year. The annual deficit before net actuarial losses stood at $80.0 billion for 2021–22, compared to $312.4 billion in 2020–21.
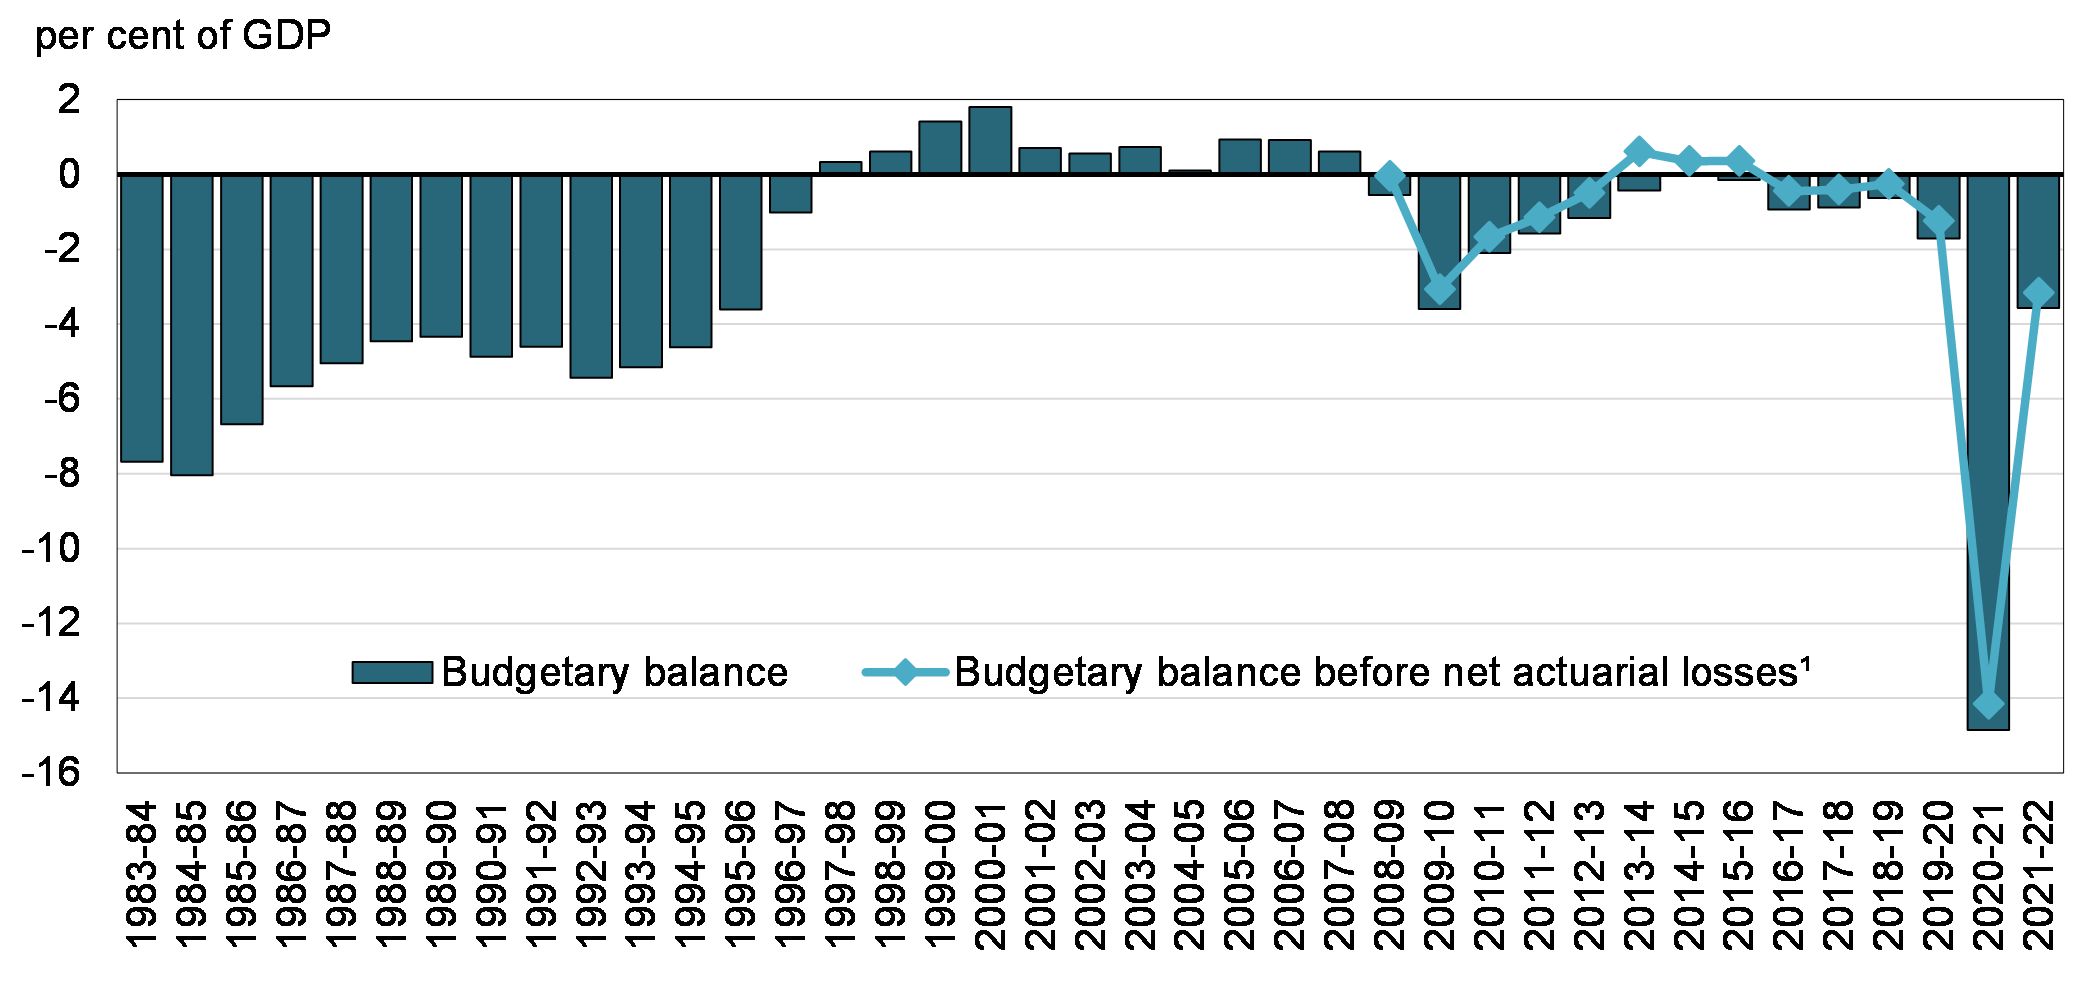
The following graph shows the government’s budgetary balance since 1983–84, as well as the budgetary balance before net actuarial losses since 2008–09. To enhance the comparability of results over time and across jurisdictions, the budgetary balance and its components are presented as a percentage of GDP. In 2021–22, the budgetary deficit was 3.6 per cent of GDP, compared to a deficit of 14.9 per cent of GDP in 2020–21. The budgetary deficit before net actuarial losses was 3.2 per cent of GDP, compared to a deficit of 14.2 per cent of GDP a year earlier.
Budgetary Balance
Revenues were up $96.8 billion, or 30.6 per cent, from the prior year, reflecting a broad-based increase in revenue as COVID-19 lockdowns eased, federal government measures under the ERP (e.g. the one-time GST credit) were reduced, and the general economic situation improved.
Total expenses were down $140.7 billion, or 21.8 per cent, from the prior year. Program expenses excluding net actuarial losses decreased by $139.7 billion, or 23.0 per cent, primarily reflecting lower transfers to individuals, businesses, and other levels of government under the ERP, including COVID-19 income support for workers, the CEWS, and transfers under the Safe Restart Agreement.
Net actuarial losses decreased by $5.1 billion, or 33.4 per cent, from the prior year, primarily reflecting the amortization of a decrease in the government’s obligations for pensions and other employee future benefits based on actuarial valuations prepared for the Public Accounts of Canada 2021. This decrease was mainly due to a year-over-year increase in the discount rates used in valuing these obligations.
Public debt charges increased by $4.1 billion, or 20.3 per cent, from the prior year, largely reflecting higher Consumer Price Index adjustments on Real Return Bonds, higher interest on the government's pension and other employee future benefit obligations, and an increased stock of interest-bearing debt.
Annual deficit before net actuarial losses
The line item “annual deficit before net actuarial losses” was introduced in the 2019–20 Consolidated Statement of Operations and Accumulated Deficit to improve the transparency of the government’s financial reporting.
Actuarial losses and gains arise from the annual re-measurement of the government’s existing obligations for public sector pensions and other employee and veteran future benefits, as well as differences between actual and expected returns on pension assets. The measurement of these obligations and expected returns on pension assets involves the extensive use of estimates and assumptions about future events and circumstances, such as discount rates, future inflation, returns on investments, general wage increases, workforce composition, retirement rates and mortality rates. In particular, the unfunded obligations are sensitive to changes in both short- and long-term interest rates, which are used to estimate the value of expected future benefit payments in today’s dollars. Unfunded benefit obligations are discounted based on the spot rates of Government of Canada bonds at fiscal year-end (March 31), which can fluctuate significantly from one year to the next, resulting in actuarial gains and losses that flow through the budgetary balance over time.
While these adjustments and revaluations are an important part of providing an accurate picture of the government’s Consolidated Statement of Financial Position at a given time, they can also result in large swings in the budgetary balance, which may impair the usefulness and understandability of the government’s consolidated financial statements and fiscal projections, including as a measurement of the short-term impact of government spending and taxation choices on the economy.
The annual deficit before net actuarial losses isolates the impact of adjustments and re-measurements of previously recorded public sector pensions and other employee and veteran future benefits and provides a clearer view of the government’s planned and actual operating activities in an accounting period, enhancing transparency and accountability.
Comparison of Actual Budgetary Outcomes to Projected Results
The $90.2-billion deficit recorded in 2021–22 was $23.6 billion lower than the $113.8-billion deficit projected in Budget 2022.
Overall, revenues were $18.9 billion, or 4.8 per cent, higher than forecast, primarily due to higher tax revenues driven by an economic recovery that exceeded expectations. Program expenses, excluding net actuarial losses, were $4.1 billion lower than expected, largely a result of lower-than-anticipated spending on COVID-19-related programs, including COVID-19 income supports for businesses, such as the Hardest-Hit Business Recovery Program, and COVID-19 income supports for workers. Public debt charges were $0.4 billion lower than projected, primarily due to a lower-than-expected stock of interest-bearing debt. Net actuarial losses were $0.2 billion lower than projected.
| Actual ($ billions) |
Budget 20221 ($ billions) |
Difference | ||
|---|---|---|---|---|
| ($ billions) | (per cent) | |||
| Revenues | ||||
| Income tax | ||||
Personal |
198.4 | 189.4 | 9.0 | 4.7 |
Corporate |
78.8 | 72.8 | 6.0 | 8.2 |
Non-resident |
10.8 | 10.3 | 0.5 | 4.8 |
Total |
288.0 | 272.5 | 15.5 | 5.7 |
| Other taxes and duties | ||||
Goods and Services Tax |
46.2 | 44.0 | 2.2 | 4.9 |
Energy taxes |
5.4 | 5.3 | 0.1 | 1.4 |
Customs import duties |
5.2 | 5.1 | 0.2 | 3.4 |
Other excise taxes and duties |
5.9 | 5.9 | 0.1 | 0.9 |
Total |
62.7 | 60.2 | 2.5 | 4.1 |
| Employment Insurance premiums | 23.9 | 23.8 | 0.1 | 0.3 |
| Proceeds from the pollution pricing framework | 6.3 | 6.7 | (0.3) | (4.7) |
| Other revenues | 32.4 | 31.2 | 1.2 | 3.8 |
| Total revenues | 413.3 | 394.4 | 18.9 | 4.8 |
| Program expenses | ||||
| Major transfers to persons | ||||
Elderly benefits |
60.8 | 61.0 | (0.2) | (0.3) |
Employment Insurance and support measures |
38.9 | 39.0 | (0.1) | (0.2) |
Children's benefits |
26.2 | 26.3 | (0.1) | (0.4) |
COVID-19 income support for workers |
15.6 | 17.7 | (2.1) | (12.0) |
Total |
141.5 | 144.0 | (2.5) | (1.7) |
| Major transfers to other levels of government | ||||
Support for health and other social programs |
60.6 | 60.6 | 0.0 | 0.0 |
Fiscal arrangements |
19.1 | 19.1 | 0.0 | 0.2 |
Canada-wide early learning and child care |
2.9 | 2.9 | 0.0 | 0.0 |
Canada Community-Building Fund |
2.3 | 2.3 | 0.1 | 2.2 |
Home care and mental health |
2.5 | 2.5 | 0.0 | 0.0 |
Other |
0.9 | 1.0 | (0.1) | (9.1) |
Total |
88.4 | 88.4 | 0.0 | 0.0 |
| Proceeds from the pollution pricing framework returned | 3.8 | 4.1 | (0.3) | (7.3) |
| Canada Emergency Wage Subsidy | 22.3 | 21.8 | 0.5 | 2.4 |
| Other direct program expenses | 212.8 | 214.7 | (1.9) | (0.9) |
| Total program expenses, excluding net actuarial losses | 468.8 | 473.0 | (4.1) | (0.9) |
| Public debt charges | 24.5 | 24.9 | (0.4) | (1.7) |
| Budgetary outcome/estimate before net actuarial losses | (80.0) | (103.5) | 23.4 | |
Net actuarial losses |
10.2 | 10.3 | (0.2) | (1.5) |
| Budgetary outcome/estimate | (90.2) | (113.8) | 23.6 | |
|
Note: Numbers may not add due to rounding. |
||||
Revenues
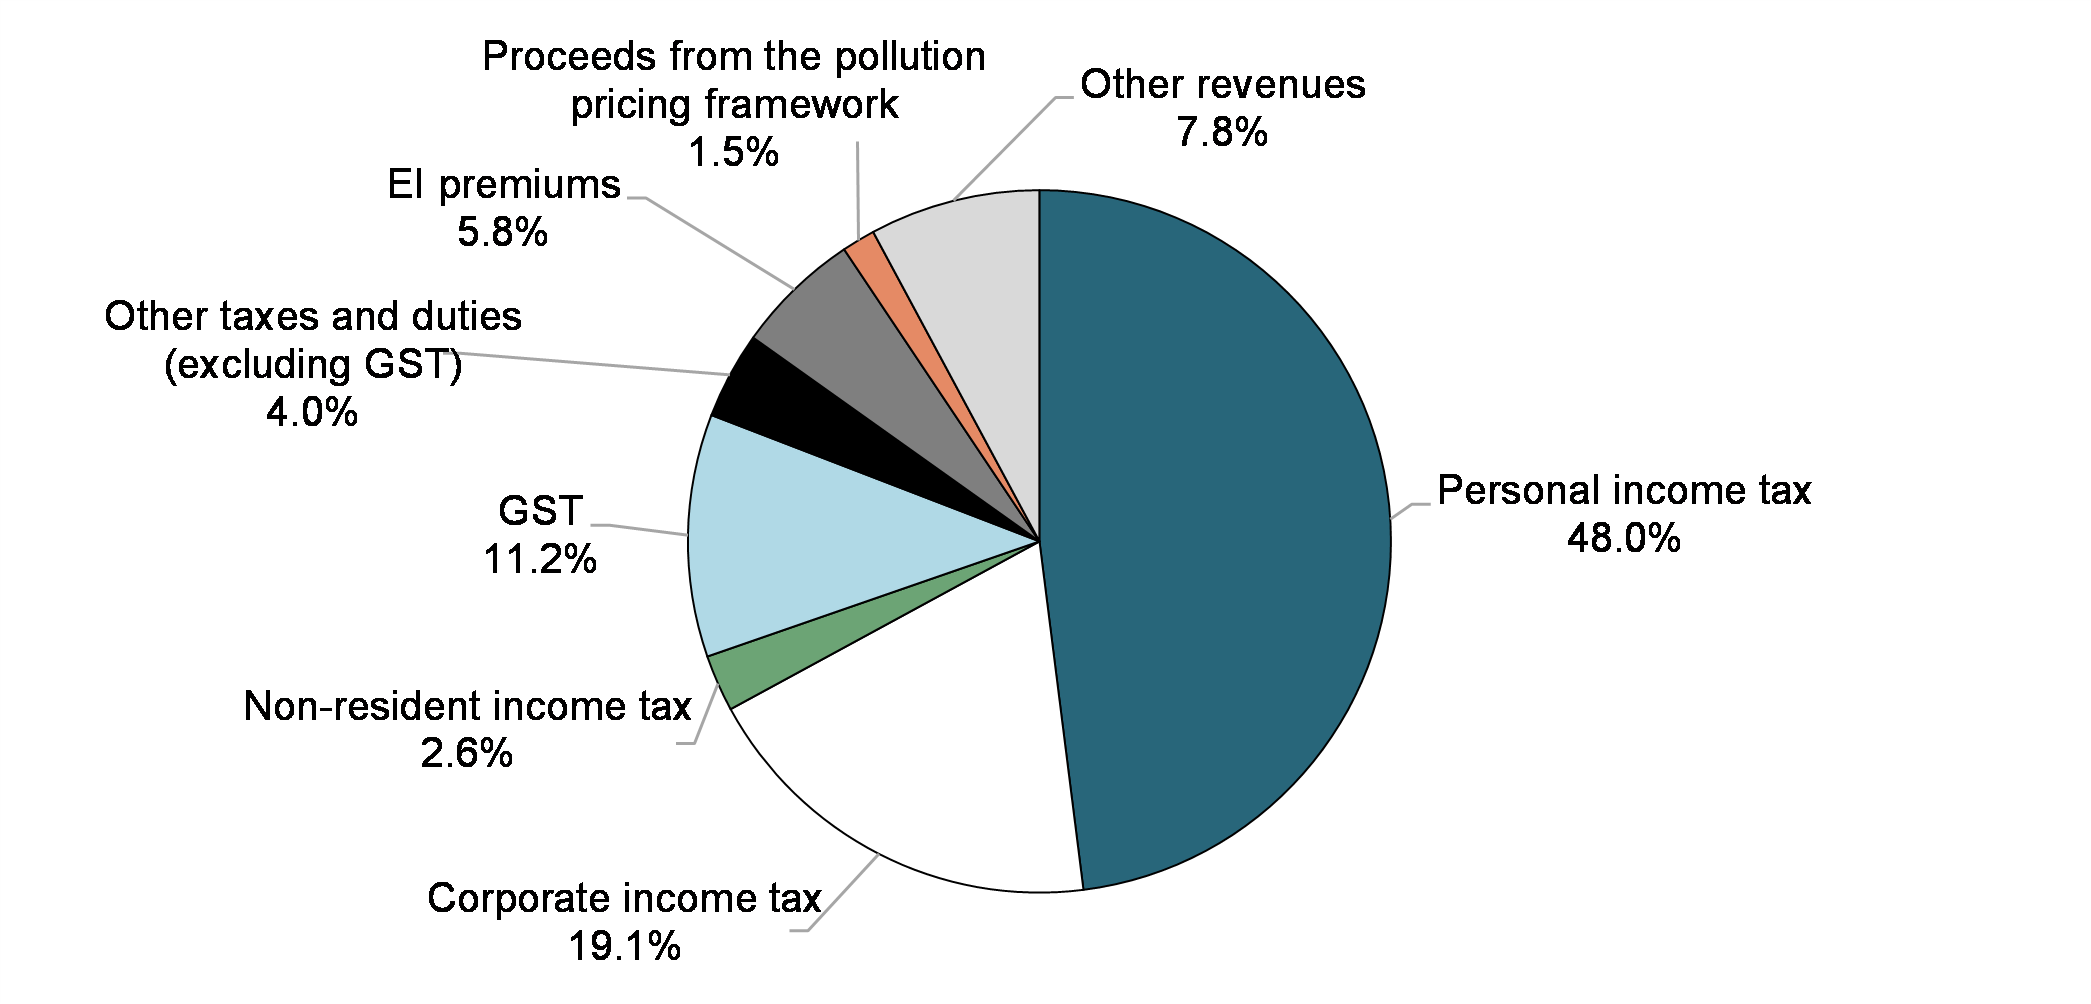
Federal revenues can be broken down into five main categories: income tax revenues, other taxes and duties, Employment Insurance (EI) premium revenues, proceeds from the pollution pricing framework, and other revenues.
Within the income tax category, personal income tax revenues are the largest source of federal revenues, and accounted for 48.0 per cent of total revenues in 2021–22 (down from 55.2 per cent in 2020–21). Corporate income tax revenues are the second largest source of revenues, and accounted for 19.1 per cent of total revenues in 2021–22 (up from 17.1 per cent in 2020–21). Non-resident income tax revenues are a comparatively smaller source of revenues, accounting for only 2.6 per cent of total revenues in 2021–22 (unchanged from 2020–21).
Other taxes and duties consist of revenues from the GST, energy taxes, customs import duties, and other excise taxes and duties. The largest component of this category—GST revenues—accounted for 11.2 per cent of all federal revenues in 2021–22 (up from 10.2 per cent in 2020–21). The share of the remaining components of other taxes and duties stood at 4.0 per cent of total federal revenues (down from 4.6 per cent in 2020–21).
EI premium revenues accounted for 5.8 per cent of total federal revenues in 2021–22 (down from 7.1 per cent in 2020–21).
Proceeds from the federal carbon pollution pricing framework accounted for 1.5 per cent of total federal revenues in 2021–22 (up from 1.4 per cent in 2020–21). All direct proceeds from the federal carbon pollution pricing system are returned to the jurisdictions where they were collected, as required under the Greenhouse Gas Pollution Pricing Act.
Other revenues are made up of three broad components: net income from enterprise Crown corporations and other government business enterprises; other program revenues from returns on investments, proceeds from the sales of goods and services, and other miscellaneous revenues; and foreign exchange revenues. Other revenues accounted for 7.8 per cent of total federal revenues in 2021–22 (up from 1.8 per cent in 2020–21).
Composition of Revenues for 2021–22 (Total: $413.3 billion)
Revenues Compared to 2020–21
Total revenues amounted to $413.3 billion in 2021–22, up $96.8 billion, or 30.6 per cent, from 2020–21. The following table compares revenues for 2021–22 to 2020–21.
| 2021–22 ($ millions) |
2020–21 ($ millions) |
Net change | ||
|---|---|---|---|---|
| ($ millions) | (per cent) | |||
| Tax revenues | ||||
| Income tax | ||||
Personal |
198,385 | 174,755 | 23,630 | 13.5 |
Corporate |
78,815 | 54,112 | 24,703 | 45.7 |
Non-resident |
10,789 | 8,107 | 2,682 | 33.1 |
Total |
287,989 | 236,974 | 51,015 | 21.5 |
| Other taxes and duties | ||||
Goods and Services Tax |
46,165 | 32,415 | 13,750 | 42.4 |
Energy taxes |
5,355 | 4,894 | 461 | 9.4 |
Customs import duties |
5,237 | 4,254 | 983 | 23.1 |
Other excise taxes and duties |
5,923 | 5,391 | 532 | 9.9 |
Total |
62,680 | 46,954 | 15,726 | 33.5 |
| Total tax revenues | 350,669 | 283,928 | 66,741 | 23.5 |
| Employment Insurance premiums | 23,856 | 22,392 | 1,464 | 6.5 |
| Proceeds from the pollution pricing framework | 6,341 | 4,380 | 1,961 | 44.8 |
| Other revenues | 32,411 | 5,746 | 26,665 | 464.1 |
| Total revenues | 413,277 | 316,446 | 96,831 | 30.6 |
- Personal income tax revenues increased by $23.6 billion in 2021–22, or 13.5 per cent, reflecting strong post‑pandemic performance in the labour market, with very strong labour force participation and employment, as well as robust investment income due to growth in corporate profits and the price of real estate.
- Corporate income tax revenues increased by $24.7 billion, or 45.7 per cent, reflecting strong growth in corporate profits.
- Non-resident income tax revenues are paid by non-residents on Canadian-sourced income. These revenues increased by $2.7 billion, or 33.1 per cent, reflecting strong corporate earnings.
- Other taxes and duties increased by $15.7 billion, or 33.5 per cent. GST revenues increased by $13.8 billion in 2021–22, or 42.4 per cent, driven by current-year consumer spending on goods and services and a more broad-based recovery from last year’s lockdowns. The year-over-year increase also reflects the one-time low-income credit provided in 2020–21 to support households experiencing financial hardship resulting from the COVID-19 pandemic, which reduced revenues in that year. Energy taxes increased by $0.5 billion, or 9.4 per cent, driven by a rebound in motive fuel consumption. Customs import duties increased by $1.0 billion, or 23.1 per cent, as imports recovered following their decline in 2020 due to the COVID-19 pandemic. Other excise taxes and duties were up $0.5 billion, or 9.9 per cent, driven primarily by a significant rebound in revenues from the Air Travellers Security Charge.
- EI premium revenues increased by $1.5 billion, or 6.5 per cent, reflecting improving labour market conditions.
- Proceeds from the federal carbon pollution pricing framework increased by $2.0 billion, or 44.8 per cent, reflecting a higher carbon pollution price of $40 per tonne in 2021–22 versus $30 per tonne in the year prior.
- Other revenues increased by $26.7 billion, or 464.1 per cent, largely reflecting changes in premiums paid and interest earned by the Bank of Canada on pandemic-related purchases of Government of Canada securities on the secondary market, as well as higher profits reported by other enterprise Crown corporations given broad improvements in the economy. Interest and penalty revenue also contributed to growth in other revenues in 2021–22, as COVID-19 response measures, such as waivers on tax owing, no longer played a role.
Accounting for the Bank of Canada’s purchases of Government of Canada bonds
In response to COVID-19, the Bank of Canada introduced several new facilities and operations to support liquidity and the proper functioning of core funding markets, and to provide monetary stimulus. With core markets functioning normally and the economy reopening, these facilities have been discontinued. One of these facilities, the Government of Canada Bond Purchase Program, which operated from April 2020 to April 2022, involved the purchase of Government of Canada nominal and real return bonds in the secondary market.
The Bank of Canada, as an enterprise Crown corporation, is part of the government reporting entity and is included as part of the government’s consolidated financial statements. As a result, the purchase of Government of Canada bonds by the Bank on financial markets is accounted for similar to the government’s own repurchase and retirement of its debt. That is, a gain or loss, equal to the difference between the carrying value of the debt in the accounts of the government and the price paid by the Bank to acquire the bond is recognized in the government’s consolidated financial statements at the date of the Bank’s purchase. For 2021–22, the government recorded net losses totalling $1 billion ($19 billion in 2020–21) in respect of the Bank’s purchases of Government of Canada bonds. This net loss is recorded as part of other revenues on the Condensed Consolidated Statement of Operations and Accumulated Deficit.
This accounting treatment is referred to as a constructive debt retirement. The debt retirement is "constructive" because the debt remains outstanding from the viewpoint of the government and remains an investment from the point of view of the Bank. Similarly, the related interest on the bonds paid by the government to the Bank is reflected as part of public debt charges (expense) and as part the annual profits of the Bank (revenue) included in other revenues.
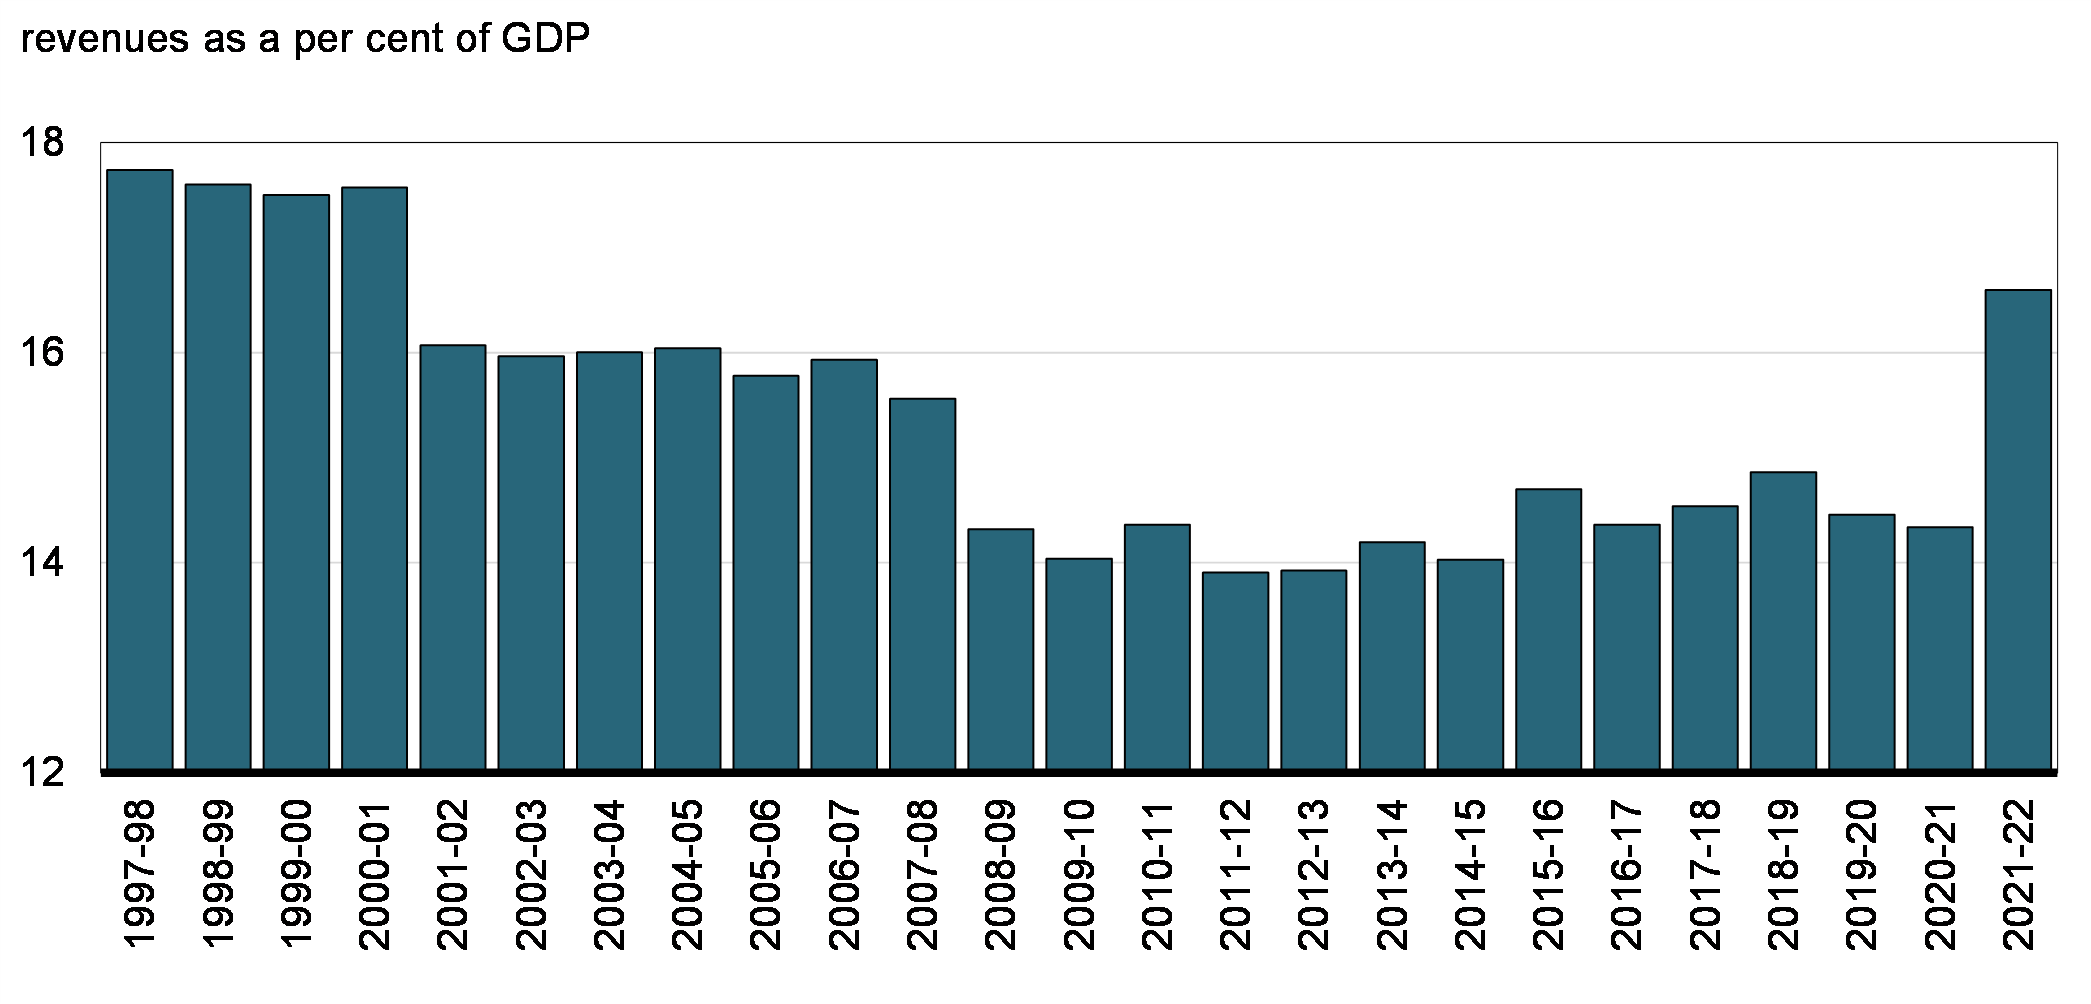
The revenue ratio—revenues as a percentage of GDP—compares the total of all federal revenues to the size of the economy. This ratio is influenced by changes in statutory tax rates and by economic developments. The ratio stood at 16.6 per cent in 2021–22 (up from 14.3 per cent in 2020–21), supported by strength in income tax revenues and enterprise Crown corporation profits, as well as reflecting the above-mentioned impact of the Bank of Canada’s purchases of Government of Canada bonds.
Revenue Ratio
Expenses
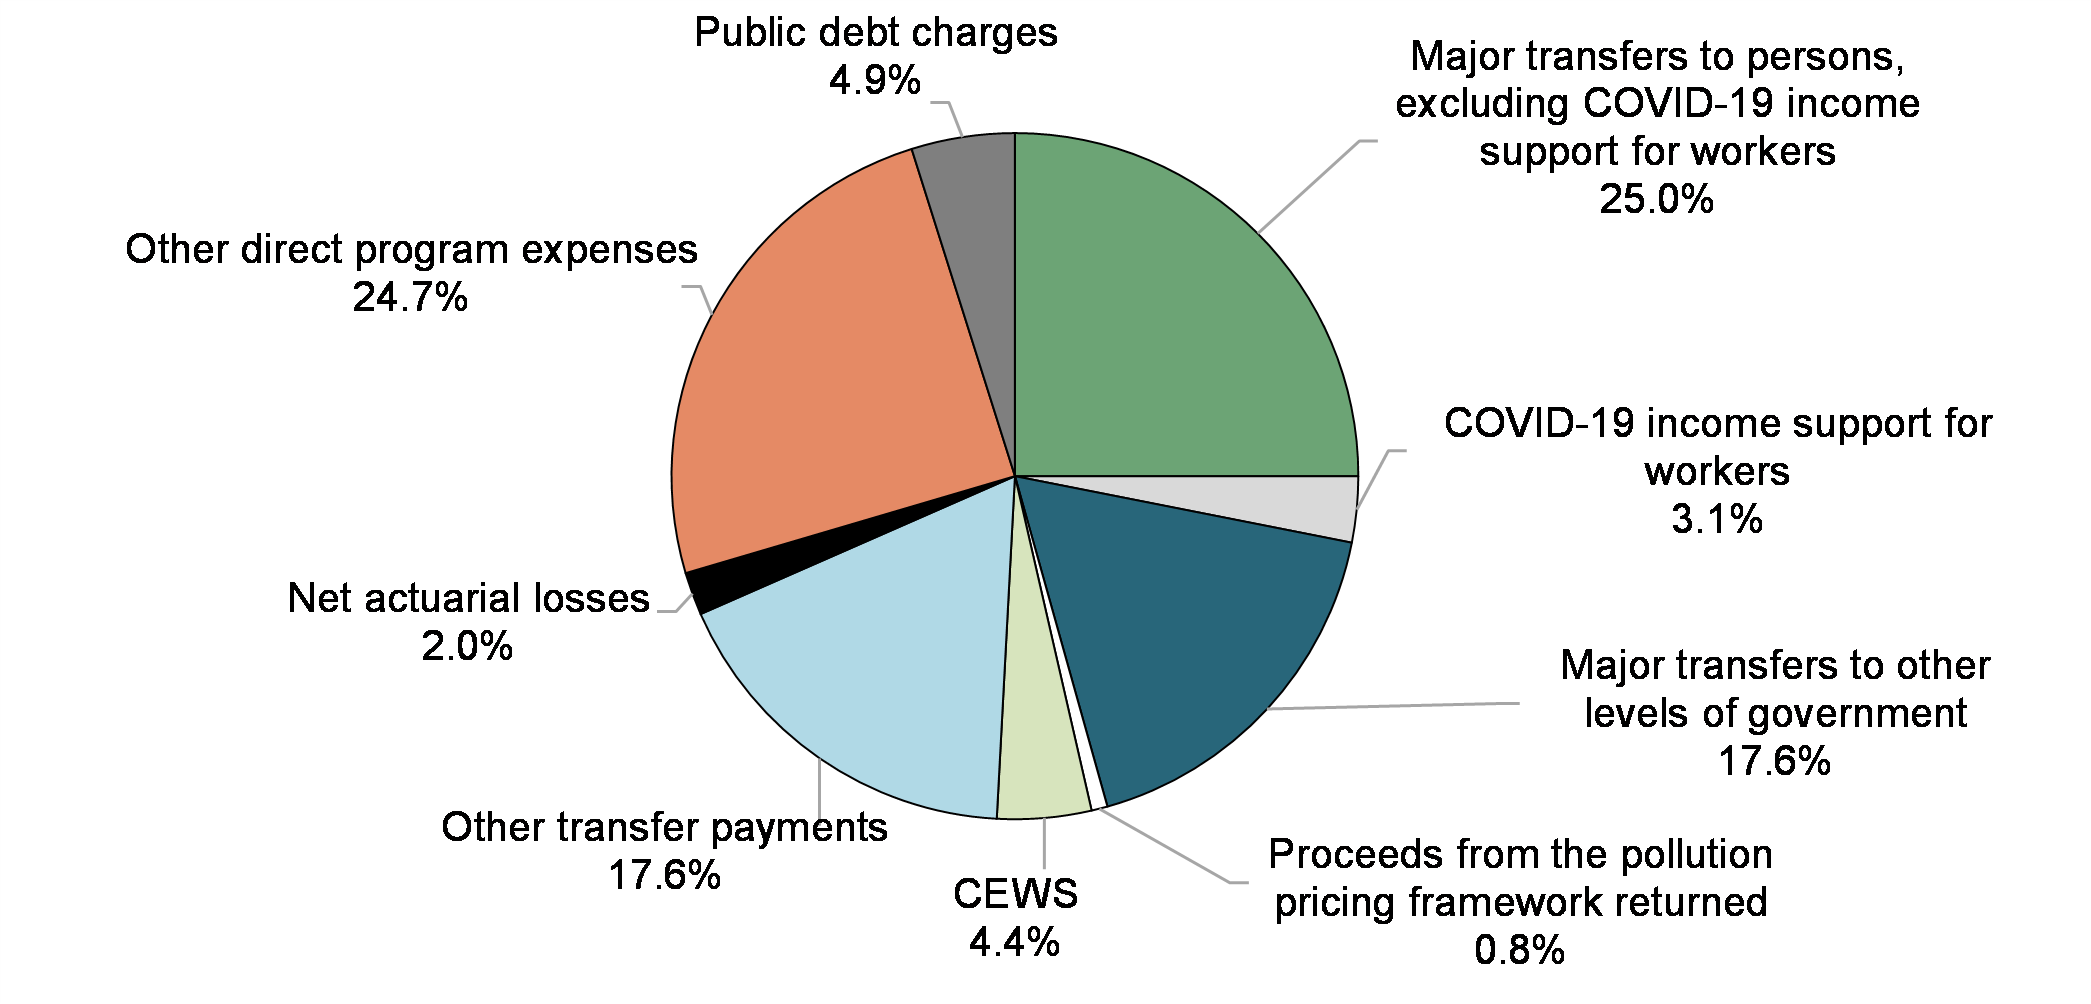
Federal expenses can be broken down into four main categories: transfer payments, which account for the majority of all federal spending, other direct program expenses, public debt charges, and net actuarial losses.
Transfer payments are classified under five categories:
- Major transfers to persons made up 28.1 per cent of total expenses (down from 31.1 per cent in 2020–21). This category consists of elderly, EI and support measures, children’s benefits, and COVID-19 income support for workers (the Canada Emergency Response Benefit, or CERB, the Canada Recovery Benefit, the Canada Recovery Sickness Benefit, the Canada Recovery Caregiving Benefit, and the Canada Worker Lockdown Benefit) introduced under Canada’s COVID-19 Economic Response Plan. Of this, COVID-19 income support for workers accounted for 3.1 per cent of total expenses (down from 12.5 per cent in 2020–21, including CERB benefits processed through the EI Operating Account).
- Major transfers to other levels of government—which include the Canada Health Transfer, the Canada Social Transfer, Canada-wide early learning and child care, home care and mental health transfers, fiscal arrangements (Equalization, transfers to the territories, a number of smaller transfer programs and the Quebec Abatement), and the Canada Community-Building Fund (previously the Gas Tax Fund) transfers—made up 17.6 per cent of total expenses in 2021–22 (up from 16.6 per cent in 2020–21).
- Proceeds from the federal carbon pollution pricing framework returned made up 0.8 per cent of expenses (up slightly from 0.7 per cent in 2020–21). These transfers consist of payments to return all direct proceeds from the federal carbon pollution pricing system to the jurisdictions where they were collected, as required under the Greenhouse Gas Pollution Pricing Act. For more information on the return of proceeds, please consult the Greenhouse Gas Pollution Pricing Act Annual Report to Parliament.
- The CEWS, which provides payments to eligible employers as part of the Economic Response Plan, made up 4.4 per cent of total expenses in 2021–22 (down from 12.4 per cent in 2020–21).
- Other transfer payments, which include transfers to Indigenous peoples, assistance to farmers, students and businesses, support for research and development, and international assistance, made up 17.6 per cent of expenses (up from 15.2 per cent in 2020–21).
Other direct program expenses, which represent the operating expenses of the government’s 133 departments, agencies, and consolidated Crown corporations and other entities, accounted for 24.7 per cent of total expenses in 2021–22. This was up from 18.5 per cent in 2020–21, reflecting much higher transfer payments as a share of spending in the previous year as part of Canada’s COVID-19 Economic Response Plan.
Public debt charges made up 4.9 per cent of total expenses in 2021–22 (up from 3.2 per cent in 2020–21).
Net actuarial losses made up the remaining 2.0 per cent of total expenses in 2021–22, down from 2.4 per cent in 2020–21.
Composition of Expenses for 2021–22 (Total: $503.5 billion)
Expenses Compared to 2020–21
Total expenses amounted to $503.5 billion in 2021–22, down $140.7 billion, or 21.8 per cent, from 2020–21. The following table compares total expenses for 2021–22 to 2020–21.
| 2021–22 ($ millions) |
2020–21 ($ millions) |
Net change | ||
|---|---|---|---|---|
| ($ millions) | (per cent) | |||
| Major transfers to persons | ||||
| Elderly benefits | 60,774 | 58,529 | 2,245 | 3.8 |
| Employment Insurance and support measures | 38,923 | 58,356 | (19,433) | (33.3) |
| Children’s benefits | 26,226 | 27,370 | (1,144) | (4.2) |
| COVID-19 income support for workers | 15,582 | 55,832 | (40,250) | (72.1) |
| Total | 141,505 | 200,087 | (58,582) | (29.3) |
| Major transfers to other levels of government | ||||
| Federal transfer support for health and other social programs | 60,607 | 60,903 | (296) | (0.5) |
| Fiscal arrangements and other transfers | 27,779 | 45,750 | (17,971) | (39.3) |
| Total | 88,386 | 106,653 | (18,267) | (17.1) |
| Proceeds from the pollution pricing framework returned | 3,814 | 4,566 | (752) | (16.5) |
| Direct program expenses | ||||
| Canada Emergency Wage Subsidy | 22,291 | 80,166 | (57,875) | (72.2) |
| Other transfer payments | 88,478 | 97,961 | (9,483) | (9.7) |
| Operating expenses | 124,342 | 119,089 | 5,253 | 4.4 |
| Total direct program expenses | 235,111 | 297,216 | (62,105) | (20.9) |
| Total program expenses, excluding net actuarial losses | 468,816 | 608,522 | (139,706) | (23.0) |
| Public debt charges | 24,487 | 20,358 | 4,129 | 20.3 |
| Total expenses, excluding net actuarial losses | 493,303 | 628,880 | (135,577) | (21.6) |
| Net actuarial losses | 10,186 | 15,295 | (5,109) | (33.4) |
| Total expenses | 503,489 | 644,175 | (140,686) | (21.8) |
- Major transfers to persons decreased by $58.6 billion in 2021–22, largely due to lower spending on COVID-19 income support for workers, which decreased $40.3 billion, or 72.1 per cent, as the recovery from the pandemic strengthened and many of these temporary programs ended. Elderly benefits increased by $2.2 billion, or 3.8 per cent, reflecting growth in the number of recipients and changes in consumer prices, to which benefits are fully indexed. EI benefits and support measures decreased by $19.4 billion, or 33.3 per cent, reflecting recovering labour markets following the early pandemic. In 2020–21, this category also included $24.6 billion in EI Emergency Response Benefits (CERB benefits processed through the EI Operating Account), for which the EI Operating Account was reimbursed through funding from the government. Children’s benefits decreased by $1.1 billion, or 4.2 per cent, primarily reflecting the May 2020 Canada Child Benefit top-up payment, which was partly offset by the temporary support for children under six provided in 2021–22.
- Major transfers to other levels of government decreased by $18.3 billion in 2021–22, primarily reflecting the end of one-time COVID-19 funding provided in 2020–21, including the Safe Restart Agreement, a top-up of the Canada Health Transfer to help health care systems recover, the COVID-19 Essential Workers Support Fund, and the Safe Return to Class Fund. These decreases were partially offset by $2.9 billion for Canada-wide early learning and child care; $2.2 billion in legislated growth under the Canada Health Transfer, the Canada Social Transfer, Equalization transfers and Territorial Formula Financing; a one-time $2.0-billion top-up to the Canada Health Transfer to address the backlog of surgeries and procedures; and, an increase of $1.2 billion to the Home and Community Care and Mental Health and Addictions Services Funding Agreement with provinces and territories, which includes the $1.0-billion Safe Long-term Care Fund.
- Proceeds from the federal carbon pollution pricing framework returned decreased by $0.8 billion, or 16.5 per cent, largely reflecting the change in the delivery of the Climate Action Incentive, from annually on personal income tax returns to a quarterly benefit, with the first quarterly benefit delivered in July 2022. The change from annual to quarterly payments delivers Climate Action Incentive payments on a more regular basis. This change results in a reduction in expenses in 2021–22, strictly owing to accounting differences in the treatment of payments delivered through the benefit system, compared to the personal income tax return approach used previously.
- Direct program expenses decreased by $62.1 billion in 2021–22, or 20.9 per cent:
- The Canada Emergency Wage Subsidy decreased by $57.9 billion, or 72.2 per cent, in 2021–22, reflecting declines in the number of eligible employees and the average subsidy per employee during the first half of 2021–22, and the wind-down of the program in October 2021.
- Other transfer payments decreased by $9.5 billion, or 9.7 per cent, in 2021–22, in large part reflecting the wind-down of the CEBA program in early 2021–22, offset in part by provisions recorded for disaster assistance for flooding, wildfires, and storms in British Columbia.
- Operating expenses of departments, agencies, and consolidated Crown corporations and other entities increased by $5.3 billion, or 4.4 per cent, in large part reflecting the distribution of vaccines and rapid tests to provinces and territories in response to the COVID-19 pandemic and increased personnel costs, offset in part by lower growth in provisions for contingent liabilities.
- Public debt charges increased by $4.1 billion, or 20.3 per cent, reflecting higher Consumer Price Index adjustments on Real Return Bonds, higher interest on the government’s pension and other employee future benefit obligations, and an increased stock of interest-bearing debt.
- Net actuarial losses, which reflect changes in the value of the government’s obligations and assets for public sector pensions and other employee and veteran future benefits recorded in previous fiscal years, decreased $5.1 billion, or 33.4 per cent, primarily due to the amortization of a decrease in the government’s obligations for pensions and other employee future benefits based on actuarial valuations prepared for the Public Accounts of Canada 2021. This decrease mainly reflected higher prevailing interest rates at the end of March 2021 used in valuing these obligations.
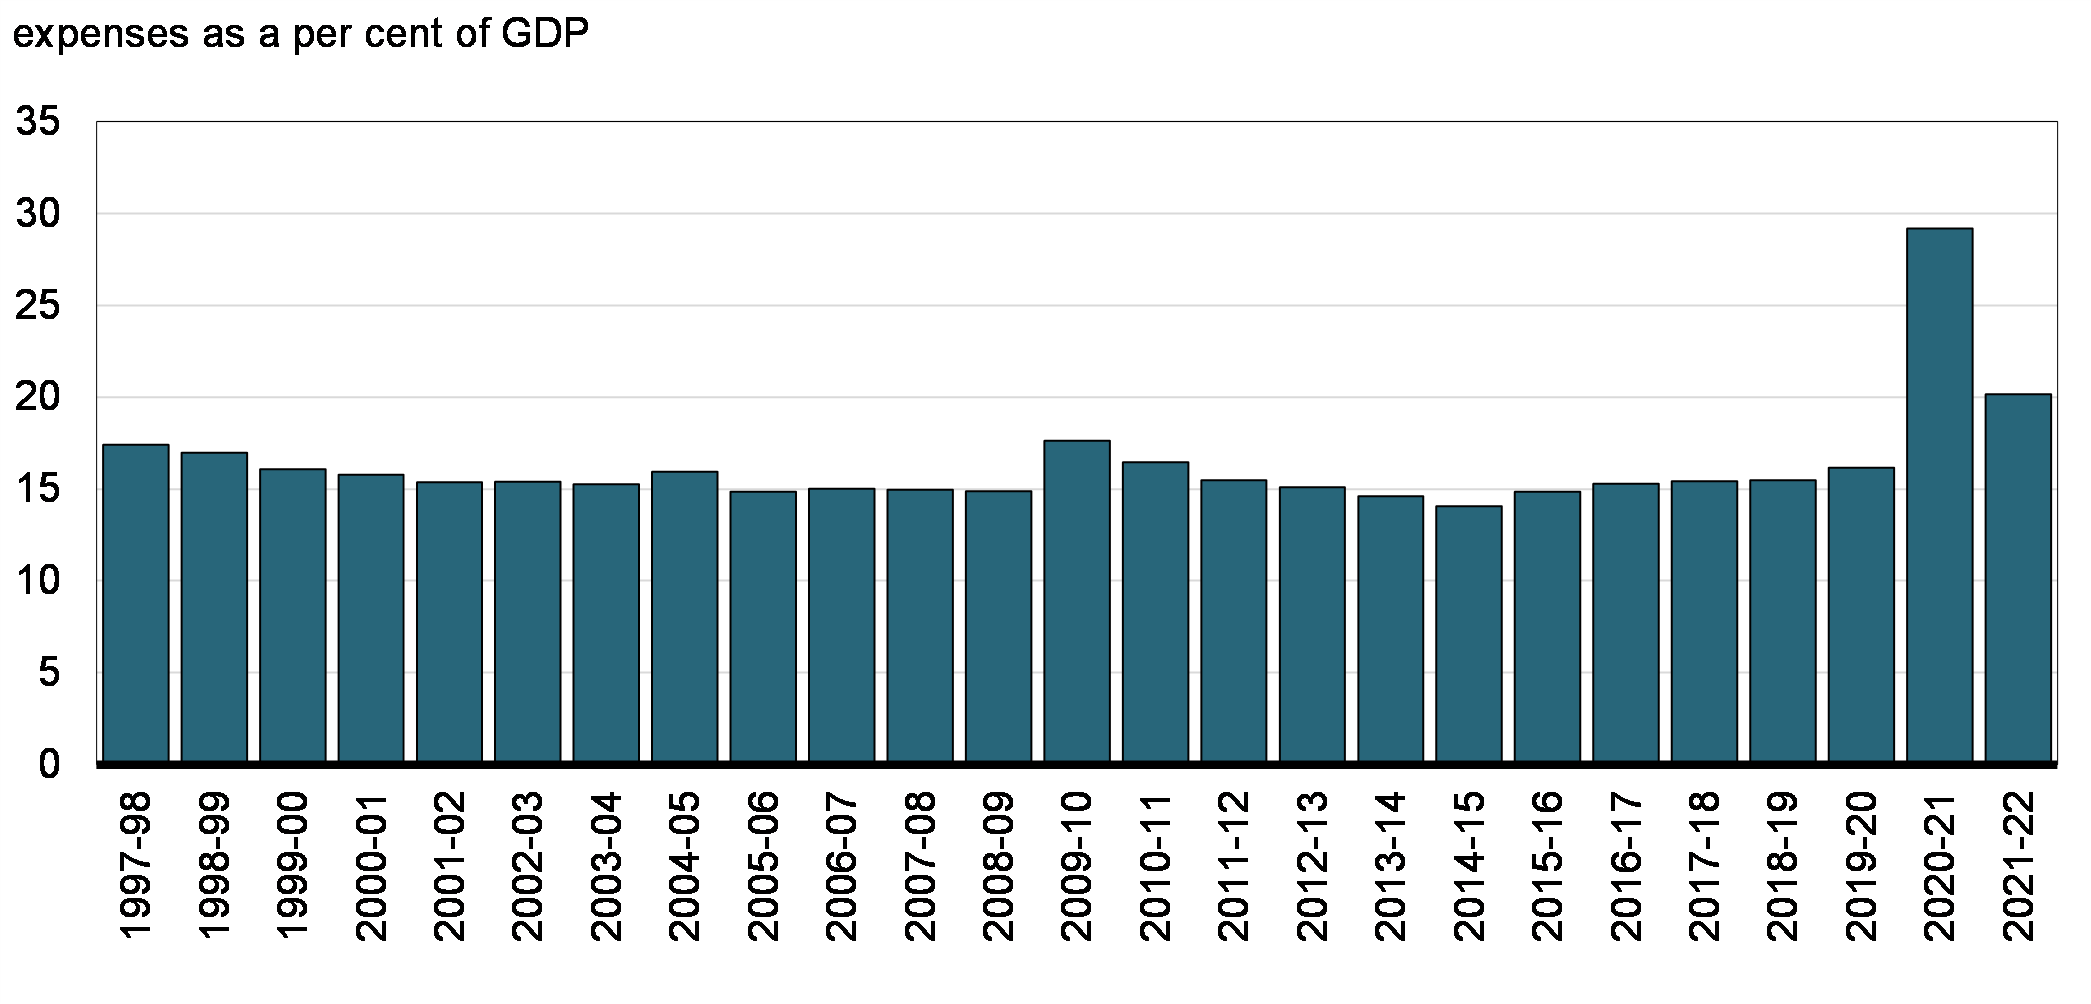
The expense ratio—expenses as a percentage of GDP—compares the total of all federal expenses to the size of the economy. This ratio is influenced by policy actions, economic developments, and changes in interest rates. The ratio stood at 20.2 per cent in 2021–22 (down from 29.2 per cent in 2020–21), largely reflecting temporary COVID-19 response measures 2020–21.
Expense Ratio
Federal Debt
The federal debt (accumulated deficit) is the difference between the government’s total liabilities and its total assets. With total liabilities of $1.8 trillion, financial assets of $600.3 billion and non-financial assets of $103.9 billion, the federal debt stood at $1,134.5 billion at March 31, 2022, up $85.7 billion from March 31, 2021.
The $85.7-billion increase in the federal debt reflects the 2021–22 budgetary deficit of $90.2 billion and $4.5 billion in other comprehensive income.
| 2021–22 | 2020–21 | Net change | |
|---|---|---|---|
| Federal debt at beginning of year | (1,048,746) | (721,360) | (327,386) |
| Annual deficit | (90,212) | (327,729) | 237,517 |
| Other comprehensive income | 4,465 | 343 | 4,122 |
| Federal debt at end of year | (1,134,493) | (1,048,746) | (85,747) |
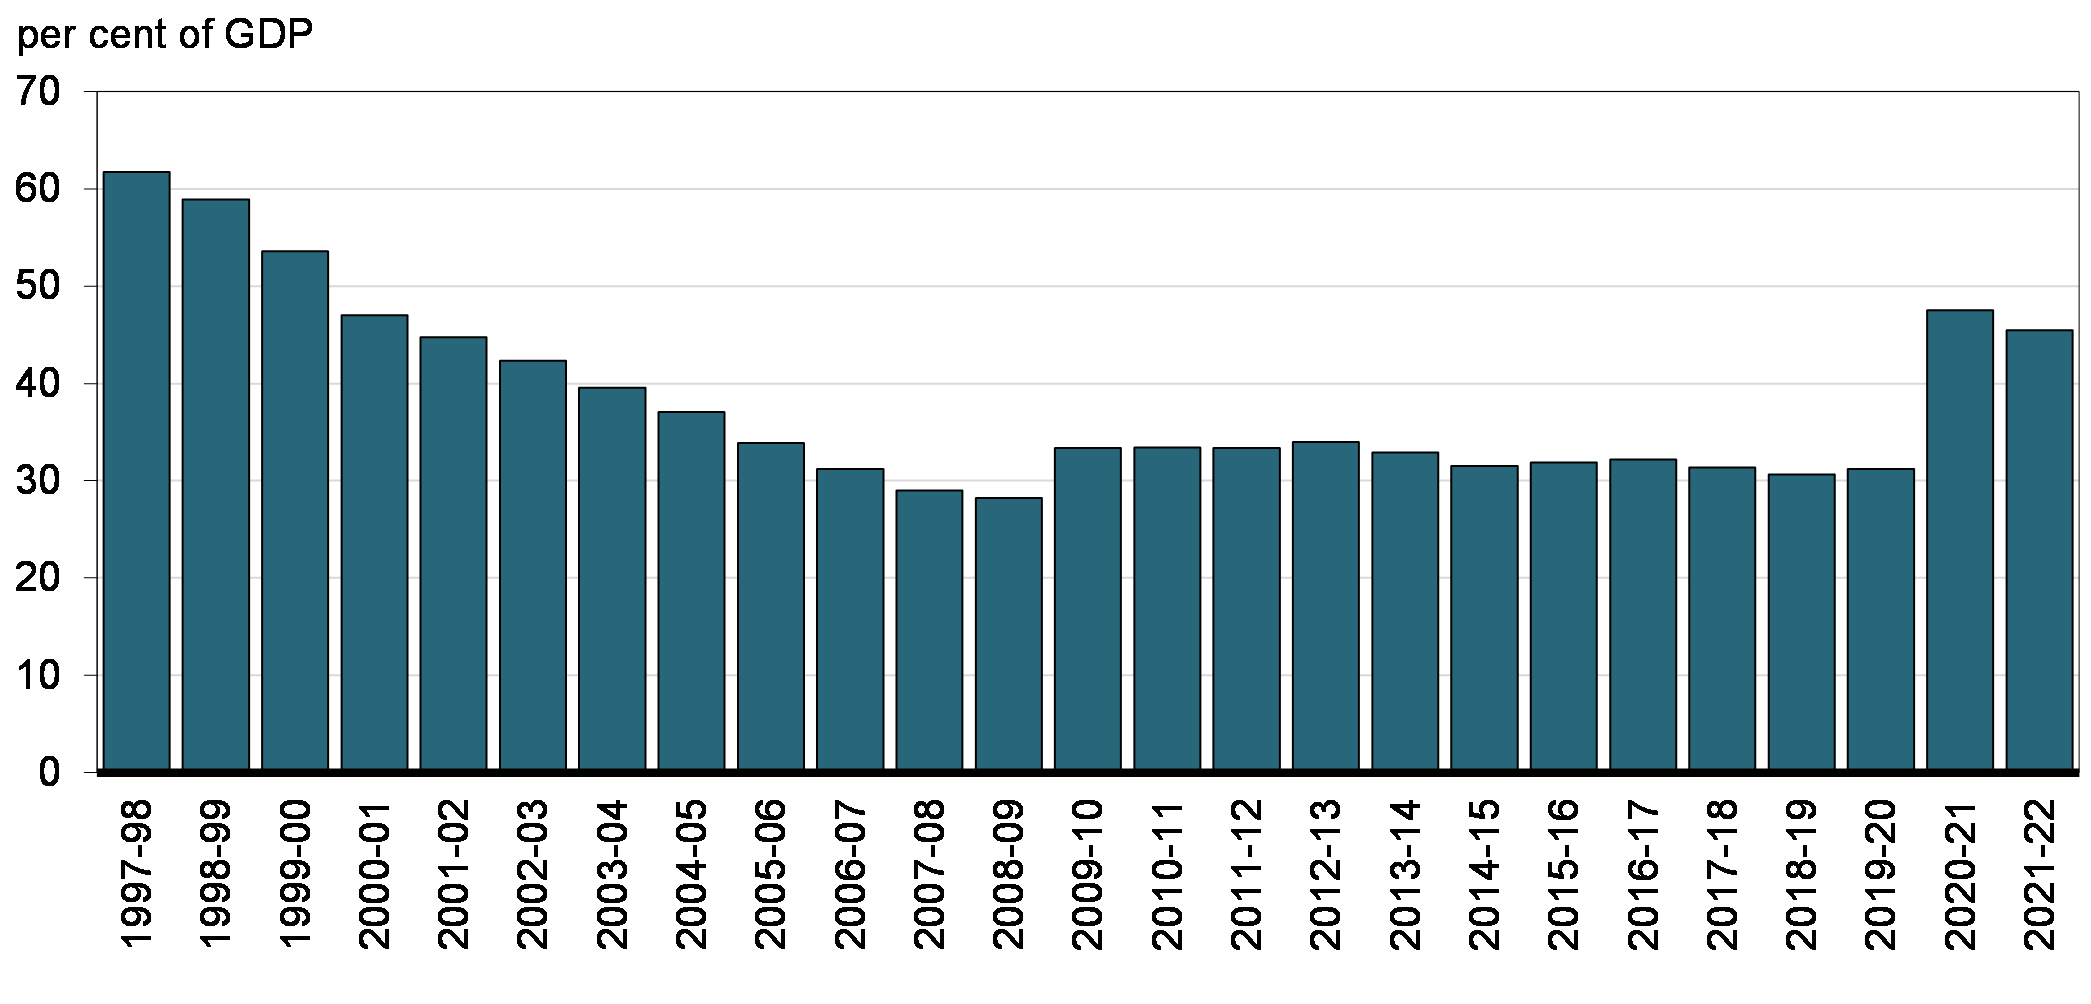
The following chart shows the federal debt since 1997–98. The federal debt stood at 45.5 per cent of GDP in 2021–22, down from 47.5 per cent in 2020–21. As its key fiscal anchor, the government is committed to reducing the accumulated deficit-to-GDP ratio over the medium term.
Federal Debt (Accumulated Deficit)
| 2021–22 | 2020–21 | |
|---|---|---|
| Liabilities | ||
| Accounts payable and accrued liabilities | 260.3 | 207.4 |
| Interest-bearing debt | ||
Unmatured debt |
1,243.3 | 1,125.2 |
Pensions and other employee future benefits |
327.4 | 312.9 |
Other liabilities |
7.7 | 6.7 |
Total interest-bearing debt |
1,578.4 | 1,444.8 |
| Total liabilities | 1,838.7 | 1,652.2 |
| Financial assets | ||
| Cash and other accounts receivable | 112.4 | 82.2 |
| Taxes receivable | 167.6 | 142.0 |
| Foreign exchange accounts | 104.0 | 92.6 |
| Loans, investments and advances | 207.0 | 179.3 |
| Public sector pension assets | 9.2 | 6.3 |
| Total financial assets | 600.3 | 502.4 |
| Net debt | (1,238.4) | (1,149.8) |
| Non-financial assets | ||
| Tangible capital assets | 91.9 | 87.6 |
| Inventories | 9.0 | 9.8 |
| Prepaid expenses | 3.0 | 3.7 |
| Total non-financial assets | 103.9 | 101.1 |
| Federal debt (accumulated deficit) | (1,134.5) | (1,048.7) |
|
Note: Numbers may not add due to rounding. |
||
Assets
The government’s assets consist of financial assets (cash and other accounts receivable, taxes receivable, foreign exchange accounts, loans, investments and advances, and public sector pension assets) and non-financial assets (tangible capital assets, inventories, and prepaid expenses).
At March 31, 2022, financial assets amounted to $600.3 billion, up $97.9 billion from March 31, 2021. The increase reflects growth across all major categories of financial assets.
- At March 31, 2022, cash and accounts receivable totalled $280.0 billion, up $55.8 billion from March 31, 2021. Within this component, cash and cash equivalents increased by $36.7 billion. The balance of cash and cash equivalents includes $20 billion that has been designated as a deposit held with respect to prudential liquidity management. Other accounts receivable decreased by $6.5 billion, largely reflecting the receipt during 2021–22 of dividends receivable from Export Development Canada and Canada Mortgage and Housing Corporation at March 31, 2021, offset in part by increased COVID benefit overpayments receivable at March 31, 2022 as a result of redeterminations.
- Taxes receivable increased by $25.6 billion during 2021–22 to $167.6 billion, largely reflecting growth in tax revenues.
- Loans, investments and advances increased by $27.8 billion in 2021–22.
- Loans, investments and advances in enterprise Crown corporations and other government business enterprises increased by $23.7 billion in 2021–22. Investments in enterprise Crown corporations and other government business enterprises increased $10.4 billion, largely reflecting $11.5 billion in net profits and $4.5 billion in other comprehensive income recorded by these entities during 2021–22, offset in part by $6.0 billion in dividends paid to the government. Net loans and advances to enterprise Crown corporations and other government business enterprises were up $13.3 billion. This growth primarily reflects a $7.2-billion increase in loans to Crown corporations under the consolidated borrowing framework to finance the operational needs of Canada Mortgage and Housing Corporation, Business Development Bank of Canada and Farm Credit Canada, and $6.3 billion in financing to the Canada Development Investment Corporation from the Canada Account to finance construction activities for the Trans Mountain expansion project. In February 2022, the government announced that future funding for the Trans Mountain expansion project would be sourced from third-party financing. In April 2022, Trans Mountain Corporation entered into a $10-billion loan facility with a syndicate of lenders, with a guarantee provided by the government.
- Other loans, investments and advances increased by $4.0 billion, from $59.3 billion to $63.3 billion, in large part reflecting an increase in loans and investments under the Large Employer Emergency Funding Facility, a liquidity assistance program for large Canadian employers affected by the COVID-19 pandemic.
- Public sector pension assets increased by $2.9 billion, largely reflecting an increase in the net assets under the Public Service Pension Fund, which pertains to service accrued on or after April 1, 2000 that falls within the Income Tax Act limits under the Public Service Superannuation Act.
- Foreign exchange accounts increased by $11.4 billion in 2021–22, totalling $104.0 billion at March 31, 2022, due mainly to an increase in net advances to the Exchange Fund Account. There were 10,566 million Special Drawing Rights (SDRs) allocated by the IMF to Canada during the year, valued at $18.3 billion at March 31, 2022. SDRs represent both an asset (rights to purchase currencies of other countries participating in the IMF’s Special Drawing Rights Department) and a liability (obligation to make payments to the IMF) within the foreign exchange accounts.
At March 31, 2022, non-financial assets stood at $103.9 billion, up $2.8 billion from a year earlier. This growth primarily relates to a $4.3-billion increase in tangible capital assets, largely reflecting an increase in assets under construction and a net increase in ships and boats, offset in part by a $0.7-billion decrease in inventories, largely reflecting changes in the stock of personal protective equipment, and a $0.8-billion decrease in prepaid expenses primarily reflecting a lower balance of advance payments at year-end for vaccines.
Liabilities
The government’s liabilities consist of accounts payable and accrued liabilities and interest-bearing debt.
At March 31, 2022, accounts payable and accrued liabilities totalled $260.3 billion, up $52.9 billion from March 31, 2021. This increase reflects growth across all categories.
- Amounts payable related to tax increased by $6.9 billion in 2021–22, from $71.5 billion at March 31, 2021, to $78.5 billion at March 31, 2022. This increase largely reflects higher accrued payables for individual income tax and higher refundable GST/HST credit returns.
- Provisions for contingent liabilities increased by $8.6 billion.
- Environmental liabilities and asset retirement obligations increased by $3.0 billion in 2021–22, reflecting revisions to previously estimated provisions, net of remediation activities undertaken in 2021–22.
- Deferred revenue increased by $8.5 billion in 2021–22, largely reflecting proceeds from the 3500 MHz band spectrum auction, which concluded July 2021.
- Liabilities for interest and matured debt increased by $0.4 billion from the prior year, reflecting accrued interest on a higher stock of debt at year-end and higher effective rates on marketable bonds.
- Other accounts payable and accrued liabilities increased by $25.4 billion in 2021–22. Within this component, liabilities under tax collection agreements increased by $16.1 billion, largely reflecting differences between estimated corporate income tax collected and actual payments made to provinces and territories, as well as timing differences in payments to provinces and territories. Accounts payable increased by $9.5 billion, due in large part to the accrual of disaster assistance payments, and increased payables to the Canada Pension Plan (CPP) Account due to growth in CPP contributions. Other accounts payable increased by $0.2 billion, while miscellaneous paylist deductions increased by $27 million. These increases were offset in part by a $0.4-billion decrease in accrued salaries and benefits, largely reflecting the payment of retroactive salaries during the year. Notes payable to international organizations were largely unchanged.
Interest-bearing debt includes unmatured debt, or debt issued on the credit markets, pension and other future benefit liabilities, and other liabilities. At March 31, 2022, interest-bearing debt totalled $1,578.4 billion, up $133.5 billion from March 31, 2021. Within interest-bearing debt, unmatured debt increased by $118.1 billion, liabilities for public sector pensions decreased by $1.1 billion, liabilities for other employee and veteran future benefits increased by $15.5 billion, and other liabilities increased by $1.0 billion.
The $118.1-billion increase in unmatured debt is largely attributable to a $120.7-billion increase in market debt and related unamortized discounts and premiums, reflecting increased borrowings to meet the government’s financial requirements, including temporary measures under the COVID-19 Economic Response Plan.
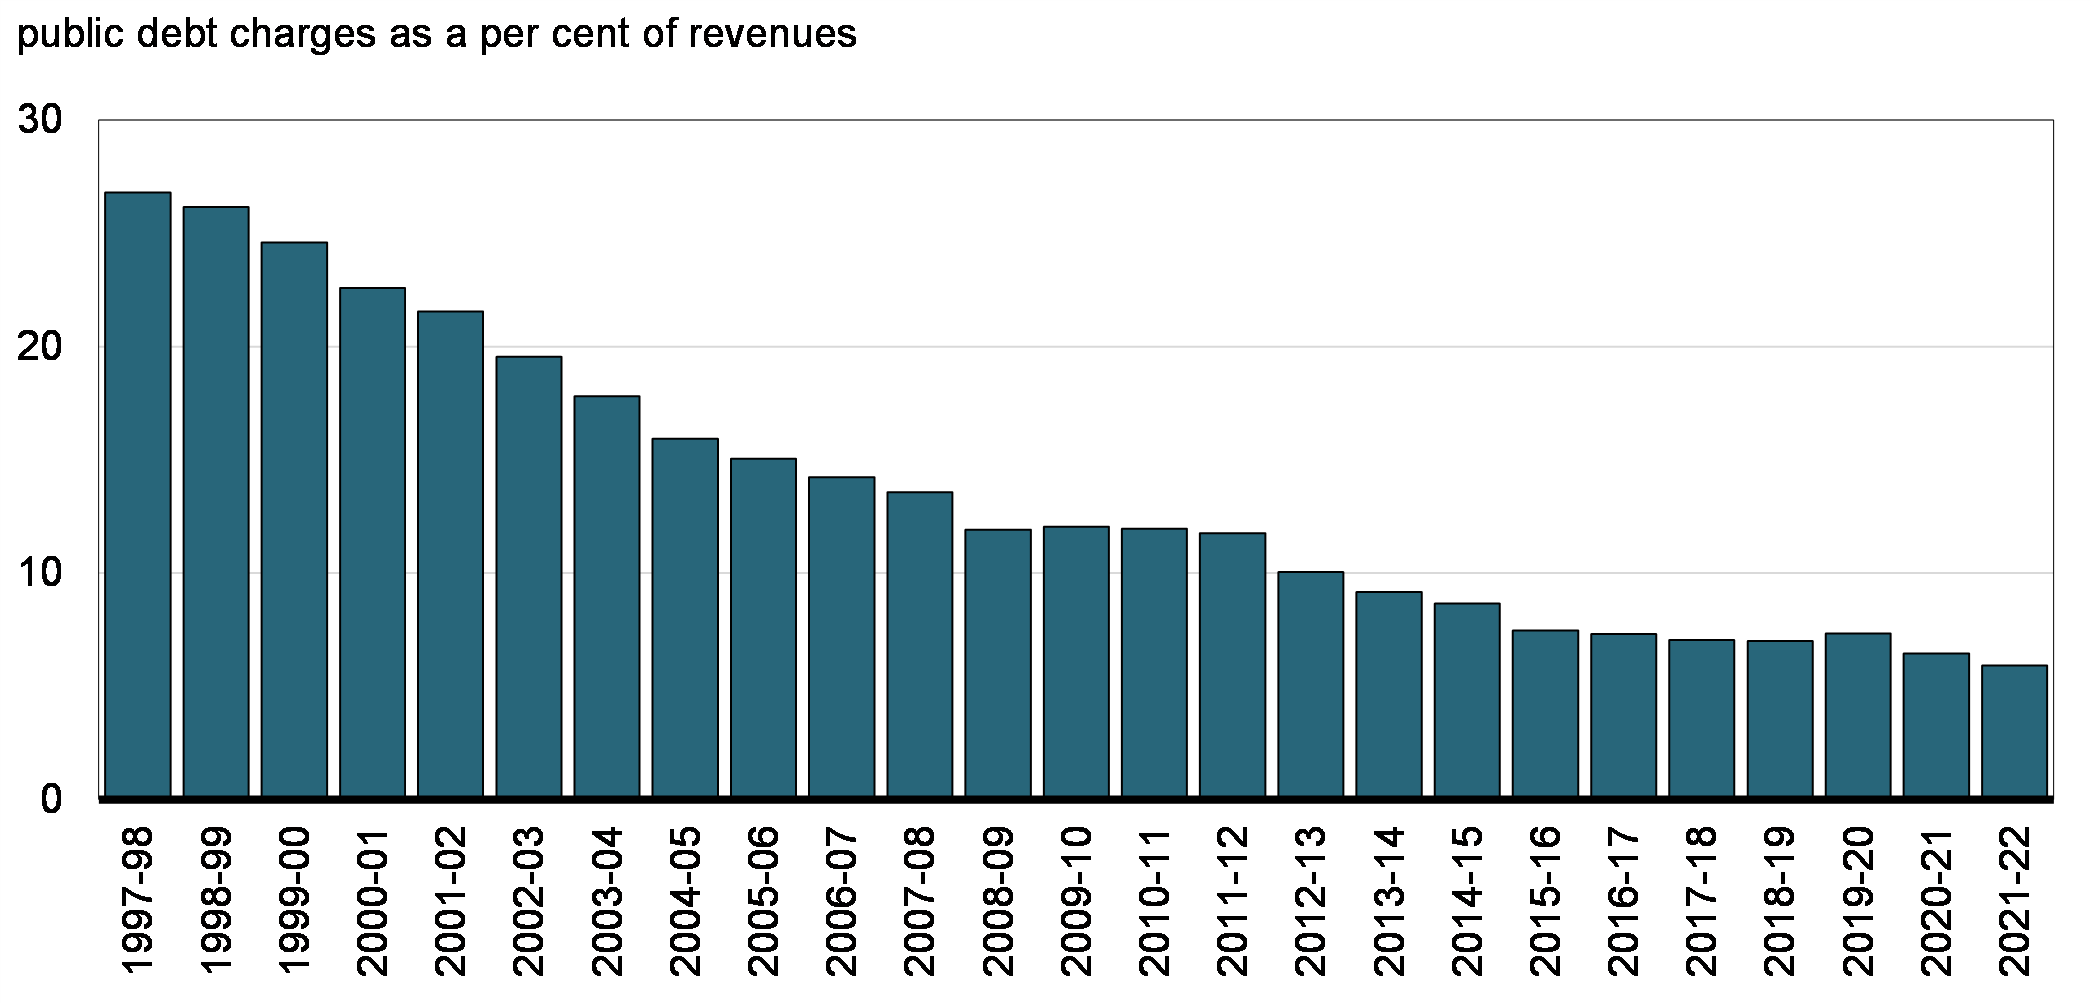
The interest ratio (public debt charges as a percentage of revenues) shows the proportion of every dollar of revenue that is needed to pay interest and is therefore not available to pay for program initiatives. The interest ratio has been decreasing in recent years, falling from a peak of 37.6 per cent in 1990–91 to 5.9 per cent in 2021–22. This means that, in 2021–22, the government spent approximately 6 cents of every revenue dollar on servicing the public debt.
Interest Ratio
International Comparisons of Government Debt
Jurisdictional responsibility (between central, state and local governments) for government programs differs among countries. As a result, international comparisons of government fiscal positions are made on a total government, National Accounts basis. For Canada, total government net debt includes that of the federal, provincial/territorial and local governments, as well as the net assets held in the CPP and Québec Pension Plan (QPP).
Canada Has the Lowest Total Government Net Debt Burden Among G7 Countries
G7 Total Government Net Debt, 2021
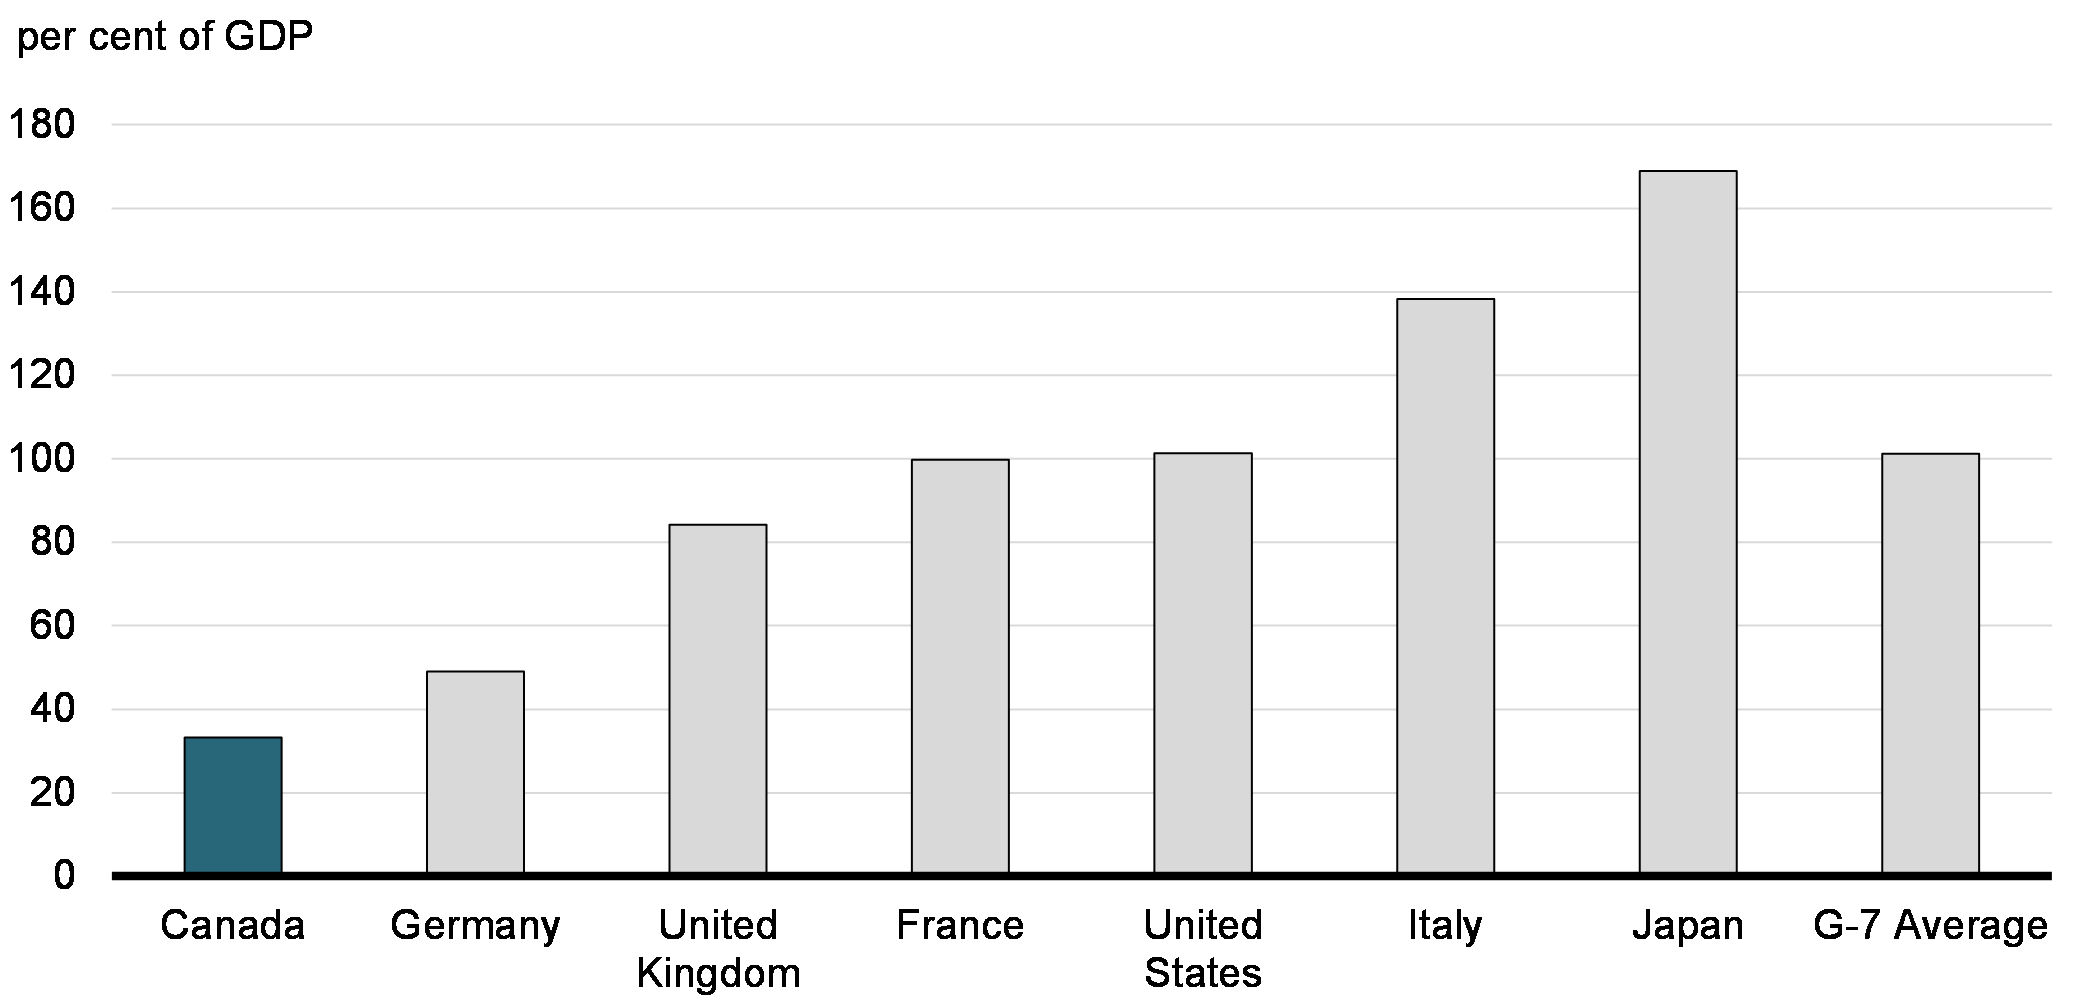
Canada’s total government net debt-to-GDP ratio stood at 33.2 per cent in 2021, according to the IMF. This is the lowest level among G7 countries, which the IMF estimates recorded an average net debt of 101.2 per cent of GDP in that same year.
The following table provides a reconciliation between the Government of Canada’s federal debt-to-GDP ratio and Canada’s total government net debt-to-GDP ratio used for international debt comparison purposes. Importantly, the latter includes the net debt of the federal, provincial, territorial and local governments as well as the net assets held by the CPP and QPP, and excludes liabilities for public sector pensions and other employee future benefits. Given significant inconsistencies across countries in the accounting treatment of unfunded liabilities for public sector pensions and other employee future benefits, international organizations remove them from debt estimates for countries that include them (such as Canada) to facilitate international comparability.
| (per cent of GDP) | ||
|---|---|---|
| Federal debt | 45.5 | |
| Add: | Non-financial assets | 4.2 |
| Net debt (Public Accounts basis) | 49.7 | |
| Less: | Liabilities for public sector pensions | (6.7) |
| Liabilities for other future benefits | (6.4) | |
| National Accounts/Public Accounts methodological differences and timing adjustments1 | (6.1) | |
| Total federal net debt (National Accounts basis) | 30.4 | |
| Add: | Net debt of provincial/territorial and local governments | 17.1 |
| Less: | Net assets of the CPP/QPP | (15.9) |
| Total government net debt2 | 31.6 | |
|
Note: Numbers may not add due to rounding. |
||
Financial Source/Requirement
The budgetary balance is the most comprehensive measure of the federal government’s fiscal results. It is presented on an accrual basis of accounting, recording government expenses when they are incurred, regardless of when the cash payment is made, and recording tax revenues when earned, regardless of when the cash is received.
In contrast, the financial source/requirement measures the difference between cash coming in to the government and cash going out. It differs from the budgetary balance in that it includes cash transactions in loans, investments and advances, public sector pensions and other employee future benefits, other specified purpose accounts, foreign exchange activities, and changes in other financial assets, liabilities and non-financial assets. These activities are included as part of non-budgetary transactions.
Non-budgetary transactions also include adjustments for the effects of non-cash items included in the budgetary balance and for any accruals of past or future cash receipts or payments. Examples of non-cash items include amortization of tangible capital assets, pension and other employee future benefit expenses not funded in the period, and the recognition of previously deferred revenue.
Non-budgetary transactions resulted in a net source of funds amounting to $8.8 billion in 2021–22, compared to a net source of $13.2 billion in 2020–21.
With a budgetary deficit of $90.2 billion and a financial source from non-budgetary transactions of $8.8 billion, there was a total financial requirement of $81.4 billion in 2021–22, compared to a financial requirement of $314.6 billion in 2020–21 (Table 9).
The government financed this financial requirement of $81.4 billion and increased its cash balances by $36.7 billion by increasing unmatured debt by $118.1 billion. Cash balances at the end of March 2022 stood at $100.8 billion.
| 2021–22 | 2020–21 | |
|---|---|---|
| Deficit for the year | (90.2) | (327.7) |
| Non-budgetary transactions | ||
| Pensions and other accounts | ||
Public sector pension liabilities |
(1.1) | 0.2 |
Other employee and veteran future benefit liabilities |
15.5 | 17.8 |
Other liabilities |
1.0 | 0.7 |
Public sector pension assets |
(2.9) | (1.7) |
Total |
12.5 | 16.9 |
| Non-financial assets | (2.8) | (9.5) |
| Loans, investments and advances | (23.3) | (26.4) |
| Other transactions | ||
Accounts payable, receivable, accruals and allowances |
33.8 | 19.9 |
Foreign exchange activities |
(11.4) | 12.3 |
Total |
22.4 | 32.2 |
| Total non-budgetary transactions | 8.8 | 13.2 |
| Financial requirement | (81.4) | (314.6) |
| Net change in financing activities | ||
| Marketable bonds (Canadian currency) | 155.6 | 278.4 |
| Treasury bills | (31.4) | 66.9 |
| Retail debt | (0.3) | (0.2) |
| Other | (5.8) | (3.7) |
| Total | 118.1 | 341.4 |
| Change in cash balances | 36.7 | 26.9 |
| Cash at end of year | 100.8 | 64.1 |
|
Note: Numbers may not add due to rounding. |
||
Report of the Independent Auditor on the Condensed Consolidated Financial Statements
To the Minister of Finance
Opinion
The condensed consolidated financial statements, which comprise the condensed consolidated statement of financial position as at 31 March 2022, the condensed consolidated statement of operations and accumulated deficit, condensed consolidated statement of change in net debt and condensed consolidated statement of cash flow for the year then ended, and related notes, are derived from the audited consolidated financial statements of the Government of Canada for the year ended 31 March 2022.
In our opinion, the accompanying condensed consolidated financial statements are a fair summary of the audited consolidated financial statements of the Government of Canada, on the basis described in Note 1.
Condensed Consolidated Financial Statements
The condensed consolidated financial statements do not contain all the disclosures required by Canadian public sector accounting standards. Reading the condensed consolidated financial statements and the auditor’s report thereon, therefore, is not a substitute for reading the audited consolidated financial statements of the Government of Canada and the auditor’s report thereon.
The Audited Consolidated Financial Statements of the Government of Canada and Our Report Thereon
We expressed an unmodified audit opinion on the audited consolidated financial statements of the Government of Canada in our report dated 12 September 2022. That report also includes an Emphasis of Matter paragraph that draws attention to the significant impact of the ongoing COVID-19 pandemic on the audited consolidated financial statements as a result of actions taken by the Government of Canada to protect public health and reduce economic impacts on individuals and businesses.
Management’s Responsibility for the Condensed Consolidated Financial Statements
Management is responsible for the preparation of the condensed consolidated financial statements on the basis described in Note 1.
Auditor’s Responsibility
Our responsibility is to express an opinion on whether the condensed consolidated financial statements are a fair summary of the audited consolidated financial statements of the Government of Canada based on our procedures, which were conducted in accordance with Canadian Auditing Standard (CAS) 810, Engagements to Report on Summary Financial Statements.
Original signed by
Karen Hogan, FCPA, FCA
Auditor General of Canada
Ottawa, Canada
12 September 2022
Condensed Consolidated Financial Statements of the Government of Canada
The fundamental purpose of these condensed consolidated financial statements is to provide an overview of the financial affairs and resources for which the Government is responsible under authority granted by Parliament. Responsibility for the integrity and objectivity of these statements rests with the Government.
| 2022 Budget (Note 3) |
2022 Actual | 2021 Actual | |
|---|---|---|---|
| Revenues | |||
| Income tax revenues | 240,497 | 287,989 | 236,974 |
| Other taxes and duties | 57,308 | 62,680 | 46,954 |
| Employment insurance premiums | 23,657 | 23,856 | 22,392 |
| Proceeds from the pollution pricing framework | 6,352 | 6,341 | 4,380 |
| Other revenues | 27,315 | 32,411 | 5,746 |
| Total revenues | 355,129 | 413,277 | 316,446 |
| Expenses | |||
| Transfer payments | |||
Old age security benefits and related payments |
62,474 | 60,774 | 58,529 |
Major transfer payments to other levels of government |
90,500 | 88,386 | 106,653 |
Employment insurance and support measures |
41,179 | 38,923 | 58,356 |
Children's benefits |
27,190 | 26,226 | 27,370 |
COVID-19 income support for workers |
13,918 | 15,582 | 55,832 |
Canada emergency wage subsidy |
25,955 | 22,291 | 80,166 |
Proceeds from the pollution pricing framework returned |
6,924 | 3,814 | 4,566 |
Other transfer payments |
84,960 | 88,478 | 97,961 |
Total transfer payments |
353,100 | 344,474 | 489,433 |
| Other expenses, excluding net actuarial losses | 122,465 | 124,342 | 119,089 |
| Total program expenses, excluding net actuarial losses | 475,565 | 468,816 | 608,522 |
| Public debt charges | 22,066 | 24,487 | 20,358 |
| Total expenses, excluding net actuarial losses | 497,631 | 493,303 | 628,880 |
| Annual deficit before net actuarial losses | (142,502) | (80,026) | (312,434) |
Net actuarial losses |
(12,210) | (10,186) | (15,295) |
| Annual deficit | (154,712) | (90,212) | (327,729) |
| Accumulated deficit at beginning of year | (1,048,746) | (1,048,746) | (721,360) |
| Other comprehensive income | - | 4,465 | 343 |
| Accumulated deficit at end of year | (1,203,458) | (1,134,493) | (1,048,746) |
|
The accompanying notes are an integral part of these condensed consolidated financial statements. |
|||
| 2022 | 2021 | |
|---|---|---|
| Liabilities | ||
| Accounts payable and accrued liabilities | 260,288 | 207,397 |
| Interest-bearing debt | ||
Unmatured debt |
1,243,291 | 1,125,186 |
Pensions and other future benefits |
327,371 | 312,947 |
Other liabilities |
7,707 | 6,711 |
Total interest-bearing debt |
1,578,369 | 1,444,844 |
| Total liabilities | 1,838,657 | 1,652,241 |
| Financial assets | ||
| Cash and accounts receivable | 280,026 | 224,196 |
| Foreign exchange accounts | 104,031 | 92,622 |
| Loans, investments and advances | 207,031 | 179,278 |
| Public sector pension assets | 9,203 | 6,320 |
| Total financial assets | 600,291 | 502,416 |
| Net debt | (1,238,366) | (1,149,825) |
| Non-financial assets | ||
| Tangible capital assets | 91,889 | 87,583 |
| Other | 11,984 | 13,496 |
| Total non-financial assets | 103,873 | 101,079 |
| Accumulated deficit | (1,134,493) | (1,048,746) |
| Contingent liabilities (Note 5) Contractual obligations and contractual rights (Note 6) |
||
|
The accompanying notes are an integral part of these condensed consolidated financial statements. |
||
| 2022 Budget (Note 3) |
2022 Actual | 2021 Actual | |
|---|---|---|---|
| Net debt at beginning of year | (1,149,825) | (1,149,825) | (812,891) |
| Change in net debt during the year | |||
| Annual deficit | (154,712) | (90,212) | (327,729) |
Acquisition of tangible capital assets |
(11,197) | (9,588) | (10,127) |
Amortization of tangible capital assets |
6,009 | 5,433 | 5,969 |
Other |
2,272 | 1,361 | (5,390) |
| Net increase in net debt due to operations | (157,628) | (93,006) | (337,277) |
| Other comprehensive income | - | 4,465 | 343 |
| Net increase in net debt | (157,628) | (88,541) | (336,934) |
| Net debt at end of year | (1,307,453) | (1,238,366) | (1,149,825) |
|
The accompanying notes are an integral part of these condensed consolidated financial statements |
|||
| 2022 | 2021 | |
|---|---|---|
| Cash used by operating activities | ||
| Annual deficit | (90,212) | (327,729) |
| Adjustments to reconcile annual deficit to cash used by operating activities | 25,458 | 77,956 |
| (64,754) | (249,773) | |
| Cash used by capital investment activities | (8,858) | (10,015) |
| Cash used by investing activities | (6,562) | (64,675) |
| Cash provided by financing activities | 116,895 | 351,322 |
| Net increase in cash and cash equivalents | 36,721 | 26,859 |
| Cash and cash equivalents at beginning of year | 64,101 | 37,242 |
| Cash and cash equivalents at end of year | 100,822 | 64,101 |
| Supplementary information | ||
| Cash used for interest | 14,793 | 15,094 |
|
The accompanying notes are an integral part of these condensed consolidated financial statements. |
||
Notes to the Condensed Consolidated Financial Statements of the Government of Canada
1. Applied Criteria in the Preparation of the Condensed Consolidated Financial Statements
The criteria applied by the Government in the preparation of these condensed consolidated financial statements are as follows:
- These condensed consolidated financial statements are extracted from the audited consolidated financial statements included in Section 2 of Volume I of the Public Accounts of Canada 2022, which are to be tabled in Parliament.
- The condensed consolidated financial statements are in agreement with the related information in the audited consolidated financial statements and contain the information necessary to avoid distorting or obscuring matters disclosed in the related complete audited consolidated financial statements, including the notes thereto.
- As these condensed consolidated financial statements are, by their nature, summarized, they do not include all disclosures required by Canadian public sector accounting standards.
- Readers interested in the disclosure of more detailed data should refer to the audited consolidated financial statements in the Public Accounts of Canada.
2. Summary of Significant Accounting Policies
The reporting entity of the Government of Canada includes all of the government organizations that comprise the legal entity of the government as well as other government organizations, including Crown corporations, which are separate legal entities but are controlled by the government. The financial activities of all of these entities, except for enterprise Crown corporations and other government business enterprises, are consolidated in these financial statements on a line-by-line and uniform basis of accounting after eliminating significant inter-governmental balances and transactions. Enterprise Crown corporations and other government business enterprises, which are not dependent on the government for financing their activities, are recorded under the modified equity method. The Canada Pension Plan (CPP), which includes the assets of the CPP under the administration of the Canada Pension Plan Investment Board, is excluded from the reporting entity because changes to the CPP require the agreement of two thirds of participating provinces and it is therefore not controlled by the government.
The government accounts for transactions on an accrual basis, using the government’s accounting policies that are described in Note 1 to its audited consolidated financial statements, which are based on Canadian public sector accounting standards. The presentation and results using the stated accounting policies do not result in any significant differences from Canadian public sector accounting standards.
Financial assets presented on the Condensed Consolidated Statement of Financial Position can provide resources to discharge liabilities or finance future operations and are recorded at the lower of cost or net realizable value. Non-financial assets cannot normally be converted into cash to finance future operations without disrupting government operations; they are recorded at cost less accumulated amortization. Liabilities are recorded at the estimated amount ultimately payable, adjusted for the passage of time, as required. Obligations for pensions and other future benefits are measured on an actuarial basis. Allowances for valuation are established for loans, investments and advances, as well as for loan guarantees and other obligations.
Transactions involving foreign currencies are translated into Canadian dollar equivalents using rates in effect at the time of the transactions. Monetary assets and liabilities denominated in foreign currencies are translated using rates at March 31.
Some amounts in these condensed consolidated financial statements are based on estimates and assumptions made by the government. They are based on facts and circumstances, historical experience, general economic conditions and reflect the government’s best estimate of the related amount at the end of the reporting period. Estimates and underlying assumptions are reviewed annually at March 31. Revisions to accounting estimates are recognized in the period in which estimates are revised if revisions affect only that period or in the period of revision and future periods if revisions affect both current and future periods.
Measurement uncertainty that is material exists when it is reasonably possible that a material variance could occur in the reported or disclosed amount in the near term. Near term is defined as a period of time not to exceed one year from March 31. The government has determined that measurement uncertainty exists with respect to the reported amounts for:
- the accrual of tax revenues and the related amounts receivable, other receivables and payables, and the allowance for doubtful accounts;
- expenses;
- the provision for contingent liabilities (Note 5);
- environmental liabilities and asset retirement obligations;
- public sector pensions and other employee and veteran future benefits;
- enterprise Crown corporations and other government business enterprises;
- other loans, investments and advances;
- the expected useful life of tangible capital assets;
- inventory; and
- contractual rights (Note 6).
It is reasonably possible that the government’s reassessments of these estimates and assumptions could require a material change in reported amounts or disclosures in the condensed consolidated financial statements.
Measurement uncertainties exist at March 31, 2022 as a result of the on-going COVID‐19 pandemic, global supply shortages, higher-than-expected inflation rates, increasing interest rates, and the Russia-Ukraine conflict. The condensed consolidated financial statements reflect the impacts to the extent known and estimable at the reporting date. The government continues to assess and monitor the effects of these measurement uncertainties on its financial position, including related estimates and assumptions used in the preparation of its statements. The full potential impact on the assumptions used for the year is unknown as it will depend on future developments that are uncertain.
3. Comparative Information
Certain comparative figures have been reclassified to conform to the current year’s presentation. In particular, the government has changed the presentation of the Condensed Consolidated Statement of Cash Flow to segregate cash from non-cash items related to foreign exchange revaluation that were substantially included in the change in foreign exchange accounts in the prior year’s presentation.
4. Source of Budget Amounts
The budget amounts included in the Condensed Consolidated Statement of Operations and Accumulated Deficit and the Condensed Consolidated Statement of Change in Net Debt are derived from the amounts that were budgeted for 2022 in the April 2021 Budget Plan (Budget 2021). To enhance comparability with actual 2022 results, Budget 2021 amounts have been reclassified to conform to the current year’s presentation in the condensed consolidated financial statements, with no overall impact on the budgeted 2022 annual deficit.
Since actual opening balances of the accumulated deficit and net debt were not available at the time of preparation of Budget 2021, the corresponding amounts in the budget column have been adjusted to the actual closing balances of the previous year.
5. Contingent Liabilities
Contingent liabilities arise in the normal course of operations and their ultimate disposition is unknown. Contingent liabilities are potential liabilities that may become actual liabilities when one or more future events not wholly within the government’s control occur or fail to occur. A provision is recorded when the potential liabilities are assessed as likely to become an actual liability and a reasonable estimate of the loss can be made. The government’s contingent liabilities include claims comprising pending and threatened litigation, specific claims and comprehensive land claims; guarantees provided by the government; assessed taxes under appeal; callable share capital in international organizations; and, insurance programs of agent enterprise Crown corporations.
- There are thousands of claims, including pending and threatened litigation, specific claims and comprehensive land claims outstanding against the government. While the total amount claimed in these actions is significant, their outcomes are not determinable in all cases. The government has recorded an allowance for claims where it is likely that there will be a future payment and a reasonable estimate of the loss can be made. Significant exposure to a liability could exist in excess of what has been accrued. In situations where the outcome is likely but management cannot reasonably estimate a liability, no amount is accrued. Claims for which the outcome is not determinable and for which an amount has not been accrued are estimated at $4,186 million ($4,791 million in 2021).
- Guarantees provided by the government include guarantees on the borrowings of enterprise Crown corporations and other government business enterprises, loan guarantees, insurance programs managed by the government or agent enterprise Crown corporations, and other explicit guarantees. At March 31, 2022, the principal amount outstanding for guarantees provided by the government amounts to $575,743 million ($583,745 million in 2021) for which an allowance of $390 million ($720 million in 2021) has been recorded. Of the total amount guaranteed, $304,871 million ($314,727 million in 2021) relates to guarantees on the borrowings of agent enterprise Crown corporations.
- Contingent liabilities include previously assessed federal taxes where amounts are being appealed to the Tax Court of Canada, the Federal Court of Appeal, or the Supreme Court of Canada. As of March 31, 2022, an amount of $5,634 million ($4,269 million in 2021) was being appealed to the courts, for which the likelihood of an adverse outcome was not determinable or for which an amount could not be reasonably estimated. The government has recorded, in accounts payable and accrued liabilities or in reduction of cash and accounts receivable, as applicable, the estimated amount of appeals that are considered likely to be lost and that can be reasonably estimated.
- The government has callable share capital in certain international organizations that could require payments to those agencies. At March 31, 2022, callable share capital amounts to $37,522 million ($37,781 million in 2021).
- At March 31, 2022, insurance in force relating to self-sustaining insurance programs operated by four agent enterprise Crown corporations amounts to $1,912,891 million ($1,902,250 million in 2021). The government expects that all four corporations will cover the cost of both current claims and possible future claims.
6. Contractual Obligations and Contractual Rights
The nature of government activities results in large multi-year contracts and agreements, including international treaties, protocols and agreements of various size and importance. Any financial obligations resulting from these contracts and agreements are recorded as a liability when the terms for the acquisition of goods and services or the provision of transfer payments are met.
Contractual obligations that will materially affect the level of future expenditures include transfer payment agreements, agreements for the acquisition of goods and services, operating leases, and funding of international organizations. At March 31, 2022, contractual obligations amount to $224,386 million, of which $68,911 million pertains to 2022–23.
The activities of government sometimes involve the negotiation of contracts or agreements with outside parties that result in the government having rights to both assets and revenues in the future. They principally involve sales of goods and services, leases of property, and royalties and profit-sharing arrangements. The terms of these contracts and agreements may not allow for a reasonable estimate of future revenues. For contracts and agreements that do allow for a reasonable estimate, total revenues to be received in the future under major contractual rights are estimated at $32,779 million at March 31, 2022, of which $3,707 million pertains to 2022–23.