
Annual Financial Report of the Government of Canada Fiscal Year 2022-2023
Note to Readers
The financial results in this report are based on the audited consolidated financial statements of the Government of Canada for the fiscal year ended March 31, 2023, the condensed form of which is included in this report.
For the 25th consecutive year, the government has received an unmodified audit opinion from the Auditor General of Canada on the consolidated financial statements. The complete consolidated financial statements are available on the Public Services and Procurement Canada website.
The Fiscal Reference Tables have been updated to incorporate the results for 2022–23 as well as historical revisions to the National Economic and Financial Accounts published by Statistics Canada.
Report Highlights
- The government posted an annual operating deficit of $35.3 billion for the fiscal year ended March 31, 2023, compared to a deficit of $90.3 billion in the previous fiscal year. The year-over-year improvement in the budgetary balance reflects the strong recovery of the Canadian economy from the effects of the pandemic along with the wind- down of temporary COVID-19 support measures.
- The annual operating deficit before net actuarial losses stood at $25.7 billion in 2022–23, compared to $80.1 billion in 2021–22. The annual operating deficit before net actuarial losses is intended to supplement the traditional budgetary balance and improve the transparency of the government's financial reporting by isolating the impact of the recognition of net actuarial losses arising from the government's public sector pensions and other employee and veteran future benefits.
- Compared to projections in Budget 2023, the annual operating deficit was $7.7 billion lower than the $43.0-billion deficit projected, mainly reflecting higher-than-expected tax revenues, partially offset by higher-than-expected program expenses and public debt charges. The annual operating deficit before net actuarial losses was $7.5 billion lower than projected.
- Compared to the 2021–22 fiscal year:
- Revenues increased by $34.5 billion, or 8.4 per cent, reflecting a broad-based increase in revenue, supported by strong economic growth, tight labour markets, and resilient consumer spending.
- Program expenses excluding net actuarial losses decreased by $30.4 billion, or 6.5 per cent, largely reflecting lower transfers to individuals and businesses due to expiring temporary COVID-19 measures.
- Net actuarial losses, which reflect changes in the value of the government's obligations and assets for public sector pensions and other employee and veteran future benefits recorded in previous fiscal years, decreased $0.6 billion, or 5.5 per cent, largely reflecting the end of the amortization period for certain prior years' net actuarial losses in 2021–22.
- Public debt charges were up $10.5 billion, or 42.7 per cent, largely reflecting higher interest rates on the stock of interest-bearing debt.
- In 2022–23, the government recorded expenses totalling approximately $26 billion related to Indigenous claims, in advancing its commitment to resolve past injustices and renew its relationship with Indigenous Peoples. Absent these expenses, the 2022–23 budgetary deficit would have been roughly $9 billion, or 0.3 per cent of gross domestic product (GDP).
- The federal debt (the difference between total liabilities and total assets) stood at $1,173.0 billion at March 31, 2023. The federal debt-to-GDP ratio was 42.2 per cent, down from 45.4 per cent in the previous year. As noted in Budget 2023, the government remains committed to its fiscal anchor of reducing the federal debt as a share of the economy over the medium term.
- For the 25th consecutive year, the government has received an unmodified audit opinion from the Auditor General of Canada on the consolidated financial statements.
Economic ContextFootnote 1
The Canadian economy continued its rapid recovery from the pandemic and was more resilient in 2022 than had been expected in the wake of rapid increases in interest rates. Canada saw the strongest growth in the G7 over the course of 2022. Canadian real GDP grew by 3.4 per cent in 2022 and was 3.7 per cent above its pre-pandemic level in the first quarter of 2023—the fastest recovery of the last four recessions.
Solid economic growth helped an additional 750,000 Canadians find jobs between 2021 and 2022, pulling the unemployment rate to a 50-year low. More people aged 15 to 64 years are engaged in the labour market than ever before, with meaningful increases for historically under-represented groups, including women, newcomers, and young Canadians. The labour force participation rate among women aged 25 to 54 years reached record highs.
Supply chain disruptions and surging commodity prices following Russia's invasion of Ukraine exacerbated economy-wide price pressures, with consumer price inflation peaking at 8.1 per cent in June 2022. Since then, Canada has managed to make significant progress in reducing inflation, reaching 3.2 per cent in July 2023.
Elevated consumer price inflation combined with high commodity prices and a resilient economy led to another year of double-digit growth in nominal GDP, the broadest measure of the tax base, at 10.9 per cent in 2022 after growing 13.6 per cent in 2021.
Faced with inflationary pressures and excess demand in the economy, the Bank of Canada raised its policy rate by 425 basis points to 4.5 per cent between March 2022 and the end of 2022–23—the highest rate since 2007 and above its estimated "neutral range" of 2–3 per cent.
Looking ahead, the lagged impacts of monetary policy tightening are expected to gradually build and broaden, slowing overall economic activity. Over time, slower growth is expected to help bring demand into balance with supply, gradually easing labour market tightness and slowing underlying inflation. Economic growth is expected to pick up over the course of 2024 as the effect of higher interest rates in Canada and globally dissipates.
The government regularly surveys private sector economists on their views on the economy to assess and manage risk. The survey of private sector economists has been used as the basis for economic and fiscal planning since 1994 and introduces an element of independence into the government's forecasts.
| 2021 | 2022 | 2023 | 2024 | |
|---|---|---|---|---|
| Real GDP growth | ||||
| Budget 2022 | 5.0 | 4.1 | 3.1 | 2.0 |
| Budget 2023 | 5.0 | 3.4 | 0.3 | 1.5 |
| Actual | 5.0 | 3.4 | – | – |
| Nominal GDP growth | ||||
| Budget 2022 | 13.6 | 8.1 | 4.8 | 3.9 |
| Budget 2023 | 13.6 | 10.9 | 0.8 | 3.6 |
| Actual | 13.6 | 10.9 | – | – |
| 3-month treasury bill rate | ||||
| Budget 2022 | 0.1 | 0.8 | 1.7 | 2.0 |
| Budget 2023 | 0.1 | 2.4 | 4.4 | 3.3 |
| Actual | 0.1 | 2.4 | – | – |
| 10-year government bond rate | ||||
| Budget 2022 | 1.4 | 2.0 | 2.4 | 2.6 |
| Budget 2023 | 1.4 | 2.8 | 3.0 | 2.9 |
| Actual | 1.4 | 2.8 | – | – |
| Unemployment rate | ||||
| Budget 2022 | 7.5 | 5.8 | 5.5 | 5.5 |
| Budget 2023 | 7.5 | 5.3 | 5.8 | 6.2 |
| Actual | 7.5 | 5.3 | – | – |
| Consumer Price Index inflation | ||||
| Budget 2022 | 3.4 | 3.9 | 2.4 | 2.2 |
| Budget 2023 | 3.4 | 6.8 | 3.5 | 2.1 |
| Actual | 3.4 | 6.8 | – | – |
Note: Figures have been restated to reflect the historical revisions in the Canadian System of National Accounts as of the first quarter of 2023 released on May 31, 2023. |
||||
The Budgetary Balance
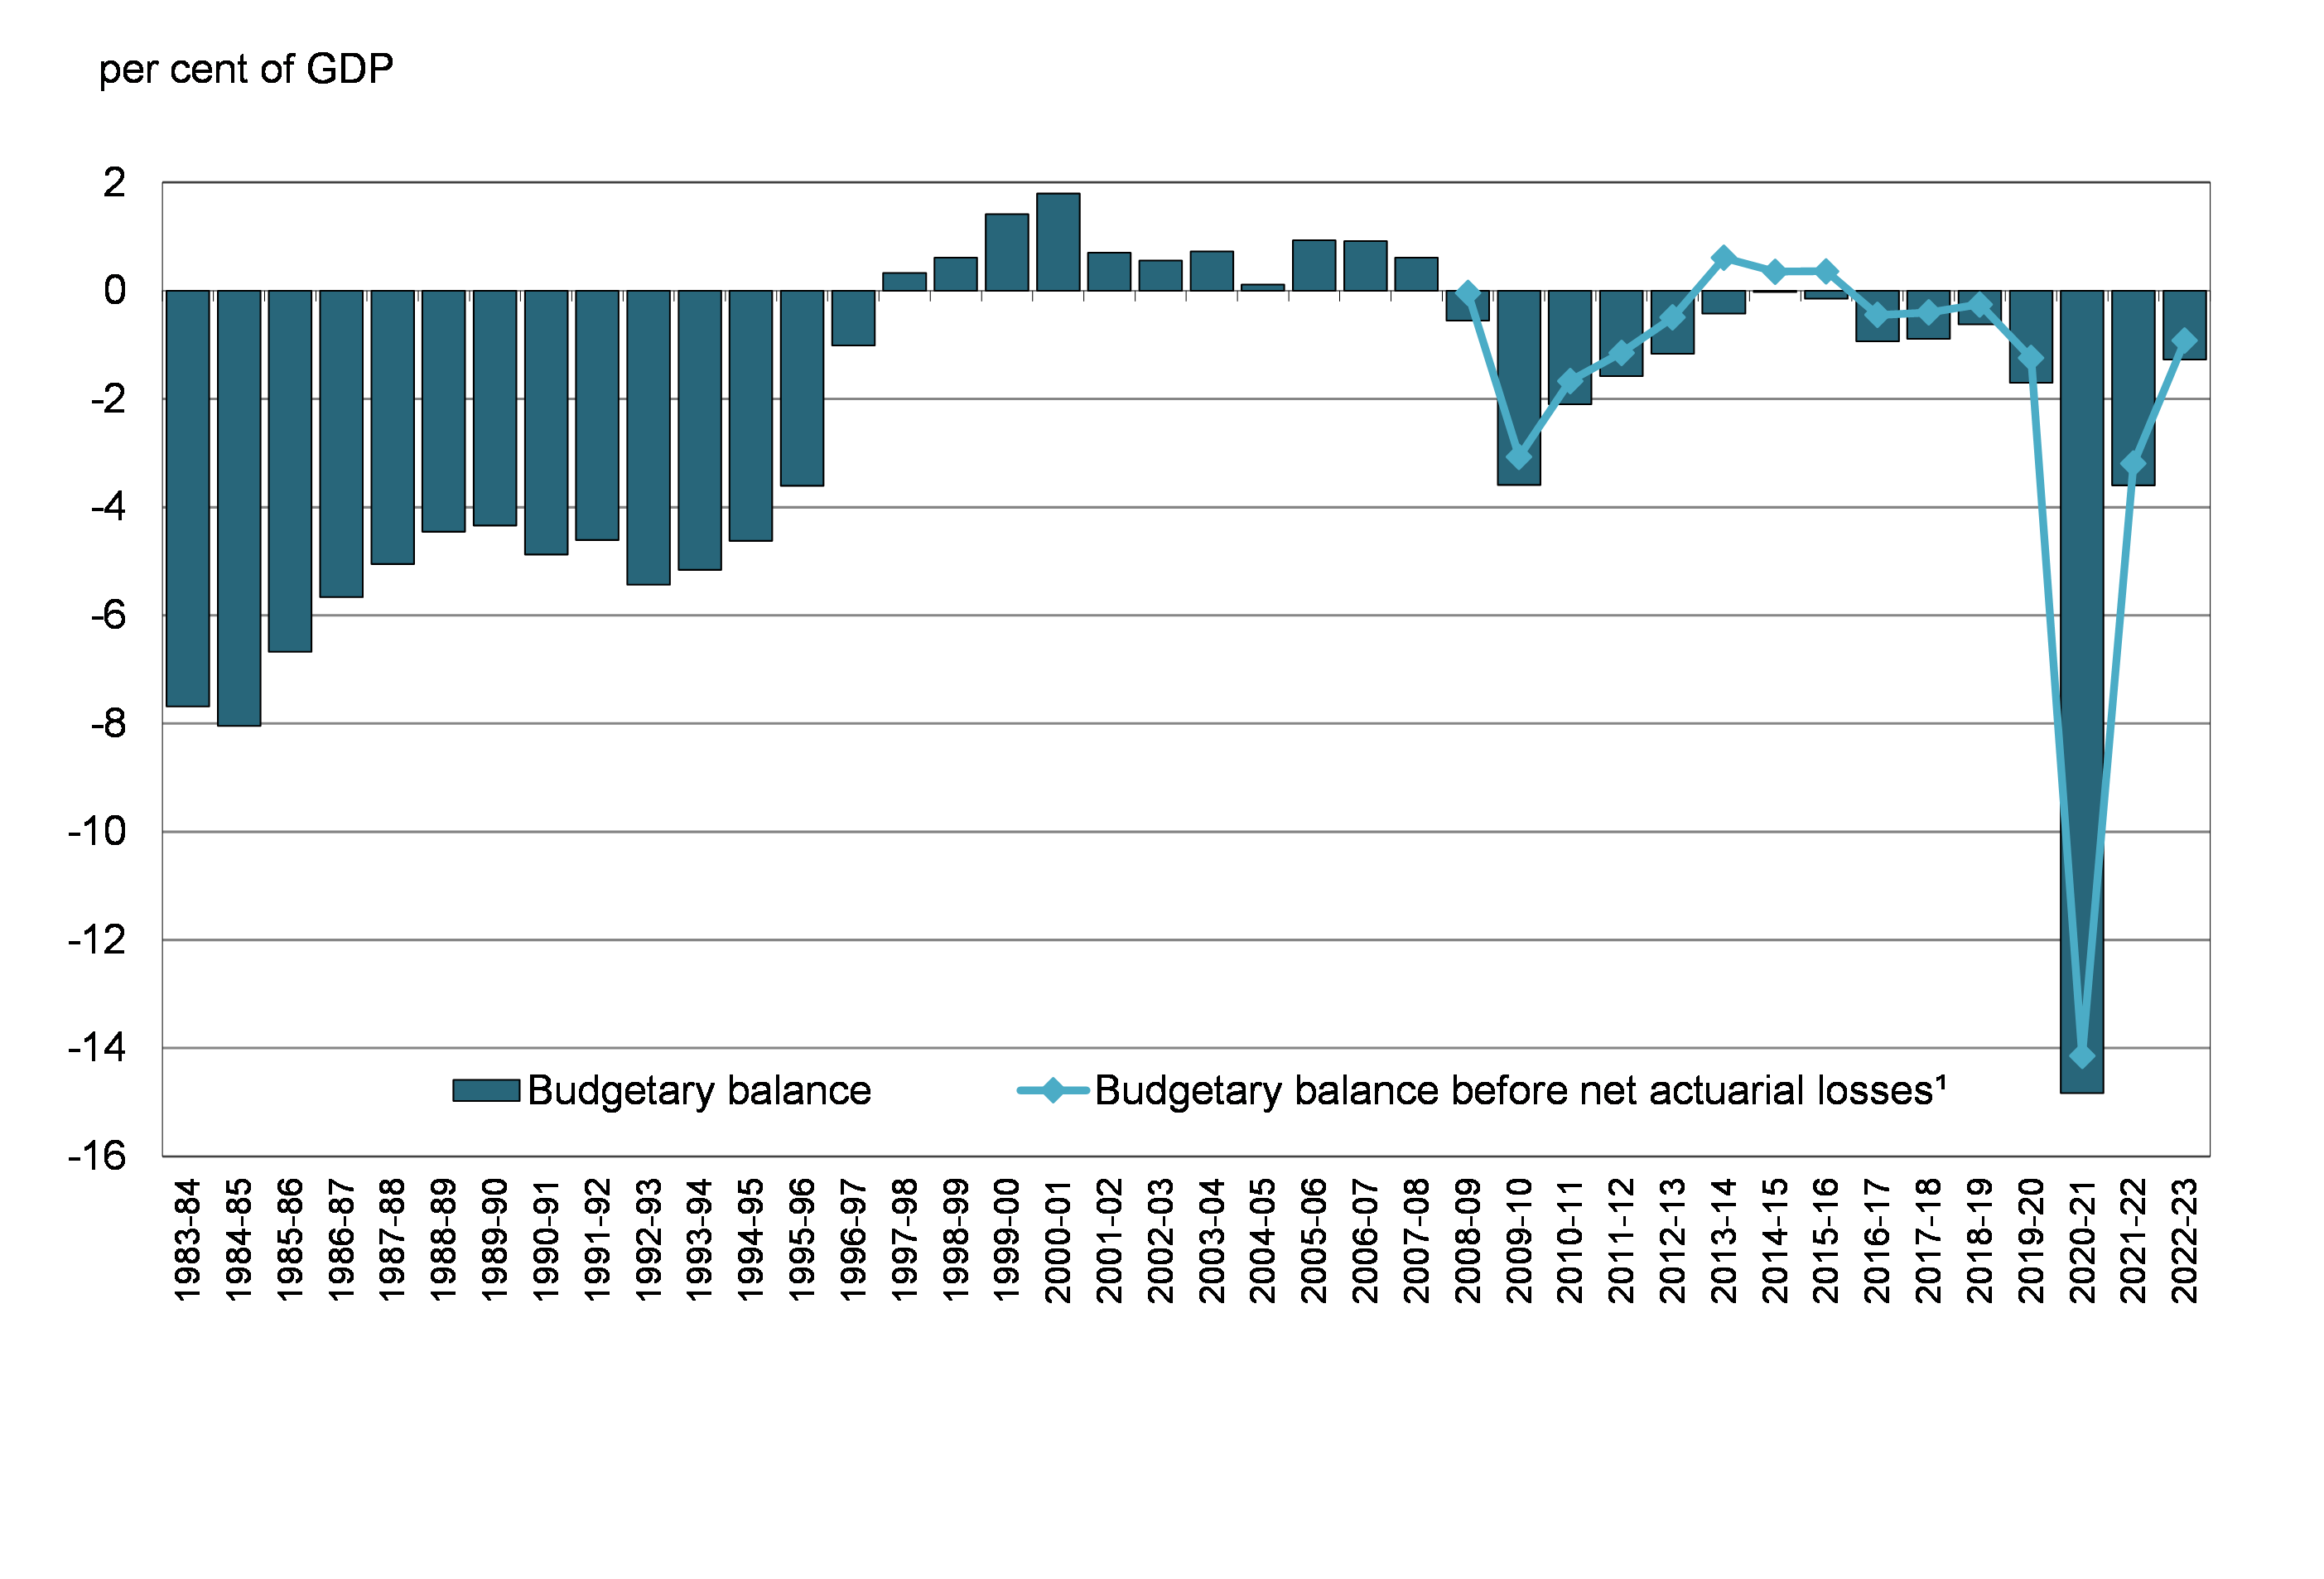
The government posted a budgetary deficit, or annual operating deficit, of $35.3 billion in 2022–23, compared to a deficit of $90.3 billion in 2021–22.
The budgetary balance before net actuarial losses represents the difference between the government's revenues and expenses excluding net actuarial losses. By excluding the impact of changes in the value of the government's obligations and assets for public sector pensions and other employee and veteran future benefits recorded in previous fiscal years, this measure is intended to present a clearer picture of the results of government operations during the current fiscal year. The budgetary deficit before net actuarial losses stood at $25.7 billion for 2022–23, compared to $80.1 billion in 2021–22.
The following graph shows the government's budgetary balance since 1983–84, as well as the budgetary balance before net actuarial losses since 2008–09. To enhance the comparability of results over time and across jurisdictions, the budgetary balance and its components are presented as a percentage of GDP. In 2022–23, the budgetary deficit was 1.3 per cent of GDP, compared to a deficit of 3.6 per cent of GDP in 2021–22. The budgetary deficit before net actuarial losses was 0.9 per cent of GDP, compared to a deficit of 3.2 per cent of GDP a year earlier.
Budgetary Balance
Revenues were up $34.5 billion, or 8.4 per cent, from the prior year, reflecting a broad-based increase in revenue, supported by strong labour markets and robust profits, notably in the resource sector.
Total expenses were down $20.5 billion, or 4.1 per cent, from the prior year. Program expenses excluding net actuarial losses decreased by $30.4 billion, or 6.5 per cent, primarily reflecting lower transfers to individuals and businesses due to expiring temporary COVID-19 measures.
Net actuarial losses decreased by $0.6 billion, or 5.5 per cent, from the prior year, largely reflecting the end of the amortization period for certain prior years' net actuarial losses in 2021–22.
Public debt charges increased by $10.5 billion, or 42.7 per cent, from the prior year, largely reflecting higher interest rates on the government's market debt and pension and benefit obligations.
Indigenous Claims
The government is committed to advancing reconciliation, supporting Indigenous Peoples' right to self-determination, and addressing historical wrongs and systemic racism. Acknowledging and resolving past injustices through the resolution of Indigenous claims is an important part of renewing the relationships between the Government of Canada and Indigenous Peoples.
Indigenous claims can be grouped into four main categories, as follows:
- Comprehensive land claims, which arise in areas of the country where Aboriginal rights and title have not been resolved by treaty or by other legal means. There are currently 83 comprehensive land claims under negotiation, accepted for negotiation, or under review.
- Specific claims, which deal with the past grievances of First Nations related to Canada's obligations under historic treaties or the way it managed First Nations' funds or other assets. There are currently 698 specific claims under negotiation, accepted for negotiation, or under review.
- General litigation claims being pursued through the courts, which include compensation related to the First Nations Child and Family Services program, Jordan's Principle, and residential schools.
- Special claims, which represent claims that are not being pursued through the courts and that do not fit within the parameters of existing policies for Comprehensive Land Claims or Specific Claims.
In 2022–23, the government recorded expenses totalling approximately $26 billion related to Indigenous claims. This reflects the government's efforts to work with Indigenous partners to collaboratively address past injustices and to accelerate the resolution of litigation and the implementation of negotiated settlements to support reconciliation in Canada.
| 2022–23 | 2021–22 Restated1 |
|
|---|---|---|
| Budgetary transactions | ||
| Revenues | 447.8 | 413.3 |
| Expenses | ||
Program expenses, excluding net actuarial losses |
438.6 | 468.9 |
Public debt charges |
35.0 | 24.5 |
Total expenses, excluding net actuarial losses |
473.5 | 493.4 |
| Budgetary balance, excluding net actuarial losses | (25.7) | (80.1) |
Net actuarial losses |
9.6 | 10.2 |
| Budgetary balance | (35.3) | (90.3) |
| Non-budgetary transactions | (30.8) | 5.9 |
| Financial source/requirement | (66.2) | (84.4) |
| Net change in financing activities | 14.3 | 121.1 |
| Net change in cash balances | (51.8) | 36.7 |
| Cash balance at end of period | 49.0 | 100.8 |
| Financial position | ||
Total liabilities |
1,925.0 | 1,892.3 |
Total financial assets |
642.3 | 647.5 |
Net debt |
(1,282.8) | (1,244.7) |
Non-financial assets |
109.7 | 104.8 |
| Federal debt (accumulated deficit) | (1,173.0) | (1,140.0) |
| Financial results (per cent of GDP) | ||
Revenues |
16.1 | 16.5 |
Total program expenses |
16.1 | 19.1 |
Public debt charges |
1.3 | 1.0 |
Budgetary balance |
(1.3) | (3.6) |
Federal debt (accumulated deficit) |
42.2 | 45.4 |
|
Note: Numbers may not add due to rounding. 1 Certain comparative figures have been restated. In addition, certain comparative figures have been reclassified to conform to the current year's presentation. Additional information can be found in Note 3 of the condensed consolidated financial statements. |
||
Annual deficit before net actuarial losses
Actuarial losses and gains arise from the annual remeasurement of the government's existing obligations for public sector pensions and other employee and veteran future benefits, as well as differences between actual and expected returns on pension assets. The measurement of these obligations and expected returns on pension assets involves the extensive use of estimates and assumptions about future events and circumstances, such as discount rates, future inflation, returns on investments, general wage increases, workforce composition, retirement rates, and mortality rates. In particular, the unfunded obligations are sensitive to changes in both short- and long-term interest rates, which are used to estimate the value of expected future benefit payments in today's dollars. Unfunded benefit obligations are discounted based on the spot rates of Government of Canada bonds at fiscal year-end (March 31), which can fluctuate significantly from one year to the next, resulting in actuarial gains and losses that flow through the budgetary balance.
While these adjustments and revaluations are an important part of providing an accurate picture of the government's Consolidated Statement of Financial Position at a given time, they can also result in large swings in the budgetary balance, which may impair the usefulness and understandability of the government's consolidated financial statements and fiscal projections, including as a measurement of the short-term impact of government spending and taxation choices on the economy.
The annual operating deficit before net actuarial losses isolates the impact of adjustments and remeasurements of previously recorded public sector pensions and other employee and veteran future benefits and provides a clearer view of the government's planned and actual operating activities in an accounting period, enhancing transparency and accountability.
Accounting changes in 2022–23
Starting in 2022–23, the government adopted new accounting standards issued by the Public Sector Accounting Board (PSAB) related to asset retirement obligations and financial instruments.
The asset retirement obligation standard requires public sector entities to recognize liabilities for legal obligations to incur costs associated with the retirement of controlled tangible capital assets arising on their acquisition, construction, or development or through their normal use, and to expense those costs systematically over the life of the respective assets. This includes activities such as decommissioning of nuclear reactors, removal of asbestos, and demilitarization or disarmament. The adoption of this standard has not had a material effect on the annual operating deficit for the current year. However, this accounting change has resulted in a net $5.5‑billion increase in the opening balance of the federal debt for 2022–23 to reflect the estimated value of the government's assets and liabilities associated with asset retirement obligations as of April 1, 2022. Comparative figures for 2021–22 have also been restated as part of the transition to this new standard. Asset retirement obligations are mostly based on long-term estimates, and the government uses assumptions about the timing and cost of future retirement activities. These estimates may be refined over time as information regarding the eventual costs to be incurred becomes available.
The government also adopted new accounting standards that prescribe recognition, measurement, and disclosure requirements for financial instruments. Financial instruments include primary instruments (such as receivables, payables, debt, and equity instruments) and derivative financial instruments (such as forward contracts and cross-currency swaps). Under the new PSAB guidance, derivatives, which were previously recorded at historical cost, are recognized at fair value. Changes in the fair value of derivatives are not reflected in the budgetary balance but are instead charged directly to the federal debt as accumulated remeasurement gains and losses. Remeasurement gains and losses, along with other comprehensive income reported by enterprise Crown corporations and other government business enterprises, are presented in a new financial statement, the Condensed Consolidated Statement of Remeasurement Gains and Losses, included as part of the Condensed Consolidated Financial Statements of the Government of Canada at the end of this report.
The financial instruments standard has been applied on a prospective basis. Accordingly, prior years' budgetary results have not been restated for this accounting change, but the opening balance of the federal debt for 2022–23 has been increased by $2.6 billion to reflect derivative assets and liabilities at their fair values as of April 1, 2022, and to adjust the value of unmatured debt. In addition, certain prior years' asset and liability balances presented for comparative purposes have been reclassified to reflect the current year's presentation.
Further details regarding these changes can be found in Note 3 to the condensed consolidated financial statements.
Comparison of Actual Budgetary Outcomes to Projected Results
The $35.3-billion deficit recorded in 2022–23 was $7.7 billion lower than the $43.0-billion deficit projected in the March 2023 federal budget.
Overall, revenues were $10.6 billion higher than forecast primarily due to higher tax revenues driven by higher-than-expected corporate income tax revenues. Program expenses, excluding net actuarial losses, were $2.6 billion higher than expected, largely a result of higher-than-anticipated provisions for claims and contingent liabilities. Public debt charges were $0.5 billion higher than projected resulting from higher-than-expected interest charges on unmatured debt due to higher-than-anticipated borrowing requirements toward the end of the fiscal year, offset in part by lower-than-expected interest expenses on future benefit obligations. Net actuarial losses were $0.2 billion lower than projected.
| Actual ($ billions) |
Budget 20231 ($ billions) |
Difference | ||
|---|---|---|---|---|
| ($ billions) | (per cent) | |||
| Revenues | ||||
Income tax |
||||
Personal |
207.9 | 206.8 | 1.1 | 0.5 |
Corporate |
93.9 | 88.0 | 5.9 | 6.7 |
Non-resident |
13.2 | 13.6 | (0.4) | (2.8) |
Total |
315.0 | 308.3 | 6.7 | 2.2 |
Other taxes and duties |
||||
Goods and Services Tax |
46.0 | 45.4 | 0.5 | 1.2 |
Energy taxes |
5.7 | 5.4 | 0.3 | 5.1 |
Customs import duties |
6.1 | 6.2 | (0.2) | (2.6) |
Other excise taxes and duties |
6.5 | 6.2 | 0.4 | 5.8 |
Total |
64.2 | 63.2 | 1.0 | 1.6 |
Employment Insurance premiums |
26.9 | 26.8 | 0.1 | 0.5 |
Proceeds from the pollution pricing framework |
8.0 | 7.7 | 0.4 | 5.0 |
Other revenues |
33.6 | 31.3 | 2.4 | 7.6 |
Total revenues |
447.8 | 437.3 | 10.6 | 2.4 |
| Program expenses | ||||
Major transfers to persons |
||||
Elderly benefits |
69.4 | 69.1 | 0.3 | 0.4 |
Employment Insurance and support measures |
21.8 | 22.6 | (0.8) | (3.5) |
Children's benefits |
24.6 | 24.5 | 0.1 | 0.2 |
COVID-19 income support for workers |
(3.5) | (3.0) | (0.6) | (19.7) |
Total |
112.2 | 113.3 | (1.1) | (0.9) |
Major transfers to other levels of government |
||||
Support for health and other social programs |
63.1 | 63.1 | 0.0 | 0.0 |
Fiscal arrangements |
19.7 | 19.7 | 0.0 | 0.0 |
Canada-wide early learning and child care |
4.5 | 4.5 | 0.0 | 0.0 |
Canada Community-Building Fund |
2.3 | 2.3 | 0.0 | 0.0 |
Heath agreements with provinces and territories |
1.2 | 1.2 | 0.0 | 0.0 |
Other |
0.0 | 0.0 | (0.0) | (51.5) |
Total |
90.8 | 90.8 | (0.0) | (0.0) |
Proceeds from the pollution pricing framework returned |
7.0 | 6.9 | 0.1 | 1.9 |
Canada Emergency Wage Subsidy |
(0.3) | (0.2) | (0.0) | (20.1) |
Other direct program expenses |
228.8 | 225.2 | 3.6 | 1.6 |
Total program expenses, excluding net actuarial losses |
438.6 | 435.9 | 2.6 | 0.6 |
| Public debt charges | 35.0 | 34.5 | 0.5 | 1.4 |
| Budgetary outcome/estimate before net actuarial losses | (25.7) | (33.2) | 7.5 | |
Net actuarial losses |
9.6 | 9.8 | (0.2) | (1.9) |
| Budgetary outcome/estimate | (35.3) | (43.0) | 7.7 | |
|
Note: Numbers may not add due to rounding. 1 Certain Budget 2023 amounts have been reclassified to conform to the current year's presentation in the consolidated financial statements, with no overall impact on the projected 2022–23 annual deficit. |
||||
Revenues
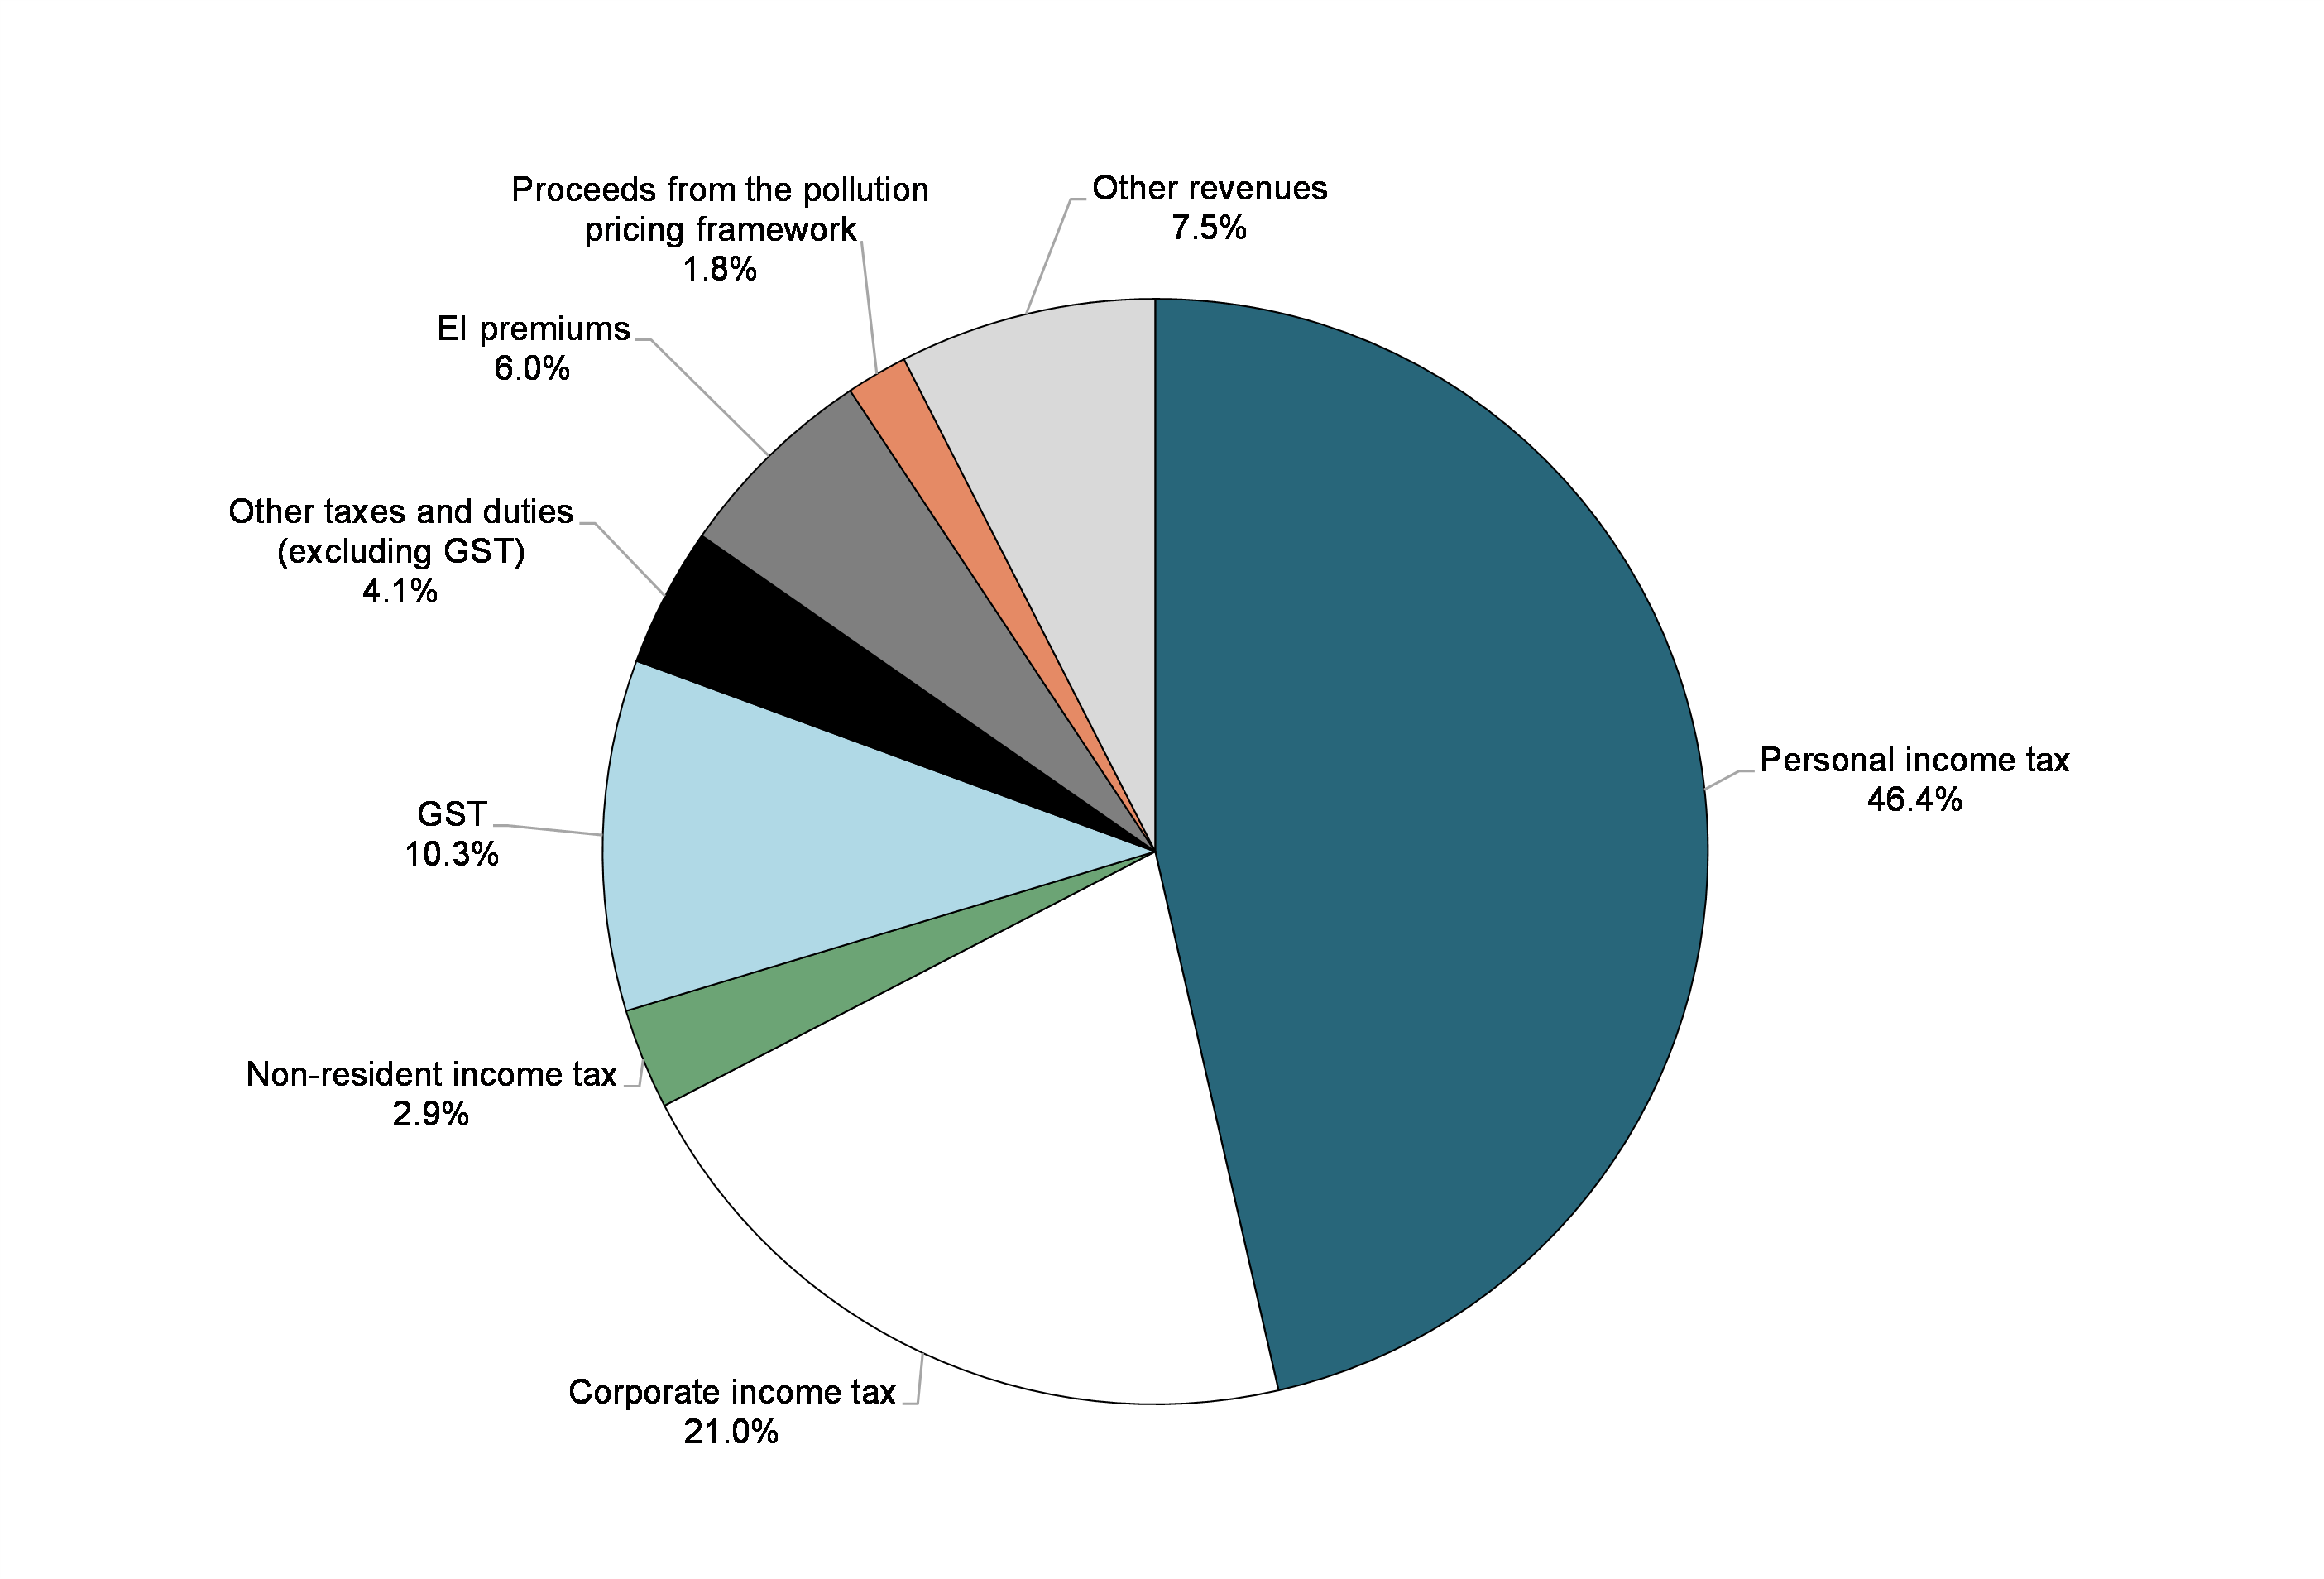
Federal revenues can be broken down into five main categories: income tax revenues, other taxes and duties, Employment Insurance (EI) premium revenues, proceeds from the pollution pricing framework, and other revenues.
Within the income tax category, personal income tax revenues are the largest source of federal revenues and accounted for 46.4 per cent of total revenues in 2022–23 (down from 48.0 per cent in 2021–22). Corporate income tax revenues are the second largest source of revenues and accounted for 21.0 per cent of total revenues in 2022–23 (up from 19.1 per cent in 2021–22). Non-resident income tax revenues are a comparatively smaller source of revenues, accounting for only 2.9 per cent of total revenues in 2022–23 (up from 2.6 per cent 2021–22).
Other taxes and duties consist of revenues from the Goods and Services Tax (GST), energy taxes, customs import duties, and other excise taxes and duties. The largest component of this category—GST revenues—accounted for 10.3 per cent of all federal revenues in 2022–23 (down from 11.2 per cent in 2021–22). The share of the remaining components of other taxes and duties stood at 4.1 per cent of total federal revenues (up slightly from 4.0 per cent in 2021–22).
EI premium revenues accounted for 6.0 per cent of total federal revenues in 2022–23 (up from 5.8 per cent in 2021–22).
Proceeds from the federal carbon pollution pricing framework accounted for 1.8 per cent of total federal revenues in 2022–23 (up from 1.5 per cent in 2021–22). All direct proceeds from the federal carbon pollution pricing system are returned to the jurisdictions where they were collected, as required under the Greenhouse Gas Pollution Pricing Act.
Other revenues are made up of three broad components: net income from enterprise Crown corporations and other government business enterprises; other program revenues from returns on investments, proceeds from the sales of goods and services, and other miscellaneous revenues; and foreign exchange revenues. Other revenues accounted for 7.5 per cent of total federal revenues in 2022–23 (down from 7.8 per cent in 2021–22).
Composition of Revenues for 2022–23 (Total: $447.8 billion)
Revenues Compared to 2021–22
Total revenues amounted to $447.8 billion in 2022–23, up $34.5 billion, or 8.4 per cent, from 2021–22. The following table compares revenues for 2022–23 to 2021–22.
| 2022–23 ($ millions) | 2021–22 ($ millions) | Net change | ||
|---|---|---|---|---|
| ($ millions) | (per cent) | |||
| Tax revenues | ||||
Income tax |
||||
Personal |
207,872 | 198,385 | 9,487 | 4.8 |
Corporate |
93,945 | 78,815 | 15,130 | 19.2 |
Non-resident |
13,187 | 10,789 | 2,398 | 22.2 |
Total |
315,004 | 287,989 | 27,015 | 9.4 |
Other taxes and duties |
||||
Goods and Services Tax |
45,962 | 46,165 | (203) | (0.4) |
Energy taxes |
5,657 | 5,355 | 302 | 5.6 |
Customs import duties |
6,057 | 5,237 | 820 | 15.7 |
Other excise taxes and duties |
6,548 | 5,923 | 625 | 10.6 |
Total |
64,224 | 62,680 | 1,544 | 2.5 |
| Total tax revenues | 379,228 | 350,669 | 28,559 | 8.1 |
| Employment Insurance premiums | 26,914 | 23,856 | 3,058 | 12.8 |
| Proceeds from the pollution pricing framework | 8,041 | 6,341 | 1,700 | 26.8 |
| Other revenues | 33,632 | 32,411 | 1,221 | 3.8 |
| Total revenues | 447,815 | 413,277 | 34,538 | 8.4 |
- Personal income tax revenues increased by $9.5 billion in 2022–23, or 4.8 per cent, reflecting a solid labour market performance, with continuing strong labour force participation and employment, as well as robust investment income growth.
- Corporate income tax revenues increased by $15.1 billion, or 19.2 per cent, reflecting strong growth in corporate profits, particularly in the resource sector.
- Non-resident income tax revenues are paid by non-residents on Canadian-sourced income. These revenues increased by $2.4 billion, or 22.2 per cent, reflecting strong investment income gains.
- Other taxes and duties increased by $1.5 billion, or 2.5 per cent. GST revenues decreased by $0.2 billion in
2022–23, or 0.4 per cent, reflecting the additional GST credit and the Grocery Rebate introduced by the government and decelerating consumer spending growth. Energy taxes increased by $0.3 billion, or 5.6 per cent, driven by an increase in motive fuel consumption. Customs import duties increased by $0.8 billion, or 15.7 per cent, reflecting growth in imports as well as the expiry of the Certain Goods Remission Order, which waived customs and import duties on medical supplies, including personal protective equipment, from May 5, 2020, to May 6, 2022. Other excise taxes and duties were up $0.6 billion, or 10.6 per cent, driven by a significant rebound in revenues from the Air Travellers Security Charge. - EI premium revenues increased by $3.1 billion, or 12.8 per cent, reflecting a higher premium rate and improving labour market conditions.
- Proceeds from the federal carbon pollution pricing framework increased by $1.7 billion, or 26.8 per cent, reflecting a higher carbon pollution price of $50 per tonne in 2022–23 versus $40 per tonne in the year prior.
- Other revenues increased by $1.2 billion, or 3.8 per cent, reflecting higher interest revenue and revenue from the sales of goods and services, which were partially offset by lower profits reported by enterprise Crown corporations.
The revenue ratio—revenues as a percentage of GDP—compares the total of all federal revenues to the size of the economy. This ratio is influenced by changes in statutory tax rates and by economic developments. The ratio stood at 16.1 per cent in 2022–23 (down from 16.5 per cent in 2021–22), as lower revenues from enterprise Crown corporations (particularly the Bank of Canada) offset some of the strength in the personal and corporate income tax streams.
Revenue Ratio

Expenses
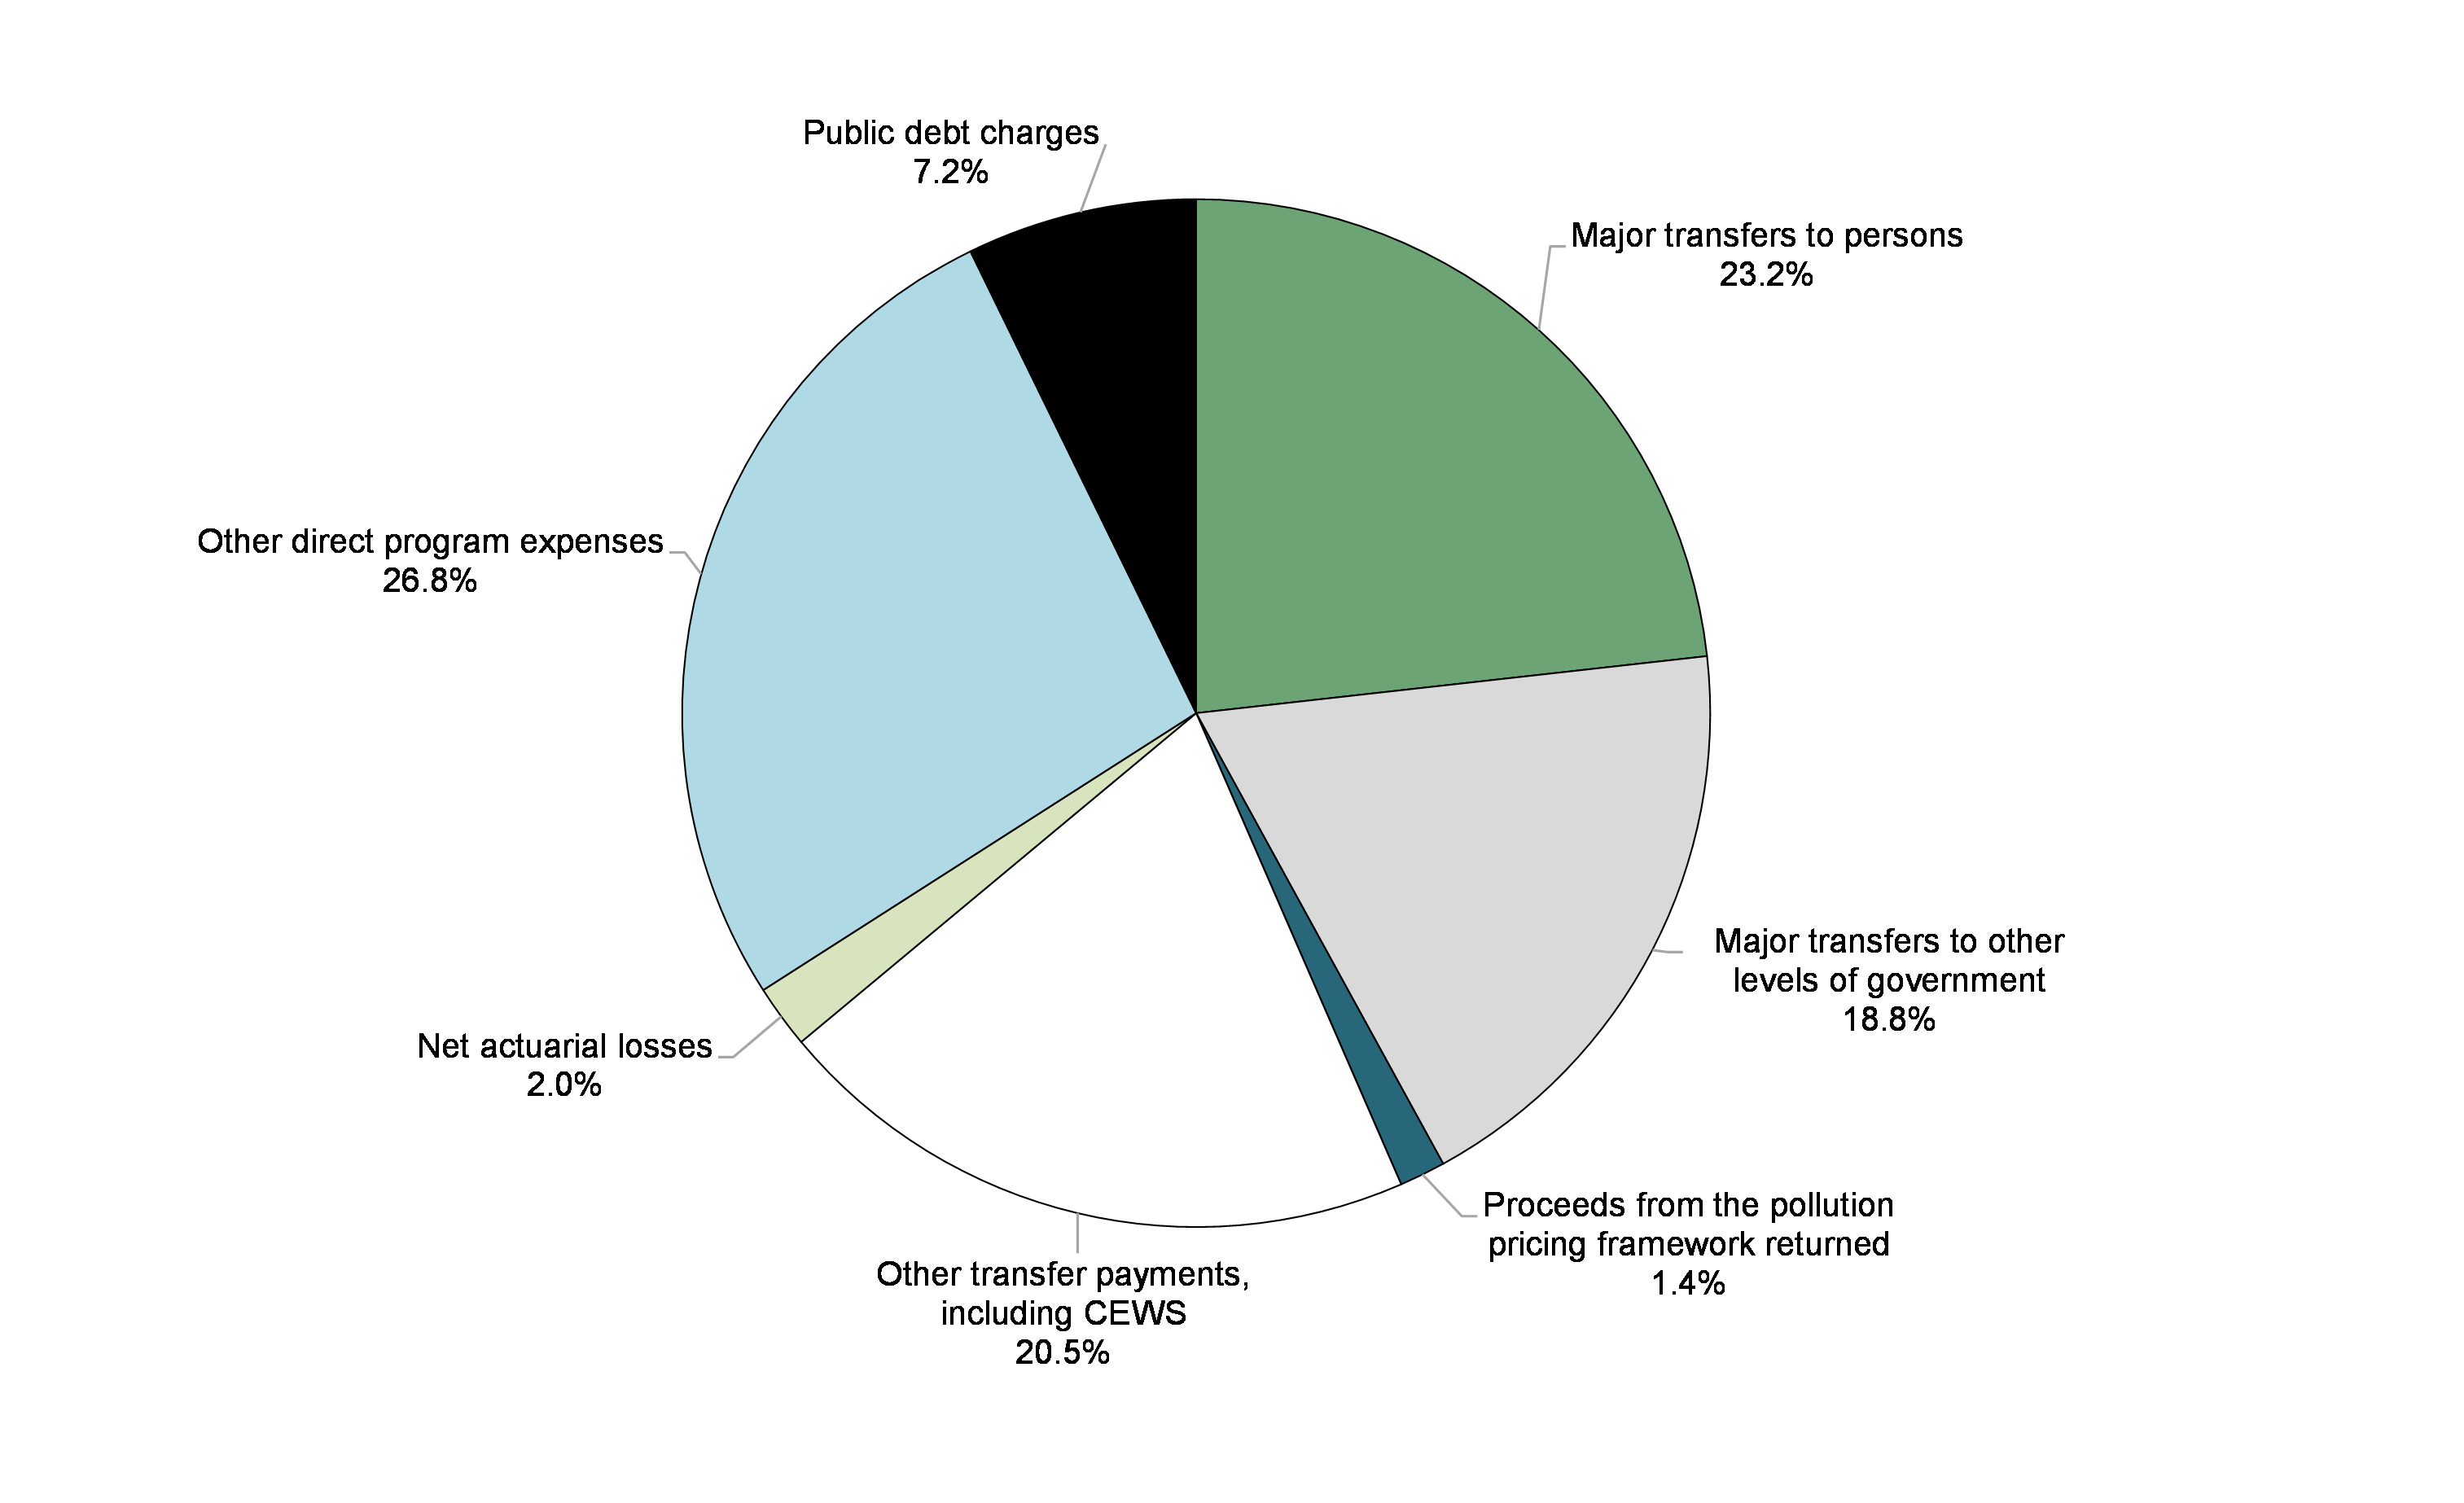
Federal expenses can be broken down into four main categories: transfer payments, which account for the majority of all federal spending, other direct program expenses, public debt charges, and net actuarial losses.
Transfer payments are classified under five categories:
- Major transfers to persons made up 23.2 per cent of total expenses (down from 28.1 per cent in 2021–22). This category consists of elderly benefits, EI benefits and support measures, children's benefits, and COVID-19 income support for workers (the Canada Emergency Response Benefit, or CERB, the Canada Recovery Benefit, the Canada Recovery Sickness Benefit, the Canada Recovery Caregiving Benefit, and the Canada Worker Lockdown Benefit) introduced under Canada's COVID-19 Economic Response Plan. Of this, COVID-19 income support for workers accounted for a 0.7 per cent decrease in total expenses in 2022–23 due to redeterminations of benefit overpayments, which are accounted for as a reduction in expenses (whereas it contributed 3.1 per cent of total expenses in 2021–22).
- Major transfers to other levels of government—which include the Canada Health Transfer, the Canada Social Transfer, Canada-wide early learning and child care transfers, health agreements with provinces and territories, fiscal arrangements (Equalization, transfers to the territories, a number of smaller transfer programs and the Quebec Abatement), and the Canada Community-Building Fund (previously the Gas Tax Fund) transfers—made up 18.8 per cent of total expenses in 2022–23 (up from 17.6 per cent in 2021–22).
- Proceeds from the federal carbon pollution pricing framework returned made up 1.4 per cent of expenses (up from 0.8 per cent in 2021–22). These transfers consist of payments that return direct proceeds from the federal carbon pollution pricing system to the jurisdictions where they were collected, as required under the Greenhouse Gas Pollution Pricing Act. For more information on the return of proceeds, please consult the Greenhouse Gas Pollution Pricing Act Annual Report to Parliament.
- The Canada Emergency Wage Subsidy (CEWS), which provided payments to eligible employers as part of the COVID-19 Economic Response Plan, ended in 2021–22. Redeterminations of previous claims reduced total expenses by 0.1 per cent in 2022–23 (compared to the program contributing 4.4 per cent of total expenses in 2021–22).
- Other transfer payments, which include transfers to Indigenous Peoples, assistance to farmers, students and businesses, support for research and development, and international assistance, made up 20.5 per cent of expenses (up from 17.6 per cent in 2021–22).
Other direct program expenses, which represent the operating expenses of the government's 134 departments, agencies, and consolidated Crown corporations and other entities, accounted for 26.8 per cent of total expenses in 2022–23 (up from 24.7 per cent in 2021–22).
Public debt charges made up 7.2 per cent of total expenses in 2022–23 (up from 4.9 per cent in 2021–22).
Net actuarial losses made up the remaining 2.0 per cent of total expenses in 2022–23 (unchanged from 2021–22).
Composition of Expenses for 2022–23 (Total: $483.1 billion)
Expenses Compared to 2021–22
Total expenses amounted to $483.1 billion in 2022–23, down $20.5 billion, or 4.1 per cent, from 2021–22. The following table compares total expenses for 2022–23 to 2021–22.
| 2022–23 ($ millions) | 2021–22 Restated1 ($ millions) |
Net change | ||
|---|---|---|---|---|
| ($ millions) | (per cent) | |||
| Major transfers to persons | ||||
| Elderly benefits | 69,392 | 60,774 | 8,618 | 14.2 |
| Employment Insurance and support measures | 21,836 | 38,923 | (17,087) | (43.9) |
| Children's benefits | 24,553 | 26,226 | (1,673) | (6.4) |
| COVID-19 income support for workers | (3,544) | 15,582 | (19,126) | (122.7) |
| Total | 112,237 | 141,505 | (29,268) | (20.7) |
| Major transfers to other levels of government | ||||
| Federal transfer support for health and other social programs | 63,079 | 60,607 | 2,472 | 4.1 |
| Fiscal arrangements and other transfers | 27,705 | 27,779 | (74) | (0.3) |
| Total | 90,784 | 88,386 | 2,398 | 2.7 |
| Proceeds from the pollution pricing framework returned | 6,996 | 3,814 | 3,182 | 83.4 |
| Direct program expenses | ||||
| Canada Emergency Wage Subsidy | (257) | 22,291 | (22,548) | (101.2) |
| Other transfer payments | 99,199 | 88,478 | 10,721 | 12.1 |
| Operating expenses | 129,596 | 124,445 | 5,151 | 4.1 |
| Total direct program expenses | 228,538 | 235,214 | (6,676) | (2.8) |
| Total program expenses, excluding net actuarial losses | 438,555 | 468,919 | (30,364) | (6.5) |
| Public debt charges | 34,955 | 24,487 | 10,468 | 42.7 |
| Total expenses, excluding net actuarial losses | 473,510 | 493,406 | (19,896) | (4.0) |
| Net actuarial losses | 9,627 | 10,186 | (559) | (5.5) |
| Total expenses | 483,137 | 503,592 | (20,455) | (4.1) |
1 Certain comparative figures have been restated. Information regarding this restatement can be found in Note 3 of the condensed consolidated financial statements. |
||||
- Major transfers to persons decreased by $29.3 billion in 2022–23, largely due to the end of temporary COVID-19 measures. COVID-19 income support for workers decreased $19.1 billion, reflecting the wind-down of these programs, as well as the redetermination of benefits. EI benefits and support measures decreased by $17.1 billion, or 43.9 per cent, largely reflecting the expiry of temporary measures to facilitate access to EI, and a lower unemployment rate. Elderly benefits increased by $8.6 billion, or 14.2 per cent, reflecting growth in the number of recipients and changes in consumer prices, to which benefits are fully indexed. In addition, as announced in Budget 2021 and implemented in July 2022, the Old Age Security pension has permanently increased by 10 per cent for seniors aged 75 and over. Children's benefits decreased by $1.7 billion, or 6.4 per cent, largely reflecting the temporary Canada Child Benefit young child supplement in 2021–22.
- Major transfers to other levels of government increased by $2.4 billion in 2022–23, primarily reflecting $3.7 billion in legislated growth under the Canada Health Transfer, the Canada Social Transfer, Equalization transfers and Territorial Formula Financing and a $1.5-billion increase in Canada-wide early learning and child care transfers. These increases were partly offset by a one-time transfer in 2021–22 of $1.0 billion under the Safe Long-term Care Fund and a $1.2-billion increase in the Quebec Abatement in 2022–23, which is accounted for as a reduction in transfer payments.
- Proceeds returned from the federal carbon pollution pricing framework increased by $3.2 billion, or 83.4 per cent, reflecting the change in the delivery of the Climate Action Incentive payment, from an annual basis through personal income tax returns to a quarterly benefit, as well as an increase in Climate Action Incentive payment amounts.
- Direct program expenses decreased by $6.7 billion in 2022–23, or 2.8 per cent:
- The CEWS decreased by $22.5 billion in 2022–23, reflecting the wind-down of the program in October 2021 and redeterminations of previous claims in 2022–23.
- Other transfer payments increased by $10.7 billion, or 12.1 per cent, in 2022–23, in large part reflecting revised estimates for claims and contingent liabilities and allowances on loans, as well as increased international assistance. These increases were offset in part by the end of temporary COVID-19 programs and lower provisions for disaster assistance relative to provisions recorded in 2021–22 for flooding, wildfires, and storms in British Columbia.
- Operating expenses of departments, agencies, and consolidated Crown corporations and other entities, excluding net actuarial losses, increased by $5.2 billion, or 4.1 per cent, largely driven by revised estimates for claims and contingent liabilities, as well as increased personnel costs, partly offset by lower spending on the procurement and distribution of COVID-19 vaccines, therapeutics, medical supplies and equipment, and rapid tests.
- Public debt charges increased by $10.5 billion, or 42.7 per cent, largely reflecting higher interest rates on market debt and pension and benefit obligations.
- Net actuarial losses, which reflect changes in the value of the government's obligations and assets for public sector pensions and other employee and veteran future benefits recorded in previous fiscal years, decreased $0.6 billion, or 5.5 per cent, largely reflecting the end of the amortization period for certain prior years' net actuarial losses in 2021–22.
The expense ratio—expenses as a percentage of GDP—compares the total of all federal expenses to the size of the economy. This ratio is influenced by policy actions, economic developments, and changes in interest rates. The ratio stood at 17.4 per cent in 2022–23 (down from 20.1 per cent in 2021–22), largely reflecting the wind-down of temporary COVID-19 response measures.
Expense Ratio

Supporting Ukraine
Following Russia's full-scale invasion of Ukraine, Canada has supported the people of Ukraine as they fight for their sovereignty, democracy, and territorial integrity. Since January 2022, Canada has committed over $8.9 billion in financial, military, humanitarian, development, security and stabilization, and immigration assistance to Ukraine. This assistance has included:
- $4.85 billion in loans to the Government of Ukraine to help deliver essential services to Ukrainians, including proceeds from the world-first $500 million Ukraine Sovereignty Bond, which allowed Canadians to support Ukraine directly;
- A €36.5 million (approximately $50 million) loan guarantee through the European Bank for Reconstruction and Development to facilitate support to Ukraine's state-owned energy company, Naftogaz;
- Over $1.8 billion in military aid and equipment donations, including for armoured vehicles; a National Advanced Surface-to-Air Missile System; 39 armoured combat support vehicles; four M777 howitzers; anti-tank weapons and small arms;
- The continuation of the Canadian Armed Forces' Operation UNIFIER, which has trained more than 35,000 members of Ukraine's security forces since 2015;
- Over $1 billion in immigration measures. Since March 2022, Canada has become a safe haven for over 171,000 Ukrainian citizens and their family members through the Canada-Ukraine authorization for emergency travel initiative. On March 22, 2023, the federal government announced that it was extending application intake for the Canada-Ukraine authorization for emergency travel to July 15, 2023, giving approved clients until March 31, 2024, to arrive in Canada;
- Over $352 million in humanitarian assistance;
- $115 million in grant assistance to repair Kyiv's power grid, provided through the World Bank Group Ukraine Relief, Recovery, Reconstruction and Reform Trust Fund. This contribution makes Canada the only G7 country thus far to meet a June 2022 G7 Leaders' commitment to explore opportunities to use revenues collected through tariff measures against Russia to assist Ukraine;
- $147 million in development assistance, which has supported the resilience of Ukraine's government institutions and civil society organizations and women's rights organizations, women's political and economic empowerment, policy, electoral and judicial reform, and provided grain storage solutions for farmers;
- Over $105 million in support for humanitarian demining operations, advancing accountability for human rights violations, supporting Ukrainian security sector institutions, cybersecurity, securing Ukraine's nuclear and radiological materials, and other peace and stability initiatives; and,
- Temporary duty relief for Ukrainian imports.
Federal Debt
The federal debt (accumulated deficit) is the difference between the government's total liabilities and its total assets. With total liabilities of $1.9 trillion, financial assets of $642.3 billion and non-financial assets of $109.7 billion, the federal debt stood at $1,173.0 billion at March 31, 2023, up $33.0 billion from March 31, 2022.
The $33.0-billion increase in the federal debt reflects the 2022–23 budgetary deficit of $35.3 billion and a $2.6-billion increase to the opening balance of the federal debt in 2022-23 on implementation of the new financial instruments standards, offset in part by $4.8 billion in net remeasurement gains.
| 2022–23 | 2021–22 Restated1 |
Net change | |
|---|---|---|---|
| Federal debt at beginning of year | (1,142,538) | (1,054,125) | (88,413) |
| Change in accumualted operating deficit | |||
Annual operating deficit |
(35,322) | (90,315) | 54,993 |
Other comprehensive income |
- | 4,465 | (4,465) |
| (35,322) | (85,850) | 50,528 | |
| Net remeasurement gains (losses) for the year | 4,847 | - | 4,847 |
| Federal debt at end of year | (1,173,013) | (1,139,975) | (33,038) |
1 Certain comparative figures have been restated. Information regarding this restatement can be found in Note 3 of the condensed consolidated financial statements. |
|||
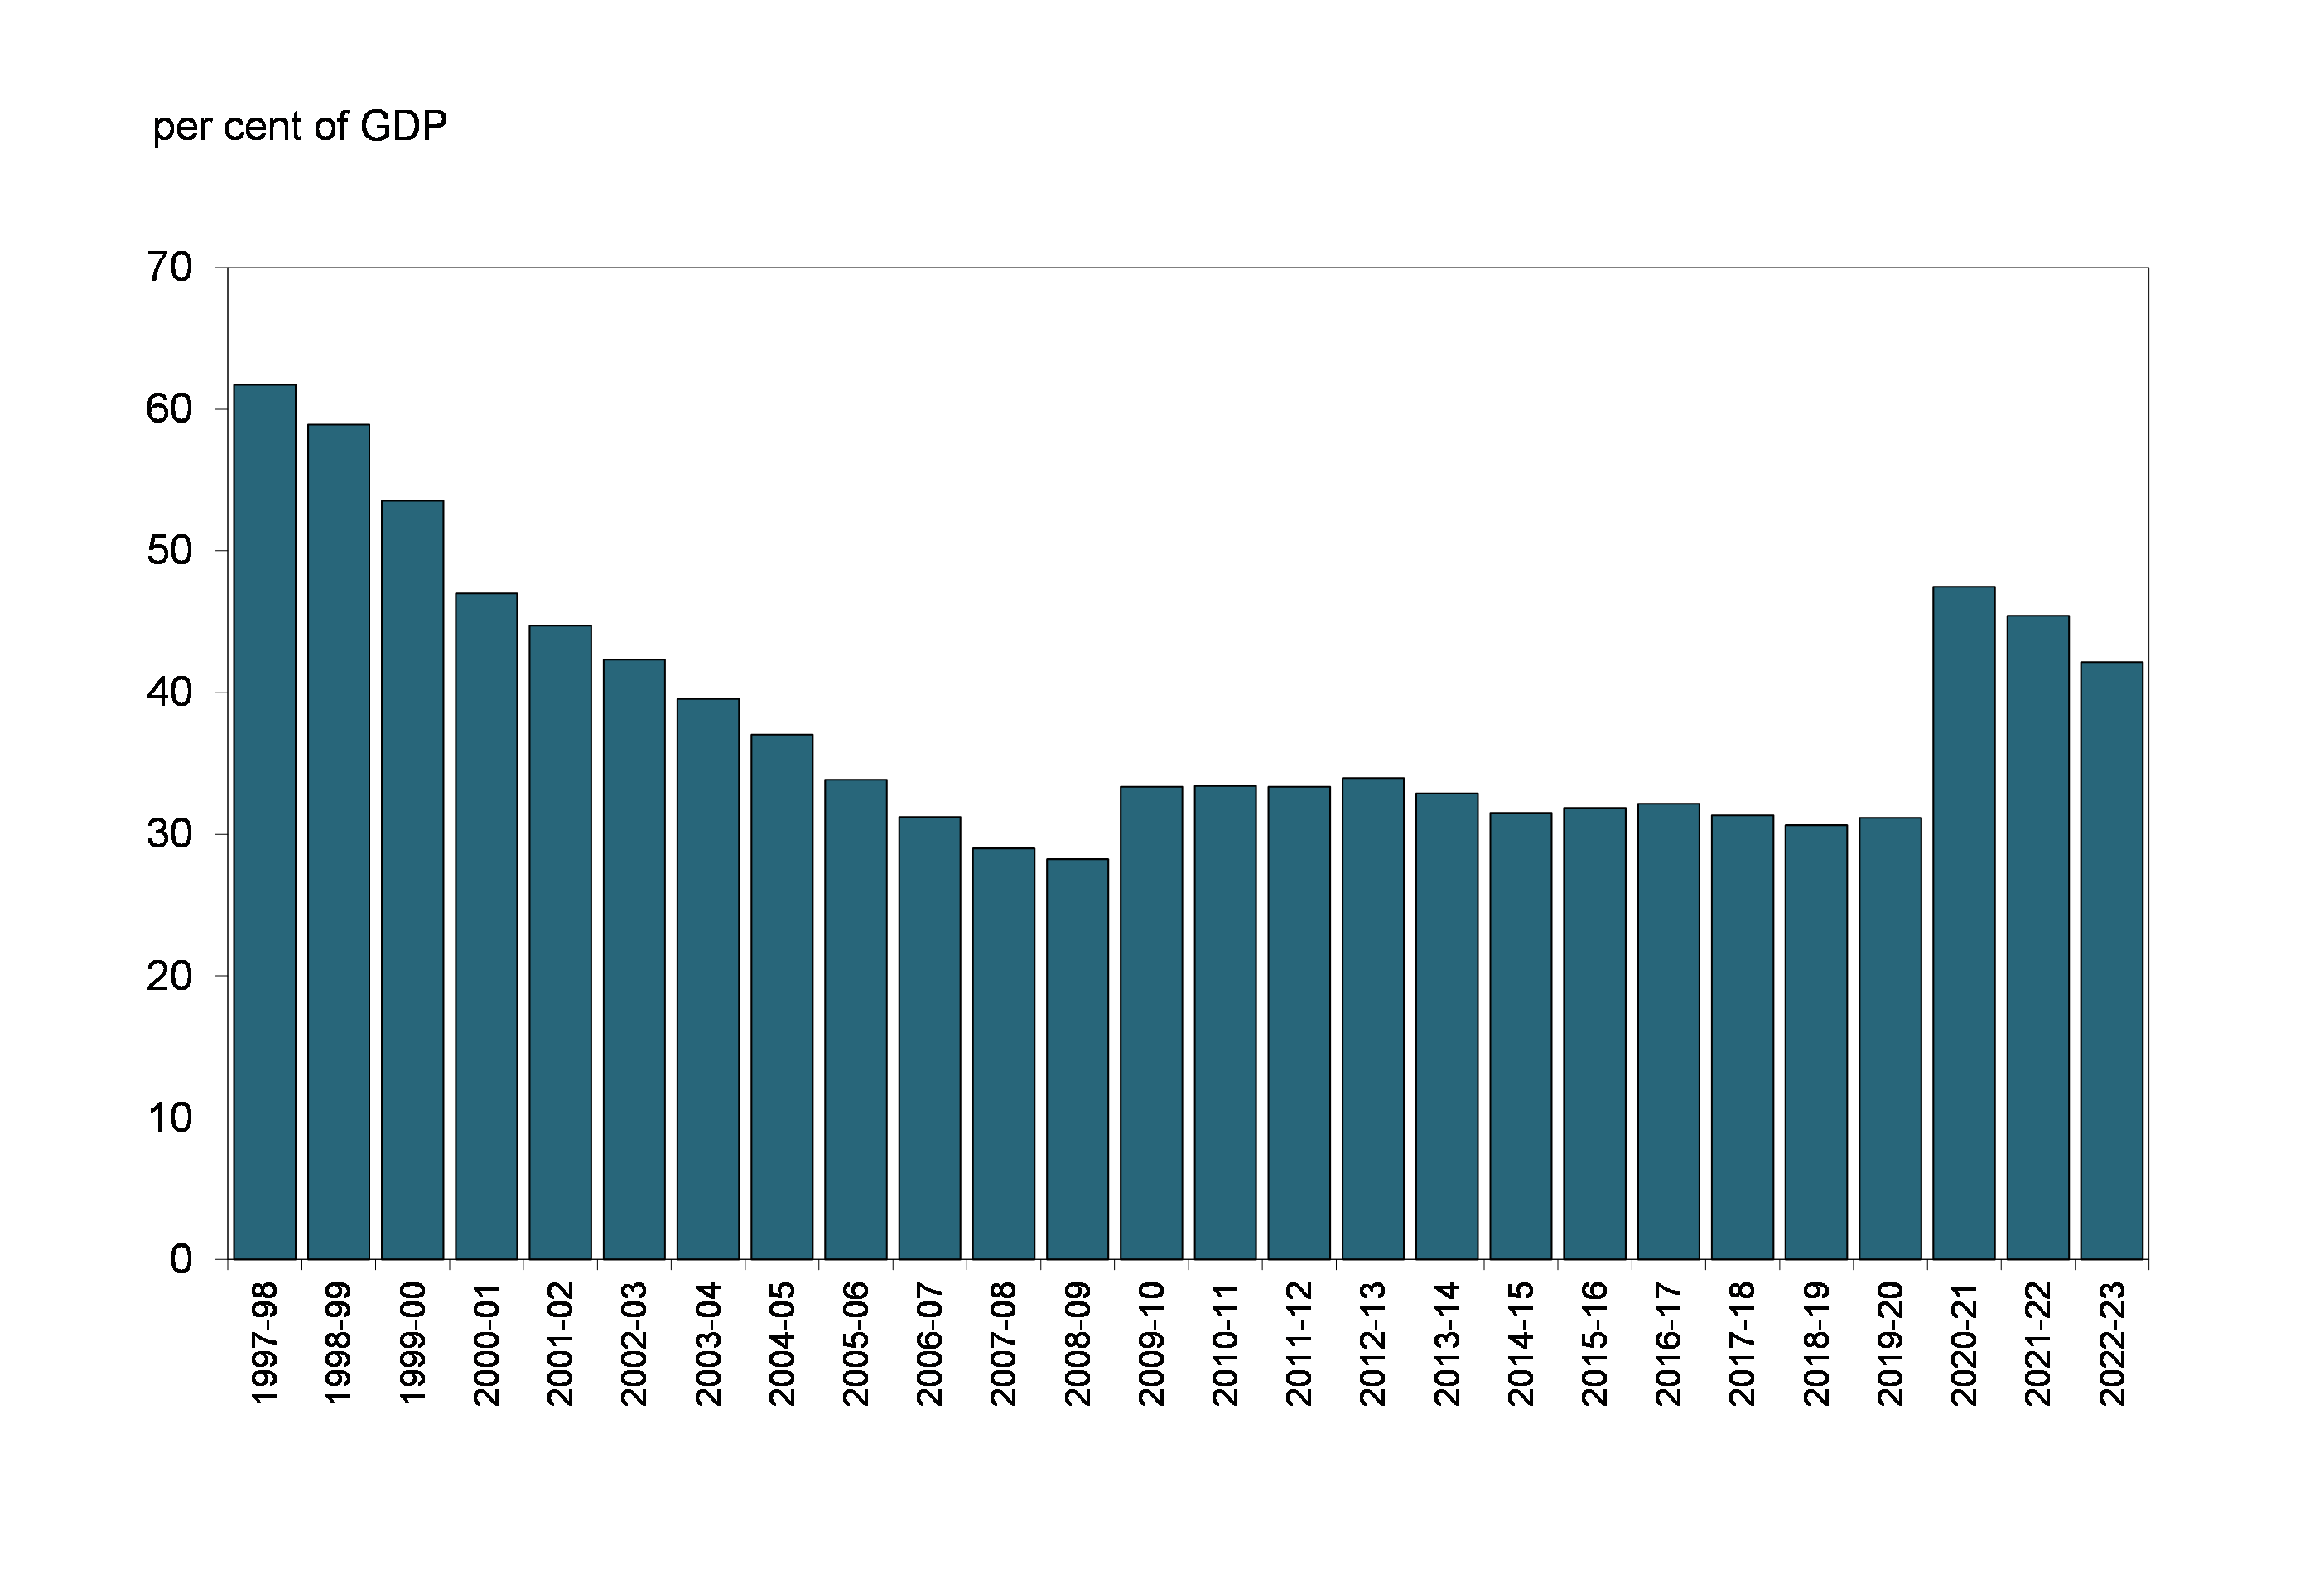
The following chart shows the federal debt since 1997–98. The federal debt stood at 42.2 per cent of GDP in 2022–23, down from 45.4 per cent in 2021–22. The government is committed to reducing the accumulated deficit-to-GDP ratio over the medium term as its key fiscal anchor.
Federal Debt (Accumulated Deficit)
| 2022–23 | 2021–22 Restated1 |
|
|---|---|---|
| Liabilities | ||
| Accounts payable and accrued liabilities | 259.4 | 262.5 |
| Interest-bearing debt | ||
Unmatured debt |
1,265.0 | 1,250.0 |
Pensions and other employee future benefits |
344.4 | 327.4 |
Other liabilities |
7.3 | 7.7 |
Total interest-bearing debt |
1,616.8 | 1,585.0 |
| Foreign exchange accounts liabilities | 44.2 | 42.3 |
| Derivatives | 4.7 | 2.5 |
| Total liabilities | 1,925.0 | 1,892.3 |
| Financial assets | ||
| Cash and other accounts receivable | 62.5 | 112.5 |
| Taxes receivable | 181.0 | 167.6 |
| Foreign exchange accounts assets | 169.4 | 146.3 |
| Derivatives | 3.3 | 5.0 |
| Loans, investments and advances | 213.1 | 207.0 |
| Public sector pension assets | 13.0 | 9.2 |
| Total financial assets | 642.3 | 647.5 |
| Net debt | (1,282.8) | (1,244.7) |
| Non-financial assets | ||
| Tangible capital assets | 97.3 | 92.8 |
| Inventories | 9.4 | 9.0 |
| Prepaid expenses | 3.0 | 3.0 |
| Total non-financial assets | 109.7 | 104.8 |
| Federal debt (accumulated deficit) | (1,173.0) | (1,140.0) |
|
Note: Numbers may not add due to rounding. 1 Certain comparative figures have been restated. In addition, certain comparative figures have been reclassified to conform to the current year's presentation. Additional information can be found in Note 3 of the condensed consolidated financial statements. |
||
Assets
The government's assets consist of financial assets (cash and other accounts receivable, taxes receivable, foreign exchange accounts assets, derivatives, loans, investments and advances, and public sector pension assets) and non-financial assets (tangible capital assets, inventories, and prepaid expenses).
At March 31, 2023, financial assets amounted to $642.3 billion, down $5.3 billion from March 31, 2022. The decrease reflects decreases in cash and accounts receivable and derivatives, offset in part by increases in foreign exchange accounts assets, loans, investments and advances, and public sector pension assets.
- At March 31, 2023, cash and accounts receivable totalled $243.5 billion, down $36.5 billion from March 31, 2022. Within this component, cash and cash equivalents decreased by $51.8 billion. The government maintained higher cash balances during the COVID-19 pandemic to be prepared for uncertain spending needs such as emergency supports for people and businesses. These cash balances were reduced during 2022–23 to offset some of the government's financial requirements, as part of a general shift in the return to normal government operations. The balance of cash and cash equivalents at March 31, 2023, includes $20.0 billion that has been designated as a deposit held with respect to prudential liquidity management. Other accounts receivable increased by $1.9 billion, largely reflecting an increase in cash held as collateral support under International Swaps and Derivatives Association master agreements in respect of outstanding cross-currency swap arrangements, as well as a net increase in COVID-19 benefit overpayments receivable as a result of redeterminations during 2022–23. These increases were offset in part by the receipt during 2022–23 of dividends receivable from Canada Mortgage and Housing Corporation at March 31, 2022, and a decrease in dividends receivable from the Bank of Canada due to its net losses in 2022–23.
- Taxes receivable increased by $13.4 billion during 2022–23 to $181.0 billion, reflecting growth in tax revenues.
- Loans, investments and advances increased by $6.1 billion in 2022–23.
- Loans, investments and advances in enterprise Crown corporations and other government business enterprises increased by $7.3 billion in 2022–23. Investments in enterprise Crown corporations and other government business enterprises decreased $4.9 billion, largely reflecting $8.7 billion in net share repurchases and distributions of contributed surplus and $1.7 billion in dividends paid to the government, offset in part by $3.9 billion in net profits and $1.6 billion in other comprehensive income recorded by these entities during 2022–23. Net loans and advances to enterprise Crown corporations and other government business enterprises were up $12.2 billion. This growth primarily reflects a $12.3-billion increase in loans to Crown corporations under the consolidated borrowing framework to finance the operational needs of the Business Development Bank of Canada, Canada Mortgage and Housing Corporation and Farm Credit Canada.
- Other loans, investments and advances decreased by $1.3 billion, from $63.3 billion to $62.1 billion, as a decrease in Canada Emergency Business Account loans offset increases in other loans, investments and advances.
- Public sector pension assets increased by $3.8 billion, largely reflecting an increase in net assets under the Public Service Pension Fund, which pertains to service accrued on or after April 1, 2000, that falls within the Income Tax Act limits under the Public Service Superannuation Act.
- Foreign exchange accounts assets increased by $23.1 billion in 2022–23, totalling $169.4 billion at March 31, 2023, due mainly to an increase in net advances to the Exchange Fund Account and appreciation in the value of foreign currency denominated investments due to exchange rate movements. Note that starting in 2022–23, foreign exchange accounts liabilities, which were previously netted against foreign exchange accounts assets, are presented separately as part of the government's liabilities.
- Derivatives represent financial contracts whose value is derived by reference to a rate, index, or underlying asset. The government uses derivatives for hedging purposes to manage various types of financial risk. With the adoption of new financial instruments standards in 2022–23, derivatives are measured at fair value and presented separately in the government's financial statements. Derivatives estimated to result in a net inflow of resources if terminated at March 31 are presented as assets, while derivatives estimated to require a net outflow of resources if terminated on March 31 are presented as liabilities. Derivative assets decreased by $1.7 billion to $3.3 billion at March 31, 2023, from a March 31, 2022 carrying value of $5.0 billion, largely reflecting the transition to a fair value measurement basis and changes in foreign exchange rates during 2022–23.
At March 31, 2023, non-financial assets stood at $109.7 billion, up $5.0 billion from a year earlier. This growth primarily relates to a $4.6-billion increase in tangible capital assets, largely reflecting an increase in assets under construction and a net increase in vehicles, a $0.4-billion increase in inventories, primarily due to additional procurement of COVID-19 therapeutics and other medical countermeasures, and a $44-million increase in prepaid expenses.
Liabilities
The government's liabilities consist of accounts payable and accrued liabilities, interest-bearing debt, foreign exchange accounts liabilities, and derivatives.
At March 31, 2023, accounts payable and accrued liabilities totalled $259.4 billion, down $3.1 billion from March 31, 2022. This decrease reflects a large decline in other accounts payable and accrued liabilities as well as smaller decreases in deferred revenue and environmental liabilities and asset retirement obligations, offset in part by growth in provisions for contingent liabilities and amounts payable related to tax.
- Amounts payable related to tax increased by $6.3 billion in 2022–23, from $78.5 billion at March 31, 2022, to $84.7 billion at March 31, 2023. This increase largely reflects higher refundable GST/HST credit returns and the accrual of the Grocery Rebate announced in Budget 2023, as well as higher accrued payables for individual income tax, offset in part by lower accrued payables for corporate income tax.
- Provisions for contingent liabilities increased by $22.6 billion, largely reflecting increased provisions for claims and litigation, including the revised final settlement for compensation related to the First Nations Child and Family Services program and Jordan's Principle and increases in provisions for specific claims and comprehensive land claims.
- Environmental liabilities and asset retirement obligations decreased by $0.8 billion in 2022–23, largely reflecting revisions to estimated provisions for asset retirement obligations, including the impact of year-over-year changes in discount rates used to estimate the present value of these obligations, as well as remediation activities undertaken in 2022–23.
- Deferred revenue decreased by $1.1 billion in 2022–23, largely reflecting the amortization of proceeds from prior years' spectrum auctions.
- Other accounts payable and accrued liabilities decreased by $30.1 billion in 2022–23. Within this component, liabilities under provincial, territorial, and Indigenous tax agreements decreased by $20.9 billion, largely reflecting underestimated amounts of personal and corporate income tax for prior years being paid to provinces and territories in 2022–23, as well as the timing differences in payments to provinces and territories. Accounts payable decreased by $11.0 billion due to a number of factors including a decrease in the amount owing to the Canada Pension Plan (CPP) at year end for CPP contributions collected by the government; a decrease in accrued liabilities for disaster assistance due to payments made during 2022–23 and changes in estimates; payments made under various claims during the year, including under the First Nations Drinking Water Settlement; and the payment of various transfers to provinces and territories accrued at the end of 2021–22. These decreases were offset in part by a $1.8-billion increase in accrued salaries and benefits.
Interest-bearing debt includes unmatured debt, or debt issued on the credit markets, pension and other future benefit liabilities, and other liabilities. At March 31, 2023, interest-bearing debt totalled $1,616.8 billion, up $31.7 billion from March 31, 2022. Within interest-bearing debt, unmatured debt increased by $15.1 billion and liabilities for other employee and veteran future benefits increased by $18.2 billion, while liabilities for public sector pensions decreased by $1.2 billion and other liabilities decreased by $0.4 billion.
The $15.1-billion increase in unmatured debt is largely attributable to a $15.3-billion increase in market debt and related unamortized discounts and premiums, reflecting increased borrowings to meet the government's financial requirements.
Foreign exchange accounts liabilities include Special Drawing Rights allocations and notes payable to the International Monetary Fund (IMF). Starting in 2022–23, foreign exchange accounts liabilities are presented separately from foreign exchange accounts assets. The government's foreign exchange accounts liabilities at March 31, 2023, stood at $44.2 billion, up $1.9 billion from a year earlier primarily due to foreign exchange rate movements, which resulted in the liabilities appreciating against the Canadian dollar.
Derivative liabilities increased $2.2 billion in 2022–23 to $4.7 billion at March 31, 2023, from a March 31, 2022 carrying value of $2.5 billion, largely reflecting the transition to a fair value measurement basis and changes in foreign exchange rates during 2022–23.
The interest ratio (public debt charges as a percentage of revenues) shows the proportion of every dollar of revenue that is needed to pay interest and is therefore not available to pay for program initiatives. The interest ratio had been decreasing in recent years, falling from a peak of 37.6 per cent in 1990–91 to 5.9 per cent in 2021–22. The ratio increased to 7.8 per cent in 2022–23, reflecting an increase in interest rates. This means that, in 2022–23, the government spent approximately 8 cents of every revenue dollar on servicing the public debt.
Interest Ratio

International Comparisons of Government Debt
Jurisdictional responsibility (between central, state, and local governments) for government programs differs among countries. As a result, international comparisons of government fiscal positions are made on a total government, National Accounts basis. For Canada, total government net debt includes that of the federal, provincial/territorial, and local governments, as well as the net assets held in the CPP and Quebec Pension Plan (QPP).
Canada Has the Lowest Total Government Net Debt Burden Among G7 Countries
G7 Total Government Net Debt, 2022

Canada's total government net debt-to-GDP ratio stood at 13.9 per cent in 2022, according to the IMF. This is the lowest level among G7 countries, which the IMF estimates will record an average net debt of 94.2 per cent of GDP in that same year.
The following table provides a reconciliation between the Government of Canada's federal debt-to-GDP ratio and Canada's total government net debt-to-GDP ratio used for international net debt comparison purposes. Importantly, the latter includes the net debt of the federal, provincial, territorial, and local governments, as well as the net assets held by the CPP and QPP and excludes liabilities for public sector pensions and other employee future benefits. Given significant inconsistencies across countries in the accounting treatment of unfunded liabilities for public sector pensions and other employee future benefits, international organizations remove them from debt estimates for countries that include them (such as Canada) to facilitate international comparability.
| (per cent of GDP) | ||
|---|---|---|
| Federal debt | 42.2 | |
| Add: Non-financial assets | 3.9 | |
| Net debt (Public Accounts basis) | 46.1 | |
| Less: | Liabilities for public sector pensions | (6.0) |
| Liabilities for other future benefits | (6.4) | |
| National Accounts/Public Accounts methodological differences and timing adjustments1 | (6.8) | |
| Total federal net debt (National Accounts basis) | 26.9 | |
| Add: | Net debt of provincial/territorial and local governments | 10.7 |
| Less: | Net assets of the CPP/QPP | (23.4) |
| Total government net debt2 | 14.2 | |
|
Note: Numbers may not add due to rounding. Sources: Statistics Canada and Public Accounts of Canada. 1 Includes timing differences (National Accounts data are as of December 31), differences in the universe covered by each accounting system, and differences in accounting treatments of various transactions such as capital gains. 2 The net debt figure has been revised by Statistics Canada since the publication of the IMF's April 2023 Fiscal Monitor, which is the source for the chart "G7 Total Government Net Debt, 2022". Net debt has been revised from 13.9 per cent to 14.2 per cent. |
||
Financial Source/Requirement
The budgetary balance is the most comprehensive measure of the federal government's fiscal results. It is presented on an accrual basis of accounting, recording government expenses when they are incurred, regardless of when the cash payment is made, and recording tax revenues when earned, regardless of when the cash is received.
In contrast, the financial source/requirement measures the difference between cash coming in to the government and cash going out. It differs from the budgetary balance in that it includes cash transactions in loans, investments and advances, public sector pensions and other employee future benefits, other specified purpose accounts, foreign exchange activities, and changes in other financial assets, liabilities, and non-financial assets. These activities are included as part of non-budgetary transactions.
Non-budgetary transactions also include adjustments for the effects of non-cash items included in the budgetary balance and for any accruals of past or future cash receipts or payments. Examples of non-cash items include amortization of tangible capital assets, pension and other employee future benefit expenses not funded in the period, and the recognition of previously deferred revenue.
Non-budgetary transactions resulted in a net requirement for funds of $30.8 billion in 2022–23, compared to a net source of $5.9 billion in 2021–22. The year-over-year change in the financial source/requirement from non-budgetary transactions largely reflects year-over-year differences in the timing of cash payments and receipts under accounts payable and accounts receivable.
With a budgetary deficit of $35.3 billion and a financial requirement from non-budgetary transactions of $30.8 billion, there was a total financial requirement of $66.2 billion in 2022–23, compared to a financial requirement of $84.4 billion in 2021–22 (Table 9).
The government financed this financial requirement of $66.2 billion by reducing its cash balances by $51.8 billion and by increasing unmatured debt by $14.3 billion. Cash balances at the end of March 2023 stood at $49.0 billion.
| 2022–23 | 2021–22 Restated1 | |
|---|---|---|
| Deficit for the year | (35.3) | (90.3) |
| Non-budgetary transactions | ||
Pensions and other accounts |
||
Public sector pension liabilities |
(1.2) | (1.1) |
Other employee and veteran future benefit liabilities |
18.2 | 15.5 |
Other liabilities |
(0.4) | 1.0 |
Public sector pension assets |
(3.8) | (2.9) |
Total |
12.8 | 12.5 |
| Non-financial assets | (5.0) | (2.7) |
| Loans, investments and advances | (4.5) | (23.3) |
| Other transactions | ||
Accounts payable, receivable, accruals and allowances |
(18.4) | 33.5 |
Foreign exchange activities and derivatives |
(15.8) | (14.1) |
Total |
(34.2) | 19.4 |
| Total non-budgetary transactions | (30.8) | 5.9 |
| Financial requirement | (66.2) | (84.4) |
| Net change in financing activities | ||
Marketable bonds (Canadian currency) |
1.0 | 154.1 |
Treasury bills |
12.0 | (31.8) |
Retail debt |
- | (0.3) |
Other |
1.3 | (0.9) |
Total |
14.3 | 121.1 |
| Change in cash balances | (51.8) | 36.7 |
| Cash at end of year | 49.0 | 100.8 |
|
Note: Numbers may not add due to rounding. 1 Certain comparative figures have been restated. In addition, certain comparative figures have been reclassified to conform to the current year's presentation. Additional information can be found in Note 3 of the condensed consolidated financial statements. |
||
Report of the Independent Auditor on the Condensed Consolidated Financial Statements
To the Minister of Finance
Opinion
The condensed consolidated financial statements, which comprise the condensed consolidated statement of financial position as at 31 March 2023, the condensed consolidated statement of operations and accumulated operating deficit, condensed consolidated statement of remeasurement gains and losses, condensed consolidated statement of change in net debt and condensed consolidated statement of cash flow for the year then ended, and related notes, are derived from the audited consolidated financial statements of the Government of Canada for the year ended 31 March 2023.
In our opinion, the accompanying condensed consolidated financial statements are a fair summary of the audited consolidated financial statements of the Government of Canada, on the basis described in Note 1.
Condensed Consolidated Financial Statements
The condensed consolidated financial statements do not contain all the disclosures required by Canadian public sector accounting standards. Reading the condensed consolidated financial statements and the auditor's report thereon, therefore, is not a substitute for reading the audited consolidated financial statements of the Government of Canada and the auditor's report thereon.
The Audited Consolidated Financial Statements of the Government of Canada and Our Report Thereon
We expressed an unmodified audit opinion on the audited consolidated financial statements of the Government of Canada in our report dated 7 September 2023. That report also includes the communication of key audit matters. Key audit matters are those matters that, in our professional judgment, were of most significance in our audit of the consolidated financial statements of the current period.
Management's Responsibility for the Condensed Consolidated Financial Statements
Management is responsible for the preparation of the condensed consolidated financial statements on the basis described in Note 1.
Auditor's Responsibility
Our responsibility is to express an opinion on whether the condensed consolidated financial statements are a fair summary of the audited consolidated financial statements of the Government of Canada based on our procedures, which were conducted in accordance with Canadian Auditing Standard (CAS) 810, Engagements to Report on Summary Financial Statements.
Original signed by
Karen Hogan, FCPA
Auditor General of Canada
Ottawa, Canada
7 September 2023
Condensed Consolidated Financial Statements of the Government of Canada
The fundamental purpose of these condensed consolidated financial statements is to provide an overview of the financial affairs and resources for which the Government is responsible under authority granted by Parliament. Responsibility for the integrity and objectivity of these statements rests with the Government.
| 2023 Budget (Note 4) |
2023 Actual | 2022 Actual Restated (Note 3) |
|
|---|---|---|---|
| Revenues | |||
| Income tax revenues | 276,619 | 315,004 | 287,989 |
| Other taxes and duties | 65,496 | 64,224 | 62,680 |
| Employment insurance premiums | 25,801 | 26,914 | 23,856 |
| Proceeds from the pollution pricing framework | 8,221 | 8,041 | 6,341 |
| Other revenues | 32,254 | 33,632 | 32,411 |
| Total revenues | 408,391 | 447,815 | 413,277 |
| Expenses | |||
| Transfer payments | |||
Old age security benefits and related payments |
68,238 | 69,392 | 60,774 |
Major transfer payments to other levels of government |
89,827 | 90,784 | 88,386 |
Employment insurance and support measures |
31,270 | 21,836 | 38,923 |
Children's benefits |
25,166 | 24,553 | 26,226 |
COVID-19 income support for workers |
410 | (3,544) | 15,582 |
Canada emergency wage subsidy |
– | (257) | 22,291 |
Proceeds from the pollution pricing framework returned |
8,046 | 6,996 | 3,814 |
Other transfer payments |
86,263 | 99,199 | 88,478 |
Total transfer payments |
309,220 | 308,959 | 344,474 |
| Other expenses, excluding net actuarial losses | 116,173 | 129,596 | 124,445 |
| Total program expenses, excluding net actuarial losses | 425,393 | 438,555 | 468,919 |
| Public debt charges | 26,904 | 34,955 | 24,487 |
| Total expenses, excluding net actuarial losses | 452,297 | 473,510 | 493,406 |
| Annual operating deficit before net actuarial losses | (43,906) | (25,695) | (80,129) |
Net actuarial losses |
(8,923) | (9,627) | (10,186) |
| Annual operating deficit | (52,829) | (35,322) | (90,315) |
| Accumulated operating deficit at beginning of year | (1,148,296) | (1,148,296) | (1,054,125) |
| Other comprehensive income | – | – | 4,465 |
| Accumulated operating deficit at end of year | (1,201,125) | (1,183,618) | (1,139,975) |
The accompanying notes are an integral part of these condensed consolidated financial statements. |
|||
| 2023 | 2022 Restated (Note 3) |
|
|---|---|---|
| Liabilities | ||
| Accounts payable and accrued liabilities | 259,440 | 262,529 |
| Interest-bearing debt | ||
Unmatured debt |
1,265,040 | 1,249,957 |
Pensions and other future benefits |
344,374 | 327,371 |
Other liabilities |
7,339 | 7,707 |
Total interest-bearing debt |
1,616,753 | 1,585,035 |
| Foreign exchange accounts liabilities | 44,151 | 42,252 |
| Derivatives | 4,689 | 2,471 |
| Total liabilities | 1,925,033 | 1,892,287 |
| Financial assets | ||
| Cash and accounts receivable | 243,520 | 280,052 |
| Foreign exchange accounts assets | 169,390 | 146,283 |
| Derivatives | 3,260 | 4,974 |
| Loans, investments and advances | 213,110 | 207,031 |
| Public sector pension assets | 12,996 | 9,203 |
| Total financial assets | 642,276 | 647,543 |
| Net debt | (1,282,757) | (1,244,744) |
| Non-financial assets | ||
| Tangible capital assets | 97,337 | 92,785 |
| Other | 12,407 | 11,984 |
| Total non-financial assets | 109,744 | 104,769 |
| Accumulated deficit | (1,173,013) | (1,139,975) |
| Accumulated deficit is comprised of: | ||
| Accumulated operating deficit | (1,183,618) | (1,139,975) |
| Accumulated remeasurement gains (losses) | 10,605 | – |
| (1,173,013) | (1,139,975) | |
| Contingent liabilities (Note 5) Contractual obligations and contractual rights (Note 6) |
||
The accompanying notes are an integral part of these condensed consolidated financial statements. Certain comparative figures have been reclassified to conform to the current year's presentation. |
||
| 2023 | |
|---|---|
| Accumulated remeasurement gains (losses) at beginning of year | 5,758 |
Net unrealized gains (losses) |
3,228 |
Amounts reclassified during the year to the Condensed Consolidated Statement of Operations and Accumulated Operating Deficit |
(9) |
Other comprehensive income of enterprise Crown corporations |
1,628 |
| Net remeasurement gains (losses) for the year | 4,847 |
| Accumulated remeasurement gains (losses) at end of year | 10,605 |
The accompanying notes are an integral part of these condensed consolidated financial statements. |
|
| 2023 Budget (Note 4) |
2023 Actual | 2022 Actual Restated (Note 3) |
|
|---|---|---|---|
| Net debt at beginning of year | (1,247,307) | (1,247,307) | (1,156,153) |
| Change in net debt during the year | |||
Annual operating deficit |
(52,829) | (35,322) | (90,315) |
Acquisition of tangible capital assets |
(9,642) | (10,703) | (9,588) |
Amortization of tangible capital assets |
6,771 | 5,644 | 5,514 |
Other |
3,074 | 84 | 1,333 |
Increase in net debt excluding remeasurement gains and (losses) |
(52,626) | (40,297) | (93,056) |
Net remeasurement gains (losses) for the year |
- | 4,847 | - |
Other comprehensive income |
- | - | 4,465 |
Net increase in net debt |
(52,626) | (35,450) | (88,591) |
| Net debt at end of year | (1,299,933) | (1,282,757) | (1,244,744) |
The accompanying notes are an integral part of these condensed consolidated financial statements. |
|||
| 2023 | 2022 Restated (Note 3) |
|
|---|---|---|
| Cash used by operating activities | ||
Annual operating deficit |
(35,322) | (90,315) |
Adjustments to reconcile annual operating deficit to cash used by operating activities |
(6,988) | 25,561 |
| (42,310) | (64,754) | |
| Cash used by capital investment activities | (10,458) | (8,858) |
| Cash used by investing activities | (3,066) | (6,562) |
| Cash provided by financing activities | 4,018 | 116,895 |
| Net (decrease) increase in cash and cash equivalents | (51,816) | 36,721 |
| Cash and cash equivalents at beginning of year | 100,822 | 64,101 |
| Cash and cash equivalents at end of year | 49,006 | 100,822 |
| Supplementary information | ||
| Cash used for interest | 19,338 | 14,793 |
| The accompanying notes are an integral part of these condensed consolidated financial statements. |
||
Notes to the Condensed Consolidated Financial Statements of the Government of Canada
1. Applied Criteria in the Preparation of the Condensed Consolidated Financial Statements
The criteria applied by the Government in the preparation of these condensed consolidated financial statements are as follows:
- These condensed consolidated financial statements are extracted from the audited consolidated financial statements included in Section 2 of Volume I of the Public Accounts of Canada 2023, which are to be tabled in Parliament.
- The condensed consolidated financial statements are in agreement with the related information in the audited consolidated financial statements and contain the information necessary to avoid distorting or obscuring matters disclosed in the related complete audited consolidated financial statements, including the notes thereto.
- As these condensed consolidated financial statements are, by their nature, summarized, they do not include all disclosures required by Canadian public sector accounting standards.
- Readers interested in the disclosure of more detailed data should refer to the audited consolidated financial statements in the Public Accounts of Canada.
2. Summary of Significant Accounting Policies
The reporting entity of the Government of Canada includes all of the government organizations that comprise the legal entity of the government as well as other government organizations, including Crown corporations, which are separate legal entities but are controlled by the government. The financial activities of all of these entities, except for enterprise Crown corporations and other government business enterprises, are consolidated in these financial statements on a line-by-line and uniform basis of accounting after eliminating significant inter-governmental balances and transactions. Enterprise Crown corporations and other government business enterprises, which are not dependent on the government for financing their activities, are recorded under the modified equity method. The Canada Pension Plan (CPP), which includes the assets of the CPP under the administration of the Canada Pension Plan Investment Board, is excluded from the reporting entity because changes to the CPP require the agreement of two thirds of participating provinces and it is therefore not controlled by the government.
The government accounts for transactions on an accrual basis, using the government's accounting policies that are described in Note 1 to its audited consolidated financial statements, which are based on Canadian public sector accounting standards. The presentation and results using the stated accounting policies do not result in any significant differences from Canadian public sector accounting standards.
Financial assets presented on the Condensed Consolidated Statement of Financial Position can provide resources to discharge liabilities or finance future operations and are generally recorded at the lower of cost or net realizable value. Certain of the government's financial instruments, including derivative assets and derivative liabilities, are measured at fair value. Non-financial assets cannot normally be converted into cash to finance future operations without disrupting government operations; they are recorded at cost less accumulated amortization. Liabilities are recorded at the estimated amount ultimately payable, adjusted for the passage of time, as required. Obligations for pensions and other future benefits are measured on an actuarial basis. Allowances for valuation are established for loans, investments and advances, as well as for loan guarantees and other obligations.
Transactions involving foreign currencies are translated into Canadian dollar equivalents using rates in effect at the time of the transactions. Monetary assets and liabilities denominated in foreign currencies are translated using rates at March 31.
Some amounts in these condensed consolidated financial statements are based on estimates and assumptions made by the government. They are based on facts and circumstances, historical experience, general economic conditions and reflect the government's best estimate of the related amount at the end of the reporting period. Estimates and underlying assumptions are reviewed annually at March 31. Revisions to accounting estimates are recognized in the period in which estimates are revised if revisions affect only that period or in the period of revision and future periods if revisions affect both current and future periods.
Measurement uncertainty that is material exists when it is reasonably possible that a material variance could occur in the reported or disclosed amount in the near term. Near term is defined as a period of time not to exceed one year from March 31. The government has determined that measurement uncertainty exists with respect to the reported amounts for:
- the accrual of tax revenues and the related amounts receivable, other accounts receivable, and the allowance for doubtful accounts;
- expenses;
- the provision for contingent liabilities (Note 5);
- environmental liabilities and asset retirement obligations;
- public sector pensions and other employee and veteran future benefits;
- enterprise Crown corporations and other government business enterprises;
- other loans, investments and advances;
- the expected useful life of tangible capital assets;
- inventories; and
- contractual rights (Note 6).
It is reasonably possible that the government's reassessments of these estimates and assumptions could require a material change in reported amounts or disclosures in the condensed consolidated financial statements.
Measurement uncertainties exist at March 31, 2023 as a result of higher-than-expected inflation rates, increasing interest rates, and the Russia-Ukraine conflict. The condensed consolidated financial statements reflect the impacts to the extent known and estimable at the reporting date. The government continues to assess and monitor the effects of these measurement uncertainties on its financial position, including related estimates and assumptions used in the preparation of its statements. The full potential impact on the assumptions used for the year is unknown as it will depend on future developments that are uncertain.
3. Adoption of New Accounting Standards
Asset Retirement Obligations
Effective April 1, 2022, the government adopted the new Public Sector Accounting Standard PS 3280 Asset Retirement Obligations. This standard requires public sector entities to recognize liabilities for legal obligations to incur costs associated with the retirement of tangible capital assets arising on their acquisition, construction, or development or through their normal use, and to expense those costs systematically over the life of the asset.
The government applied the modified retroactive application transitional approach, with a restatement of prior year comparatives. On initial application of the standard, the government removed from its Condensed Consolidated Statement of Financial Position any existing liability for an asset retirement obligation and associated asset retirement costs and recognized:
- A liability for any existing asset retirement obligations, adjusted for accumulated accretion to that date;
- an asset retirement cost capitalized as an increase to the carrying amount of the related tangible capital asset;
- accumulated amortization on that capitalized cost; and,
- an adjustment to the opening balance of the accumulated operating deficit.
Asset retirement obligations associated with assets no longer in productive use were recognized as a liability and a corresponding adjustment to the opening accumulated operating deficit.
These amounts were measured using information, assumptions and discount rates that were current at the beginning of the fiscal year. The amount recognized as an asset retirement cost was measured as of the date the asset retirement obligation was incurred. Accumulated accretion and amortization were measured for the period from the date the liability would have been recognized had the provisions of this standard been in effect to the date of transition.
Financial Instruments Suite of Standards
Effective April 1, 2022, the government adopted new accounting standards issued by the Public Sector Accounting Board that prescribe the accounting treatment for financial instruments (PS 3450 Financial Instruments, PS 2601 Foreign Currency Translation, PS 1201 Financial Statement Presentation and PS 3041 Portfolio Investments). These standards address the recognition and derecognition, measurement, presentation, and disclosure of financial instruments, including derivatives; the accounting for and reporting of transactions that are denominated in a foreign currency; and general reporting principles for disclosure of information in the financial statements. In accordance with these standards, the financial statements of prior periods have not been restated. However, reclassifications of certain 2022 balances have been made to enhance comparability.
On initial application of these standards on April 1, 2022:
- the government introduced a new statement, the Condensed Consolidated Statement of Remeasurement Gains and Losses, which records remeasurement gains and losses for financial instruments measured at fair value and other comprehensive income of enterprise Crown corporations and other government business enterprises. Historical balances of accumulated other comprehensive income and accumulated actuarial gains and losses from government business enterprises were transferred from the accumulated operating deficit to accumulated remeasurement gains and losses;
- amounts previously reported in the Condensed Consolidated Statement of Operations and Accumulated Deficit are reported in the Condensed Consolidated Statement of Operations and Accumulated Operating Deficit.
- the government elected to recognize all exchange gains and losses resulting from foreign currency transactions in the Condensed Consolidated Statement of Operations and Accumulated Operating Deficit, including those exchange gains and losses arising prior to settlement or derecognition. This elected treatment is consistent with the policy applied prior to April 1, 2022, and therefore no adjustments were required to the opening balance of the accumulated operating deficit in relation to exchange gains and losses;
- the government recognized and classified all financial assets and financial liabilities in accordance with the new standards;
- for financial instruments measured at amortized cost, any associated unamortized discounts or premiums that were presented separately as at March 31, 2022, have been included in the instruments' opening carrying value as at April 1, 2022;
- for financial instruments measured at fair value, any difference between the instruments' fair values as at April 1, 2022, and previous carrying amounts as at March 31, 2022, excluding previously recognized exchange gains and losses, were recognized as an adjustment to the opening balance of accumulated remeasurement gains and losses; and,
- the government adopted a prospective approach to identifying embedded derivatives in contracts. Effective April 1, 2022, embedded derivatives are recognized separately from host contracts and accounted for as derivative assets or liabilities when certain conditions are met.
4. Source of Budget Amounts
The budget amounts included in the Condensed Consolidated Statement of Operations and Accumulated Operating Deficit and the Condensed Consolidated Statement of Change in Net Debt are derived from the amounts that were budgeted for 2023 in the April 2022 Budget Plan (Budget 2022). To enhance comparability with actual 2023 results, Budget 2022 amounts have been reclassified to conform to the current year's presentation in the condensed consolidated financial statements, with no overall impact on the budgeted 2023 annual deficit.
Since actual opening balances of the accumulated operating deficit and net debt were not available at the time of preparation of Budget 2022, the corresponding amounts in the budget column have been adjusted to the restated actual closing balances of the previous year.
5. Contingent Liabilities
Contingent liabilities arise in the normal course of operations and their ultimate disposition is unknown. Contingent liabilities are potential liabilities that may become actual liabilities when one or more future events not wholly within the government's control occur or fail to occur. A provision is recorded when the potential liabilities are assessed as likely to become an actual liability and a reasonable estimate of the loss can be made. The government's contingent liabilities include claims comprising pending and threatened litigation, specific claims, and comprehensive land claims; guarantees provided by the government; assessed taxes under appeal; callable share capital in international organizations; and insurance programs of agent enterprise Crown corporations.
- There are thousands of pending and threatened litigation cases as well as claims outstanding against the government. While the total amount claimed in these actions is significant, their outcomes are not determinable in all cases. The government has recorded a provision for claims where it is likely that there will be a future payment and a reasonable estimate of the loss can be made. Significant exposure to a liability could exist in excess of what has been accrued. In situations where the outcome is likely, but management cannot reasonably estimate a liability, no amount is accrued. Claims for which the outcome is not determinable and for which an amount has not been accrued are estimated at $3,375 million ($4,186 million in 2022).
- Guarantees provided by the government include guarantees on the borrowings of enterprise Crown corporations and other government business enterprises, loan guarantees, insurance programs managed by the government or agent enterprise Crown corporations, and other explicit guarantees. At March 31, 2023, the principal amount outstanding for guarantees provided by the government amounts to $602,388 million ($575,743 million in 2022) for which an allowance of $473 million ($390 million in 2022) has been recorded. Of the total amount guaranteed, $317,834 million ($304,871 million in 2022) relates to guarantees on the borrowings of agent enterprise Crown corporations.
- Contingent liabilities include previously assessed federal taxes where amounts are being appealed to the Tax Court of Canada, the Federal Court of Appeal, or the Supreme Court of Canada. As of March 31, 2023, an amount of $6,753 million ($5,634 million in 2022) was being appealed to the courts, for which the likelihood of an adverse outcome was not determinable or for which an amount could not be reasonably estimated. The government has recorded, in accounts payable and accrued liabilities or in reduction of cash and accounts receivable, as applicable, the estimated amount of appeals that are considered likely to be lost and that can be reasonably estimated.
- The government has callable share capital in certain international organizations that could require payments to those agencies. At March 31, 2023, callable share capital amounts to $40,461 million ($37,522 million in 2022).
- At March 31, 2023, insurance in force relating to self-sustaining insurance programs operated by four agent enterprise Crown corporations amounts to $2,001,600 million ($1,912,891 million in 2022). The government expects that all four corporations will cover the cost of both current claims and possible future claims.
6. Contractual Obligations and Contractual Rights
The nature of government activities results in large multi-year contracts and agreements, including international treaties, protocols and agreements of various size and importance. Any financial obligations resulting from these contracts and agreements are recorded as a liability when the terms for the acquisition of goods and services or the provision of transfer payments are met.
Contractual obligations that will materially affect the level of future expenditures include transfer payment agreements, agreements for the acquisition of goods and services, operating leases, and funding of international organizations. At March 31, 2023, contractual obligations amount to $236,477 million, of which $74,652 million pertains to 2024.
The activities of government sometimes involve the negotiation of contracts or agreements with outside parties that result in the government having rights to both assets and revenues in the future. They principally involve sales of goods and services, leases of property, and royalties and revenue/profit-sharing arrangements. The terms of these contracts and agreements may not allow for a reasonable estimate of future revenues. For contracts and agreements that do allow for a reasonable estimate, total revenues to be received in the future under major contractual rights are estimated at $30,884 million at March 31, 2023, of which $3,862 million pertains to 2024.