
Debt Management Report 2017–2018 - Part 1
The Government of Canada is building a strong middle class and an economy that works for everyone. While maintaining strong fiscal fundamentals, the Government continues to make investments to strengthen and grow Canada's economy, improve Canada's competitiveness and give every Canadian a real and fair chance at success, now and in the future. The Government's debt management strategy is integral to this goal.
Ensuring that the Government is able to raise stable and low-cost funding is a main objective of the debt management strategy, as is maintaining a market that works well for Government securities and keeps debt costs low. Meeting these objectives ensures that the Government is able to make the types of investments that help build confidence and create good, well-paying jobs for middle class Canadians.
It is my privilege to table before Parliament the Government of Canada's Debt Management Report for the 2017–18 fiscal year. The design and implementation of the domestic debt program are guided by the key principles of transparency, regularity, prudence and liquidity.
The Government, which consults regularly with market participants, seeks to strike a balance between keeping funding costs low, and mitigating risks as funding needs and market conditions change.
This year's Debt Management Report shows once again that Canada continues to follow a prudent debt management strategy, raising stable and low-cost funding to meet its borrowing requirements.
Maintaining strong fiscal fundamentals, anchored by a low and consistently declining debt-to-GDP (gross domestic product) ratio, is an important part of the Government's plan to invest in the middle class and ensure every Canadian can make a meaningful contribution toward economic growth that works for everyone.
The Honourable Bill Morneau, P.C., M.P.
Minister of Finance
Ottawa, 2018
This edition of the Debt Management Report provides a detailed account of the Government of Canada's borrowing and debt management activities for the fiscal year ending March 31, 2018.
As required under Part IV (Public Debt) of the Financial Administration Act, this publication provides transparency and accountability regarding these activities. It reports on actual borrowing and uses of funds compared to those forecast in the Debt Management Strategy for 2017–18, published on March 22, 2017, as Annex 2 of Budget 2017. It also discusses the environment in which the debt was managed, the composition of the debt, changes in the debt during the year, strategic policy initiatives and performance outcomes.
The Public Accounts of Canada is tabled annually in Parliament and is available on the Public Services and Procurement Canada website. The Debt Management Strategy and the Report on the Management of Canada's Official International Reserves, which are also tabled annually in Parliament, are available on the Department of Finance Canada website. Additionally, monthly updates on cash balances and foreign exchange assets are available through The Fiscal Monitor, which is also available on the Department of Finance Canada website.
This publication reports on two major activities: (i) the management of federal market debt (the portion of the debt that is borrowed in financial markets); and (ii) the investment of cash balances in liquid assets for operational purposes and contingency planning.
The Government's market debt, including marketable bonds, treasury bills, retail debt and foreign currency debt, stood at $704.3 billion at the end of fiscal year 2017–18 (see shaded area of Chart 1). In addition to market and other types of unmatured debt, other liabilities, including pensions and accounts payable, brought the total liabilities of the Government of Canada to $1,157.4 billion at that time. When financial and non-financial assets[1] are subtracted from total liabilities, the federal debt or accumulated deficit of the Government of Canada was $671.3 billion as at March 31, 2018 (see Chart 1).
Chart 1
Snapshot of the Federal Balance Sheet, as at March 31, 2018

There are two types of market debt: domestic debt, which is denominated in Canadian dollars, and foreign currency debt. Domestic funding is conducted through the issuance of marketable securities, which consist of nominal bonds, Real Return Bonds and treasury bills, including cash management bills. These securities are sold predominately via auction but occasionally through syndication at the Government's discretion. Cross-currency swaps of domestic obligations and issuance of foreign currency debt are used to fund foreign reserve assets held in the Exchange Fund Account (see the section entitled "Foreign Currency Debt").
The Debt Management Report consist of three parts covering the main aspects of the Government of Canada's debt program. "Part I – 2017–18 Debt Management Context" focuses on the state of the federal debt, the year's funding requirements and the sources of borrowings used to raise funds, the federal government's credit ratings and the authorities required to borrow. "Part II – Report on Objectives and Principles" reports on debt management objectives and principles to raise stable and low-cost funding to meet the financial needs of the Government of Canada and to maintain a well-functioning market for Government of Canada securities. "Part III – Report on the 2017–18 Debt Program" reports on the operational aspects of the debt program. This year, debt management operations have led to an effective execution of the debt management program. The main highlights are as follows:
In 2017–18, the relative strength of the Canadian economy and its capital markets continued to support demand for Government of Canada securities in primary and secondary markets. Accordingly, treasury bill and bond auctions remained well-covered and competitively bid, providing an efficient manner for the Government to raise funding. The publication of the Quarterly Bond Schedule before each quarter and the Call for Tenders before each auction helped maintain transparency. This promoted well-functioning markets for the Government's securities to the benefit of a wide array of domestic market participants, contributing to the objective of raising stable and low-cost funding.
In 2017–18, the Government continued to have an increased focus on the issuance of short- and medium-term bonds (2-, 3- and 5-year maturities). This approach considers the liquidity needs of the market for core funding sectors while also satisfying the Government's objectives.
Overall, the weighted average rate of interest on market debt increased to 2.01 per cent, up from 1.89 per cent in 2016–17.
The stock of market debt increased by $9.2 billion in 2017–18, bringing the total stock to $704.3 billion. The change in the stock was mainly comprised of a $38.7 billion increase in domestic marketable bonds, a $26 billion decrease in treasury and cash management bills, a $1.6 billion decrease in foreign currency debt, and a $1.9 billion decrease in retail debt outstanding. Notwithstanding the modest increase in its debt stock, Canada's federal market debt-to-GDP ratio remains the lowest among the Group of Seven (G7) nations.
In 2017–18, a confluence of factors led to borrowing requirements that were $30 billion lower than planned in the Debt Management Strategy for 2017–18. In response to decreased borrowing requirements, bi-weekly treasury bill auction sizes were reduced and the outstanding stock of treasury bills declined steadily throughout 2017–18, ending the year $20 billion below the planned level.
When there were signs of dysfunction in the treasury bill sector due to the decreased issuance, the bond program was adjusted to support higher treasury bill issuances, including decreased bond auction sizes in the 2-, 3- and 5-year sectors. This is consistent with the medium-term objective of maintaining a treasury bill stock that is large enough to support a liquid and well-functioning market for Canadian federal government treasury bills, while still supporting healthy benchmark sizes in core bond sectors.
The Government brought into force a new Parliamentary-approved borrowing authority framework in November 2017, setting a new standard on providing transparency and accountability. Reflecting the power of the new framework, the Government borrows money under the approval of Parliament, giving Parliamentarians unprecedented oversight over the Government's outstanding market debt, including that of agent Crown corporations.
In 2017–18, total market debt increased by $9.2 billion (or about 1.3 per cent) to 704.3 billion (see Table 1). For additional information on the financial position of the Government, see the 2017–18 Annual Financial Report of the Government of Canada.
| 2018 | 2017 (restated) |
Change | |
|---|---|---|---|
| Payable in Canadian currency | |||
| Marketable bonds | 575.0 | 536.3 | 38.7 |
| Treasury and cash management bills | 110.7 | 136.7 | -26.0 |
| Retail debt | 2.6 | 4.5 | -1.9 |
| Total payable in Canadian currency | 688.3 | 677.5 | 10.7 |
| Payable in foreign currencies | 16.0 | 17.6 | -1.6 |
| Total market debt | 704.3 | 695.1 | 9.2 |
| Market debt value adjustment, capital lease obligations and other unmatured debt |
16.9 | 18.5 | -1.6 |
| Total unmatured debt | 721.2 | 713.6 | 7.6 |
| Pension and other accounts | 281.4 | 270.7 | 10.7 |
| Total interest-bearing debt | 1,002.6 | 984.3 | 18.2 |
| Accounts payable, accruals and allowances | 154.8 | 132.5 | 22.3 |
| Total liabilities | 1,157.4 | 1,116.9 | 40.5 |
| Total financial assets | 398.6 | 382.8 | 15.9 |
| Total non-financial assets | 87.5 | 82.6 | 5.0 |
| Federal debt (accumulated deficit) | 671.3 | 651.5 | 19.7 |
| Note: Numbers may not add due to rounding. Source: Public Accounts of Canada. | |||
The key reference point for debt management is the financial requirement or source, which represents net cash needs or surplus for the fiscal year. This measure differs from the budgetary balance (i.e., the deficit or surplus on an accrual basis) by the amount of non-budgetary transactions and the timing of payments on a cash basis, which can be significant. Non-budgetary transactions include changes in federal employee pension accounts; changes in non-financial assets; loans, investments and advances; changes in other financial assets and liabilities; and foreign exchange activities, which do not affect cash needs or surplus. Anticipated borrowing and planned uses of funds are set out in the Debt Management Strategy, while actual borrowing and uses of funds compared to those forecast are reported in this publication (see Table 2).
There was a financial requirement of $9.4 billion in 2017–18 as a result of $19.0 billion in outflow due to a budgetary deficit and an inflow of $9.5 billion due to non-budgetary transactions. The financial requirement was approximately $30 billion lower than the projection in the Debt Management Strategy for 2017–18. For comparison, the financial requirement in 2016–17 was $27.5 billion.
In 2017–18, loans to the Business Development Bank of Canada, Canada Mortgage and Housing Corporation and Farm Credit Canada under the Crown Borrowing Program were $0.7 billion lower than the planned $4 billion. Since the inception of the program in 2007–08, the consolidated borrowings of Crown corporations have grown to account for $56 billion of federal market debt.
| Planned1 | Actual | Difference | |
|---|---|---|---|
| Sources of borrowings | |||
| Payable in Canadian currency | |||
| Treasury bills | 131 | 111 | -21 |
| Bonds | 142 | 137 | -5 |
| Retail debt | 1 | 1 | -1 |
| Total payable in Canadian currency | 274 | 248 | -26 |
| Payable in foreign currencies | 12 | 7 | -6 |
| Total cash raised through borrowing activities | 286 | 254 | -32 |
| Uses of borrowings2 | |||
| Refinancing needs | |||
| Payable in Canadian currency | |||
| Treasury bills | 130 | 137 | 7 |
| Bonds | 103 | 99 | -4 |
| Of which: | |||
| Regular bond buybacks | 1 | 1 | 0 |
| Cash management bond buybacks | 42 | 41 | -1 |
| Retail debt | 2 | 2.7 | 1 |
| Total payable in Canadian currency | 236 | 239 | 3 |
| Payable in foreign currencies | 11 | 8 | -3 |
| Total refinancing needs | 247 | 247 | 0 |
| Financial source/requirement | |||
| Budgetary balance | 28 | 19 | -9 |
| Non-budgetary transactions | |||
| Pension and other accounts | -3 | -10 | -7 |
| Non-financial assets | 1 | 5 | 4 |
| Loans, investments and advances | 5 | 3 | -2 |
| Of which: | |||
| Loans to enterprise Crown corporations | 4 | 3 | -1 |
| Other | 1 | 0 | -1 |
| Other transactions3 | 7 | -7 | -14 |
| Total non-budgetary transactions | 10 | -10 | -20 |
| Total financial source/requirement | 39 | 9 | -30 |
| Total uses of borrowings | 286 | 256 | -30 |
| Change in other unmatured debt transactions4 | 0 | 19 | 19 |
| Net increase or decrease (-) in cash | 0 | -2 | -2 |
| Note: Numbers may not add due to rounding. 1 Planned numbers are from Budget 2018 and the Debt Management Strategy for 2018–19. 2 A negative sign denotes a financial source. 3 Primarily includes the conversion of accrual adjustments into cash, such as tax and other account receivables; provincial and territorial tax collection agreements; and tax payables and other liabilities. 4 Includes cross-currency swap revaluation, unamortized discounts on debt issues, obligations related to capital leases and other unmatured debt. |
|||
In order to undertake market borrowing activities, the Minister of Finance (the "Minister") now needs authority from Parliament as well as the Governor in Council (the "GIC").
Under the new Parliamentary borrowing authority framework enacted in 2017–18, Parliamentary authority is granted through the Borrowing Authority Act (the "BAA") and Part IV of the Financial Administration Act (the "FAA"), which together allow the Minister to borrow money up to a maximum overall amount as approved by Parliament. The FAA also authorizes the Minister to borrow in excess of the approved maximum amount under limited circumstances for the specific purposes of refinancing outstanding debt, extinguishing or reducing liabilities, and making payments in extraordinary circumstances, such as natural disasters. The new borrowing authority framework came into force on November 23, 2017.
Subject to the noted limited exceptions, Parliament approved in the BAA a maximum stock of borrowings of $1,168,000 million, which also includes amounts borrowed by agent Crown corporations and Canada Mortgage Bonds guaranteed by Canada Mortgage and Housing Corporation. As of March 31, 2018, $996,625 million of the Parliamentary-approved borrowing authority was used.
In addition to the new Parliamentary approval, Part IV of the FAA also requires the Minister to receive annual approval from the GIC to carry out borrowing that has been authorized by Parliament, including issuing securities in financial markets and undertaking related activities, such as entering into financial contracts and derivatives transactions, subject to a maximum aggregate amount. On the recommendation of the Minister of Finance, the GIC approved $335,000 million to be the maximum aggregate amount of principal that may be borrowed by the Minister during 2017–18.2 The maximum aggregate amount of principal is the sum of: (i) the maximum stock of treasury bills anticipated to be outstanding during the year; (ii) the total value of refinanced and anticipated new issuances of marketable bonds and retail debt; and (iii) an amount to facilitate intra-year management of the debt and foreign exchange accounts.
During 2017–18, $254 billion of the GIC-approved borrowing authority was used, $81 billion below the authorized borrowing authority limit and $32 billion lower than the plan set out in the Debt Management Strategy for 2017–18 (see Table A2.1 in the Debt Management Strategy).
The Government of Canada continued to receive the highest possible credit ratings, with a stable outlook, on Canadian-dollar and foreign-currency-denominated short- and long-term debt from the four rating agencies that evaluate Canada's debt (see Table 3).
Rating agencies indicated that Canada's effective, stable and predictable policymaking and political institutions, economic resilience and diversity, well-regulated financial markets, and the strength of monetary and fiscal flexibility supported the country's ongoing triple-A credit rating. The rating agencies indicated that Canada's debt position would remain favourable, which provides investors of Canadian debt with a sense of security.
| Rating agency | Term | Domestic currency |
Foreign currency |
Outlook | Last rating action |
|---|---|---|---|---|---|
| Moody's Investors Service | Long-term Short-term |
Aaa |
Aaa P-1 |
Stable | May 2002 |
| Standard & Poor's | Long-term Short-term |
AAA A-1+ |
AAA A-1+ |
Stable | July 2002 |
| Fitch Ratings | Long-term Short-term |
AAA F1+ |
AAA F1+ |
Stable | August 2004 |
| Dominion Bond Rating Service | Long-term Short-term |
AAA R-1 (High) |
AAA R-1 (High) |
Stable | December 2002 |
The fundamental objectives of debt management are to raise stable and low-cost funding to meet the financial needs of the Government of Canada and to maintain a well-functioning market for Government of Canada securities. In support of these objectives, the design and implementation of the domestic debt program are guided by the key principles of transparency, regularity, prudence and liquidity, which support a well-functioning government securities market. Towards this end, the Government publishes strategies and plans, and consults regularly with market participants to ensure the integrity and attractiveness of the market for dealers and investors. The structure of the debt is managed conservatively in a cost-risk framework, preserving access to diversified sources of funding and supporting a broad investor base.
In general, achieving stable, low-cost funding involves striking a balance between debt costs and various risks in the debt structure. This selected balance between cost and risk, or preferred debt structure, is mostly achieved through the deliberate allocation of issuance between various debt instruments.
The composition of the stock of market debt is a reflection of past debt issuance choices. The effects of changes in the issuance patterns of short-term instruments become visible relatively quickly, while the full effect of issuance changes in longer-term maturities will take their full maturity periods to be fully appreciated. A well-distributed maturity profile ensures a diversified exposure to changes in interest rates over time and provides liquidity across different maturity sectors to promote well-functioning markets.
In 2017–18, the composition of market debt by remaining term to maturity continued to shift to a more even distribution, which helps to reduce debt rollover risk. As a result of lower financial requirements than projected in the Debt Management Strategy for 2017–18, the Government issued slightly less in the 2-year sector while increasing issuance in the 3- and 5-year sectors compared to 2016–17. Still, the stock of debt with remaining terms to maturity between one and two years increased significantly due to the reintroduction of the 3-year bond in the previous year. In response to lower financial requirements, the size of bi-weekly treasury bill auctions declined as treasury bills are typically used as the main shock absorber to adjust cash flows according to the evolution and timing of the Government's borrowing needs. Bonds with remaining terms to maturity greater than five years increased slightly see Chart 2).
Composition of Market Debt by Remaining Term to Maturity, as at March 31
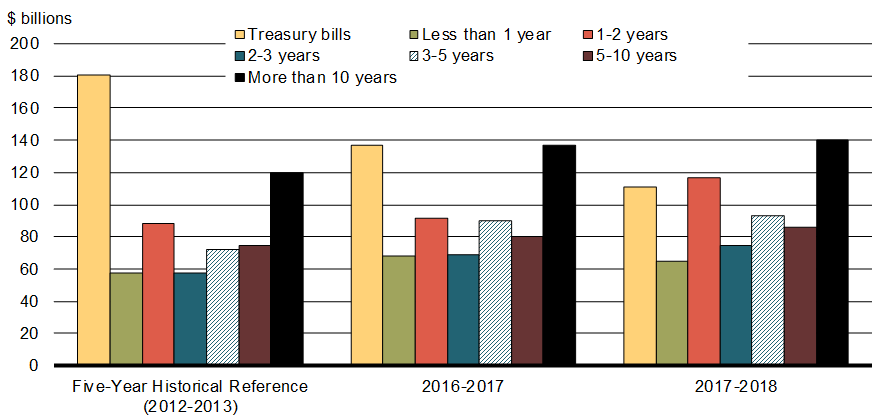
Sources: Public Accounts of Canada and Bank of Canada.
In 2017–18, the Government increased overall issuance of nominal bonds. As a result, the share of bonds with original terms to maturity of 2 to 5 years increased by 3.5 percentage points to 40.6 per cent of the stock of market debt outstanding (see Chart 3), driven mainly by increased 3-year issuance in 2017–18.
Chart 3
Composition of Market Debt by Original Terms of Issuance, as at March 31

Market debt costs are the largest component of public debt charges (public debt charges also include interest expenses on non-market liabilities).3 The weighted average rate of interest on outstanding market debt was 2.01 per cent in 2017–18, up from 1.89 per cent in 2016–17. As a result, the interest cost of market debt increased from $13.1 billion in 2016–17 to $14.2 billion in 2017–18, reflecting the higher weighted average rate of interest on market debt and a larger stock of market debt (see Chart 4).
Chart 4
Market Debt Costs and Average Effective Interest Rate

The average term to maturity (ATM) of market debt (net of financial assets) declined between 2008–09 and 2011–12, primarily due to a large increase in the issuance of treasury bills and 2-, 3- and 5-year bonds relative to longer-term bonds following the financial crisis of 2008-2009. In 2014–15, as the Canadian and global financial markets recovered from the crisis and the Insured Mortgage Purchase Program was wound down, the ATM increased to 8.1 years. The ATM remained broadly unchanged until this year, when it increased to 8.3 years, the highest level in over 10 years. This is due to the relatively low amount of treasury bills outstanding as a share of total market debt and higher issuance of long-dated bonds in recent years.
Chart 5
Average Term to Maturity of Government of Canada Market Debt,
Net of Financial Asset

Maintaining debt rollover within acceptable parameters: Prudent management of debt refinancing needs promotes investor confidence and strives to minimize the impact of market volatility or disruptions on the funding program. According to a number of measures of rollover (e.g. quarterly maturities as a percentage of GDP, single day bond maturities plus coupon payments net of buyback operations, net refixing share of market debt and net refixing share of market debt to GDP), risk in the Government's debt program has continually declined over recent years.
The amount of debt maturing per quarter as a percentage of GDP rose to an average of 7.7 per cent during 2009–10 due to a higher stock of treasury bills, but has since declined to an average of 4.4 per cent in 2017–18 (see Chart 6). This reflects the lower stock of treasury bills due to lower-than-projected financial requirements.
Chart 6
Quarterly Maturities of Domestic Market Debt as a percentage of GDP

Single-day cash flow maturities had increased as a result of higher debt issuance since the financial crisis of 2008-2009, but have generally been trending downwards since 2012 as a result of the introduction of four new maturity dates—February 1, May 1, August 1 and November 1—in 2011–12 (see Chart 7). The four additional maturity dates have allowed the debt program to absorb increases in funding requirements and helped smooth the cash flow profile of upcoming maturities over the medium term. Most large single-day maturity dates are now due to principal and coupon payments on bonds that were issued prior to 2011–12; the smoothing effect of these additional maturity dates on the cash profile will become even more apparent over time.
The benchmark maturity date profile is as follows:
- 2-year sector: February 1, May 1, August 1, November 1
- 3-year sector: March 1, September 1
- 5-year sector: March 1, September 1
- 10-year sector: June 1
- 30-year sector: December 1, alternating years with Real Return Bond maturities
The refixing share of market debt (net of financial assets) measures the proportion of all market debt that matures or needs to be repriced within one year. The refixing share net of financial assets is used rather than the gross refixing share because the net-of-assets measure better reflects the risk exposure to the Government. In 2017–18, the net refixing share of market debt decreased by 7.9 percentage points to 23.9 per cent (see Chart 7). The net refixing share of market debt to GDP measures the amount of market debt that matures or needs to be repriced within one year relative to nominal GDP for that year. The net refixing share of market debt to GDP decreased to 4.9 per cent in 2017–18, down 1.7 percentage points from 2016–17.
Chart 7
Net Refixing Share of Market Debt and Market Debt to GDP

A well-functioning wholesale market in Government of Canada securities is important as it benefits the Government as a borrower as well as a wide range of market participants. For the Government as a debt issuer, a well-functioning market attracts investors, contributes to keeping funding costs low and stable over time, and provides flexibility to meet changing financial requirements. For market participants, a liquid and transparent secondary market in government debt provides risk-free assets for investment portfolios, a pricing benchmark for other debt issues and derivatives, and a useful tool for hedging interest rate risk. The following actions promoted a well-functioning Government of Canada securities market in 2017–18.
Providing regular and transparent issuance: The Government of Canada conducted treasury bill auctions on a bi-weekly basis, announced the bond auction schedule prior to the start of each quarter and provided details for each operation in a Call for Tenders in the week leading up to the auction.4 In 2017–18, there were regular auctions for 2-, 3-, 5-, 10- and 30-year nominal and Real Return Bonds. Regular and pre-announced issuance provided certainty for dealers and investors, allowing them to plan their investment activities, and supported participation and competitive bidding at auctions. Bond issuance schedules were communicated through the Bank of Canada website on a timely basis.
Concentrating on key benchmarks: Benchmark target sizes in all the bond sectors were maintained at the same level compared to the previous year:
- 2-year sector: $12 billion to $18 billion
- 3-year sector: $10 billion to $16 billion
- 5-year sector: $14 billion to $20 billion
- 10-year sector: $12 billion to $18 billion
- 30-year nominal sector: $10 billion to $16 billion
- 30-year Real Return Bond sector: $10 billion to $16 billion
The Government of Canada also issued ultra-long bonds on a tactical basis, subject to favourable market conditions. There were two ultra-long bond issuances in fiscal year 2017–18: on September 1, 2017, for $750 million, at a yield of 2.22 per cent and on November 20, 2017, for $500 million, at a yield of 2.25 per cent. As at March 31, 2018, the total outstanding amount of ultra-long debt is $4.75 billion, issued at a weighted average rate of 2.65 per cent.
All benchmark bonds in 2017–18 continued to reach or exceed minimum benchmark size targets (see Chart 8) except for the 3-year bond, which was reduced to support liquidity and well-functioning treasury bill markets.5
Chart 8
Size of Gross Bond Benchmarks in 2017-2018

Ensuring a broad investor base in Government of Canada securities: A diversified investor base supports an active secondary market for Government of Canada securities, thereby helping to keep funding costs low and stable. Diversification of the investor base is pursued by maintaining a domestic debt program that issues securities in a wide range of maturity sectors, which meet the needs of many different types of investors.
As at March 31, 2018, domestic investors (including the Bank of Canada) held about 68 per cent of Government of Canada securities (see Chart 9). Among domestic investors, insurance companies and pension funds held the largest share of Government of Canada securities (26.6 per cent), followed by financial institutions (20.5 per cent) and the Bank of Canada (14.3 per cent). Taken together, these top three categories accounted for close to two thirds of outstanding Government of Canada securities.
Chart 9
Distribution of Government of Canada Securities

The Bank of Canada announced in December 2017 that it would decrease its minimum purchase amount of nominal bonds at auctions from 14 per cent to 13 per cent. This follows the February 2017 announcement that it would decrease its minimum purchase amount from 15 per cent to 14 per cent. This change is related to the Bank of Canada's management of its balance sheet and has no implications for monetary policy. The Bank of Canada's decreased purchase amount has improved the liquidity of Government of Canada securities by ensuring that a greater proportion of securities issued is available to market participants. For more information, consult the press release on the Bank of Canada website.6
In 2017–18, non-resident investors held 32 per cent of Government of Canada marketable securities,7 up about half a percentage point from 2016–17. This level of non-resident holdings of Government of Canada debt remains in the mid to low range compared to other sovereigns in the G7 (see Chart 10).
Chart 10
Percentage of Total Marketable Debt of G7 Countries Held by Non-Residents

Consulting with market participants: Formal consultations with market participants are held at least once a year, in order to obtain their views on the design of the borrowing program and on the liquidity and efficiency of the Government of Canada securities markets. In September 2016, the Bank of Canada and the Department of Finance Canada held about 40 bilateral meetings with organizations in Toronto, Montréal and New York. These consultations sought the views of market participants on issues related to the design and operation of the Government of Canada's domestic debt program for 2017–18 and beyond.
Market participants commented that the Government of Canada securities market continues to function well across all maturity sectors and that the market has adjusted well to the reintroduction of 3-year bond auctions. Issues around repo market tightness have dissipated, but some participants expressed concern that tightness could return. More details on these discussions are available on the Bank of Canada website.8
Further discussions with market participants in mid 2017–18 provided additional insight on the state of the treasury bill market at that time. Market participants indicated that the treasury bill market was functioning well, but that the stock of outstanding bills was approaching a level below which the well-functioning of the treasury bill market could be impacted. In particular, it was noted that the demand for very short-term product at that time (3 months and under) outpaced supply, due in part to tightening monetary policy and a lack of alternative products.
Maintaining a well-functioning securities distribution system: As the Government's fiscal agent, the Bank of Canada distributes Government of Canada marketable bills and bonds by auction to government securities distributors (GSDs) and customers. GSDs that maintain a certain threshold of activity in the primary and secondary market for Government of Canada securities may become primary dealers, which form the core group of distributors for Government of Canada securities. To maintain a well-functioning securities distribution system, government securities auctions are monitored to ensure that GSDs abide by the terms and conditions.9
Quick turnaround times enhance the efficiency of the auction and buyback processes, and reduce market risk for participants. In 2017–18, the turnaround time for treasury bill and bond auctions averaged 2 minutes 12 seconds, while buyback operations averaged 2 minutes 51 seconds. The average turnaround times in 2016–17 were 2 minutes 2 seconds and 2 minute 31 seconds, respectively.10
Monitoring secondary market trading in Government of Canada securities: Two measures of liquidity and efficiency in the secondary market for Government of Canada securities are trading volume and turnover ratio.
Trading volume represents the amount of securities traded during a specific period (e.g., daily). Large trading volumes typically allow participants to buy or sell in the marketplace without a substantial impact on the price of the securities and generally imply lower bid-offer spreads.
Turnover ratio, which is the ratio of securities traded relative to the amount of securities outstanding, measures market depth. High turnover implies that a large amount of securities changes hands over a given period of time.
The average daily trading volume in the secondary market for Government of Canada bonds during 2017–18 was $38.4 billion, an increase of $6.4 billion from 2016–17 (see Chart 11).
Chart 11
Government of Canada Bond Average Daily Trading Volumes

The annual debt stock turnover ratio in the Government of Canada secondary bond market was 17.6 per cent in 2017–18, an increase of 1.8 percentage points from 2016–17. The sectors with the highest turnover are medium-term bonds with maturities between 3 and 10 years at 26 per cent, while Real Return Bonds have the lowest turnover at 1 per cent (see Chart 12).
Chart 12
Government of Canada Bond Turnover Ratio by Term to Maturity

Supporting secondary market liquidity: The Bank of Canada operates a securities-lending program to support the liquidity of Government of Canada securities by providing a secondary and temporary source of securities to the market. The program is triggered when market pricing for Government of Canada bonds and bills in repurchase transactions moves beyond a specified point.11
More liquid markets in 2017–18 resulted in a reduction in demand for securities-lending operations. Consequently, the Bank of Canada conducted only 5 securities-lending operations in 2017–18, compared to 8 operations in 2016–17. Securities-lending operations are generally conducted to alleviate tightness in markets for Government of Canada bonds. A bond is considered "tight", or trading "on special", when the repo rate (i.e., the rate of interest to be paid on the loan in a repurchase agreement between two parties) is below the general collateral rate (i.e., the repo rate on general collateral, or in this case, the Canadian Overnight Repo Rate Average).
Using the regular bond buyback program: Bond buyback operations on a cash basis and on a switch basis involve the purchase of bonds with a remaining term to maturity of 12 months to 25 years. Bond buyback operations on a cash basis involve the exchange of a bond for cash. Bond buyback operations on a switch basis, on the other hand, involve the exchange of one bond for another (e.g., an off-the-run bond for the building to benchmark bond), on a duration-neutral basis.12
In 2017–18, there were two regular bond buybacks on a switch basis. Both operations involved the exchange of an off-the-run bond for the 30-year building-to-benchmark bond. Switch operations amounted to $930 million at par value, which was $69 million lower than the switch operations that occurred in 2016–17. There were no regular bond buybacks on a cash basis in 2017–18.
In 2017–18, treasury bill and bond auctions continued to perform well. Demand for Government of Canada securities remained strong throughout the fiscal year as a result of persistent demand for high-quality sovereign debt securities, and Canada's strong fiscal and economic position.
In 2017–18, gross bond issuance was $137.2 billion (including issuance through switch buybacks), $3.8 billion higher than the $133.4 billion issued in 2016–17. Gross issuance consisted of $135 billion in nominal bonds (including switch operations) and $2.2 billion in Real Return Bonds (see Table 4). Taking into account buybacks and maturities, the stock of outstanding bonds increased by $39.9 billion to $575.8 billion including inflation adjustment, as at March 31, 2018.
| 2013–14 | 2014–15 | 2015–16 | 2016–17 | 2017–18 | |
|---|---|---|---|---|---|
| Nominal (auction) | 84.5 | 96.0 | 89.8 | 130.4 | 134.21 |
| Nominal (switch) | 0.8 | 0.4 | 0.4 | 0.8 | 0.8 |
| Real Return Bonds | 2.2 | 2.2 | 2.2 | 2.2 | 2.2 |
| Total gross issuance | 87.5 | 98.6 | 92.4 | 133.4 | 137.2 |
| Cash buyback | 0.0 | 0.0 | 0.0 | 0.0 | 0.0 |
| Switch buyback | -1.0 | -0.5 | -0.4 | -0.8 | -0.8 |
| Total buyback | -1.0 | -0.5 | -0.4 | -0.8 | -0.8 |
| Net issuance | 86.5 | 98.1 | 92.0 | 132.6 | 136.4 |
| Note: Numbers may not add due to rounding. 1 This table includes ultra-long bond auctions of $1.25 billion that took place in fiscal year 2017–18, resulting in nominal issuance for the fiscal year of $134.15 billion (number has been rounded up to $134.2 billion). Excluding ultra-long issuance would result in nominal issuance of $132.9 billion for the fiscal year. Source: Bank of Canada. | |||||
The auction tail represents the number of basis points between the highest yield accepted and the average yield of an auction. A small auction tail is preferable as it is generally indicative of better transparency in the pricing of securities. Average auction tails were below the 5-year average across all maturities in 2017–18.13 A total of 40 nominal bond auctions were conducted in 2017–18, three more than in 2016–17.
Auction coverage is defined as the total amount of bids received, including bids from the Bank of Canada, divided by the amount auctioned. All else being equal, a higher auction coverage level typically reflects strong demand and therefore should result in a lower average auction yield. Bond auctions in 2017–18 continued to be well-covered across all sectors, but were below 5-year averages except for the 30-year sector.
| Nominal Bonds | Real Return Bonds |
||||||
|---|---|---|---|---|---|---|---|
| 2-year | 3-year | 5-year | 10-year | 30-year | 30-year | ||
| Tail | 2017–18 | 0.14 | 0.20 | 0.19 | 0.36 | 0.29 | n/a |
| 5-year average | 0.16 | 0.22 | 0.28 | 0.40 | 0.33 | n/a | |
| Coverage | 2017–18 | 2.59 | 2.55 | 2.44 | 2.30 | 2.61 | 2.13 |
| 5-year average | 2.62 | 2.60 | 2.51 | 2.42 | 2.56 | 2.44 | |
| Notes: Tail represents the number of basis points between the highest yield accepted and the average yield of an auction. Coverage is defined as the total amount of bids received, including bids from the Bank of Canada, divided by the amount auctioned. Source: Bank of Canada. |
|||||||
In 2017–18, primary dealers (PDs) were allotted 70 per cent of auctioned nominal bonds, and customers were allotted 30 per cent (see Table 6), excluding the Bank of Canada's allotment.14 In aggregate, the 10 most active participants were in total allotted 85 per cent of these securities. Primary dealers' share of the Real Return Bond allotments increased from 38 per cent in 2016–17 to 54 per cent in 2017–18, with customer allocations decreasing from 62 per cent to 46 per cent.
| Participant type | 2013–14 | 2014–15 (restated)2 |
2015–16 (restated)2 |
2016–17 | 2017–18 | |||||
|---|---|---|---|---|---|---|---|---|---|---|
| ($ billions) | (%) | ($ billions) | (%) | ($ billions) | (%) | ($ billions) | (%) | ($ billions) | (%) | |
| PDs | 68 | 80 | 81 | 84 | 66 | 73 | 96 | 74 | 94 | 70 |
| Non-PD GSDs | 8 | 9 | 3 | 3 | 0 | 0 | 0 | 0 | 0 | 0 |
| Customers | 9 | 11 | 13 | 14 | 24 | 27 | 34 | 26 | 40 | 30 |
| Top 5 participants | 49 | 58 | 63 | 66 | 51 | 57 | 72 | 55 | 75 | 56 |
| Top 10 participants | 70 | 83 | 86 | 90 | 77 | 86 | 111 | 85 | 114 | 85 |
| Total nominal bonds issued | 85 | 96 | 90 | 130 | 134 | |||||
| Note: Numbers may not add due to rounding. 1 Not including Bank of Canada allotment. 2 Amounts are restated to account for historical revisions. Source: Bank of Canada. |
||||||||||
| Participant type | 2013–14 | 2014–15 | 2015–16 | 2016–17 | 2017–18 | |||||
|---|---|---|---|---|---|---|---|---|---|---|
| ($ billions) | (%) | ($ billions) | (%) | ($ billions) | (%) | ($ billions) | (%) | ($ billions) | (%) | |
| PDs | 1 | 40 | 1 | 55 | 1 | 23 | 1 | 38 | 1 | 54 |
| Non-PD GSDs | 0 | 0 | 0 | 0 | 0 | 0 | 0 | 0 | 0 | 0 |
| Customers | 1 | 60 | 1 | 44 | 2 | 77 | 1 | 62 | 1 | 46 |
| Top 5 participants | 1 | 52 | 1 | 54 | 1 | 52 | 1 | 66 | 1 | 59 |
| Top 10 participants | 2 | 75 | 2 | 75 | 2 | 75 | 2 | 87 | 2 | 82 |
| Total Real Return Bonds Issued | 2 | 2 | 2 | 2 | 2 | |||||
| Note: Numbers may not add due to rounding. | ||||||||||
During 2017–18, $252.5 billion in 3-, 6- and 12-month treasury bills were issued, a decrease of $38.5 billion from the previous year. There were also 20 cash management bill operations for a total of $52.7 billion in 2017–18, compared to 31 operations and a total of $79.5 billion in 2016–17. Together, treasury bill and cash management bill issuance totaled $305.2 billion. As at March 31, 2018, the combined treasury and cash management bill stock totaled $110.7 billion, a decrease of $26 billion from the end of 2016–17 (see Chart 13).
Chart 13
Treasury Bills Outstanding and as a Share of Marketable Domestic Debt

In 2017–18, all treasury bill and cash management bill auctions were fully covered. Auction tails were higher than the 5-year average across treasury bill maturity sectors. Coverage ratios for treasury bill auctions in 2017–18 were lower than the 5-year average for the 6-month and 12-month sectors and higher for the 3-month sector and cash management bills (see Table 7).
| 3-month | 6-month | 12-month | Cash management bills | ||
|---|---|---|---|---|---|
| Tail | 2017–18 | 0.54 | 0.74 | 0.58 | 1.87 |
| 5-year average | 0.42 | 0.43 | 0.36 | 1.36 | |
| Coverage | 2017–18 | 2.20 | 2.29 | 2.34 | 2.87 |
| 5-year average | 2.14 | 2.38 | 2.41 | 2.60 | |
| Notes: Tail represents the number of basis points between the highest yield accepted and the average yield of an auction. Coverage is defined as the total amount of bids received, including bids from the Bank of Canada, divided by the amount auctioned. Tail and coverage ratio were calculated as the weighted averages, where the weight assigned to each auction equals the percentage total allotment in the auction's issuance sector. Source: Bank of Canada. | |||||
In 2017–18, the share of treasury bills allotted to primary dealers increased by 4 percentage points to 91 per cent, while the share allotted to customers decreased by 4 percentage points to 9 per cent (see Table 8). The 10 most active participants were in total allotted 93 per cent of these securities.
| Participant type | 2013–14 | 2014–15 (restated)2 | 2015–16 (restated)2 | 2016–17 | 2017–18 | |||||
|---|---|---|---|---|---|---|---|---|---|---|
| ($ billions) | (%) | ($ billions) | (%) | ($ billions) | (%) | ($ billions) | (%) | ($ billions) | (%) | |
| PDs | 275 | 78 | 256 | 84 | 255 | 85 | 253 | 87 | 230 | 91 |
| Non-PD GSDs | 4 | 1 | 0 | 0 | 0 | 0 | 0 | 0 | 0 | 0 |
| Customers | 74 | 21 | 49 | 16 | 45 | 15 | 38 | 13 | 23 | 9 |
| Top 5 participants | 222 | 63 | 192 | 63 | 216 | 72 | 198 | 68 | 174 | 69 |
| Top 10 participants | 300 | 85 | 259 | 85 | 261 | 87 | 262 | 90 | 235 | 93 |
| Total treasury bills issued | 353 | 305 | 300 | 291 | 253 | |||||
| Note: Numbers may not add due to rounding. 1 Net of Bank of Canada allotment. 2 Amounts are restated to account for historical revisions. Source: Bank of Canada. |
||||||||||
Foreign currency debt is used to fund the Exchange Fund Account (EFA), which represents the largest component of the official international reserves. The primary objectives of the international reserves are to provide the Government of Canada with liquidity and the ability to intervene in the foreign exchange market to support the Canadian dollar.
The EFA is primarily made up of liquid foreign currency securities and special drawing rights (SDRs). Liquid foreign currency securities are composed primarily of debt securities of highly rated sovereigns, their agencies that borrow in public markets and are supported by a comprehensive government guarantee, and highly rated supranational organizations. SDRs are international reserve assets created by the International Monetary Fund (IMF) whose value is based on a basket of international currencies. The official international reserves also include Canada's reserve position at the IMF. This position, which represents Canada's investment in the activities of the IMF, fluctuates according to drawdowns and repayments from the IMF. The Report on the Management of Canada's Official International Reserves (www.fin.gc.ca/purl/efa-eng.asp) provides information on the objectives, composition and performance of the reserves portfolio.
The market value of Canada's official international reserves increased to US$83.3 billion as at March 31, 2018 from US$82.6 billion as at March 31, 2017. The change comprised an US$837 million increase in EFA assets and a US$96 million decrease in the IMF reserve position. EFA assets, which totaled US$81.2 billion as at March 31, 2018, were held at a level that is consistent with the Government's commitment to maintain holdings of liquid foreign exchange reserves at or above 3 per cent of nominal GDP. The EFA is funded by liabilities of the Government of Canada denominated in, or converted to, foreign currencies. Funding requirements are primarily met through an ongoing program of cross-currency swaps of domestic bond issues. As at March 31, 2018, Government of Canada cross-currency swaps outstanding stood at US$60.2 billion (par value).
In addition to cross-currency swaps of domestic bond issues, the EFA is funded through a short-term US-dollar paper program (Canada bills), medium-term note (MTN) issuance in various markets (Canada notes, euro medium-term notes (EMTNs)) and international bond issues (global bonds). The funding method of choice depends on funding needs, costs, market conditions and funding diversification objectives (see Table 9).
| March 31, 2018 | March 31, 2017 | Change | |
|---|---|---|---|
| Swapped domestic issues | 60,229 | 58,143 | 2,086 |
| Global bonds | 8,461 | 8,634 | -173 |
| Canada bills | 2,011 | 2,305 | -294 |
| Euro medium-term notes | 685 | 660 | 25 |
| Canada notes | 1,300 | 1,300 | – |
| Total | 72,686 | 71,042 | 1,644 |
| Note: Liabilities are stated at the exchange rates prevailing on March 31, 2018. | |||
As at March 31, 2018, the Government of Canada had three global bonds outstanding.
| Year of issuance | Market | Amount in original currency | Yield (%) |
Term to maturity (years) |
Coupon (%) |
Benchmark interest rate—government bonds |
Spread from benchmark at issuance (basis points) |
Spread over swap curve in relevant currency on issuance date (basis points) |
|---|---|---|---|---|---|---|---|---|
| 2010 | Global | €2 billion | 3.571 | 10 | 3.500 | Germany | 19.4 | EURIBOR + 2.0 |
| 2014 | Global | US$3 billion | 1.658 | 5 | 1.625 | US | 11.0 | LIBOR - 1.0 |
| 2017 | Global | US$3 billion | 2.066 | 5 | 2.000 | US | 9.0 | LIBOR + 1.5 |
| Notes: EURIBOR = Euro Interbank Offered Rate. LIBOR = London Interbank Offered Rate. Source: Department of Finance Canada. |
||||||||
The MTN program provides the Government with additional flexibility to raise foreign currency. The program allows for issuance in a number of currencies, including the US dollar, euro and British pound sterling, using either a US MTN or EMTN prospectus. During 2017–18, no medium-term notes were issued.
| Date of issuance | Date of maturity | Market | Amount | Yield | Term to maturity (years) | Fixed/floating | Interest rate basis | Index maturity | Spread over swap curve in relevant currency on issuance date (basis points) |
|---|---|---|---|---|---|---|---|---|---|
| 10-Dec-2013 | 10-Dec-2019 | Canada notes | US$50,000,000 | 1.86% | 6 | Fixed | LIBOR - 2 | ||
| 13-Dec-2013 | 13-Dec-2019 | Canada notes | US$50,000,000 | 6 | Floating | US$ LIBOR | 3 month | LIBOR - 2 | |
| 20-Dec-2013 | 20-Dec-2020 | Canada notes | US$50,000,000 | 2.30% | 7 | Fixed | LIBOR + 0 | ||
| 19-Mar-2014 | 19-Mar-2020 | EMTN | US$125,000,000 | 6 | Floating | US$ LIBOR | 3 month | LIBOR + 0 | |
| 08-May-2014 | 08-May-2020 | EMTN | US$125,000,000 | 6 | Floating | US$ LIBOR | 3 month | LIBOR + 0 | |
| 10-Jun-2014 | 10-Jun-2020 | Canada notes | US$100,000,000 | 6 | Floating | US$ LIBOR | 3 month | LIBOR - 2 | |
| 10-Sep-2014 | 10-Sep-2020 | Canada notes | US$250,000,000 | 6 | Floating | US$ LIBOR | 3 month | LIBOR - 2 | |
| 15-Sep-2014 | 15-Sep-2020 | Canada notes | US$50,000,000 | 6 | Floating | US$ LIBOR | 3 month | LIBOR - 3 | |
| 15-Jan-2015 | 15-Jan-2021 | EMTN | €150,000,000 | 0.15% | 6 | Fixed | 6 month EURIBOR -27.5 | ||
| 24-Aug-2015 | 24-Aug-2021 | Canada notes | US$50,000,000 | 6 | Floating | US$ LIBOR | 3 month | LIBOR + 0 | |
| 25-Aug-2015 | 25-Aug-2019 | Canada notes | US$50,000,000 | 1.454% | 4 | Fixed | LIBOR - 6 | ||
| 27-Aug-2015 | 27-Aug-2018 | EMTN | US$250,000,000 | 3 | Floating | US$ LIBOR | 3 month | LIBOR - 10.5 | |
| 10-Feb-2016 | 10-Feb-2020 | Canada notes | US$150,000,000 | 1.276% | 4 | LIBOR + 15 | |||
| 21-Jul-2016 | 21-Jul-2019 | Canada notes | US$150,000,000 | 3 | Floating | US$ LIBOR | 3 month | LIBOR + 2 | |
| 07-Sep-2016 | 06-Sep-2019 | Canada notes | US$100,000,000 | 3 | Floating | US$ LIBOR | 3 month | LIBOR - 6 | |
| 13-Jan-2017 | 13-Jan-2020 | Canada notes | US$250,000,000 | 3 | Floating | US$ LIBOR | 3 month | LIBOR + 0 | |
| Notes: LIBOR = London Interbank Offered Rate. EURIBOR = Euro Interbank Offered Rate. Source: Department of Finance Canada. |
|||||||||
In 2017–18, the level of outstanding Canada Savings Bonds and Canada Premium Bonds held by retail investors decreased from $4.5 billion to $2.6 billion. Retail debt represented around 0.4 per cent of total market debt as at March 31, 2018 (see Chart 14).
In Budget 2017, the Government of Canada announced that it would discontinue the sales of new Canada Savings Bonds in 2017 given that retail debt is no longer a cost-effective source of funds or a preferred investment by Canadians. Following the announcement, Canadians who participated in the fall sales campaign of 2016, payroll channel, were allowed to continue to make contributions towards the products purchased during the campaign, but only until October 31, 2017. With the conclusion of the contributions period, the sales of new Canada Savings Bonds have been phased out.
Chart 14
Evolution of Retail Debt Stock, as at March 31

In 2017–18, gross sales and redemptions were $0.8 billion and $2.7 billion, respectively, for a net reduction of $1.9 billion in the stock of retail debt (see Table 12).
| Gross sales | Redemptions | Net change | |
|---|---|---|---|
| Payroll | 0.7 | 2.0 | -1.2 |
| Cash | 0.0 | 0.6 | -0.6 |
| Total | 0.8 | 2.7 | -1.9 |
| Note: Numbers may not add due to rounding. Source: Bank of Canada | |||
The Bank of Canada, as the Government's fiscal agent, manages the Receiver General (RG) Consolidated Revenue Fund, from which the balances required for the Government's day-to-day operations are drawn. The core objective of cash management is to ensure that the Government has sufficient cash available, at all times, to meet its operating requirements.
Cash consists of money on deposit to the credit of the Receiver General for Canada with the Bank of Canada, chartered banks and other financial institutions. Cash with the Bank of Canada includes operational balances and a $20 billion callable demand deposit held for the prudential liquidity plan.
RG cash balances decreased by $0.5 billion to $28.4 billion by the end of 2017–18 (see Table 13 and Chart 15).
| March 31, 2017 | March 31, 2018 | Average | Net change | |
|---|---|---|---|---|
| Callable deposits with the Bank of Canada | 20.0 | 20.0 | 20.0 | 0.0 |
| Balances with the Bank of Canada | 2.5 | 1.8 | 2.2 | -0.7 |
| Balances with financial institutions | 6.3 | 6.5 | 6.4 | 0.2 |
| Total | 28.8 | 28.4 | 28.6 | -0.5 |
| Note: Numbers may not add due to rounding. Source: Bank of Canada. | ||||
Chart 15
Daily Liquidity Position for 2016-17

The Government holds liquid financial assets in the form of domestic cash deposits and foreign exchange reserves to promote investor confidence and safeguard its ability to meet payment obligations in situations where normal access to funding markets may be disrupted or delayed. In 2017–18, the Government's overall liquidity levels were maintained to cover at least one month of net projected cash flows, including coupon payments and debt refinancing needs.
RG cash balances are invested in a prudent and cost-effective manner via short-term deposits allocated through auctions to chartered banks and other financial institutions. Since February 1999, when Canada's electronic funds transfer system—the Large Value Transfer System—was implemented, RG cash balances have been allocated to bidders twice daily through an auction process administered by the Bank of Canada. Roughly 90 per cent of daily RG cash balances are auctioned off in the morning auction while the remaining 10 per cent are auctioned off in the afternoon auction. These auctions serve two main purposes: first, as a treasury management tool, they are the means by which the Government invests its excess short-term Canadian-dollar cash balances; second, the auctions are used by the Bank of Canada in its monetary policy implementation to neutralize the impact of public sector flows on the level of settlement balances available to the financial system.
The balances placed via the morning auction are fully collateralized, which reduces the Government's exposure to counterparty credit risk. The balances placed via the afternoon auction for a term of one business day (i.e., overnight) remain completely uncollateralized as the auction process typically takes place late in the day and, as a result, operational constraints do not allow for collateralization before day's end (see Chart 16).
Chart 16
Allocation of Cash Balances for Receiver General Auctions
(Average of Daily Balances for Each Month of 2016-17 Fiscal Year)

A key measure of the cost to the Government of maintaining cash balances is the net return on these cash balances—the difference between the return on government cash balances auctioned to financial institutions (typically around the overnight rate) and the weighted average yield paid on treasury bills. A typically upward sloping yield curve results in a cost of carry for the Government, as financial institutions pay rates of interest for government deposits that are lower than the rate paid by the Government to issue treasury bills. Conversely, under an inverted yield curve, short-term deposit rates are higher than the average of 3- to 12-month treasury bill rates, which can result in a net gain for the Government.
In 2017–18 and 2016–17, treasury bill yields traded predominantly above the overnight rate, resulting in a loss of carrying cash of $14.5 million in 2017–18 and a loss of $6.9 million in 2016–17, following a gain of $2.2 million in 2015–16.
The cash management bond buyback (CMBB) program helps manage cash requirements by reducing the high levels of cash balances needed for key maturity and coupon payment dates. The program also helps smooth variations in treasury bill auction sizes over the year and reduce rollover risk. Securities targeted under this program are Government of Canada bonds with a term to maturity of up to 18 months where the total amount of maturing bonds is greater than $8 billion.
In 2017–18, the total amount of bonds repurchased through the CMBB program was $40.5 billion, compared to $33.3 billion in 2016–17. The maximum amount of CMBBs allowed for 2017–18 increased to $86 billion from $38.9 billion the previous year, mainly due to the introduction of a pilot program in January 2017 to increase flexibility in the maximum repurchase amount at each operation.15 The CMBB program had a success rate of 47 per cent for 2017–18 and 85.6 per cent for 2016–17. Overall, the CMBB program, together with the switch buyback and cash buyback programs, has contributed to reducing the size of the 2017 May 1, June 1, August 1, September 1 and November 1, as well as the 2018 February 1 and March 1, bond maturities by about 37.6 per cent, from a total of $92.8 billion outstanding when first targeted by the program to $57.9 billion outstanding at time of maturity.
The impact of repurchase operations is especially evident for June maturities (see Chart 17).
Chart 17
Impact of Repurchase Operations on Bond Maturities

1 Financial assets include securities, cash, receivables, advances etc. Non-financial assets include tangible capital assets, inventories and prepaid expenses.
2 Approved Orders in Council (OIC) are available on the Privy Council Office website. The reference numbers for the 2017-18 OICs are 2017-1436 and 2017-0228. A second OIC was needed in 2017–18 to grant the Minister the necessary authorities under the new Parliamentary borrowing authority framework.
3 Non-market liabilities include pensions, other employee and veteran future benefits, and other liabilities.
4 See the Bank of Canada website.
5 Non-fungible securities do not share the same maturity dates with outstanding bond issues. The benchmark size for bonds that are fungible with existing bonds is deemed attained once the total amount of outstanding bonds for that maturity exceeds the minimum benchmark size.
6 See the Bank of Canada website.
7 Data on foreign holdings of both Canadian-dollar-denominated and foreign currency instruments issued by the Government of Canada is collected by Statistics Canada from the Bank of Canada on new issues and through monthly and quarterly questionnaires of market participants on cross-border transactions.
8 See the Bank of Canada website.
9 See the Bank of Canada website.
10 The turnaround time is the time taken between the submission of a bid and the return of the complete output to the auction participant. The Bank of Canada targets an average turnaround time of less than 3 minutes for auctions and less than 5 minutes for buyback operations. Maximum turnaround times are 5 minutes for auctions and 10 minutes for buyback operations.
11 See the Bank of Canada website.
12 The amount of new bonds issued through buybacks on a switch basis does not necessarily equal the amount of old bonds bought back through those operations because the exchange is not based on par value, but rather is on a duration-neutral equivalent basis.
13 Tails are not calculated for Real Return Bond auctions since successful bidders are allotted bonds at the single-price equivalent of the highest real yield (single-price auction type) of accepted competitive bids. See Section 5 of the Standard Terms for Auctions of Government of Canada Securities.
14 The Bank of Canada purchased 13 to 14 per cent of the amount issued at each nominal bond auction in 2017–18. A customer is a bidder on whose behalf a government securities distributor (GSD) has been directed to submit a competitive or non-competitive bid for a specified amount of securities at a specific price.
15 See press release for more details.