
Archived - Debt Management Report 2020–2021

Table of Contents
Foreword by the Deputy Prime Minister and Minister of Finance
Introduction
Highlights for 2020-21
Part I 2020-21 Debt Management Context
Composition of Federal Debt
Sources of Borrowings and Uses of Borrowings
Borrowing Authorities
Contingency and Extraordinary Borrowing Authorities
Government of Canada Credit Rating Profile
Part II Report on Objectives, Strategic Direction and Principles
Objectives, Strategic Direction and Principles
Raising Stable and Low-Cost Funding, and Strategic Direction
Maintaining a Well-Functioning Government Securities Market
Part III Report on the 2020-21 Debt Program
Domestic Marketable Bonds
Treasury Bills and Cash Management Bills
Foreign Currency Debt
Retail Debt
Cash Management
Investment of Receiver General Cash Balances
Cash Management Bond Buyback Program
Annex 1 Completed Treasury Evaluation Reports
Annex 2 Debt Management Policy Measures Taken Since 1997
Foreword by the Deputy Prime Minister and Minister of Finance
For nearly two years, Canadians have been grappling with COVID-19. Since the outset, our government understood the need to provide unprecedented support so that we could save lives, protect our economy, and support Canadian workers and Canadian businesses. The federal government has provided eight out of every ten dollars spent in Canada to fight COVID-19.
Every year, the federal government provides a report to Parliament and to Canadians that details the government's domestic debt program. This report reflects the main activities of the government's borrowing program as set out in the 2020-21 Debt Management Strategy and is guided by the key principles of transparency, regularity, prudence, and liquidity. As in the past, the government has consulted dealers and investors as part of the process for developing the debt management strategy.
This report demonstrates that Canada's debt management operations continue to support the effective execution of the debt management program, contributing to the objectives of raising stable and low-cost funding and to maintain a well-functioning market for Government of Canada securities, and to implement the government's strategic direction to maximize the financing of the COVID-19-related debt through long-term issuance. It also shows that there remains strong demand for Government of Canada debt securities, contributing to the stability of Canada's debt, with about 76 per cent domestically held.
Our government remains committed to the fiscal anchors that we outlined in last spring's budget, to reducing the federal debt-to-GDP ratio, and to unwinding COVID-19-related deficits. Canada's total government net debt-to-GDP (gross domestic product) ratio remains the lowest in the G7 and our government will continue to be a responsible and careful fiscal manager.
As we look to the years ahead, jobs and economic growth must be our priority. We will continue our work to make life more affordable and build an even stronger economy for the future by investing in Canadians and Canadian businesses in a deliberate, responsible, and effective way.
The Honourable Chrystia Freeland, P.C., M.P.
Deputy Prime Minister and Minister of Finance
Ottawa, 2022
Purpose of This Publication
This edition of the Debt Management Report provides a detailed account of the Government of Canada’s borrowing and debt management activities for the fiscal year ending March 31, 2021, and reflects developments and policies implemented under the borrowing program since the onset of the COVID-19 pandemic.
As required under Part IV (Public Debt) of the Financial Administration Act (the "FAA"), this publication provides transparency and accountability regarding these activities. It reports on actual borrowing and uses of funds compared to those forecast in the Debt Management Strategy for 2020-21, published on July 8, 2020, in the Economic and Fiscal Snapshot 2020.
It also discusses the environment in which the debt was managed, the composition of the debt, changes in the debt during the year, strategic policy initiatives and performance outcomes. Finally, this publication discusses the government’s activities in relation to any money borrowed under paragraphs 47(b) and 46.1(c) of the FAA, which enacts the government’s extraordinary borrowing authority.
Other Information
The Public Accounts of Canada is tabled annually in Parliament and is available on the Public Services and Procurement Canada website. The Debt Management Strategy and the Report on the Management of Canada’s Official International Reserves, which are also tabled annually in Parliament, are available on the Department of Finance Canada website. Additionally, monthly updates on cash balances and foreign exchange assets are available through The Fiscal Monitor, which is also available on the Department of Finance Canada website. Under the Borrowing Authority Act (the "BAA"), the Minister of Finance (the "Minister") is required to table a report to Parliament every three years on amounts borrowed by the Minister on behalf of Her Majesty in right of Canada and by agent Crown corporations. The most recent report was tabled in Parliament on November 23, 2020 and is available on the Department of Finance Canada website.
The Extraordinary Borrowing Report to Parliament tabled in Parliament on October 22, 2020, provides a detailed account of amounts borrowed in extraordinary circumstances under section 47 of the FAA (as enacted by the COVID-19 Emergency Response Act). This report provides details on extraordinary borrowings that were undertaken between April 1, 2020 and September 30, 2020, and is available on the Department of Finance Canada website. Furthermore, the 2021-22 Extraordinary Borrowing Report to Parliament was tabled in Parliament on May 25, 2021. This report provides details on extraordinary borrowings that were undertaken between March 23, 2021 to May 6, 2021, and is available on the Department of Finance Canada website.
Executive Summary
Introduction
This publication reports on two major activities: (i) the management of federal market debt (the portion of the debt that is borrowed in financial markets); and (ii) the investment of cash balances in liquid assets for operational purposes and contingency planning.
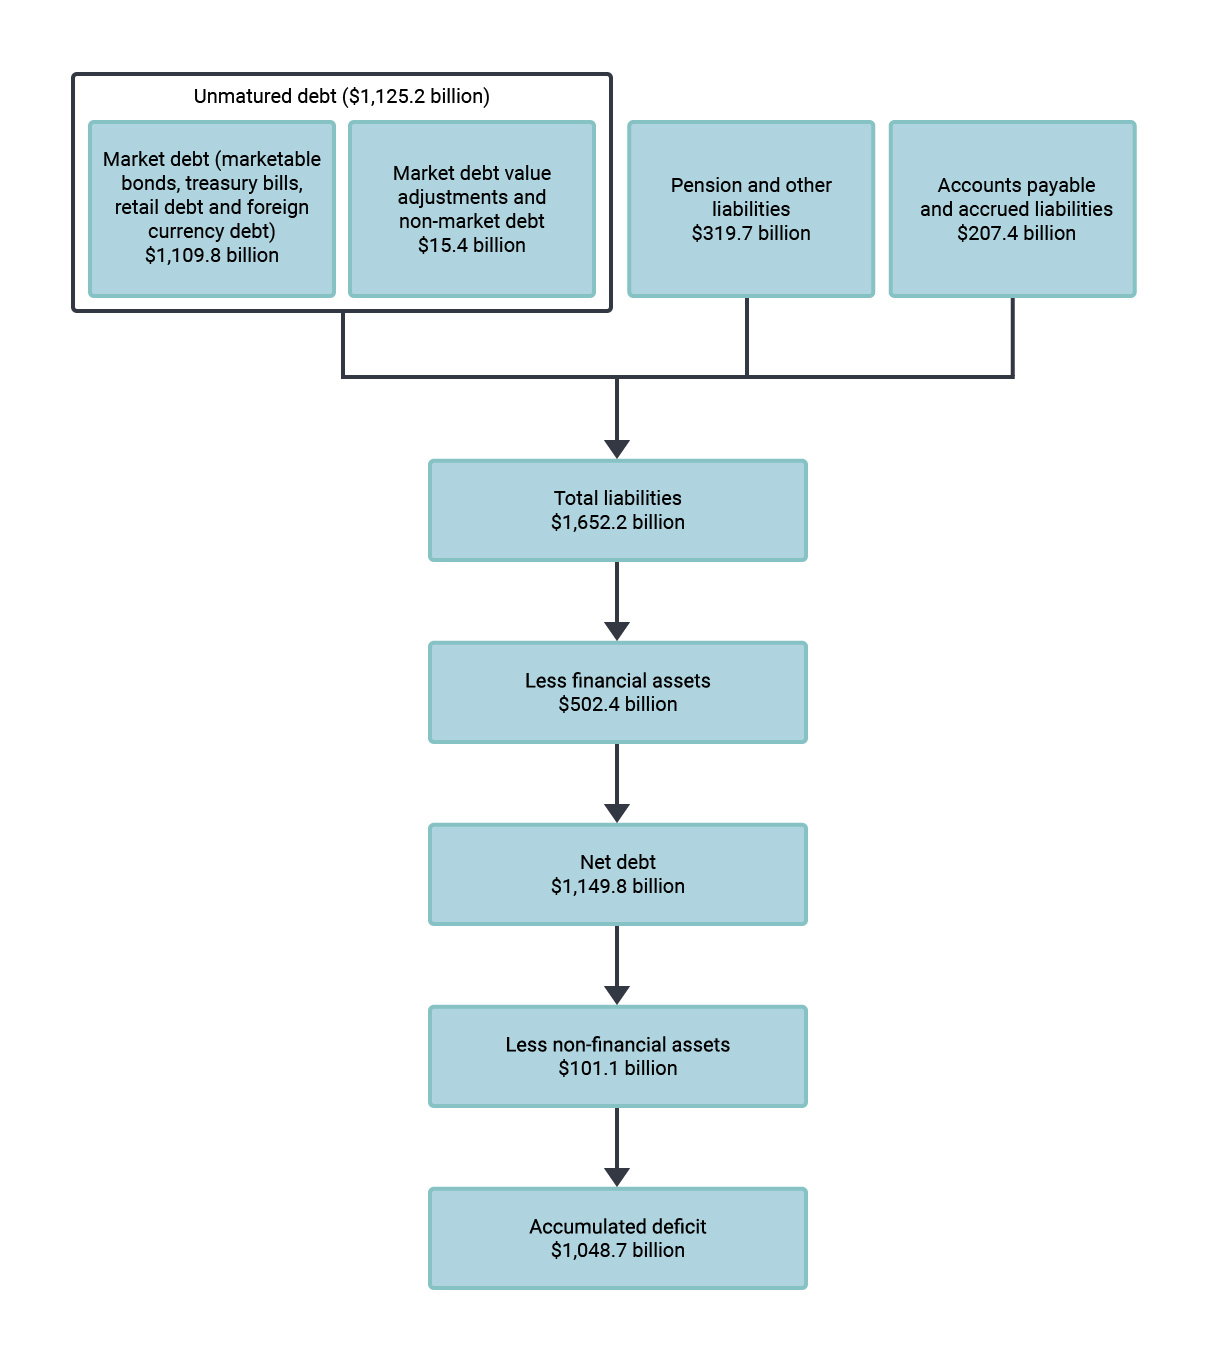
The government’s market debt, including marketable bonds, treasury bills, retail debt and foreign currency debt, stood at $1,109.8 billion at the end of fiscal year 2020-21 (see boxed area of Chart 1). In addition to market and other types of unmatured debt, other liabilities, brought the total liabilities of the Government of Canada to $1,652.2 billion at that time. When financial and non-financial assetsFootnote 1 are subtracted from total liabilities, the federal debt or accumulated deficit of the Government of Canada was $1,048.7 billion as at March 31, 2021 (see Chart 1).
Domestic funding is conducted through the issuance of marketable securities, which consist of nominal bonds, Real Return Bonds and treasury bills, including cash management bills. These securities are sold through competitive auctions (occasionally through a syndication process at the government’s discretion) to government securities distributors, a group of banks and investment dealers in the Canadian market. These government securities distributors then resell these securities to their wholesale and retail clients in the secondary market.
Government of Canada marketable securities are widely held and can be found in retail and institutional investment portfolios, insurance companies and pension funds, central banks (including the Bank of Canada), as well as a variety of other investment vehicles. Overall, about 76 per cent of Government of Canada market debt was held by Canadian investors, such as insurance companies and pension funds, and financial institutions and governments. The participation of international investors in Government of Canada securities markets is of benefit to Canadians, as they serve to increase competition, increase the diversity of the government’s investor base, and ultimately reduce borrowing costs for Canadian taxpayers.
Cross-currency swaps of domestic obligations and issuance of foreign currency debt are used to fund foreign reserve assets held in the Exchange Fund Account (see the section entitled “Foreign Currency Debt”).
Federal Balance Sheet, as at March 31, 2021
Highlights for 2020-21
The Debt Management Report consists of three parts covering the main aspects of the Government of Canada's debt program. "Part I – 2020-21 Debt Management Context" focuses on the state of the accumulated deficit (i.e., federal debt), the year's financial requirement and the sources of borrowings used to raise funds, the federal government's credit ratings, and the authorities required to borrow. "Part II – Report on Objectives, Strategic Direction, and Principles" reports on debt management objectives to implement the government's strategic direction to maximize the financing of the COVID-19-related debt through long-term issuance, to raise stable and low-cost funding to meet the financial needs of the Government of Canada, and to maintain a well-functioning market for Government of Canada securities."Part III – Report on the 2020-21 Debt Program" reports on the operational aspects of the market debt program.
This year’s debt management operations continue to support the effective execution of the debt management program. The main highlights are as follows:
COVID-19 and Debt Management
The Debt Management Strategy sets out the objectives, strategy, and borrowing plans for the government’s domestic debt program, and in particular, underscored issuing a historic level of long-term bonds to finance the emergency support to Canadians and Canadian businesses through the pandemic. In 2020-21, the debt program involved many changes to respond to the COVID-19 pandemic, most notably a significant increase in borrowing. In particular, this environment presented a unique opportunity to issue a historic level of long-term bonds to manage the significant increase in debt resulting from the response to COVID-19. The objective was to provide security and stability to the government balance sheet by lowering debt rollover and providing more predictability in the cost of servicing debt. The government issued a combined $105.5 billion in 10-year and 30-year bonds in 2020-21, compared to $19.0 billion in 2019-20.
In response to the extraordinary circumstances caused by the COVID-19 pandemic, on March 31, 2020, the Minister approved for the first time borrowings under extraordinary circumstances, pursuant to section 47 of the FAA. The COVID-19 Emergency Response Act that received Royal Assent on March 25, 2020 enacted these authorities. Under section 47 of the FAA, $285.3 billion was borrowed during the 2020-21 fiscal year. Furthermore, on March 23, 2021, the Administrator of the Government of Canada in Council authorized the Minister to borrow money under paragraph 46.1(c) of the FAA. Under section 46.1(c), $6.6 billion was borrowed during the 2020-21 fiscal year. These COVID-19 extraordinary borrowings were the largest contributor to the rise in the government’s market debt from $765.2 billion as of March 2020 to $1,109.8 billion as of March 2021.
Stock of Domestic Market Debt
Accounting for a $154.4 billion lower financial requirement than what was projected at the time of the Economic and Fiscal Snapshot 2020, the stock of domestic market debt increased by $344.6 billion in 2020-21, bringing the total stock to $1,109.8 billion. The change in the stock was mainly comprised of a $278.4 billion increase in marketable bonds payable in Canadian dollars, a $66.9 billion increase in treasury and cash management bills, a $0.2 billion decrease in retail debt stock, and a $0.5 billion decrease in marketable debt payable in foreign currencies. Notwithstanding the increase in debt stock, Canada’s total government net debt-to-GDP (gross domestic product) ratio remains the lowest among the Group of Seven (G7) nations, according to the International Monetary Fund (IMF).
Consistent with an increased issuance at lower interest rate levels for 2020-21, the weighted average rate of interest on market debt decreased to 1.35 per cent, down from 2.03 per cent in 2019-20.
Strong Demand for Government of Canada Debt Securities
In 2020-21, despite the unprecedented increases in borrowing and initial market stresses experienced at the onset of the COVID-19 pandemic, market participants indicated that early and transparent changes to the debt program and the Bank of Canada’s various financial market support programs were paramount in successfully stabilizing financial markets. These programs supported the absorption of a record amount of federal government debt, especially in longer-term sectors.
Accordingly, treasury bill and bond auctions remained well-covered and competitively bid, providing an efficient manner for the government to raise funding. The publication of the Quarterly Bond Schedule before each quarter and the Call for Tenders before each auction helped maintain transparency. This promoted well-functioning markets for the government’s securities to the benefit of a wide array of domestic market participants, contributing to the objective of raising stable and low-cost funding.
Part I
2020-21 Debt Management Context
Composition of Federal Debt
In 2020-21, total market debt increased by $344.6 billion (or about 45 per cent) to $1,109.8 billion (see Table 1). For additional information on the financial position of the government, see the 2020-21 Annual Financial Report of the Government of Canada.
| 2021 | 2020 | Change | |
|---|---|---|---|
| Payable in Canadian currency | |||
| Marketable bonds | 875.3 | 596.9 | 278.4 |
| Treasury and cash management bills | 218.8 | 151.9 | 66.9 |
| Retail debt | 0.3 | 0.5 | -0.2 |
| Total payable in Canadian currency | 1,094.4 | 749.2 | 345.2 |
| Payable in foreign currencies | 15.4 | 15.9 | -0.5 |
| Total market debt | 1,109.8 | 765.2 | 344.6 |
| Market debt value adjustment, capital lease obligations and other unmatured debt | 15.4 | 18.6 | -3.2 |
| Total unmatured debt | 1,125.2 | 783.8 | 341.4 |
| Pension and other accounts | 319.7 | 301.0 | 18.6 |
| Total interest-bearing debt | 1,444.8 | 1,084.8 | 360.1 |
| Accounts payable, accruals and allowances | 207.4 | 163.8 | 43.6 |
| Total liabilities | 1,652.2 | 1,248.6 | 403.6 |
| Total financial assets | 502.4 | 435.7 | 66.7 |
| Total non-financial assets | 101.1 | 91.5 | 9.5 |
| Accumulated deficit (i.e., federal debt) | 1,048.7 | 721.4 | 327.4 |
|
Note: Numbers may not add due to rounding. |
|||
Sources of Borrowings and Uses of Borrowings
The key reference point for debt management is the financial requirement or financial source, which represents the net cash outflow or inflow for the fiscal year. This measure differs from the budgetary balance (i.e., the deficit or surplus on an accrual basis) by the amount of non-budgetary transactions and the timing of payments on a cash basis, which can be significant. Non-budgetary transactions include changes in federal employee pension liabilities; changes in non-financial assets; investing activities through loans, investments and advances; and changes in other financial assets and liabilities, including foreign exchange activities. Anticipated borrowing and planned uses of borrowings are set out in the debt management strategy, while actual borrowing and uses of borrowings compared to those forecast are reported in this publication (see Table 2).
There was a financial requirement of $314.6 billion in 2020-21, reflecting $327.7 billion in cash outflows due to a budgetary deficit and a cash inflow of $13.2 billion due to non-budgetary transactions. The financial requirement was $154.4 billion lower than the projection in the Debt Management Strategy for 2020-21. For comparison, the financial requirement in 2019-20 was $47.2 billion.
In 2020-21, loans to the Business Development Bank of Canada, Canada Mortgage and Housing Corporation and Farm Credit Canada under the Crown Borrowing Program declined by $3 billion or was $50.6 billion lower than the planned $48.0 billion increase. Since the inception of the program in 2007-08, the consolidated borrowings of these Crown corporations have accumulated to account for $78.3 billion of federal market debt.
| Planned1 | Actual | Difference | |
|---|---|---|---|
| Sources of borrowings | |||
Payable in Canadian currency |
|||
Treasury bills |
294 | 219 | -75 |
Bonds |
409 | 370 | -39 |
Retail debt |
0 | 0 | 0 |
| Total payable in Canadian currency | 703 | 589 | -114 |
| Payable in foreign currencies | 10 | 4 | -6 |
| Total sources of borrowings | 713 | 593 | -120 |
| Uses of borrowings2 | |||
Refinancing needs |
|||
Payable in Canadian currency |
|||
Treasury bills |
152 | 152 | 0 |
Bonds |
92 | 93 | 1 |
Of which: |
|||
Bonds that mature |
92 | 93 | 1 |
Switch bond buybacks |
0 | 0 | 0 |
Cash management bond buybacks |
0 | 0 | 0 |
Retail debt |
0 | 0 | 0 |
Total payable in Canadian currency |
244 | 245 | 1 |
Payable in foreign currencies |
1 | 5 | 4 |
Total refinancing needs |
245 | 250 | 5 |
Financial requirement or source |
|||
Budgetary balance |
343 | 328 | -15 |
Non-budgetary transactions |
|||
Pension and other accounts |
-15 | -17 | -2 |
Non-financial assets |
5 | 10 | 5 |
Loans, investments and advances |
139 | 26 | -113 |
Of which: |
|||
Loans to enterprise Crown corporations3 |
48 | -3 | -51 |
Insured Mortgage Purchase Program |
51 | 1 | -50 |
Other |
41 | 28 | -13 |
Other transactions4 |
-4 | -32 | -28 |
Total non-budgetary transactions |
126 | -13 | -139 |
Total financial source/requirement |
469 | 315 | -154 |
| Total uses of borrowings | 713 | 564 | -149 |
| Change in other unmatured debt transactions5 | 0 | 3 | 3 |
| Net increase or decrease (-) in cash | 0 | 27 | 27 |
|
Note: Numbers may not add due to rounding. |
|||
Borrowing Authorities
In order to undertake market borrowing activities, the Minister needs authority from Parliament as well as the Governor in Council (the “GIC”).
Under the Parliamentary borrowing authority framework enacted on November 23, 2017, Parliamentary authority is granted through the BAA and Part IV of the FAA, which together allow the Minister to borrow money up to a maximum overall amount as approved by Parliament. The FAA also authorizes the Minister to borrow in excess of the approved maximum amount under limited circumstances for the specific purposes of refinancing outstanding debt, extinguishing or reducing liabilities, and making payments in extraordinary circumstances, such as natural disasters.
Subject to the noted limited exceptions, the maximum stock of borrowings approved by Parliament in effect during the 2020-21 fiscal year was $1,168 billion, which also includes amounts borrowed by agent Crown corporations, and Canada Mortgage Bonds guaranteed by Canada Mortgage and Housing Corporation. As of March 31, 2021, $1,133 billion of the Parliamentary-approved borrowing authority was used. Section 15 of the Economic Statement Implementation Act, 2020 adjusted the maximum amount of borrowing approved by Parliament to $1,831 billion effective as of May 6, 2021.
Part IV of the FAA also requires the Minister to receive annual approval from the GIC to carry out borrowing for the Government of Canada for each fiscal year, including issuing securities in financial markets and undertaking related activities subject to a maximum aggregate amount. On the recommendation of the Minister, the GIC approved $550 billion to be the maximum aggregate principal amount of money that may be borrowed by the Minister in 2020-21.Footnote 2 The maximum aggregate principal amount is the sum of the following sub-components: (i) the maximum stock of treasury bills anticipated to be outstanding during the year; (ii) the total value of refinanced and anticipated new issuances of marketable bonds; and (iii) amounts to facilitate intra-year management of the debt and foreign exchange accounts.
During 2020-21, $315 billion of the GIC-approved borrowing authority was used, $235 billion below the authorized borrowing authority limit. The amount borrowed in 2021 pursuant to the COVID-19 Emergency Response Act is excluded from the calculation of the annual borrowing authority approved by the GIC. However, including borrowings pursuant to the COVID-19 Emergency Response Act, the aggregate principal amount borrowed was $593 billion, $120 billion lower than the plan set out in the Debt Management Strategy for 2020-21 (see Table 2).
Contingency and Extraordinary Borrowing Authorities
There are two sets of contingency and extraordinary borrowing authorities under the FAA. The first set under section 46.1 was enacted in 2016 under the new borrowing authority framework. The second set under section 47 was enacted through the COVID-19 Emergency Response Act that Parliament passed on March 25, 2020. Borrowings under both provisions are exempt from the overall maximum borrowing amount as set out in the BAA.
In response to the extraordinary circumstances caused by the COVID-19 pandemic, on March 31, 2020, the Minister authorized borrowings under section 47 of the FAA. This unprecedented provision authorized the Minister to conduct new and necessary borrowings to fund the Government of Canada through this crisis. From April 1, 2020 to September 30, 2020, the total amount borrowed under paragraph 47(b) was $285.3 billion. Additional information in the Extraordinary Borrowing Report to Parliament for these borrowings is available on the Department of Finance Canada website.
On March 23, 2021, in response to further extraordinary circumstances, the Administrator of the Government of Canada in Council authorized the Minister to borrow money under paragraph 46.1(c) of the FAA. This provision authorized the Minister to conduct necessary borrowings to continue to fund the Government of Canada through the crisis.
The Administrator of the Government of Canada in Council approved two Orders in Council on March 23, 2021:
- Order in Council P.C. 2021-177 authorized the Minister to borrow money in extraordinary circumstances beginning on March 23, 2021 and ending on March 31, 2021.
- Order in Council PC. 2021-179 authorized the Minister to borrow money in extraordinary circumstances beginning on April 1, 2021 and ending on May 6, 2021.
The total sum borrowed from March 23, 2021 to March 31, 2021, inclusive, under paragraph 46.1(c) as authorized under Order in Council P.C. 2021-177 was $6.6 billion. From April 1, 2021 to May 6, 2021, inclusive, the total amount borrowed under paragraph 46.1(c) as authorized under Order in Council P.C. 2021-179 was $1.6 billion. These funds were to address the government's financial requirement, including to fund a variety of COVID-19 related programs and policies. Additional information on the 2021-22 Extraordinary Borrowing Report is available on the Department of Finance Canada website.
The domestic borrowing activities from March 23, 2021 to May 6, 2021 consisted of a combination of treasury bills and nominal bonds. During this period, $92.0 billion was issued, and of this amount, $8.2 billion was raised under the extraordinary borrowing authority. Most of these issuances are still outstanding.
Government of Canada Credit Rating Profile
The Government of Canada throughout 2020-21 continued to receive the highest possible credit ratings amongst most rating agencies, with a stable outlook, on Canadian-dollar and foreign-currency-denominated short- and long-term debt (see Table 3).
In June 2020, Fitch downgraded Canada to ‘AA+’ from ‘AAA’ citing the deterioration of Canada’s public finances resulting from the pandemic response, in particular, the rise of the general government gross debt-to-GDP. The four other rating agencies are generally focusing on general government net debt-to-GDP and have indicated that Canada’s sound macroeconomic policy frameworks, economic resilience and diversity, stability of its financial system, and the strength of monetary and fiscal flexibility are all reflected in Canada’s strong current credit ratings: Moody’s (Aaa), S&P (AAA), DBRS (AAA) and JCRA (AAA).
| Rating agency | Term | Domestic currency |
Foreign currency |
Outlook | Previous rating action |
|---|---|---|---|---|---|
| Moody’s Investors Service | Long-term Short-term |
Aaa - |
Aaa P-1 |
Stable | May 2002 |
| Standard & Poor’s | Long-term Short-term |
AAA A-1+ |
AAA A-1+ |
Stable | July 2002 |
| Fitch Ratings | Long-term Short-term |
AA+ F1+ |
AA+ F1+ |
Stable | June 2020 |
| Dominion Bond Rating Service | Long-term Short-term |
AAA R-1 (High) |
AAA R-1 (High) |
Stable | n/a |
| Japan Credit Rating Agency | Long-term | AAA | AAA | Stable | n/a |
Part II
Report on Objectives, Strategic Direction and Principles
Objectives, Strategic Direction and Principles
Objectives
The debt management objectives were to raise stable and low-cost funding to meet the financial needs of the Government of Canada and to maintain a well-functioning market for Government of Canada securities.
Strategic Direction
In light of the unique situation posed by the COVID-19 crisis, in its Debt Management Strategy for 2020-21 published in the Economic and Fiscal Snapshot 2020, the government announced its intent to issue a historic level of long-term bonds to manage the significant increase in debt resulting from the response to COVID-19.
In the Update on the 2020-21 Debt Management Strategy published in the Fall Economic Statement 2020, the government indicated that the debt strategy will continue to follow a prudent approach and will take steps where possible to continue to increase the proportion of bond issuance occurring at the long-end.
Principles
In support of these objectives and a prudent strategic direction, the design and implementation of the domestic debt program are guided by the key principles of transparency, regularity, prudence and liquidity. Towards this end, the government publishes strategies and plans, and consults regularly with market participants to ensure the integrity and attractiveness of the market for dealers and investors. The structure of the market debt is managed conservatively in a cost-risk framework, preserving access to diversified sources of funding and supporting a broad investor base.
Raising Stable and Low-Cost Funding, and Strategic Direction
In general, achieving stable and low-cost funding involves striking a balance between debt costs and various risks in the debt structure. This selected balance between cost and risk is mostly achieved through the deliberate allocation of issuance among various debt instruments and terms.
Market Debt Issuance in 2020-21
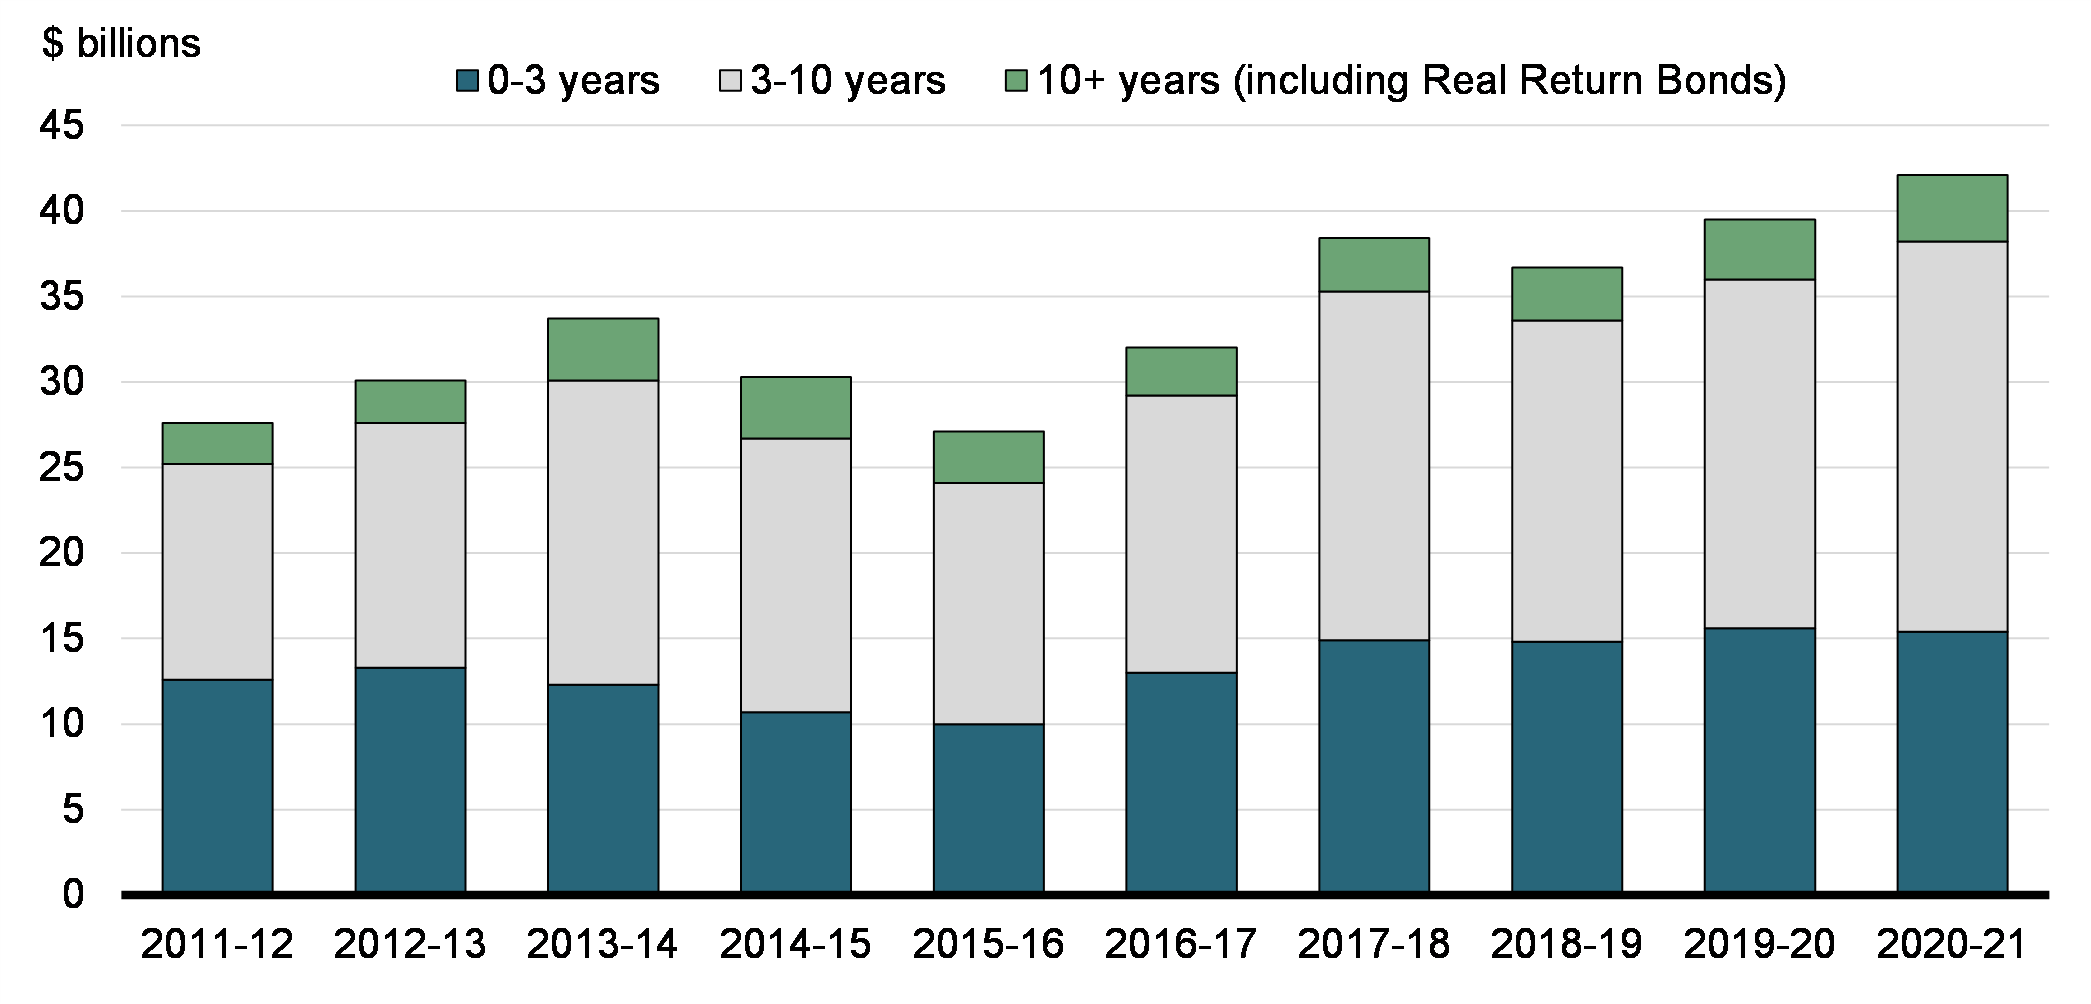
In 2020-21, to support government actions during COVID-19, the government significantly increased total issuance to $369.9 billion, from $127.0 billion in 2019-20. Debt instruments across all terms experienced a significant increase in issuance, with longer-term bonds (i.e., 10-year+) seeing the largest increase on a percentage basis. In particular, 10-year issuance increased to $73.5 billion, from $13.5 billion in 2019-20, and 30-year issuance increased to $32.0 billion, from $5.5 billion in 2019-20 (see Table 4.1). Overall, $106.9 billion in long-term bonds were issued (including Real Return Bonds), up from $20.8 billion in 2019-20 (see Table 4.2).
During 2020-21, the allocation of long bond issuance was 29 per cent, 13 percentage points higher than the previous fiscal year (see Table 4.2) and 3 percentage points higher than the plan set out in the Debt Management Strategy for 2020-21 (see Table 4.3).As the financial requirement came in $154.4 billion lower than projected, the planned issuance in longer-term sectors was maintained, and the issuance of treasury bills and short-term bonds decreased.
| 2019-20 Previous Year |
2020-21 Planned |
2020-21 Actual |
Difference between Actual and Planned |
2020-21 Actual vs 2019-20 % change |
|
|---|---|---|---|---|---|
| Treasury bills | 152 | 294 | 219 | -75 | 44% |
2-year |
53 | 150 | 129 | -21 | 143% |
3-year |
20 | 65 | 57 | -8 | 187% |
5-year |
34 | 88 | 78 | -10 | 131% |
10-year |
14 | 74 | 74 | 0 | 444% |
30-year |
6 | 32 | 32 | 0 | 480% |
Real Return Bonds |
1.8 | 1.4 | 1.4 | 0 | -22% |
| Total bonds | 127 | 409 | 370 | -39 | 191% |
| Total gross issuance | 279 | 713 | 589 | -114 | 111% |
| 2019-20 Previous Year | 2020-21 Actual | |||
|---|---|---|---|---|
| Issuance ($ billions) |
Share of Bond Issuance |
Issuance ($ billions) |
Share of Bond Issuance |
|
| Short (2, 3, 5-year sectors) | 106.2 | 84% | 263.0 | 71% |
| Long (10-year+) | 20.8 | 16% | 106.9 | 29% |
| Gross bond issuance | 127.0 | 100% | 369.9 | 100% |
| 2020-21 Planned | 2020-21 Actual | |||
|---|---|---|---|---|
| Issuance ($ billions) |
Share of Bond Issuance |
Issuance ($ billions) |
Share of Bond Issuance |
|
| Short (2, 3, 5-year sectors) | 302.0 | 74% | 263.0 | 71% |
| Long (10-year+) | 106.9 | 26% | 106.9 | 29% |
| Gross bond issuance | 408.9 | 100% | 369.9 | 100% |
Market Debt Composition
The composition of the stock of market debt is a reflection of past debt issuance choices (e.g., over the last 30 years for the 30-year sector). The effects of changes in issuance patterns of short-term debt instruments become visible relatively quickly, while the full effect of issuance changes in longer-term debt instruments takes their entire maturity periods to be fully appreciated. A well-distributed maturity profile helps maintain a prudent risk exposure to changes in interest rates over time at an affordable cost, while promoting well-functioning markets by providing liquidity across different maturity sectors.
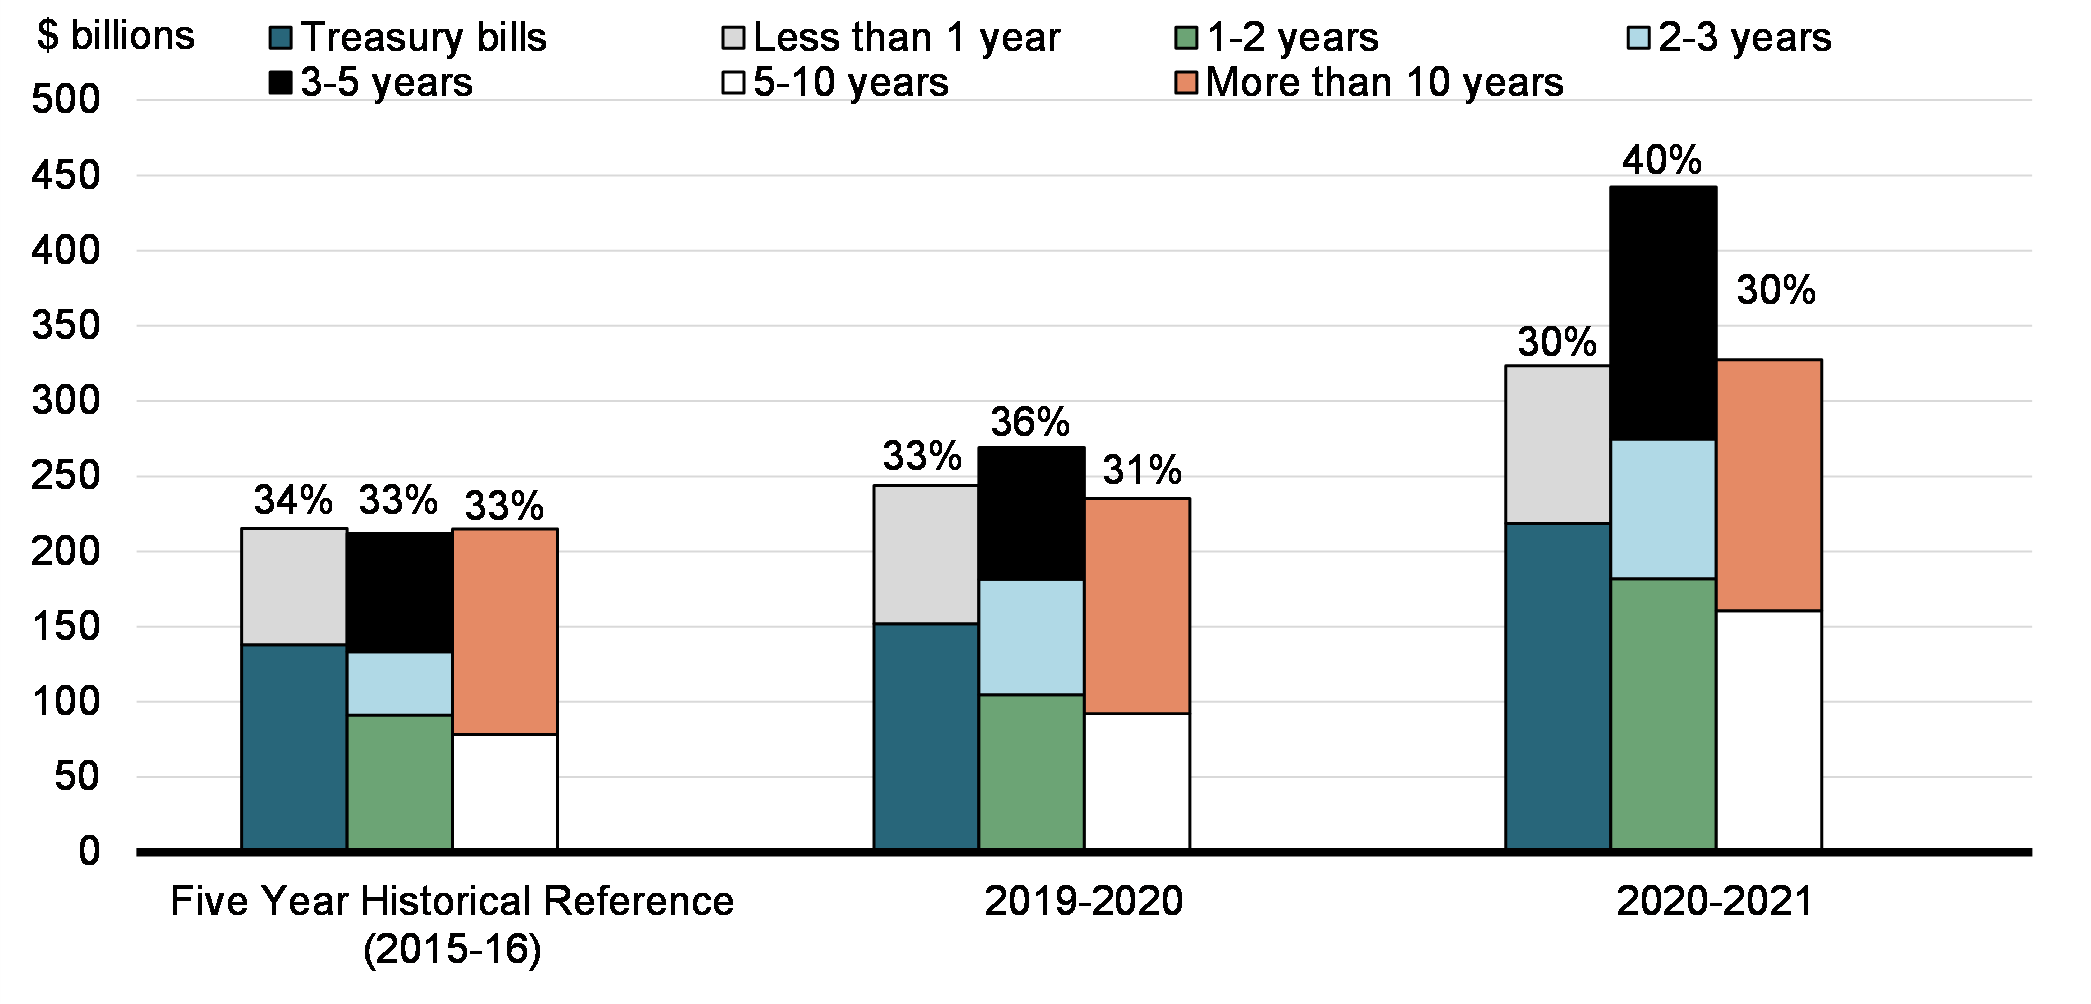
Composition of Market Debt by Remaining Term to Maturity
In terms of the composition of the market debt, short-term bonds experienced the highest increase at the beginning of the pandemic, as they can absorb larger borrowing needs in volume more rapidly than long-term bonds. With the significant increase in long-term bond issuance during 2020-21, the effect on the composition of the debt will become more pronounced in the coming years as shorter-term bonds mature (see Chart 2).
Composition of Market Debt by Remaining Term to Maturity, as at March 31
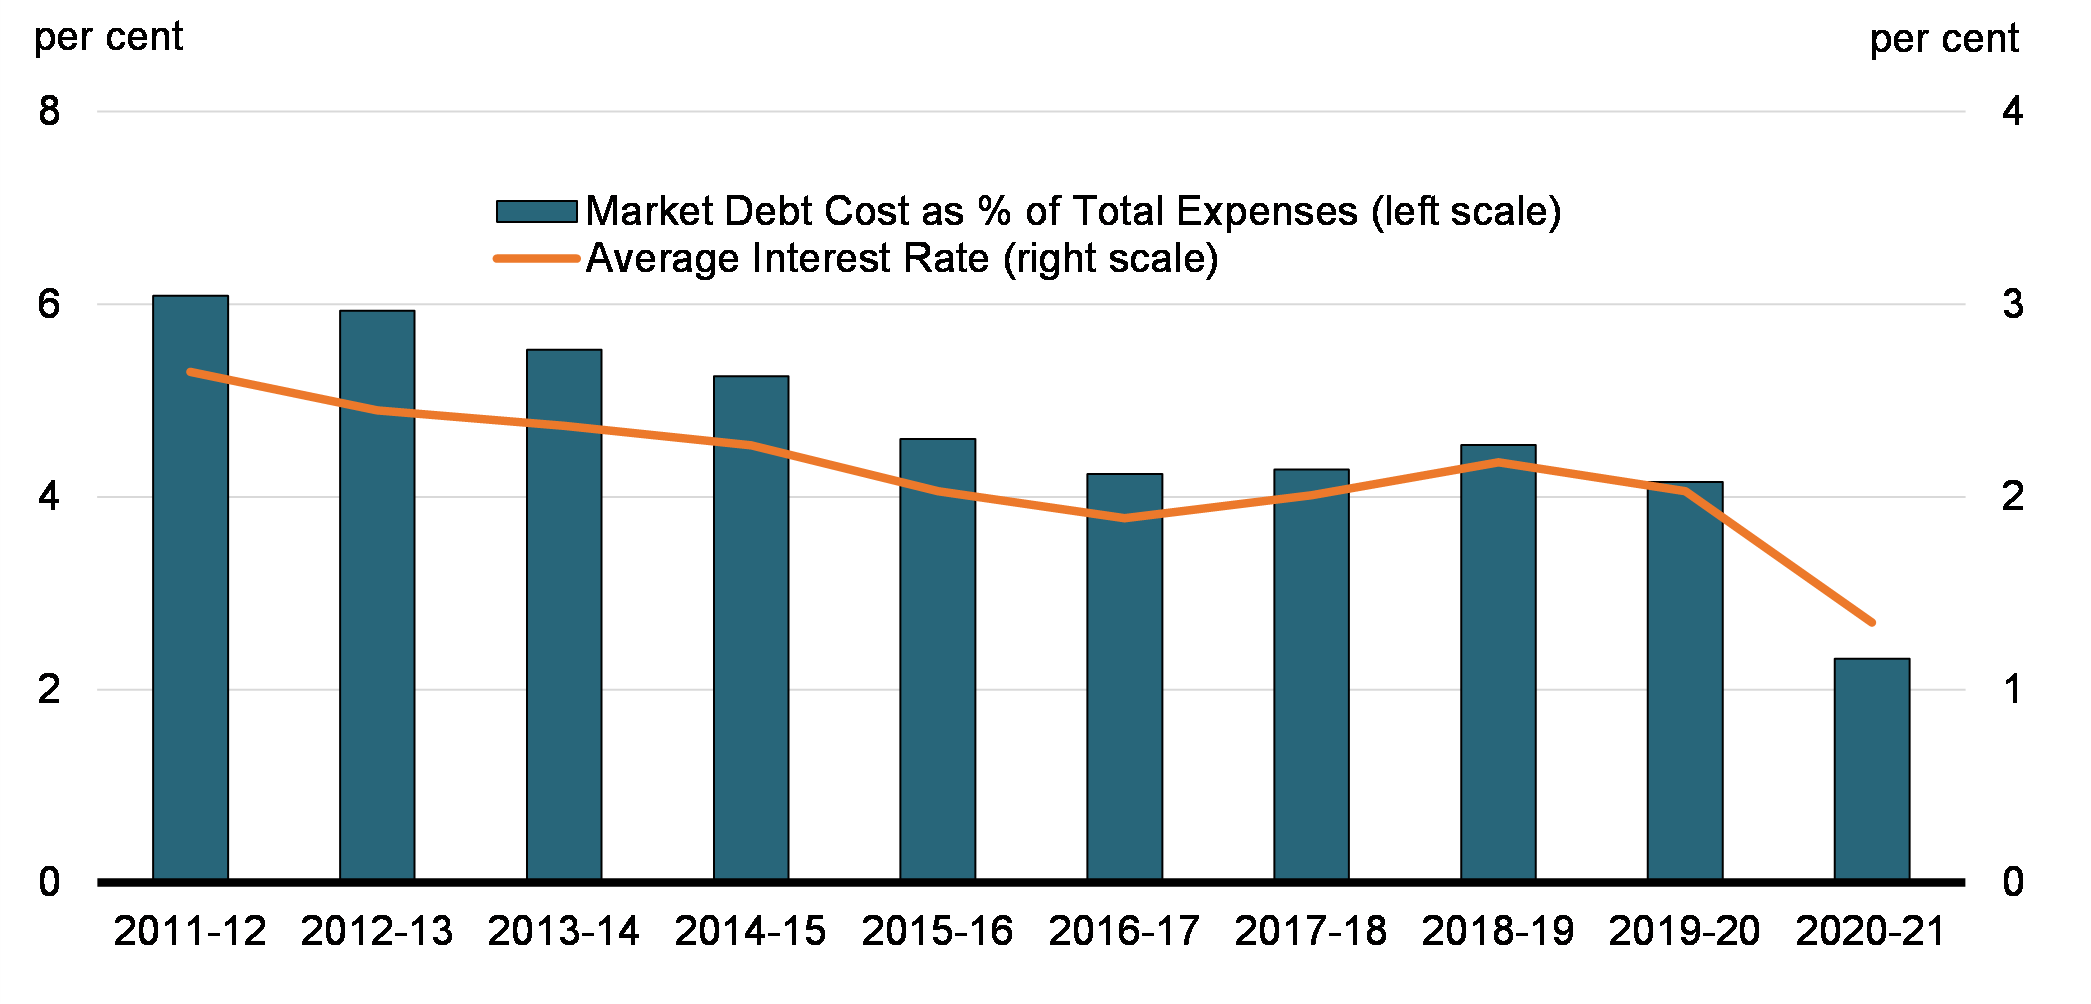
Cost of Market Debt
Annual interest rate cost on the market debt is the largest component of public debt charges (public debt charges also include interest expenses on non-market liabilities).Footnote 3 The weighted average rate of interest on the stock of market debt was 1.35 per cent in 2020-21, down from 2.03 per cent in 2019-20. Despite the unprecedented increase in the stock of market debt, the interest rate cost on the market debt as a share of total government expenses continued to decrease from 4.16 per cent in 2019-20 to 2.33 per cent in 2020-21, the lowest to date (see Chart 3).
Market Debt Costs and Average Effective Interest Rate
Market Debt: Average Term to Maturity and Debt Rollover
Prudent management of debt refinancing needs promotes investor confidence and strive to minimize the impact of market volatility or disruptions on the funding program. According to a number of common measures of market debt refinancing risks, including average term to maturity (ATM) and debt rollover, the Government of Canada market debt remained prudent through the COVID-19 pandemic.
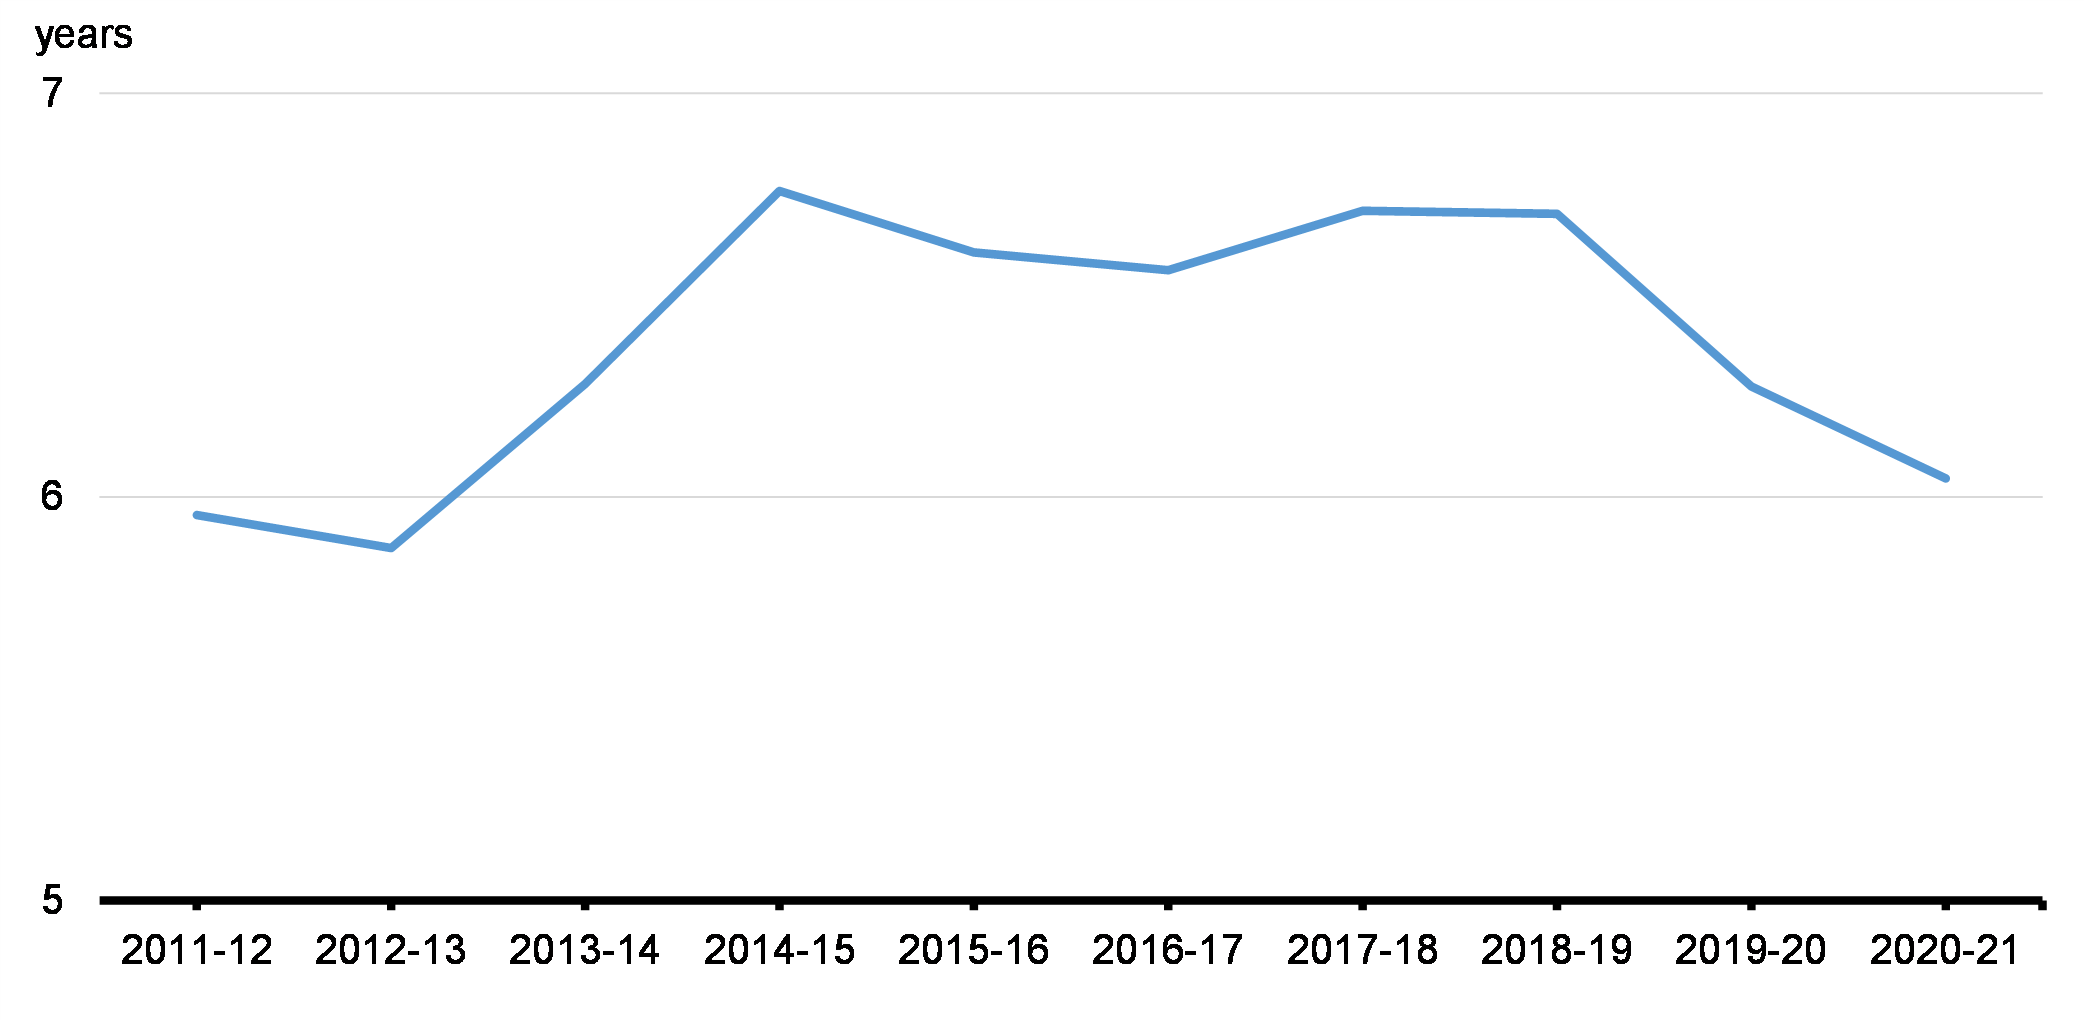
Average Term to Maturity
The ATM of market debt tends to rise and fall mostly with the stock of treasury bills. This can be seen in the period from 2013-14 to 2014-15 when cash inflows from maturing insured mortgages bought during 2008-09, led to a peak ATM of 6.8 years by the end of 2014-15.
The ATM declined from 6.7 years in 2018-19 to 6.3 years by the end of 2019-20, reflecting the increased issuance of treasury bills to support a liquid and well-functioning market for Government of Canada treasury bills. By the end of 2020-21, the ATM declined slightly to 6.0 years, due to the increased proportion of short-term bonds where there are generally more opportunities to increase issuance in volume (see Chart 4.1).
Average Term to Maturity of Government of Canada Market Debt
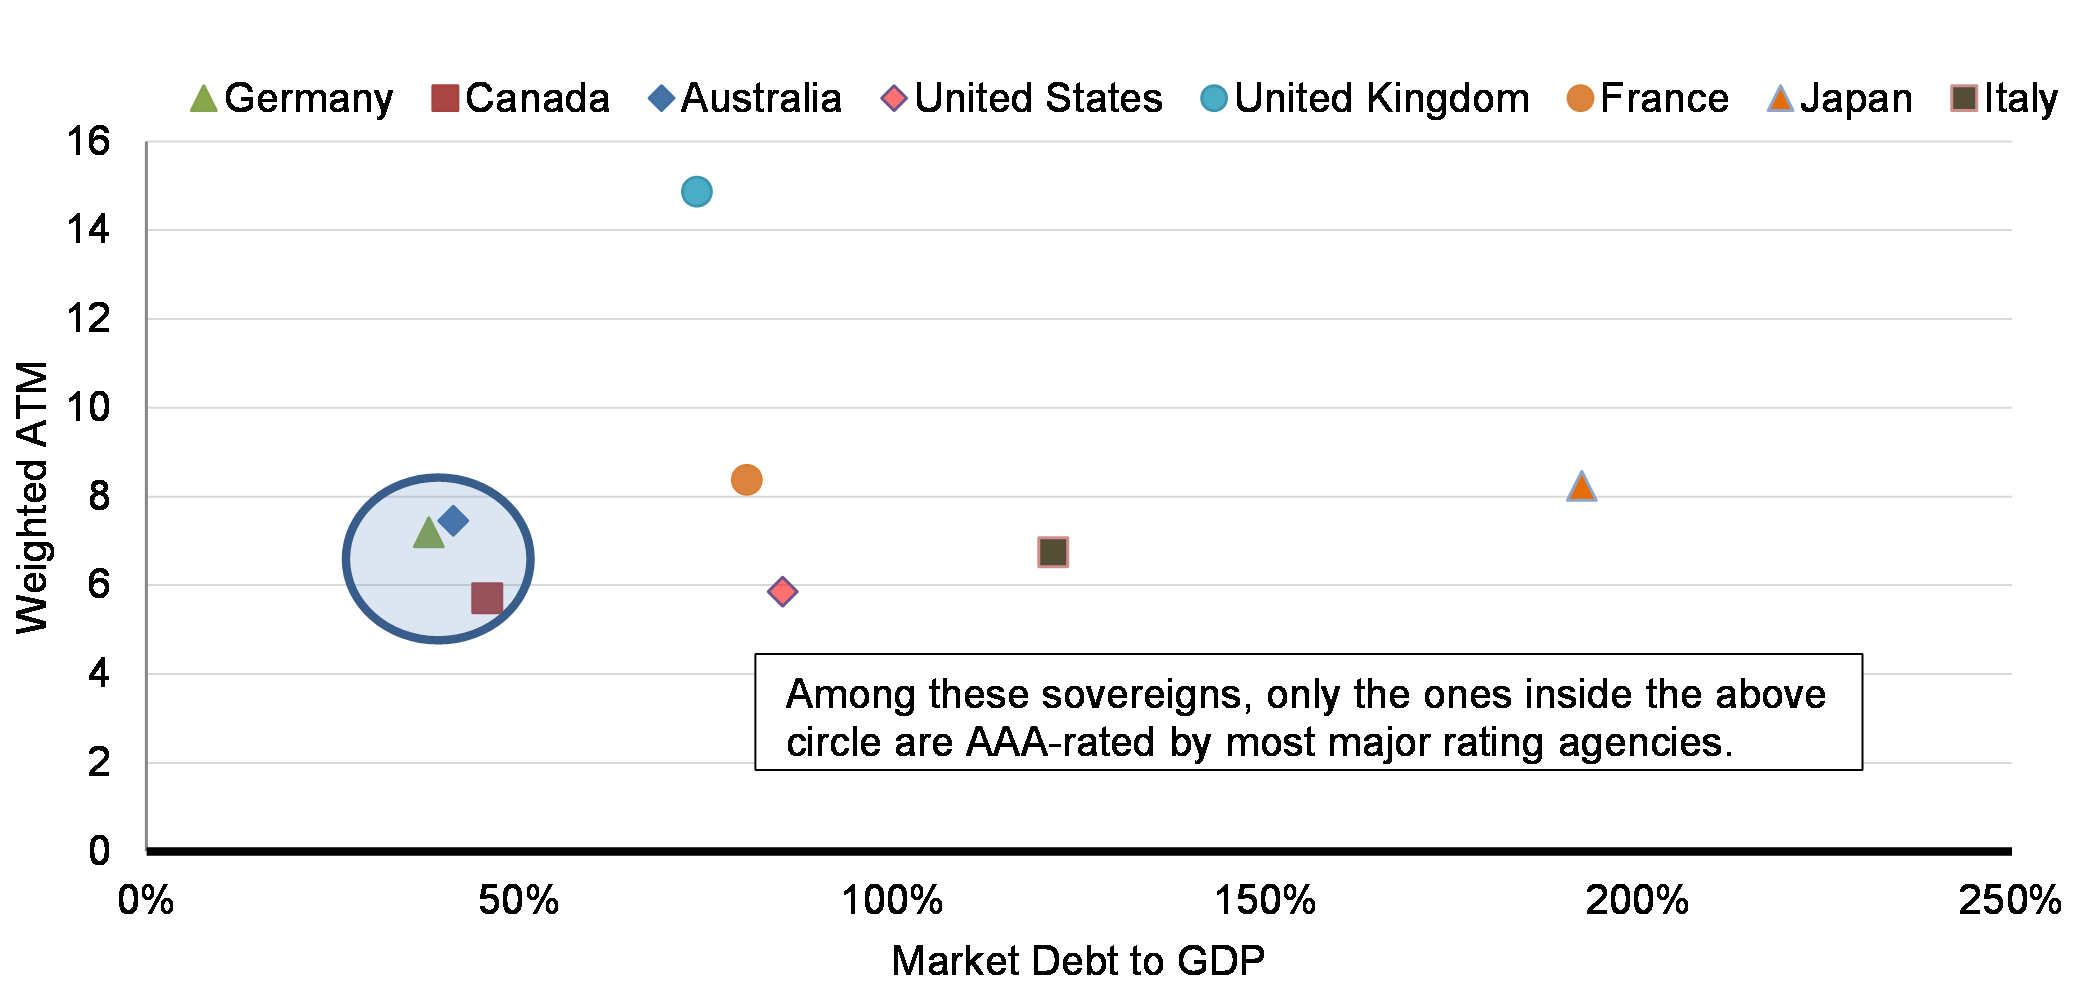
Canada has successfully built a prudent debt structure relative to GDP over the last 30 years. In general, low debt-to-GDP countries can choose a higher risk level (i.e., lower ATM) in exchange for lower interest rate costs. Overall, Canada is in line with other AAA countries (see Chart 4.2).
Weighted ATM vs Market Debt-to-GDP
Debt Rollover: Quarterly Maturities to GDP
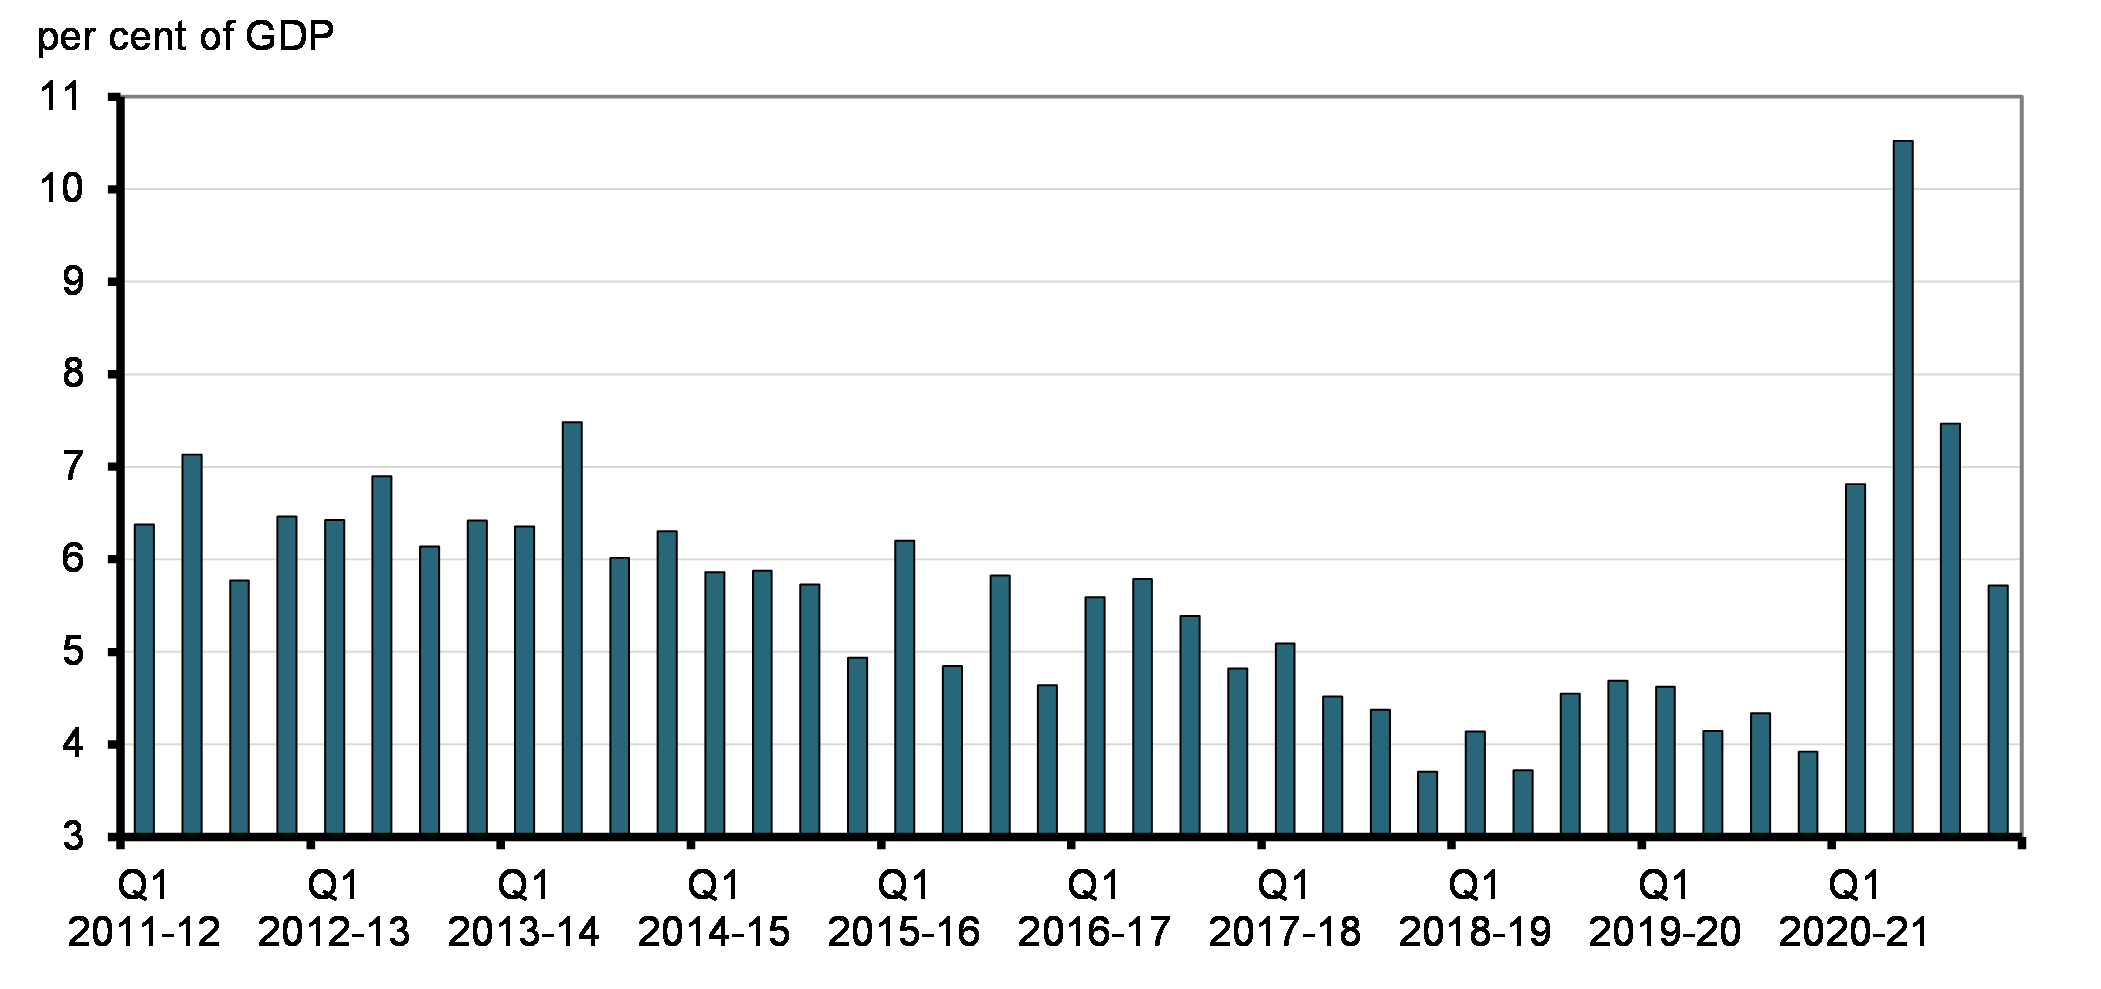
As market debt increased significantly through the COVID-19 pandemic to support Canadians and the economy, the debt rollover, as measured by the amount of debt maturing per quarter as a percentage of GDP, also increased. Quarterly maturities to GDP rose as a result of a significant increase in treasury bills issued early in 2020-21 given the rapid increase in the cash requirement to support government actions. By mid-fiscal year, maturing treasury bills were successfully recycled into bonds, and therefore, quarterly maturities to GDP started to decline. Accordingly, debt maturities to GDP declined from a peak of 10.5 per cent to a more prudent 5.7 per cent, compared to an average of 4.3 per cent in 2019-20 (see Chart 5).
Quarterly Maturities of Domestic Market Debt to GDP
Debt Rollover: Single-Day Maturities
In pursuing higher bond issuance and to help smooth future cash flow profiles, in 2020-21 the government added a December 1 maturity date in the 10-year sector and two new maturity dates in the 3-year bond sector: April 1 and October 1 (previously fungible with 5-year bonds). Accordingly, the government now has 10 maturity dates.
The benchmark maturity date profile is as follows:
- 2-year bonds: February 1, May 1, August 1, November 1
- 3-year bonds: April 1, October 1
- 5-year bonds: March 1, September 1
- 10-year bonds: June 1, December 1
- 30-year bonds: December 1 – although Real Return Bonds and nominal 30-year bonds mature on December 1, they do not mature in the same year.
Maintaining a Well-Functioning Government Securities Market
A well-functioning market in Government of Canada securities benefits the government as a borrower as it directly supports the fundamental objective of raising stable, low-cost funding, while also benefiting a wide range of market participants.
A well-functioning market helps the government to have more certain access to funding markets over time, contributes to lower and less volatile interest rate costs for the government, and provides flexibility to meet changing financial requirements. For market participants, a liquid and transparent secondary market in government debt instruments provides risk-free assets for investment portfolios, stability to other domestic fixed-income markets for which Government of Canada securities serve as benchmarks (e.g., provinces, municipalities and corporations), and useful tool for hedging interest rate risk.
In supporting a liquid and well-functioning market through this year’s extreme uncertainty, the Government of Canada promoted transparency and consistency regarding the management of its debt program through continuous communications and outreach. The following actions promoted a well-functioning Government of Canada securities market in 2020-21.
Providing Regular and Transparent Issuance
During 2020-21, the Government of Canada continued announcing bond auction schedules prior to the start of each quarter, and provided details for each operation in a Call for Tender in the week leading up to an auction.Footnote 4 In 2020-21, there were regular auctions for 2-, 3-, 5-, 10- and 30-year nominal and Real Return Bonds. Bond issuance schedules were communicated through the Bank of Canada website on a timely basis.
Concentrating on Key Benchmarks
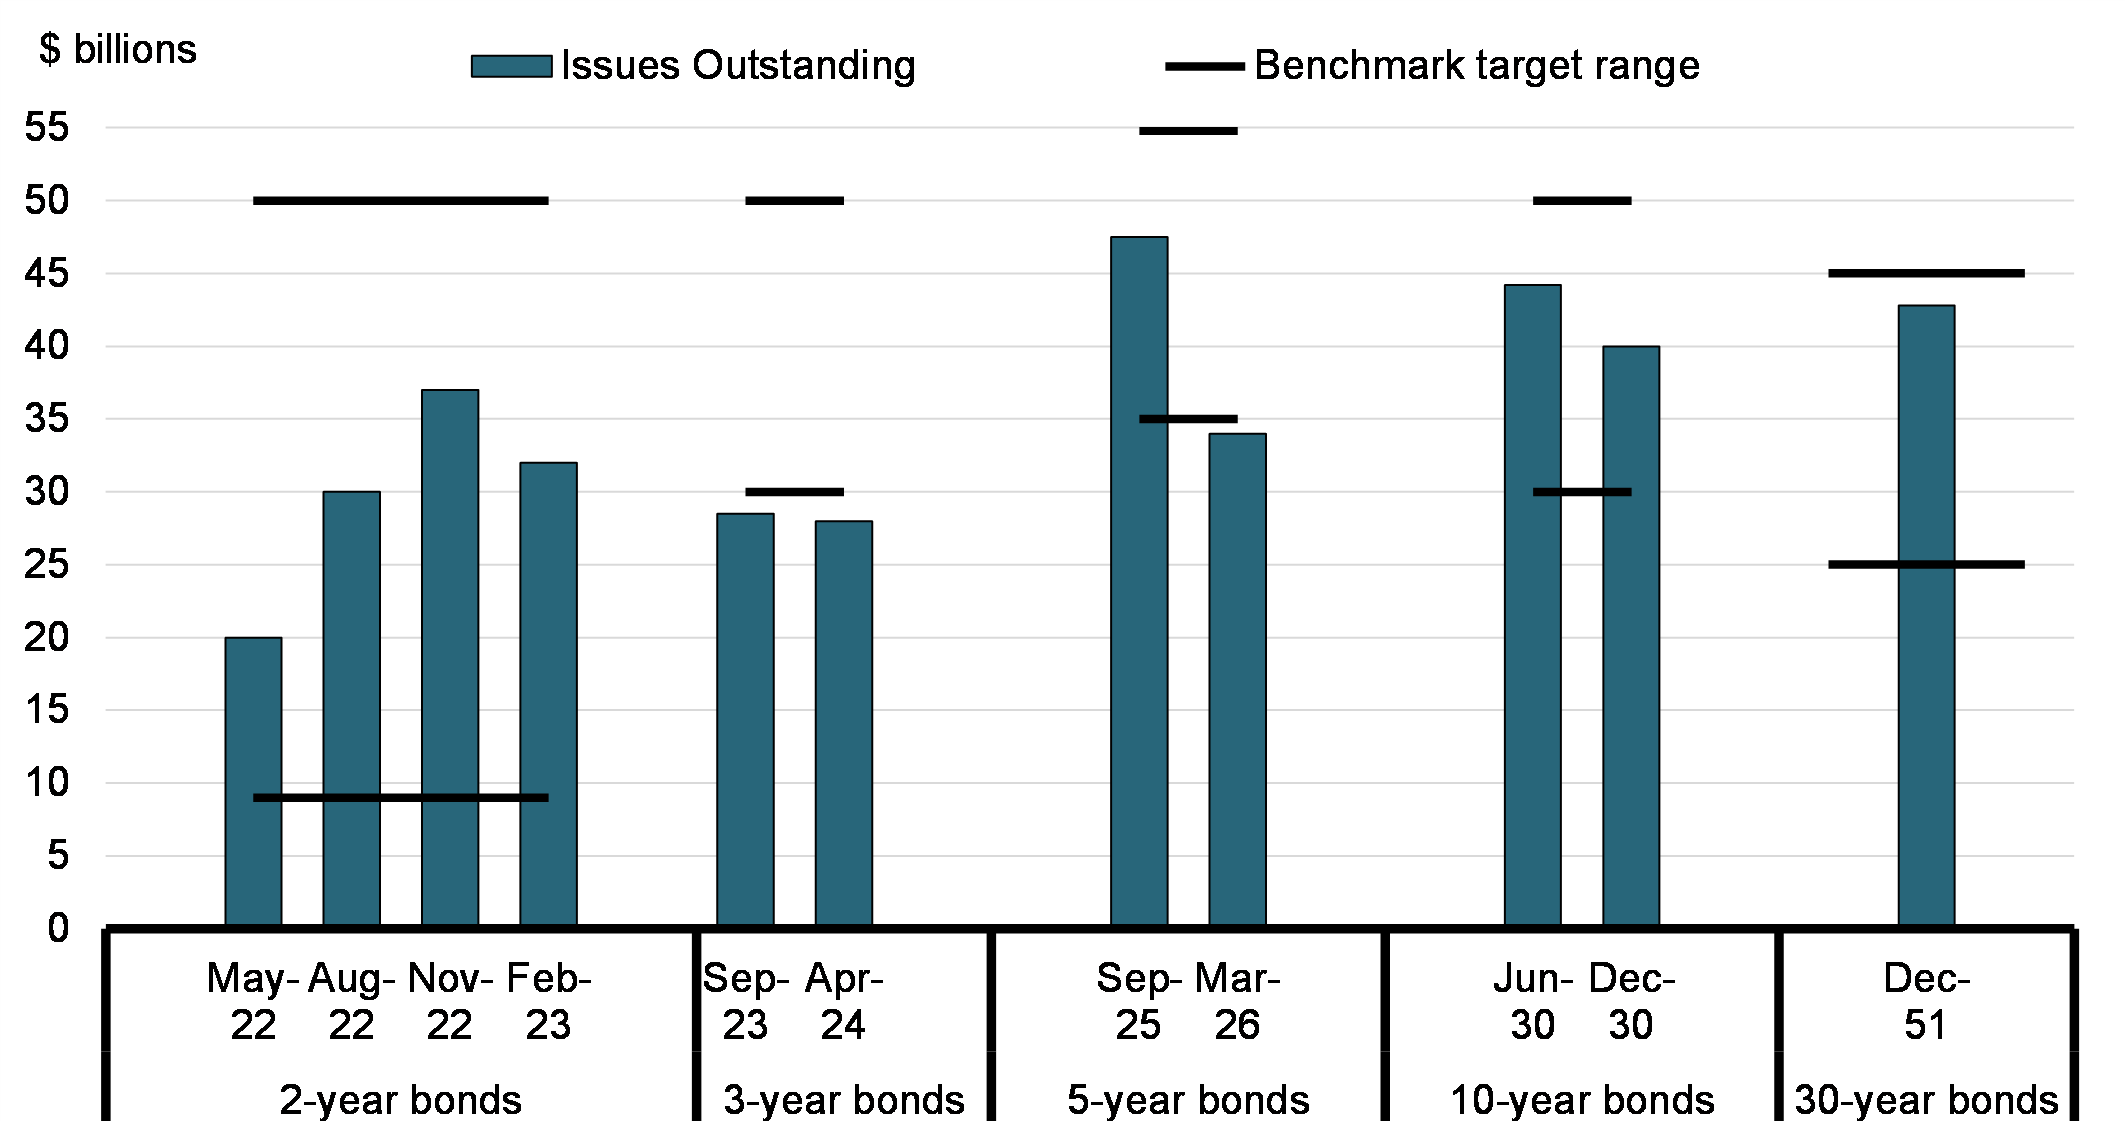
Compared to 2019-20, as a result of the increased financial requirement due to the COVID-19 pandemic, all the bond benchmark ranges were increased to unprecedented levels in 2020-21. In the most part, building benchmarks reached the new and increased ranges with few exceptions (see Chart 6).Footnote 5
- 2-year bonds: $9 billion to $50 billion
- 3-year bonds: $30 billion to $50 billion
- 5-year bonds: $35 billion to $55 billion
- 10-year bonds: $30 billion to $50 billion
- 30-year nominal bonds: $25 billion to $45 billion
Size of Bond Benchmarks in 2020-2021
Ensuring a Broad Investor Base in Government of Canada S ecurities
A diversified investor base supports an active secondary market for Government of Canada securities, thereby helping to keep funding costs low and stable. Diversification of the investor base is pursued by maintaining a domestic debt program that issues securities in a wide range of maturity sectors, which meet the needs of many different types of investors.
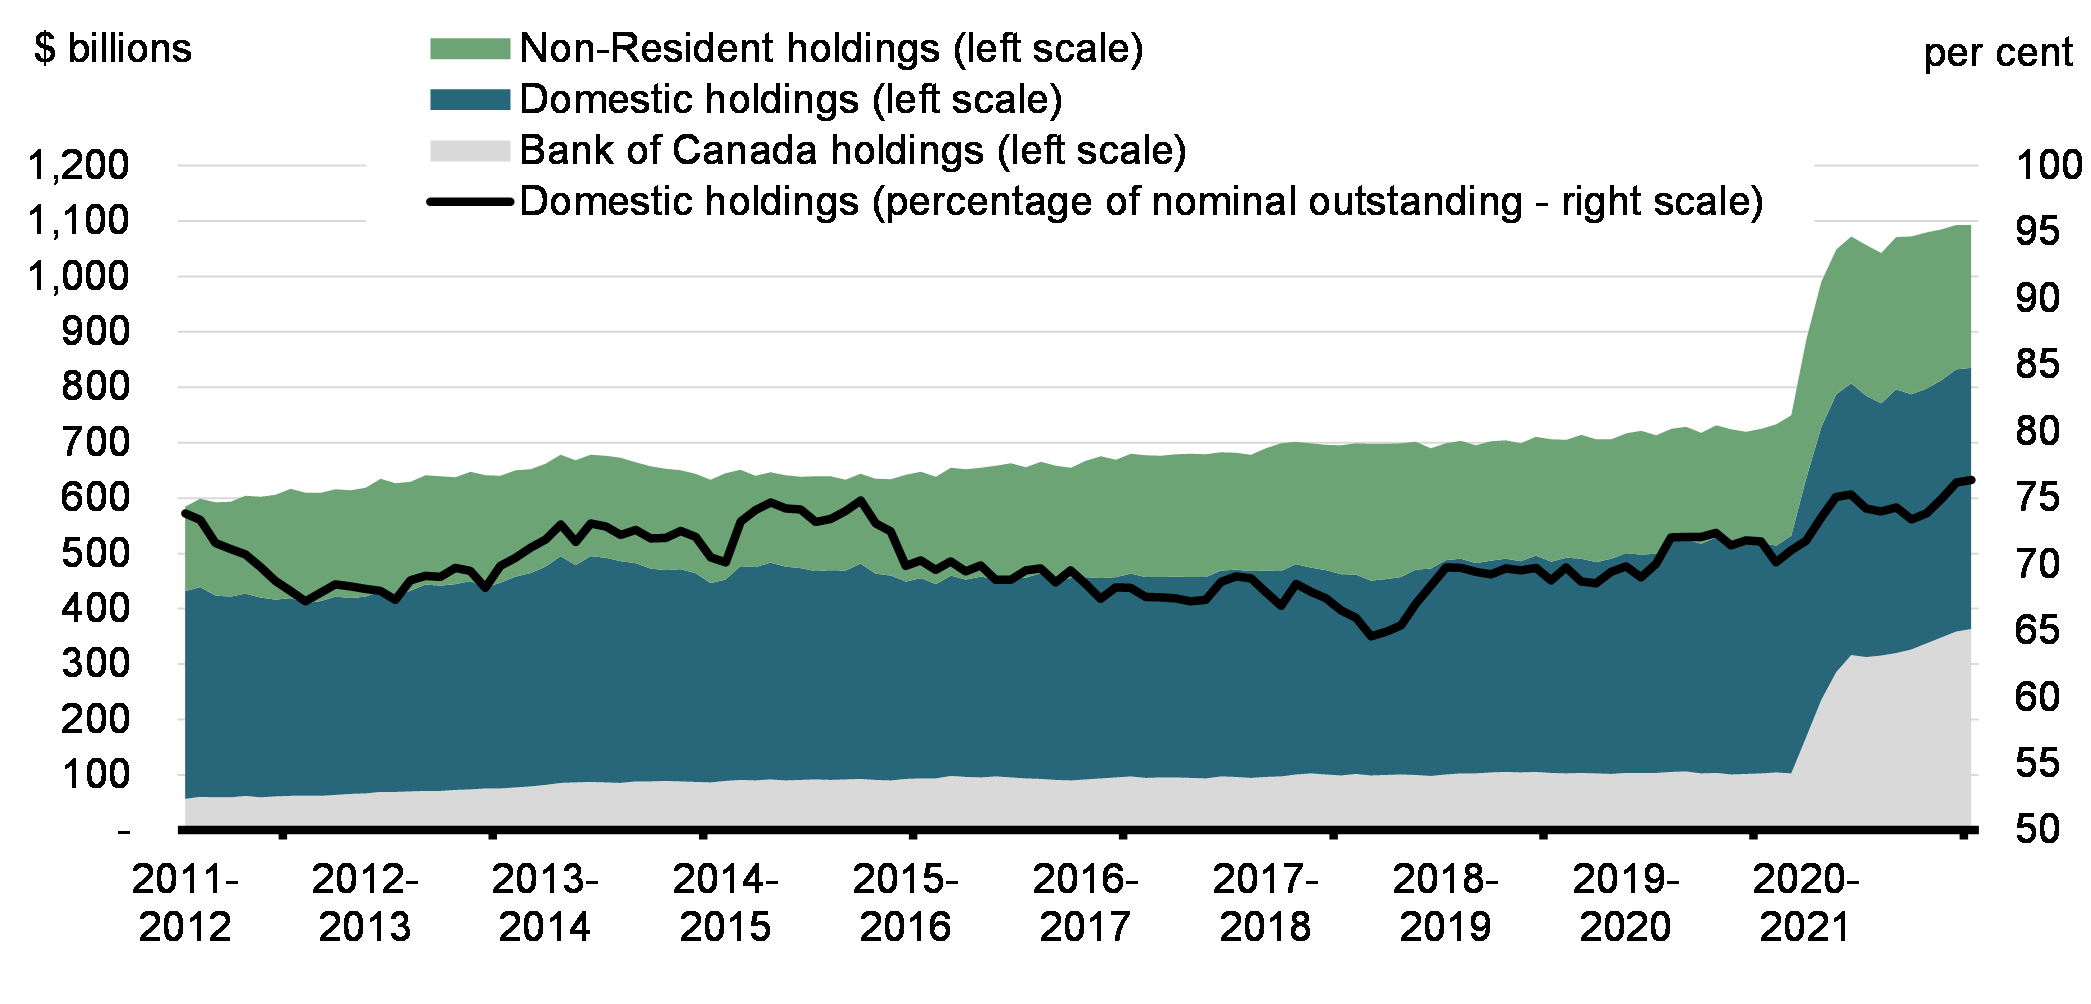
In 2020-21, following an unprecedented increase in market debt due to COVID-19, domestic investors (including the Bank of Canada) held about 76 per cent of Government of Canada securities (see Chart 7). Among domestic investors, the Bank of Canada held the largest share of Government of Canada securities (33 per cent), followed by insurance companies and pension funds (18 per cent) and financial institutions (17 per cent). Taken together, these top three categories accounted for more than two-thirds of outstanding Government of Canada securities.
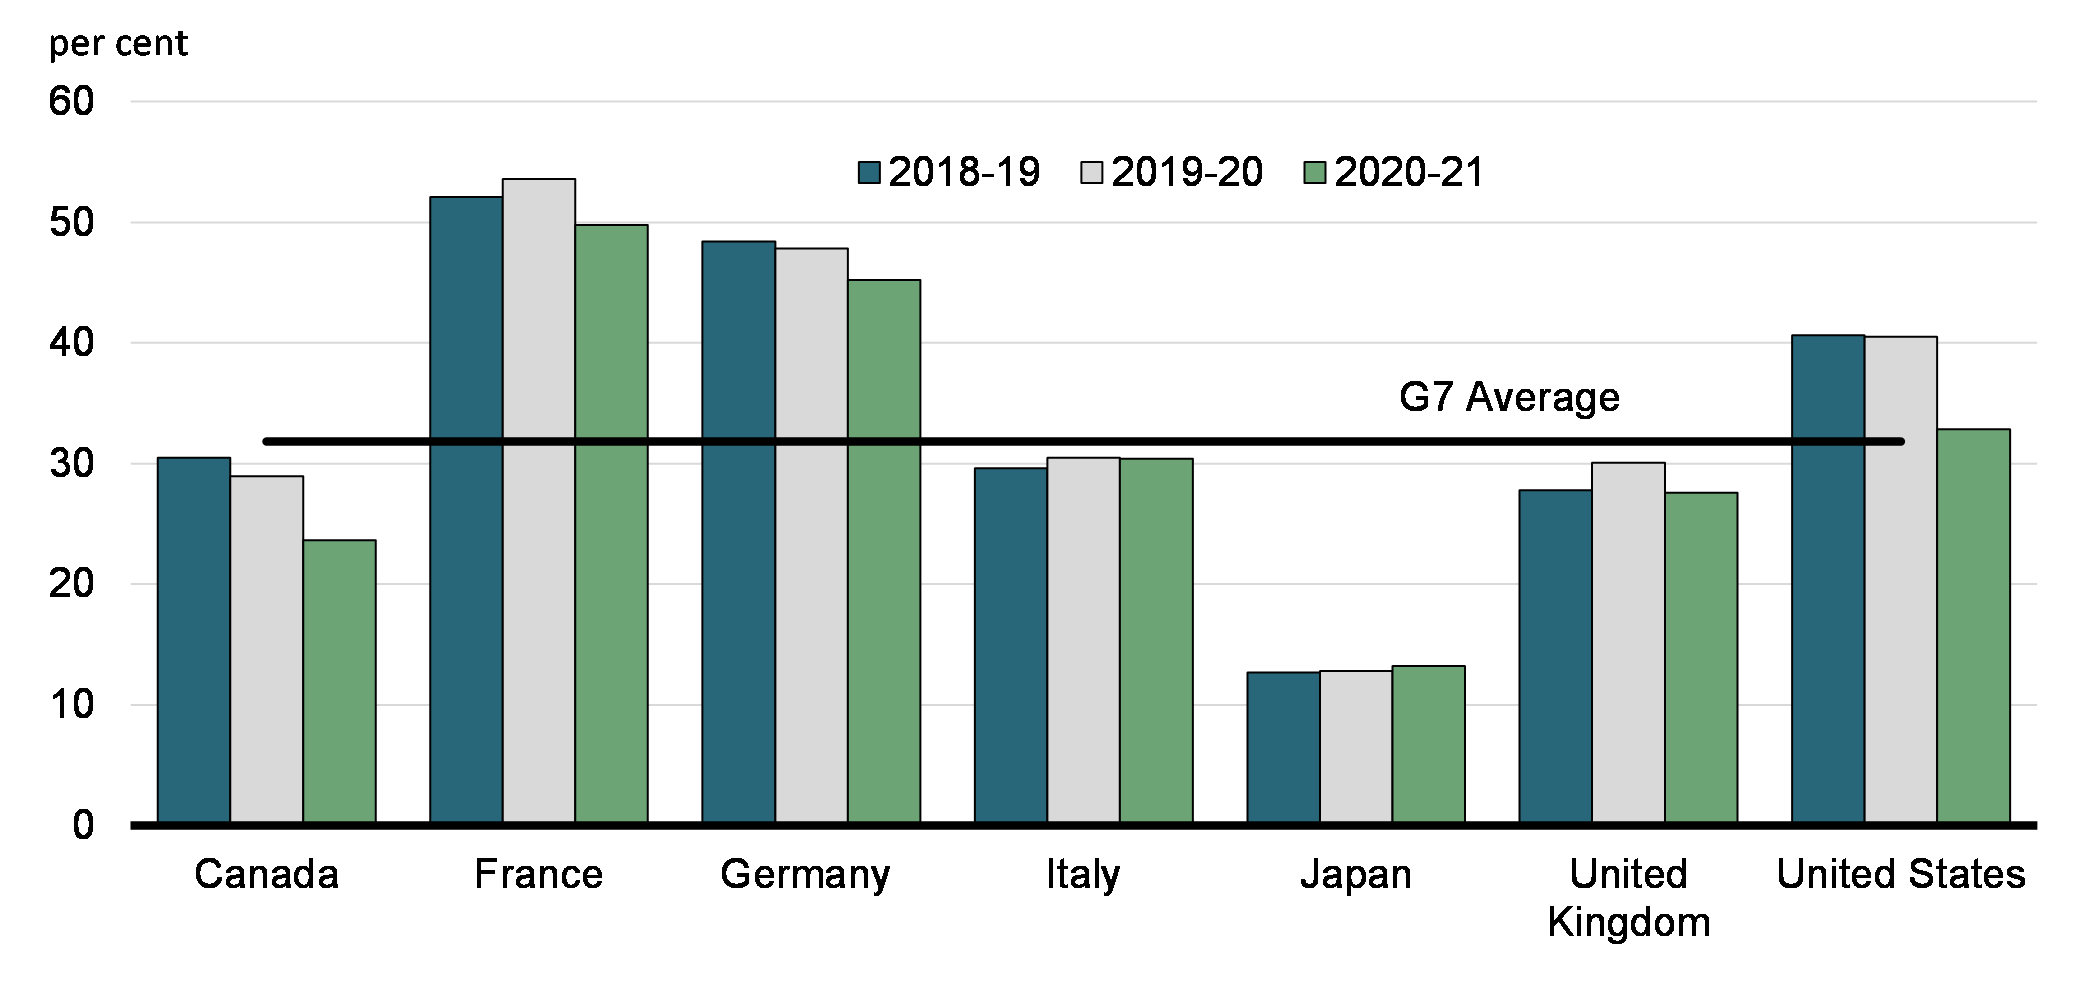
Despite this significant increase in market debt, non-resident investors held 24 per cent of Government of Canada securities,Footnote 6 down about five percentage points from 2019-20. This share of non-resident holdings of Government of Canada securities remains in the mid-range compared to other sovereigns in the G7 (see Chart 8).
Distribution of Government of Canada Securities
Percentage of Total Marketable Debt of G7 Countries Held by Non-Residents
Consulting with Market Participants
Formal consultations with market participants are held at least once a year, in order to obtain their views on the design of the borrowing program and on the liquidity and efficiency of the Government of Canada’s securities markets. The consultations conducted in fall 2019 aimed to inform the Debt Management Strategy for 2020-21. However, due to extraordinary circumstances, the fall 2020 consultations also focused on the Debt Management Strategy for 2020-21.
The Bank of Canada and the Department of Finance Canada conducted market consultations in fall 2019 and fall 2020, with organizations in Toronto, Montréal and New York, holding over 30 bilateral meetings during each consultation. These consultations sought the views of market participants on issues related to the design and operation of the Government of Canada’s domestic debt program for 2020-21 and beyond.
2020-21 Debt Management Strategy Consultations and Government of Canada Real Return Bond Consultations – Fall 2019 (i.e., Pre-COVID-19)
Given extraordinary circumstances leading to the postponement of Budget 2020, and in the interest of maintaining regularity and transparency with market participants, the 2020-21 Debt Management Strategy Consultations and Government of Canada Real Return Bond Consultations Summaries were published on March 27, 2020, as standalone documents on the Bank of Canada website.Footnote 7
Fall 2020 Debt Management Strategy Consultations
Given ongoing extraordinary circumstances and in the interest of maintaining regularity and transparency with market participants, the Fall 2020 Debt Management Strategy Consultations Summaries was published in conjunction with the Fall Economic Statement 2020 on November 30, 2020.Footnote 8
Securities Distribution System
As the government’s fiscal agent, the Bank of Canada distributes Government of Canada marketable bills and bonds by auction to government securities distributors (GSDs) and customers. GSDs that maintain a certain threshold of activity in the primary and secondary markets for Government of Canada securities may become primary dealers, which form a select core group of distributors for Government of Canada securities. To maintain a well-functioning securities distribution system, government securities auctions are monitored to ensure that GSDs abide by the terms and conditions.Footnote 9
Quick turnaround times enhance the efficiency of auctions, and reduce market risk for participants. In 2020-21, the turnaround time for treasury bill and bond auctions averaged 1 minutes 57 seconds, while there were no buyback operations conducted. This compares to an average turnaround time in 2019-20 of 2 minutes 6 seconds.Footnote 10
Monitoring Secondary Market Trading in Government of Canada Securities
Two measures of liquidity and efficiency in the secondary market for Government of Canada securities are trading volume and turnover ratio.
Trading volume represents the amount of securities traded during a specific period (e.g., daily). Large trading volumes typically indicate that participants can buy or sell in the marketplace without a substantial impact on the price of the securities and generally imply lower bid-offer spreads.
Turnover ratio, which is the ratio of securities traded relative to the amount of securities outstanding, measures market depth. High turnover implies that a large amount of securities change hands over a given period of time, which is an indication of a liquid market.
The average daily trading volume in the secondary market for Government of Canada’s bonds during 2020-21 was $42.1 billion, an increase of $2.6 billion from 2019-20 (see Chart 9).
Despite the unprecedented increase in issuance, the market continued to function/trade well, in large part due to the Bank of Canada’s various financial market support programs.
Government of Canada Bond Average Daily Trading Volumes
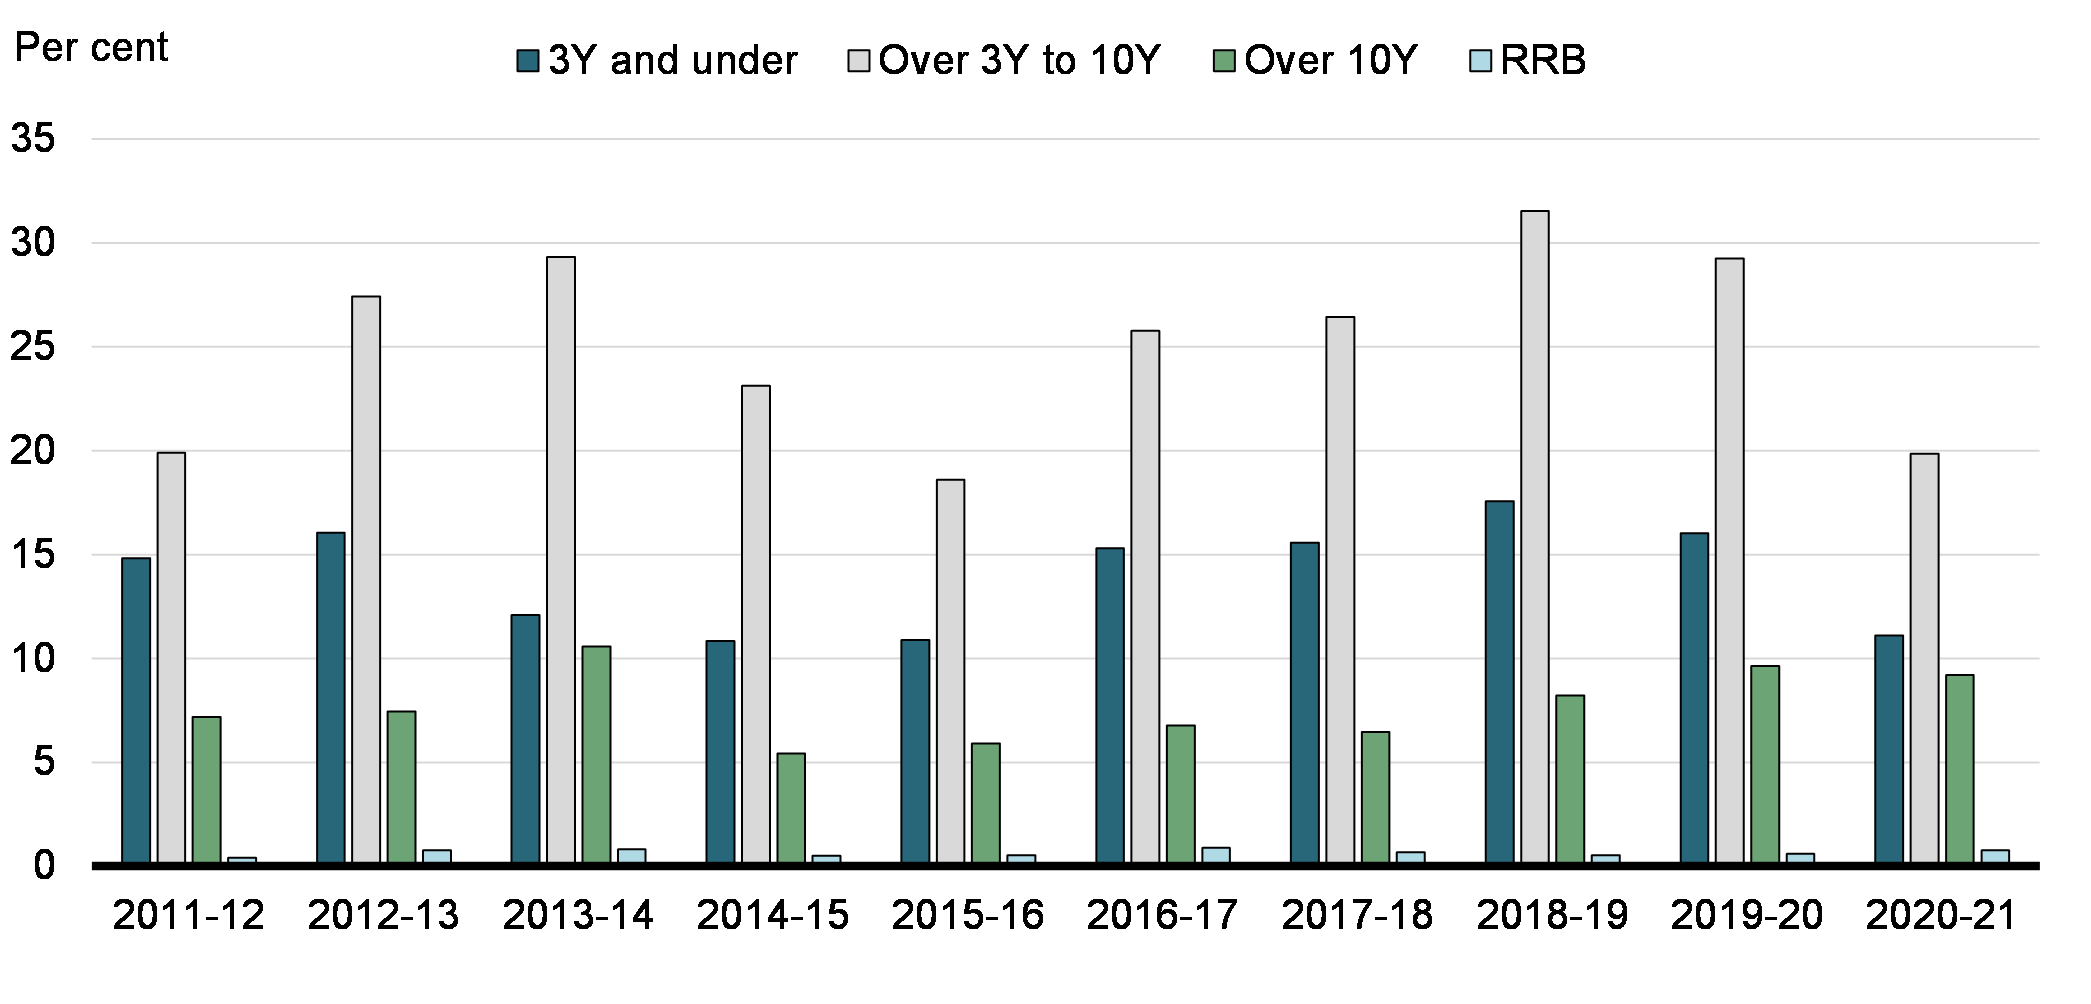
Given the unprecedented increase in issuance in 2020-21, the annual debt stock turnover ratio in the Government of Canada secondary bond market decreased to 14.0x in 2020-21 from 18.9x in 2019-20. The sectors with the highest turnover were medium-term bonds with maturities between 3 and 10 years at 19.9x, while Real Return Bonds had the lowest turnover at 0.7x (see Chart 10).
Government of Canada Bond Turnover Ratio by Term to Maturity
Annualized Monthly Trading Volume / Total Bond Stock
Supporting Secondary Market Liquidity
The Bank of Canada launched a number of measures and facilities to promote the efficient and continuous functioning of funding markets, including increasing the amount of Government of Canada securities it purchased at treasury bill auctions and introducing a secondary market bond purchase program.
As announced on March 27, 2020, the Bank of Canada launched the Government of Canada Bond Purchase Program (GBPP), a program to purchase Government of Canada securities in the secondary market – as part of the Bank of Canada quantitative easing program. The GBPP was established to address strains in the Government of Canada bond market and to enhance the effectiveness of all other actions taken to support core funding markets. The program began with purchases of a minimum of $5 billion per week across the yield curve with operations conducted daily.
On October 28, 2020, the GBPP program was recalibrated to shift purchases towards longer-term bonds, which has a more direct influence on the borrowing rates that are most important for households and businesses. At the same time, total purchases were gradually reduced to at least $4 billion a week and continued at this pace until the end of the fiscal year. The Bank of Canada’s purchases totaled $246 billion taking into account all operations conducted between April 1, 2020 and March 31, 2021.
Also, in July 2020, the Bank of Canada announced the introduction of securities repo operations (SROs) to replace the securities lending programFootnote 11. The SROs provided a temporary source of Government of Canada nominal bonds and treasury bills to primary dealers to support liquidity in the securities financing market. The Bank of Canada made a portion of its holdings of these securities available on an overnight basis through daily repurchase operations.
Regular Bond Buyback Program
Bond buyback operations on a cash basis and on a switch basis involve the purchase of bonds with a remaining term to maturity of 12 months to 25 years. Bond buyback operations on a cash basis involve the exchange of a bond for cash. Bond buyback operations on a switch basis, on the other hand, involve the exchange of one bond for another (e.g., an off-the-run bond for the building-to-benchmark bond), on a duration-neutral basis.Footnote 12
There were no government regular buyback operations in 2020-21.
Part III - Report on the 2020-21 Debt Program
Treasury bill and bond auctions performed well and demand for Government of Canada securities remained strong throughout the fiscal year, in part due to the Bank of Canada’s GBPP, the persistent demand for high-quality sovereign debt securities, and Canada’s strong fiscal and economic position.
Domestic Marketable Bonds
Bond Program
In 2020-21, gross bond issuance was $369.9 billion, $242.9 billion higher than the $127.0 billion issued in 2019-20. Gross issuance consisted of $368.5 billion in nominal bonds and $1.4 billion in Real Return Bonds (see Table 5).
| 2016-17 | 2017-18 | 2018-19 | 2019-20 | 2020-21 | |
|---|---|---|---|---|---|
| Nominal (auction) | 130.4 | 134.21 | 96.7 | 122.4 | 368.5 |
| Nominal (switch) | 0.8 | 0.8 | 0.8 | 2.8 | 0.0 |
| Real Return Bonds | 2.2 | 2.2 | 2.2 | 1.8 | 1.4 |
| Total gross issuance | 133.4 | 137.2 | 99.7 | 127.0 | 369.9 |
| Cash buyback | 0.0 | 0.0 | 0.0 | 0.0 | 0.0 |
| Switch buyback | -0.8 | -0.8 | -0.8 | -2.8 | 0.0 |
| Total buyback | -0.8 | -0.8 | -0.8 | -2.8 | 0.0 |
| Net issuance | 132.6 | 136.4 | 98.9 | 124.2 | 369.9 |
|
Note: Numbers may not add due to rounding. |
|||||
Auction Result Indicators for Domestic Bonds
Despite the unprecedented increase in bond issuance in 2020-21, bond auctions were well-covered, with ratios above the 5-year average in all sectors, except for the 30-year (see Table 6). Auction coverage is defined as the total amount of bids received, including bids from the Bank of Canada, divided by the amount auctioned. All else being equal, a higher auction coverage level typically reflects strong demand and therefore should result in a lower average auction yield.
Similarly, despite an unprecedented large increase in issuance, auction tails compared well to the 5-year average in 2020-21 for all sectors.Footnote 13 The auction tail represents the number of basis points between the highest yield accepted and the average yield of an auction. A small auction tail is preferable as it is generally indicative of better transparency in the pricing of securities. A total of 76 nominal bond auctions were conducted in 2020-21, 36 more than in 2019-20. This increase in nominal bond auctions was largely the result of a significant additional financial requirement as a result of government initiatives to respond to the COVID-19 pandemic.
| Nominal Bonds | Real Return Bonds |
||||||
|---|---|---|---|---|---|---|---|
| 2-year | 3-year | 5-year | 10-year | 30-year | 30-year | ||
| Tail (basis points) | 2020-21 | 0.14 | 0.25 | 0.28 | 0.45 | 0.46 | n/a |
| 5-year average | 0.15 | 0.23 | 0.28 | 0.43 | 0.42 | n/a | |
| Coverage | 2020-21 | 2.71 | 2.60 | 2.71 | 2.38 | 2.44 | 2.42 |
| 5-year average | 2.68 | 2.59 | 2.58 | 2.36 | 2.48 | 2.30 | |
|
Notes: Tail represents the number of basis points between the highest yield accepted and the average yield of an auction. Coverage is defined as the total amount of bids received, including bids from the Bank of Canada, divided by the amount auctioned. |
|||||||
Participation at Domestic Bond Auctions
In 2020-21, Primary Dealers (PDs) were allotted 64 per cent of auctioned nominal bonds, and customers were allotted 36 per cent (see Table 7), excluding the Bank of Canada’s allotment.Footnote 14 In aggregate, the 10 most active participants were in total allotted 80 per cent of these securities. Primary dealers’ share of the Real Return Bond allotments increased from 38 per cent in 2019-20 to 45 per cent in 2020-21, with customer allocations decreasing from 62 per cent to 55 per cent.
| Participant type | 2016-17 | 2017-18 | 2018-19 | 2019-20 | 2020-21 | |||||
|---|---|---|---|---|---|---|---|---|---|---|
| ($ billions) | (%) | ($ billions) | (%) | ($ billions) | (%) | ($ billions) | (%) | ($ billions) | (%) | |
| PDs | 96 | 74 | 94 | 70 | 61 | 63 | 75 | 61 | 237 | 64 |
| Customers | 34 | 26 | 40 | 30 | 36 | 37 | 47 | 39 | 135 | 36 |
| Top 5 participants | 72 | 55 | 75 | 56 | 46 | 48 | 68 | 55 | 207 | 56 |
| Top 10 participants | 111 | 85 | 114 | 85 | 74 | 77 | 98 | 80 | 299 | 80 |
| Total nominal bonds issued | 130 | 134 | 97 | 122 | 373 | |||||
| Participant type | 2016-17 | 2017-18 | 2018-19 | 2019-20 | 2020-21 | |||||
|---|---|---|---|---|---|---|---|---|---|---|
| ($ billions) | (%) | ($ billions) | (%) | ($ billions) | (%) | ($ billions) | (%) | ($ billions) | (%) | |
| PDs | 1 | 38 | 1 | 54 | 1 | 40 | 1 | 38 | 1 | 45 |
| Customers | 1 | 62 | 1 | 46 | 1 | 60 | 1 | 62 | 1 | 55 |
| Top 5 participants | 1 | 66 | 1 | 59 | 1 | 46 | 1 | 40 | 1 | 60 |
| Top 10 participants | 2 | 87 | 2 | 82 | 2 | 68 | 1 | 65 | 1 | 81 |
| Total Real Return Bonds issued | 2 | 2 | 2 | 2 | 1 | |||||
|
Note: Numbers may not add due to rounding. |
||||||||||
Treasury Bills and Cash Management Bills
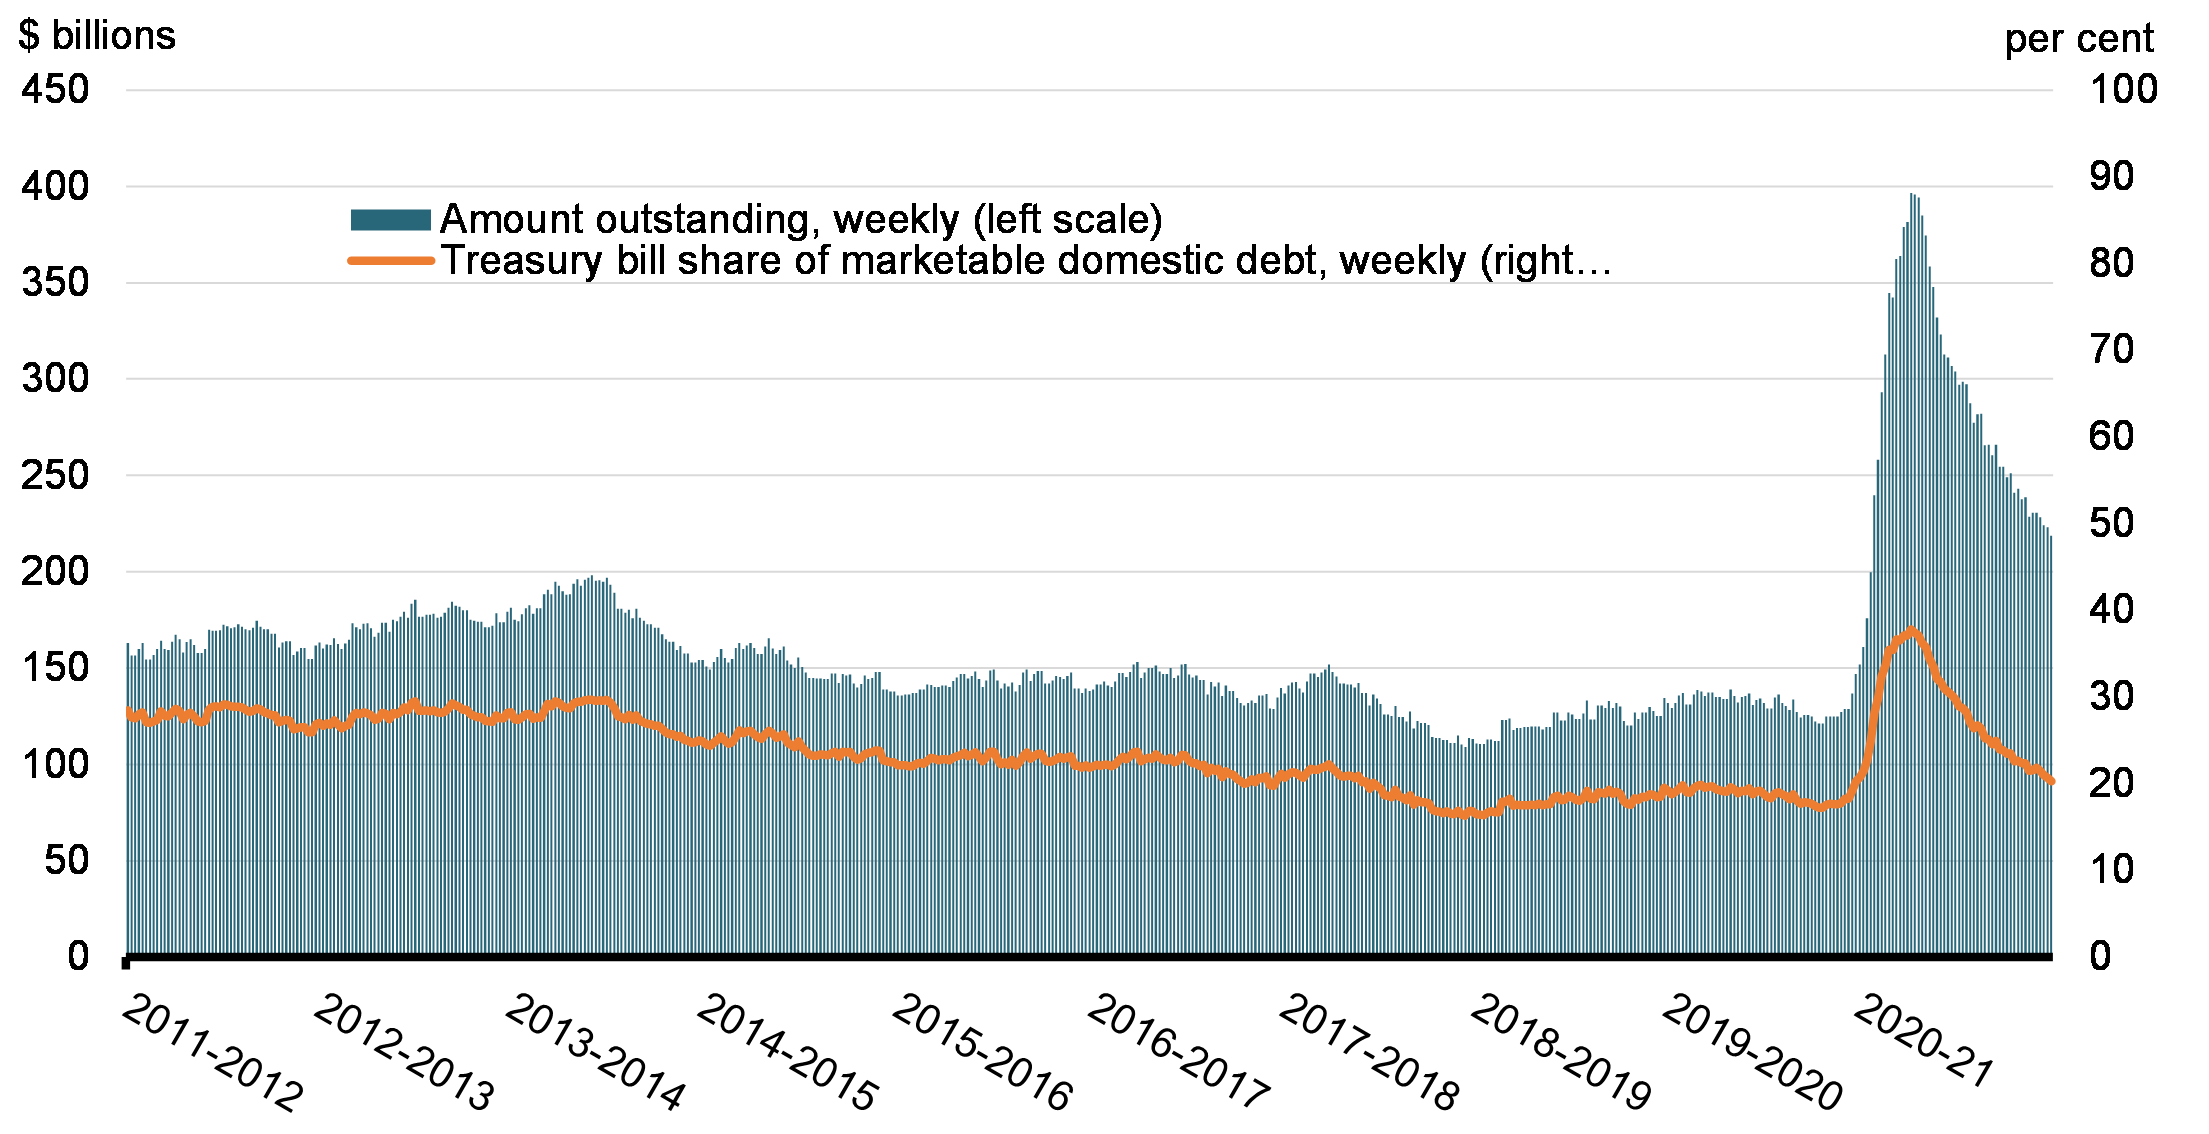
During 2020-21, $646.0 billion in 3-, 6- and 12-month treasury bills were issued, an increase of $370.0 billion from the previous year. There were also five cash management bill operations for a total of $25.5 billion in 2020-21, compared to 24 operations and a total of $67.6 billion in 2019-20. Together, treasury bill and cash management bill issuance totaled $671.5 billion. As at March 31, 2021, the combined treasury bill and cash management bill stock totaled $218.8 billion, an increase of $66.9 billion from the end of 2019-20 (see Chart 11).
At the onset of the pandemic, treasury bills auction sizes were augmented significantly and the frequency of auctions were changed from bi-weekly auctions to weekly auctions to absorb rapidly increasing COVID-19-related spending. Weekly auctions were reverted to bi-weekly auctions and auction sizes declined later in the fiscal year as short-term treasury bills (i.e., 3-month and 6-month terms) matured and were replaced by issuance across bond sectors.
Treasury Bills Outstanding and as a Share of Marketable Domestic Debt
In 2020-21, all treasury bill and cash management bill auctions were fully covered. Excluding 6-month treasury bills, auction tails were modestly higher than the 5-year average across treasury bill maturity sectors. Coverage ratios for treasury bill auctions in 2020-21 were higher than the 5-year average for all treasury bill maturity sectors (see Table 8).
| 3-month | 6-month | 12-month | Cash management bills |
||
|---|---|---|---|---|---|
| Tail | 2020-21 | 0.92 | 0.66 | 0.70 | 1.75 |
| 5-year average | 0.73 | 0.70 | 0.66 | 2.37 | |
| Coverage | 2020-21 | 2.29 | 2.68 | 2.74 | 2.78 |
| 5-year average | 2.18 | 2.41 | 2.46 | 2.63 | |
|
Notes: Tail represents the number of basis points between the highest yield accepted and the average yield of an auction. Coverage is defined as the total amount of bids received, including bids from the Bank of Canada, divided by the amount auctioned. Tail and coverage ratio were calculated as the weighted averages, where the weight assigned to each auction equals the percentage total allotment in the auction’s issuance sector. |
|||||
Participation at Treasury Bill Auctions
In 2020-21, the share of treasury bills allotted to primary dealers remained unchanged at 84 per cent compared to 2019-20, while the share allotted to customers also remained unchanged at 16 per cent (see Table 9). The 10 most active participants were in total allotted 89 per cent of these securities.
| Participant type | 2016-17 | 2017-18 | 2018-19 | 2019-20 | 2020-21 | |||||
|---|---|---|---|---|---|---|---|---|---|---|
| ($ billions) | (%) | ($ billions) | (%) | ($ billions) | (%) | ($ billions) | (%) | ($ billions) | (%) | |
| PDs | 253 | 87 | 230 | 91 | 239 | 88 | 246 | 84 | 543 | 84 |
| Customers | 38 | 13 | 23 | 9 | 33 | 12 | 45 | 16 | 103 | 16 |
| Top 5 participants | 198 | 68 | 174 | 69 | 190 | 70 | 190 | 65 | 431 | 67 |
| Top 10 participants | 262 | 90 | 235 | 93 | 242 | 89 | 246 | 85 | 577 | 89 |
| Total treasury bills issued | 291 | 253 | 272 | 291 | 646 | |||||
|
Note: Numbers may not add due to rounding. |
||||||||||
Foreign Currency Debt
Foreign currency debt is used to fund the Exchange Fund Account (EFA), which represents the largest component of the official international reserves. The primary objectives of the international reserves are to aid in the control and protection of the external value of the Canadian dollar and provide a source of liquidity to the Government of Canada.
The EFA is primarily made up of liquid foreign currency securities and special drawing rights (SDRs). Liquid foreign currency securities are composed primarily of debt securities of highly rated sovereigns, their agencies that borrow in public markets and are supported by a comprehensive government guarantee, and highly rated supranational organizations. SDRs are international reserve assets created by the IMF, the value of which is based on a basket of international currencies. The official international reserves also include Canada’s reserve position at the IMF. This position, which represents Canada’s investment in the activities of the IMF, fluctuates according to drawdowns and repayments from the IMF. The Report on the Management of Canada’s Official International Reserves provides information on the objectives, composition and performance of the reserves portfolio.
The market value of Canada’s official international reserves decreased to US$83.4 billion as at March 31, 2021 from US$86.1 billion as at March 31, 2020. EFA assets, which totaled $78.9 billion as at March 31, 2021, were held at a level that is consistent with the government’s commitment to maintain holdings of liquid foreign currency securities at or above 3 per cent of nominal GDP.
The EFA is funded by liabilities of the Government of Canada denominated in, or converted to, foreign currencies. Funding requirements are primarily met through an ongoing program of cross-currency swaps funded by domestic issuances. As at March 31, 2021, Government of Canada cross-currency swaps outstanding stood at US$55.2 billion (par value).
In addition to cross-currency swaps funded by domestic issuances, the EFA is funded through a short-term US-dollar paper program (Canada bills), a medium-term note (MTN) program (Canada notes and euro medium-term notes), and a global bond program. The funding method of choice depends on funding needs, costs, market conditions and funding diversification objectives (see Table 10).
| March 31, 2021 | March 31, 2020 | Change | |
|---|---|---|---|
| Swapped domestic issues | 55,175 | 62,806 | -7,631 |
| Global bonds | 9,000 | 9,000 | 0 |
| Canada bills | 3,226 | 1,534 | 1,692 |
| Medium-term notes | |||
Euro medium-term notes |
0 | 165 | -165 |
Canada notes |
50 | 625 | -575 |
| Total | 67,451 | 74,130 | -6,679 |
|
Note: Liabilities are stated at the exchange rates prevailing on March 31, 2021. |
|||
As at March 31, 2021, the Government of Canada had three global bonds outstanding (see Table 11).
| Year of issuance | Market | Amount in original currency | Yield (%) |
Term to maturity (years) |
Coupon (%) |
Benchmark interest rate—government bonds |
Spread from benchmark at issuance (basis points) |
Spread over swap curve in relevant currency on issuance date (basis points) |
|---|---|---|---|---|---|---|---|---|
| 2017 | Global | US$3 billion | 2.066 | 5 | 2.000 | US | 9.0 | LIBOR + 1.5 |
| 2019 | Global | US$3 billion | 2.633 | 3 | 2.625 | US | 10.0 | LIBOR - 4.7 |
| 2020 | Global | US$3 billion | 1.690 | 5 | 1.625 | US | 6.0 | LIBOR - 6.5 |
|
Note: LIBOR = London Interbank Offered Rate. |
||||||||
As at March 31, 2021, the Government of Canada had one medium-term note outstanding (see Table 12).
Date of issuance |
Date of maturity |
Market | Amount | Yield | Term to maturity (years) |
Fixed /floating |
Interest rate basis |
Index maturity | Spread over swap curve in relevant currency on issuance date (basis points) |
|---|---|---|---|---|---|---|---|---|---|
| 24-Aug-2015 | 24-Aug-2021 | Canada notes | US$50,000,000 | 6 | Floating | US$ LIBOR | 3 month | LIBOR + 0 | |
|
Note : LIBOR = London Interbank Offered Rate. |
|||||||||
Retail Debt
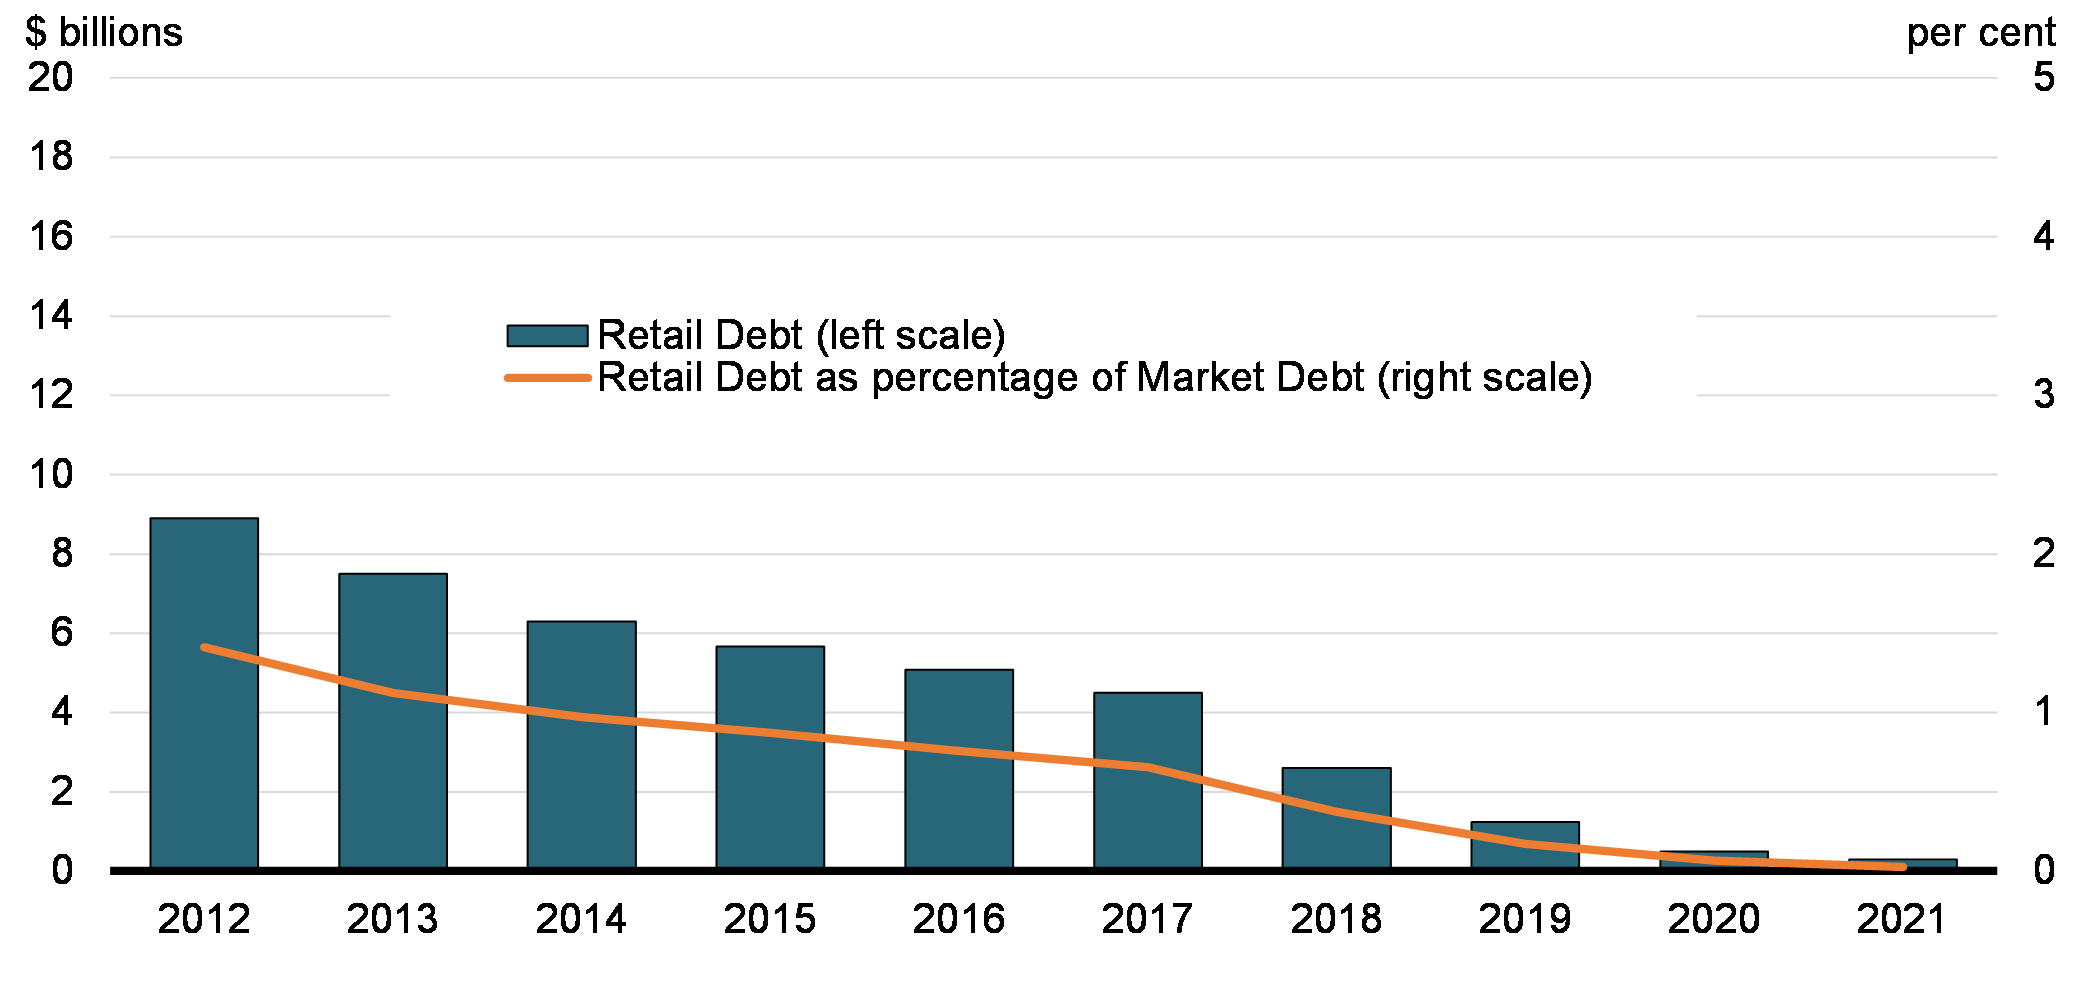
In 2020-21, the stock of Canada Savings Bonds and Canada Premium Bonds held by retail investors decreased from $0.5 billion to $0.3 billion. Retail debt represented a negligible percentage of total market debt as at March 31, 2021 (see Chart 12).
In Budget 2017, the Government of Canada announced the discontinuation of the Canada Savings Bonds and Canada Premium Bonds program, given that retail debt is no longer a cost-effective source of funds or a preferred investment by Canadians. Following the announcement, Canadians were reassured that all remaining funds in the Payroll Savings Program, the Canada Retirement Savings Plan and the Canada Retirement Income Fund, along with any unredeemed certificated bonds, remain safe and guaranteed by the Government of Canada. The last maturity date was December 1, 2021 and therefore all outstanding bonds have now matured.
Evolution of Retail Debt Stock, as at March 31
In 2020-21, the stock of retail debt declined by $0.2 billion (see Table 13).
| Gross sales | Redemptions | Net change | |
|---|---|---|---|
| Payroll | 0.0 | 0.1 | -0.1 |
| Cash | 0.0 | 0.1 | -0.1 |
| Total | 0.0 | 0.2 | -0.2 |
|
Note: Numbers may not add due to rounding. |
|||
Cash Management
The Bank of Canada, as the government’s fiscal agent, manages the Receiver General (RG) Consolidated Revenue Fund, from which the balances required for the government’s day-to-day operations are drawn. The core objective of cash management is to ensure that the government has sufficient cash available, at all times, to meet its operating requirements.
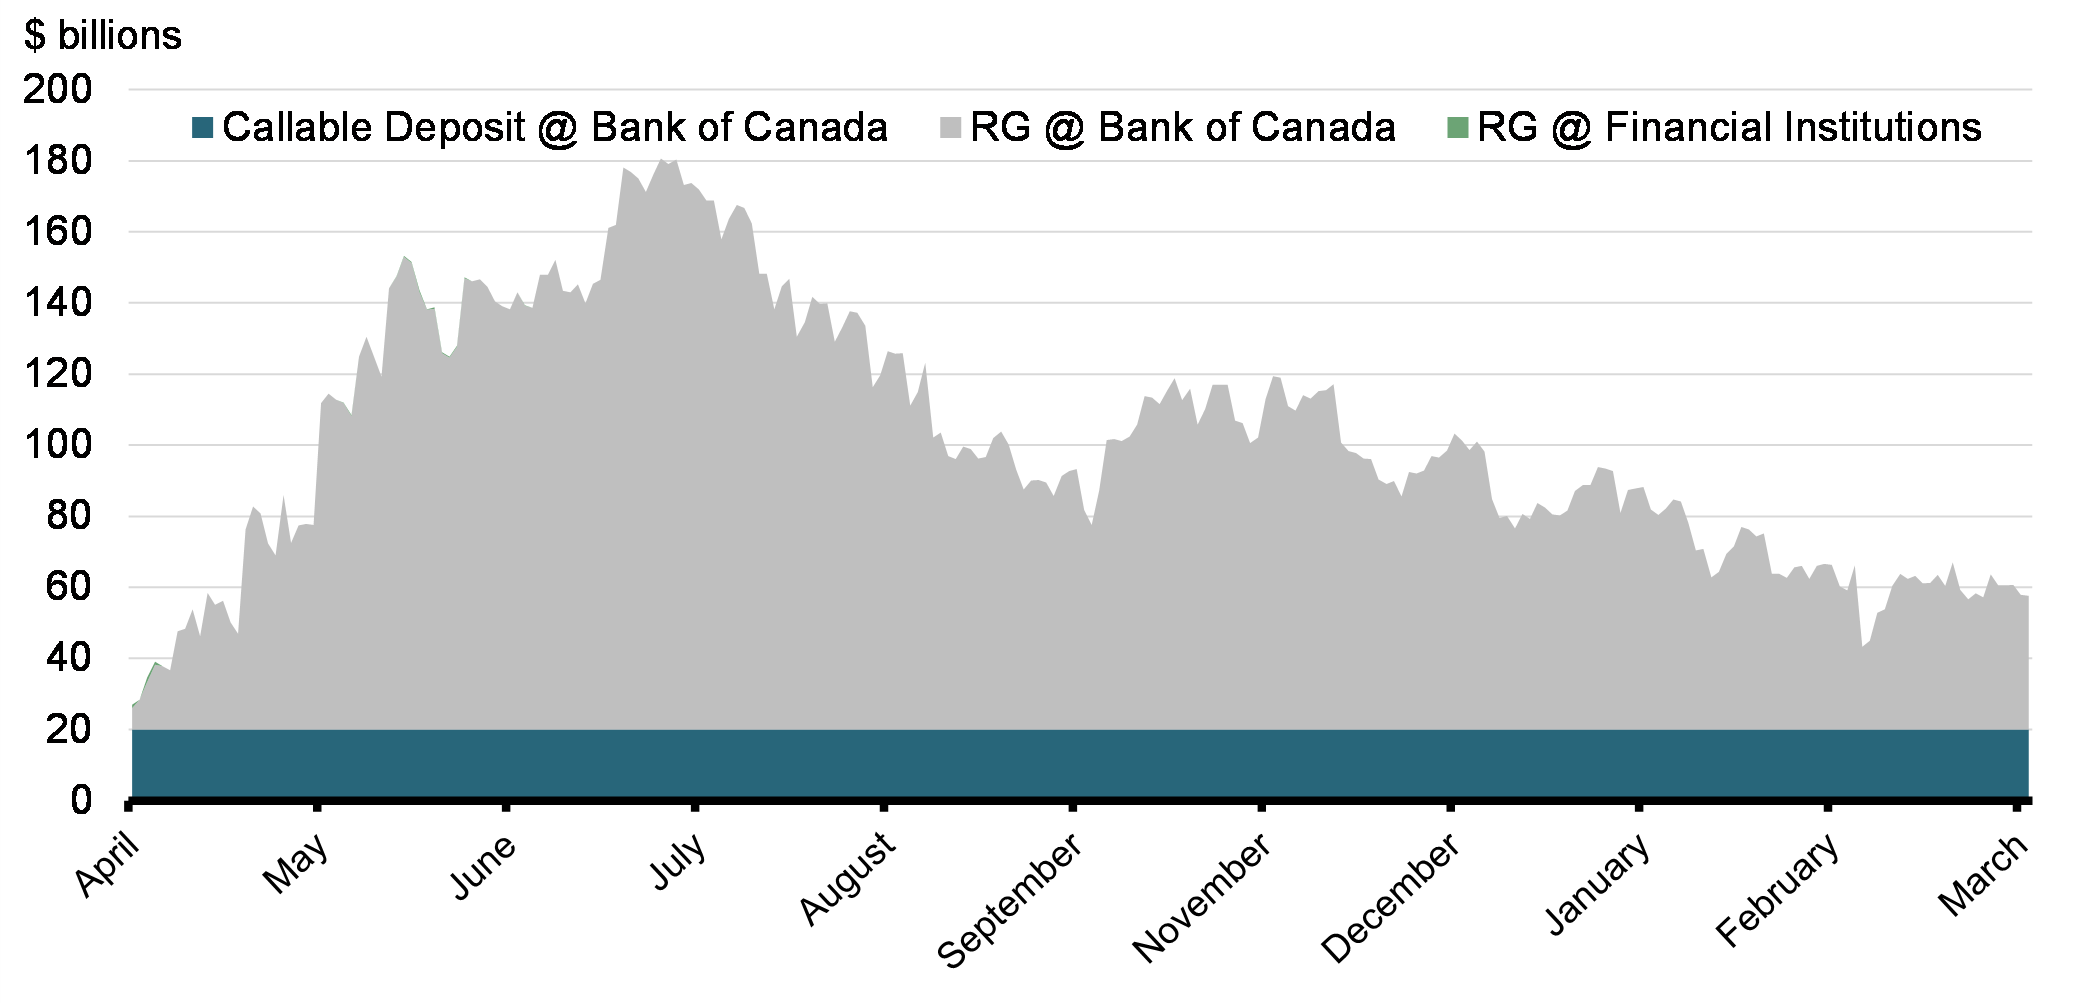
Cash consists of money on deposit to the credit of the RG for Canada with the Bank of Canada, chartered banks and other financial institutions. Cash with the Bank of Canada includes RG operating balances and a $20 billion callable demand deposit held for the prudential liquidity plan (PLP).
Since the beginning of the COVID-19 crisis, the government built a significantly larger cash position in advance of making the necessary investments to stabilize the Canadian economy amidst the COVID-19 pandemic, and for contingency purposes. As government initiatives responding to the COVID-19 pandemic started to materialize, cash balances were expended to make the necessary investments in stabilizing the Canadian economy. Cash balances started to decline in June, as expenditure requirements became more predictable.
The year-end daily liquidity position increased by $23.7 billion to $57. 5 billion by the end of 2020-21 (see Chart 13 and Table 14).
Daily Liquidity Position for 2020-21
| March 31, 2020 | March 31, 2021 | Annual average | Net change | |
|---|---|---|---|---|
| Callable deposits with the Bank of Canada | 20.0 | 20.0 | 20.0 | 0.0 |
| RG balances with the Bank of Canada | 10.4 | 37. 5 | 24.0 | 27.1 |
| RG balances with financial institutions | 3.4 | 0.0 | 1.7 | -3.4 |
| Total | 33.8 | 57. 5 | 45.7 | 23.7 |
|
Note: Numbers may not add due to rounding. |
||||
Prudential Liquidity Management
The government holds liquid financial assets in the form of domestic cash deposits and foreign exchange reservesFootnote 15 to promote investor confidence and safeguard its ability to meet payment obligations in situations where normal access to funding markets may be disrupted or delayed. The government’s overall liquidity levels are managed to normally cover at least one month (i.e., 23 business days) of net projected cash flows, including coupon payments and debt refinancing needs. The 23-day PLP requirement is a forward-looking measure that changes daily due to daily actual cash balances and new projected cash requirements.
Due to the COVID-19 pandemic and related Government of Canada support programs, there were significant increases to projected funding needs and to the debt program. As a result, early forecasts projected that certain days in February and March would not meet the 23-day PLP requirement. However, as borrowing operations ramped up quickly, cash balances throughout fiscal year 2020-21 were found to be at sufficient levels and the callable deposit or the EFA assets were never drawn on to meet payment obligations.
Investment of Receiver General Cash Balances
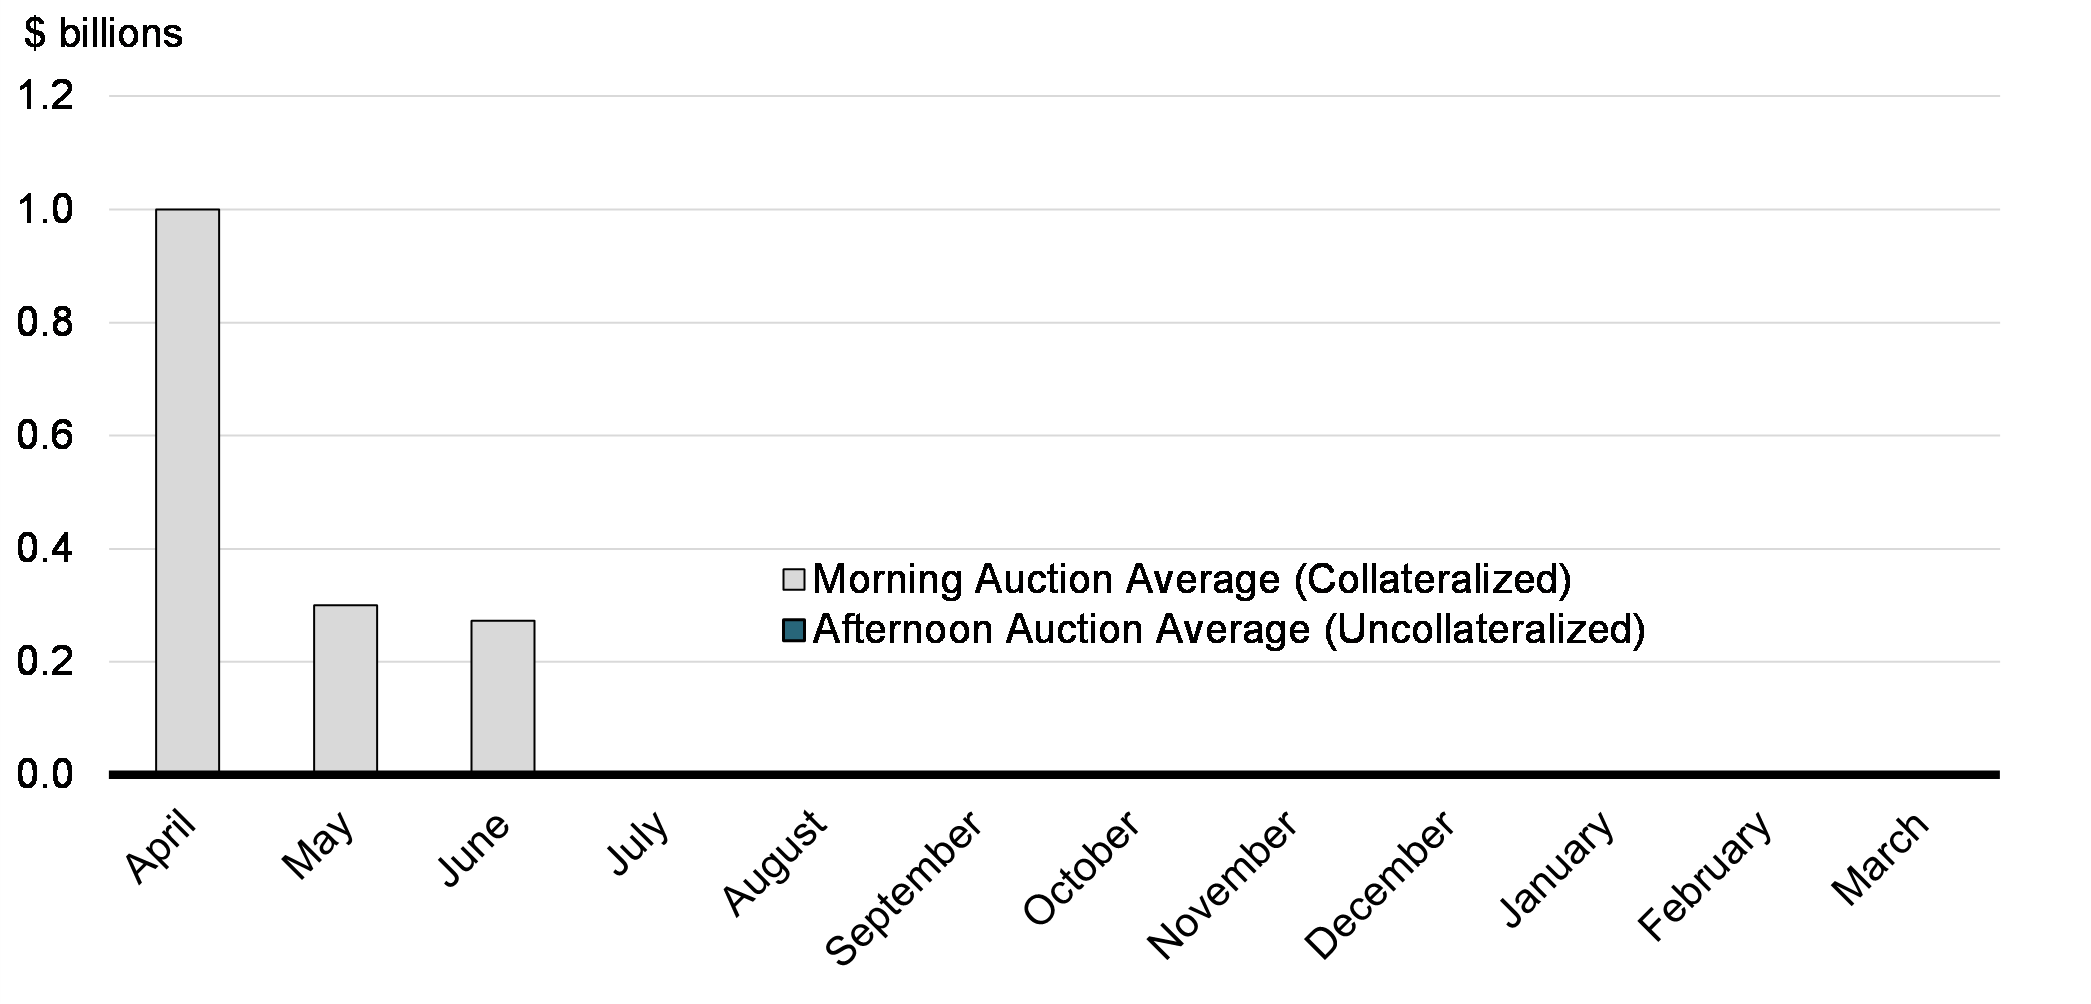
There were only a few RG auctions conducted early in 2020-21 (see Chart 14). RG morning AM and PM auctions ceased during the COVID-19 crisis since financial system liquidity was high and participants did not need additional funds. Cash balances were then held at the Bank of Canada and used to partially fund the Bank of Canada purchases under the GBPP.
Allocation of Cash Balances for Receiver General Auctions (Monthly Average During 2020-21 Fiscal Year)
Cash Management Bond Buyback Program
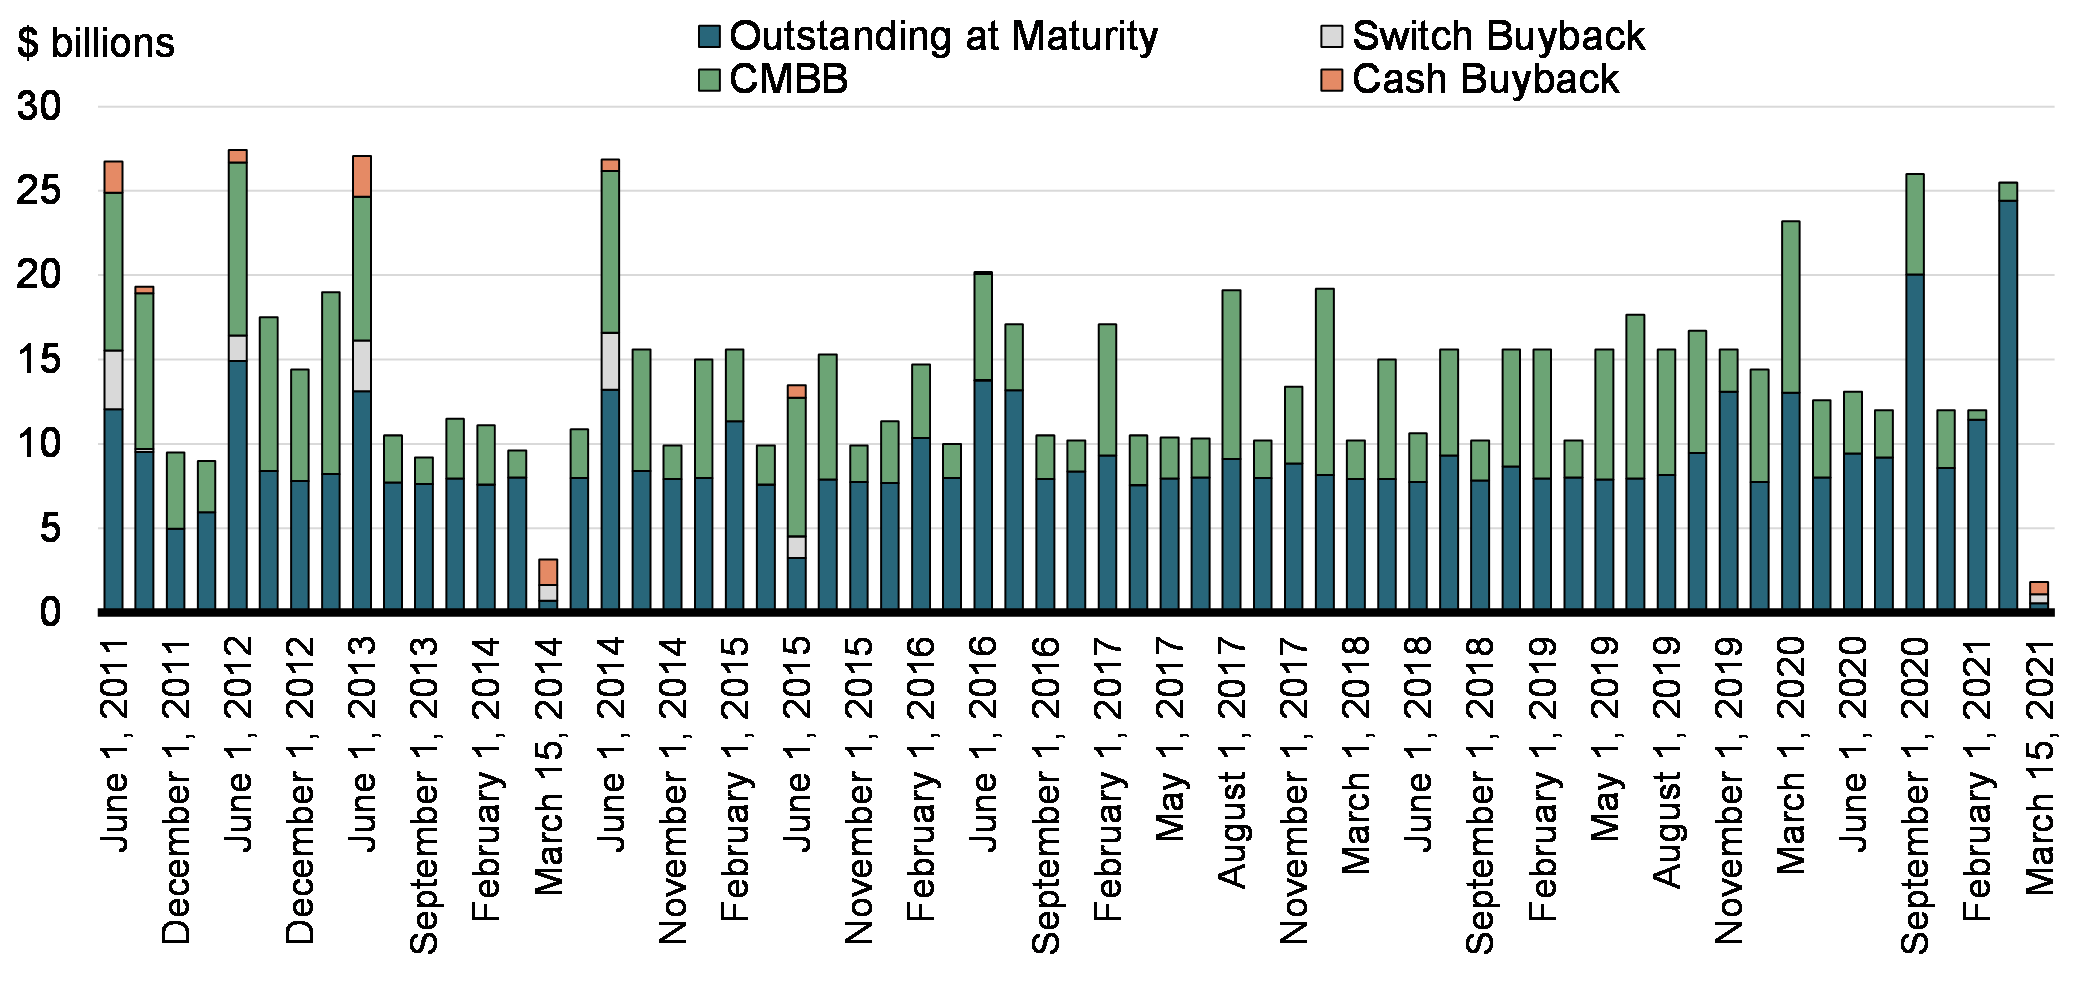
The cash management bond buyback (CMBB) program was designed to manage cash requirements by reducing the high levels of cash balances needed for key maturity and coupon payment dates. The program also aimed to smooth variations in treasury bill auction sizes over the year and reduce rollover risk. Securities targeted under this program are Government of Canada bonds with a term to maturity of up to 18 months where the total amount of maturing bonds is greater than $8 billion.
In 2020-21, there were no bonds repurchased through the CMBB program, compared to $31.1 billion in 2019-20. In 2020-21, the Bank of Canada launched a number of measures and facilities to support well-functioning markets, including increasing the amount of Government of Canada securities it purchases at treasury bill auctions and introducing the GBPP, which purchased Government of Canada bonds on the secondary market. Reflecting the Bank of Canada’s secondary market purchases, the CMBB program was temporarily ceased and the government did not conduct CMBB operations in 2020-21 (see Chart 15).
Impact of Repurchase Operations on Bond Maturities
Annex 1
Completed Treasury Evaluation Reports
In order to inform future decision making and to support transparency and accountability, different aspects of the Government of Canada’s treasury activities are reviewed periodically under the Treasury Evaluation Program. The program’s purpose is to obtain periodic external assessments of the frameworks and processes used in the management of wholesale and retail market debt, cash and reserves as well as the treasury activities of other entities under the authority of the Minister.
Reports on the findings of these evaluations and the government’s response to each evaluation are tabled with the House of Commons Standing Committee on Public Accounts by the Minister. Copies are also sent to the Auditor General of Canada. The reports are posted on the Department of Finance Canada website.
| Area | Year |
|---|---|
| Debt Management Objectives | 1992 |
| Debt Structure—Fixed/Floating Mix | 1992 |
| Internal Review Process | 1992 |
| External Review Process | 1992 |
| Benchmarks and Performance Measures | 1994 |
| Foreign Currency Borrowing—Canada Bills Program | 1994 |
| Developing Well-Functioning Bond and Bill Markets | 1994 |
| Liability Portfolio Performance Measurement | 1994 |
| Retail Debt Program | 1994 |
| Guidelines for Dealing With Auction Difficulties | 1995 |
| Foreign Currency Borrowing—Standby Line of Credit and FRN | 1995 |
| Treasury Bill Program Design | 1995 |
| Real Return Bond Program | 1998 |
| Foreign Currency Borrowing Programs | 1998 |
| Initiatives to Support a Well-Functioning Wholesale Market | 2001 |
| Debt Structure Target/Modelling | 2001 |
| Reserves Management Framework1 | 2002 |
| Bond Buybacks1 | 2003 |
| Funds Management Governance Framework1 | 2004 |
| Retail Debt Program1 | 2004 |
| Borrowing Framework of Major Federal Government-Backed Entities1 | 2005 |
| Receiver General Cash Management Program1 | 2006 |
| Exchange Fund Account Evaluation1 | 2006 |
| Risk Management Report1 | 2007 |
| Evaluation of the Debt Auction Process1 | 2010 |
| Evaluation of the Asset Allocation Framework of the Exchange Fund Account1 | 2012 |
| Report of the Auditor General of Canada on Interest-Bearing Debt2 | 2012 |
| Crown Borrowing Program Evaluation1 | 2013 |
| Retail Debt Evaluation1 | 2015 |
|
1 Available on the Department of Finance Canada website. |
|
Annex 2
Debt Management Policy Measures Taken Since 1997
The fundamental objectives of debt management are to raise stable and low-cost funding to meet the financial needs of the Government of Canada and to maintain a well-functioning market for Government of Canada securities. For the government as a debt issuer, a well-functioning market attracts investors and contributes to keeping funding costs low and stable over time. For market participants, a liquid and transparent secondary market in government debt provides risk-free assets for investment portfolios, a pricing benchmark for other debt issues and derivatives, and a primary tool for hedging interest rate risk. The following table lists significant policy measures that have been taken to achieve stable, low-cost funding and ensure a well-functioning Government of Canada securities market.
| Measure | Year |
|---|---|
| Discontinued the 3-year bond benchmark | 1997 |
| Moved from weekly to bi-weekly treasury bill auctions | 1998 |
| Introduced a cash-based bond buyback program | 1999 |
| Introduced standardized benchmarks (fixed maturities and increased size) | 1999 |
| Started regular cross-currency swap-based funding of foreign assets | 1999 |
| Introduced a switch-based bond buyback program | 2001 |
| Allowed the reconstitution of bonds beyond the size of the original amount issued | 2001 |
| Introduced the cash management bond buyback program | 2001 |
| Reduced targeted turnaround times for auctions and buyback operations | 2001 |
| Advanced the timing of treasury bill auctions from 12:30 p.m. to 10:30 a.m. | 2004 |
| Advanced the timing of bond auctions from 12:30 p.m. to 12:00 p.m. | 2005 |
| Reduced the timing between bond auctions and cash buybacks to 20 minutes | 2005 |
| Dropped one quarterly 2-year auction | 2006 |
| Announced the maintenance of benchmark targets through fungibility (common dates) | 2006 |
| Consolidated the borrowings of three Crown corporations | 2007 |
| Changed the maturity of the 5-year benchmark and dropped one quarterly 5-year auction | 2007 |
| Reintroduced the 3-year bond benchmark | 2009 |
| Increased the frequency of cash management bond buyback operations from bi-weekly to weekly | 2010 |
| Announced a new framework for the medium-term debt management strategy | 2011 |
| Announced plans to increase the level of prudential liquidity by $35 billion over 3 years | 2011 |
| Added four new maturity dates—February 1, May 1, August 1 and November 1 | 2011 |
| Increased benchmark target range sizes in the 2-, 3- and 5-year sectors | 2011 |
| Announced a temporary increase in longer-term debt issuance | 2012 |
| Announced changes to the Terms and Conditions Governing the Morning Auction of Receiver General Cash Balances | 2013 |
| Introduced ultra-long bond issuance | 2014 |
| Discontinued 3-year issuance | 2015 |
| Increased benchmark target range sizes in the 2- and 5-year sectors | 2015 |
| Increased benchmark target range sizes in the 2-, 5- and 10-year sectors | 2016 |
| Reintroduced the 3-year bond benchmark | 2016 |
| Introduced a pilot program to increase flexibility in the maximum repurchase amount at CMBB operations | 2017 |
| Discountinued the sales of new Canada Savings Bonds | 2017 |
| Pilot program to increase flexibility of CMBB operations made permanent | 2018 |
| Ceased all buyback operations and RG auctions | 2020 |
| Moved the 3-year sector to new maturity dates—April 1 and October 1 | 2020 |
| Added a second 10-year benchmark bond per year—December 1 | 2020 |
| Increased the frequency of treasury bills auctions from bi-weekly to weekly (i.e., first half of the fiscal year) | 2020 |
| Reduced the frequency of treasury bills auctions from weekly to bi-weekly (i.e., second half of the fiscal year) | 2020 |
Annex 3
Glossary
asset-liability management: An investment decision-making framework that is used to concurrently manage a portfolio of assets and liabilities.
average term to maturity: The weighted average amount of time until the securities in the debt portfolio mature.
benchmark bond: A bond that is considered by the market to be the standard against which all other bonds in that term area are evaluated against. It is typically a bond issued by a sovereign, since sovereign debt is usually the most creditworthy within a domestic market. Usually it is the most liquid bond within each range of maturities and is therefore priced accurately.
budgetary deficit: The shortfall between government annual revenues and annual budgetary expenses.
buyback on a cash basis: The repurchase of bonds for cash. Buybacks on a cash basis are used to maintain the size of bond auctions and new issuances.
buyback on a switch basis: The exchange of outstanding bonds for new bonds in the current building benchmark bond.
Canada bill: A promissory note denominated in US dollars, issued for terms of up to 270 days. Canada bills are issued for foreign exchange reserves funding purposes only.
Canada Investment Bond: A non-marketable fixed-term security instrument issued by the Government of Canada.
Canada note: A promissory note usually denominated in US dollars, and available in book-entry form. Canada notes can be issued for terms of nine months or longer, and can be issued at a fixed or a floating rate. Canada notes are issued for foreign exchange reserves funding purposes only.
Canada Premium Bond: A non-marketable security instrument issued by the Government of Canada, which is redeemable once a year on the anniversary date or during the 30 days thereafter without penalty.
Canada Savings Bond: A non-marketable security instrument issued by the Government of Canada, which is redeemable on demand by the registered owner(s), and which, after the first three months, pays interest up to the end of the month prior to cashing.
cross-currency swap: An agreement that exchanges one type of debt obligation for another involving different currencies and the exchange of the principal amounts and interest payments.
duration: Measures the sensitivity of the price of a bond or portfolio to fluctuations in interest rates. It is a measure of volatility and is expressed in years. The higher the duration number, the greater the interest rate risk for bond or portfolio prices.
electronic trading system: An electronic system that provides real-time information about securities and enables the user to execute financial trades.
Exchange Fund Account (EFA): An account that aids in the control and protection of the external value of the Canadian dollar and which provides a source of liquidity for the Government of Canada. Assets held in the EFA are managed to provide liquidity to the government and to promote orderly conditions for the Canadian dollar in the foreign exchange markets, if required.
financial source/requirement: The difference between the cash inflows and outflows of the government’s Receiver General account. In the case of a financial requirement, it is the amount of new borrowing required from outside lenders to meet financing needs in any given year.
fixed-rate share of market debt: The proportion of market debt that does not mature or need to be repriced within one year (i.e. the inverse of the refixing share of market debt).
foreign exchange reserves: The foreign currency assets (e.g. interest-earning bonds) held to support the value of the domestic currency. Canada’s foreign exchange reserves are held in the Exchange Fund Account.
Government of Canada securities auction: A process used for selling Government of Canada debt securities (mostly marketable bonds and treasury bills) in which issues are sold by public tender to government securities distributors and approved clients.
government securities distributor: An investment dealer or bank that is authorized to bid at Government of Canada auctions and through which the government distributes Government of Canada treasury bills and marketable bonds.
interest-bearing debt: Debt consisting of unmatured debt, or debt issued on the credit markets, liabilities for pensions and other future benefits, and other liabilities.
Large Value Transfer System: An electronic funds transfer system introduced in February 1999 and operated by the Canadian Payments Association. It facilitates the electronic transfer of Canadian-dollar payments across the country virtually instantaneously.
marketable bond: An interest-bearing certificate of indebtedness issued by the Government of Canada, having the following characteristics: bought and sold on the open market; payable in Canadian or foreign currency; having a fixed date of maturity; interest payable either in coupon or registered form; face value guaranteed at maturity.
marketable debt: Market debt that is issued by the Government of Canada and sold via public tender or syndication. These issues can be traded between investors while outstanding.
money market: The market in which short-term capital is raised, invested and traded using financial instruments such as treasury bills, bankers’ acceptances, commercial paper, and bonds maturing in one year or less.
non-market debt: The government’s internal debt, which is, for the most part, federal public sector pension liabilities and the government’s current liabilities (such as accounts payable, accrued liabilities, interest payments and payments of matured debt).
overnight rate; overnight financing rate; overnight money market rate; overnight lending rate: An interest rate at which participants with a temporary surplus or shortage of funds are able to lend or borrow until the next business day. It is the shortest term to maturity in the money market.
primary dealer: A member of the core group of government securities distributors that maintain a certain threshold of activity in the market for Government of Canada securities. The primary dealer classification can be attained in either treasury bills or marketable bonds, or both.
primary market: The market in which issues of securities are first offered to the public.
Real Return Bond: A bond whose interest payments are based on real interest rates. Unlike standard fixed-coupon marketable bonds, the semi-annual interest payments on Government of Canada Real Return Bonds are determined by adjusting the principal by the change in the Consumer Price Index.
refixing share of market debt: The proportion of market debt that matures or needs to be repriced within one year (i.e. the inverse of the fixed-rate share of market debt).
refixing share of market debt to gross domestic product (GDP): The amount of market debt that matures or needs to be repriced within one year relative to nominal GDP for that year.
secondary market: The market where existing securities trade after they have been sold to the public in the primary market.
sovereign market: The market for debt issued by a government.
treasury bill: A short-term obligation sold by public tender. Treasury bills, with terms to maturity of 3, 6 or 12 months, are currently auctioned on a bi-weekly basis.
ultra-long bond: A bond with a maturity of 40 years or longer.
yield curve: The conceptual or graphic representation of the term structure of interest rates. A “normal” yield curve is upward sloping, with short-term rates lower than long-term rates. An “inverted” yield curve is downward sloping, with short-term rates higher than long-term rates. A “flat” yield curve occurs when short-term rates are the same as long-term rates.
Annex 4
Contact Information
Consultations and Communications Branch
Department of Finance Canada
14th floor
90 Elgin Street
Ottawa, Ontario K1A 0G5
Phone: 613-369-3710
Facsimile: 613-369-4065
TTY: 613-369-3230
E-mail: financepublic-financepublique@fin.gc.ca
Media Enquiries:
613-369-4000
Reference Tables
I - Total Liabilities, Outstanding Market Debt and Debt Charges, as at March 31
II - Government of Canada Outstanding Market Debt, as at March 31
III - Issuance of Government of Canada Domestic Bonds
IV - Outstanding Government of Canada Domestic Bonds, as at March 31, 2021
V - Government of Canada Cross-Currency Swaps Outstanding, as at March 31, 2021
VI - Crown Corporation Borrowings, as at March 31
| Liabilities | |||||
|---|---|---|---|---|---|
| Year | Market debt | Market debt value adjustments | Accounts payable and accrued liabilities | Pension and other liabilities | Total liabilities |
| 1986 | 201.2 | -0.4 | 39.4 | 79.1 | 319.4 |
| 1987 | 228.6 | -0.4 | 42.1 | 84.7 | 355.0 |
| 1988 | 250.8 | -0.9 | 47.2 | 90.9 | 388.0 |
| 1989 | 276.3 | -2.2 | 50.2 | 97.1 | 421.4 |
| 1990 | 294.6 | -2.9 | 53.2 | 104.5 | 449.3 |
| 1991 | 323.9 | -3.2 | 54.9 | 112.1 | 487.7 |
| 1992 | 351.9 | -2.2 | 56.1 | 118.5 | 524.2 |
| 1993 | 382.7 | -3.0 | 58.4 | 125.1 | 563.2 |
| 1994 | 414.0 | -1.8 | 63.7 | 131.4 | 607.3 |
| 1995 | 441.0 | -3.4 | 71.3 | 139.8 | 648.7 |
| 1996 | 469.5 | -1.7 | 74.9 | 148.5 | 691.3 |
| 1997 | 476.9 | 0.3 | 75.9 | 156.3 | 709.4 |
| 1998 | 466.8 | 1.4 | 81.7 | 160.9 | 710.8 |
| 1999 | 457.7 | 2.6 | 83.7 | 168.2 | 712.2 |
| 2000 | 454.2 | -0.2 | 83.9 | 175.8 | 713.6 |
| 2001 | 444.9 | 1.3 | 88.5 | 179.0 | 713.6 |
| 2002 | 440.9 | 0.9 | 83.2 | 177.9 | 703.0 |
| 2003 | 438.6 | -1.1 | 83.2 | 178.3 | 699.0 |
| 2004 | 436.5 | -2.5 | 85.2 | 180.9 | 700.1 |
| 2005 | 431.8 | -4.3 | 97.7 | 179.8 | 705.0 |
| 2006 | 427.3 | -6.1 | 101.4 | 179.9 | 702.5 |
| 2007 | 418.8 | -4.7 | 106.5 | 185.1 | 705.8 |
| 2008 | 394.1 | -3.4 | 110.5 | 191.2 | 692.3 |
| 2009 | 510.9 | 3.1 | 114.0 | 200.4 | 828.4 |
| 2010 | 564.4 | -5.3 | 120.5 | 208.7 | 888.3 |
| 2011 | 596.8 | -5.7 | 119.1 | 217.2 | 927.5 |
| 2012 | 631.0 | -4.7 | 125.0 | 226.1 | 977.5 |
| 2013 | 668.0 | 4.4 | 118.7 | 236.2 | 1,027.4 |
| 2014 | 648.7 | 10.3 | 111.4 | 245.2 | 1,015.8 |
| 2015 | 649.5 | 15.7 | 123.6 | 251.4 | 1,040.2 |
| 2016 | 669.7 | 18.5 | 127.9 | 262.0 | 1,078.0 |
| 2017 | 695.1 | 18.5 | 132.5 | 270.7 | 1,116.9 |
| 2018 | 704.3 | 16.9 | 154.8 | 281.4 | 1,157.4 |
| 2019 | 721.1 | 15.8 | 159.7 | 282.6 | 1,185.2 |
| 2020 | 765.2 | 18.6 | 163.8 | 301.0 | 1,248.6 |
| 2021 | 1,109.8 | 15.4 | 207.4 | 319.7 | 1,652.2 |
| Accumulated deficit and debt charges | ||||||
|---|---|---|---|---|---|---|
| Year | Total liabilities | Financial assets | Net debt | Non-financial assets | Accumulated deficit | Gross public debt charges |
| 1986 | 319.4 | 70.1 | 249.2 | 21.4 | 227.8 | 27.7 |
| 1987 | 355.0 | 73.2 | 281.8 | 24.2 | 257.7 | 28.7 |
| 1988 | 388.0 | 75.0 | 313.0 | 26.3 | 286.7 | 31.2 |
| 1989 | 421.4 | 77.9 | 343.6 | 29.0 | 314.6 | 35.5 |
| 1990 | 449.3 | 74.5 | 374.8 | 31.0 | 343.8 | 41.2 |
| 1991 | 487.7 | 76.6 | 411.1 | 33.4 | 377.7 | 45.0 |
| 1992 | 524.2 | 78.5 | 445.7 | 35.8 | 410.0 | 43.9 |
| 1993 | 563.2 | 76.0 | 487.2 | 38.2 | 449.0 | 41.3 |
| 1994 | 607.3 | 79.3 | 527.9 | 40.4 | 487.5 | 40.1 |
| 1995 | 648.7 | 81.2 | 567.5 | 43.3 | 524.2 | 44.2 |
| 1996 | 691.3 | 92.7 | 598.6 | 44.4 | 554.2 | 49.4 |
| 1997 | 709.4 | 100.4 | 609.0 | 46.1 | 562.9 | 47.3 |
| 1998 | 710.8 | 103.6 | 607.2 | 47.2 | 559.9 | 43.1 |
| 1999 | 712.2 | 109.3 | 602.9 | 48.7 | 554.1 | 43.3 |
| 2000 | 713.6 | 123.5 | 590.1 | 50.2 | 539.9 | 43.4 |
| 2001 | 713.6 | 141.9 | 571.7 | 51.7 | 520.0 | 43.9 |
| 2002 | 703.0 | 137.7 | 565.3 | 53.4 | 511.9 | 39.7 |
| 2003 | 699.0 | 139.5 | 559.6 | 54.2 | 505.3 | 37.3 |
| 2004 | 700.1 | 149.1 | 551.0 | 54.8 | 496.2 | 35.8 |
| 2005 | 705.0 | 155.4 | 549.6 | 54.9 | 494.7 | 34.1 |
| 2006 | 702.5 | 165.6 | 536.9 | 55.4 | 481.5 | 33.8 |
| 2007 | 705.8 | 181.9 | 523.9 | 56.6 | 467.3 | 33.9 |
| 2008 | 692.3 | 176.0 | 516.3 | 58.6 | 457.6 | 33.3 |
| 2009 | 828.4 | 298.9 | 529.4 | 61.5 | 467.9 | 28.3 |
| 2010 | 888.3 | 300.8 | 587.5 | 63.4 | 524.1 | 26.6 |
| 2011 | 927.5 | 304.0 | 623.5 | 66.6 | 556.9 | 28.6 |
| 2012 | 977.5 | 317.6 | 659.9 | 68.0 | 591.9 | 29.0 |
| 2013 | 1,027.4 | 337.8 | 689.5 | 68.9 | 620.6 | 25.5 |
| 2014 | 1,015.8 | 318.5 | 696.4 | 70.4 | 626.0 | 24.7 |
| 2015 | 1,040.2 | 336.7 | 703.5 | 74.6 | 628.9 | 24.2 |
| 2016 | 1,078.0 | 365.8 | 712.2 | 77.8 | 634.4 | 21.8 |
| 2017 | 1,116.9 | 382.8 | 734.1 | 82.6 | 651.5 | 21.2 |
| 2018 | 1,157.4 | 397.5 | 752.9 | 81.6 | 671.3 | 21.9 |
| 2019 | 1,185.2 | 413.0 | 772.1 | 86.7 | 685.5 | 23.3 |
| 2020 | 1,248.6 | 435.7 | 812.9 | 91.5 | 721.4 | 24.5 |
| 2021 | 1,652.2 | 502.4 | 1,149.8 | 101.1 | 1,048.8 | 20.4 |
| Payable in Canadian dollars | |||||
|---|---|---|---|---|---|
| Year | Treasury bills | Marketable bonds1 | Retail debt | Canada Pension Plan bonds |
Total |
| 1986 | 62.0 | 81.1 | 44.2 | 0.4 | 187.7 |
| 1987 | 77.0 | 94.4 | 44.3 | 1.8 | 217.5 |
| 1988 | 81.1 | 103.9 | 53.3 | 2.5 | 240.8 |
| 1989 | 102.7 | 115.7 | 47.8 | 3.0 | 269.2 |
| 1990 | 118.6 | 127.7 | 40.9 | 3.1 | 290.2 |
| 1991 | 139.2 | 143.6 | 34.4 | 3.5 | 320.7 |
| 1992 | 152.3 | 158.1 | 35.6 | 3.5 | 349.5 |
| 1993 | 162.1 | 178.5 | 34.4 | 3.5 | 378.4 |
| 1994 | 166.0 | 203.4 | 31.3 | 3.5 | 404.3 |
| 1995 | 164.5 | 225.7 | 31.4 | 3.5 | 425.1 |
| 1996 | 166.1 | 252.8 | 31.4 | 3.5 | 453.8 |
| 1997 | 135.4 | 282.6 | 33.5 | 3.5 | 454.9 |
| 1998 | 112.3 | 294.6 | 30.5 | 3.5 | 440.8 |
| 1999 | 97.0 | 295.8 | 28.2 | 4.1 | 425.0 |
| 2000 | 99.9 | 294.4 | 26.9 | 3.6 | 424.7 |
| 2001 | 88.7 | 295.5 | 26.4 | 3.5 | 414.1 |
| 2002 | 94.2 | 294.9 | 24.0 | 3.4 | 416.5 |
| 2003 | 104.6 | 289.2 | 22.6 | 3.4 | 419.8 |
| 2004 | 113.4 | 279.0 | 21.3 | 3.4 | 417.1 |
| 2005 | 127.2 | 266.7 | 19.1 | 3.4 | 416.3 |
| 2006 | 131.6 | 261.9 | 17.3 | 3.1 | 413.9 |
| 2007 | 134.1 | 257.9 | 15.2 | 1.7 | 408.9 |
| 2008 | 117.0 | 253.8 | 13.1 | 1.0 | 384.9 |
| 2009 | 192.5 | 295.3 | 12.5 | 0.5 | 500.8 |
| 2010 | 175.9 | 367.9 | 11.8 | 0.5 | 556.1 |
| 2011 | 163.0 | 416.1 | 10.1 | 0.0 | 589.2 |
| 2012 | 163.2 | 448.1 | 8.9 | 0.0 | 620.3 |
| 2013 | 180.7 | 469.0 | 7.5 | 0.0 | 657.2 |
| 2014 | 153.0 | 473.3 | 6.3 | 0.0 | 632.6 |
| 2015 | 135.7 | 487.9 | 5.7 | 0.0 | 629.2 |
| 2016 | 138.1 | 504.1 | 5.1 | 0.0 | 647.2 |
| 2017 | 136.7 | 536.3 | 4.5 | 0.0 | 677.5 |
| 2018 | 110.7 | 575.0 | 2.6 | 0.0 | 688.2 |
| 2019 | 134.3 | 569.5 | 1.2 | 0.0 | 705.1 |
| 2020 | 151.9 | 596.9 | 0.5 | 0.0 | 749.2 |
| 2021 | 218.8 | 875.3 | 0.3 | 0.0 | 1,109.8 |
|
1 Inflation adjusted. |
|||||
| Payable in foreign currencies | |||||||
|---|---|---|---|---|---|---|---|
| Year | Canada bills | Marketable bonds | Canada notes1 | Euro medium-term notes1 | Standby drawings |
Term loans | Total |
| 1986 | 0.0 | 9.3 | 0.0 | 0.0 | 2.2 | 2.2 | 13.8 |
| 1987 | 1.0 | 8.9 | 0.0 | 0.0 | 0.0 | 2.0 | 12.0 |
| 1988 | 1.0 | 7.9 | 0.0 | 0.0 | 0.0 | 2.3 | 11.3 |
| 1989 | 1.1 | 6.3 | 0.0 | 0.0 | 0.0 | 0.9 | 8.3 |
| 1990 | 1.4 | 4.3 | 0.0 | 0.0 | 0.0 | 0.0 | 5.7 |
| 1991 | 1.0 | 3.6 | 0.0 | 0.0 | 0.0 | 0.0 | 4.5 |
| 1992 | 0.0 | 3.4 | 0.0 | 0.0 | 0.0 | 0.0 | 3.4 |
| 1993 | 2.6 | 2.8 | 0.0 | 0.0 | 0.0 | 0.0 | 5.4 |
| 1994 | 5.6 | 5.0 | 0.0 | 0.0 | 0.0 | 0.0 | 10.7 |
| 1995 | 9.0 | 7.9 | 0.0 | 0.0 | 0.0 | 0.0 | 16.9 |
| 1996 | 7.0 | 9.5 | 0.3 | 0.0 | 0.0 | 0.0 | 16.8 |
| 1997 | 8.4 | 12.5 | 2.1 | 0.0 | 0.0 | 0.0 | 23.0 |
| 1998 | 9.4 | 14.6 | 1.7 | 1.5 | 0.0 | 0.0 | 27.2 |
| 1999 | 10.2 | 19.7 | 1.3 | 4.9 | 0.0 | 0.0 | 36.0 |
| 2000 | 6.0 | 21.4 | 1.1 | 4.1 | 0.0 | 0.0 | 32.6 |
| 2001 | 7.2 | 21.2 | 1.6 | 3.7 | 0.0 | 0.0 | 33.7 |
| 2002 | 3.4 | 19.8 | 1.2 | 3.2 | 0.0 | 0.0 | 27.5 |
| 2003 | 2.6 | 14.5 | 1.2 | 3.3 | 0.0 | 0.0 | 21.6 |
| 2004 | 3.4 | 13.2 | 1.3 | 3.0 | 0.0 | 0.0 | 20.8 |
| 2005 | 3.9 | 9.9 | 1.1 | 1.7 | 0.0 | 0.0 | 16.5 |
| 2006 | 4.7 | 7.6 | 0.5 | 1.5 | 0.0 | 0.0 | 14.3 |
| 2007 | 1.8 | 6.7 | 0.5 | 1.6 | 0.0 | 0.0 | 10.6 |
| 2008 | 1.5 | 6.1 | 0.5 | 1.6 | 0.0 | 0.0 | 9.7 |
| 2009 | 8.7 | 0.3 | 0.0 | 1.7 | 0.0 | 0.0 | 10.6 |
| 2010 | 2.5 | 5.8 | 0.0 | 0.0 | 0.0 | 0.0 | 8.2 |
| 2011 | 2.0 | 5.6 | 0.0 | 0.0 | 0.0 | 0.0 | 7.7 |
| 2012 | 2.1 | 8.6 | 0.0 | 0.0 | 0.0 | 0.0 | 10.7 |
| 2013 | 2.1 | 8.7 | 0.0 | 0.0 | 0.0 | 0.0 | 10.8 |
| 2014 | 2.3 | 13.0 | 0.6 | 0.1 | 0.0 | 0.0 | 16.0 |
| 2015 | 3.8 | 14.8 | 1.2 | 0.5 | 0.0 | 0.0 | 20.3 |
| 2016 | 4.7 | 15.3 | 1.6 | 0.9 | 0.0 | 0.0 | 22.5 |
| 2017 | 3.5 | 11.5 | 1.7 | 0.9 | 0.0 | 0.0 | 17.6 |
| 2018 | 2.6 | 10.9 | 1.7 | 0.9 | 0.0 | 0.0 | 16.0 |
| 2019 | 2.7 | 11.0 | 1.7 | 0.6 | 0.0 | 0.0 | 16.0 |
| 2020 | 2.2 | 12.7 | 0.7 | 0.4 | 0.0 | 0.0 | 15.9 |
| 2021 | 4.1 | 11.3 | 0.1 | 0.0 | 0.0 | 0.0 | 15.4 |
|
1 Amounts for 2016 and 2017 and have restated following historical revisions. |
|||||||
| Total market debt | |||||
|---|---|---|---|---|---|
| Year | Total payable in Canadian dollars | Total payable in foreign currencies |
Less: Government’s holdings and consolidation adjustment1 |
Total market debt | Average interest rate (%) |
| 1987 | 217.5 | 12.0 | -0.9 | 228.6 | 9.3 |
| 1988 | 240.8 | 11.3 | -1.2 | 250.8 | 9.6 |
| 1989 | 269.2 | 8.3 | -1.2 | 276.3 | 10.8 |
| 1990 | 290.2 | 5.7 | -1.3 | 294.6 | 11.2 |
| 1991 | 320.7 | 4.5 | -1.3 | 323.9 | 10.7 |
| 1992 | 349.5 | 3.4 | -1.0 | 351.8 | 8.9 |
| 1993 | 378.4 | 5.4 | -1.1 | 382.7 | 7.9 |
| 1994 | 404.3 | 10.7 | -1.0 | 414.0 | 6.8 |
| 1995 | 425.1 | 16.9 | -1.0 | 441.0 | 8.0 |
| 1996 | 453.8 | 16.8 | -1.0 | 469.5 | 7.3 |
| 1997 | 454.9 | 23.0 | -1.1 | 476.8 | 6.7 |
| 1998 | 440.8 | 27.2 | -1.2 | 466.8 | 6.6 |
| 1999 | 425.0 | 36.0 | -3.3 | 457.7 | 6.7 |
| 2000 | 424.7 | 32.6 | -3.1 | 454.2 | 6.2 |
| 2001 | 414.1 | 33.7 | -2.9 | 444.9 | 6.1 |
| 2002 | 416.5 | 27.5 | -3.1 | 440.9 | 5.6 |
| 2003 | 419.8 | 21.6 | -2.7 | 438.6 | 5.3 |
| 2004 | 417.1 | 20.8 | -1.5 | 436.4 | 4.9 |
| 2005 | 416.3 | 16.5 | -1.1 | 431.7 | 4.6 |
| 2006 | 413.9 | 14.3 | -1.0 | 427.2 | 4.7 |
| 2007 | 408.9 | 10.6 | -0.7 | 418.9 | 4.9 |
| 2008 | 384.9 | 9.7 | -0.5 | 394.1 | 4.6 |
| 2009 | 500.8 | 10.6 | -0.6 | 510.8 | 3.2 |
| 2010 | 556.1 | 8.2 | -0.1 | 564.2 | 2.7 |
| 2011 | 589.2 | 7.7 | -0.1 | 596.8 | 2.8 |
| 2012 | 620.3 | 10.7 | -0.1 | 631.0 | 2.7 |
| 2013 | 657.2 | 10.8 | -0.0 | 668.0 | 2.5 |
| 2014 | 632.6 | 16.0 | -0.3 | 648.7 | 2.4 |
| 2015 | 629.2 | 20.3 | -0.4 | 649.5 | 2.3 |
| 2016 | 647.2 | 22.5 | 0.1 | 669.7 | 2.0 |
| 2017 | 677.5 | 17.6 | -0.4 | 695.1 | 1.9 |
| 2018 | 688.3 | 16.0 | 0.9 | 704.3 | 2.0 |
| 2019 | 705.1 | 16.0 | -0.4 | 721.1 | 2.2 |
| 2020 | 749.2 | 15.9 | -0.3 | 765.2 | 2.0 |
| 2021 | 1,094.4 | 15.4 | -0.3 | 1,109.8 | 1.4 |
|
1 Because certain comparative figures have been restated to reflect the presentation method used in recent years, the numbers presented in this reference table can differ from numbers presented in other sections of the Debt Management Report. In the reference table, ‘’Government’s holdings and consolidation adjustment’’ is presented separately but in the rest of the report the amount is incorporated into the figures. For more information, please consult table 6.2 and table 6.3 of the Public Accounts of Canada 2021. |
|||||
| Gross issuance | |||||||||||||
|---|---|---|---|---|---|---|---|---|---|---|---|---|---|
| Nominal1 | Real Return Bonds | Buybacks | |||||||||||
| Fiscal year | 2-year | 3-year | 5-year | 10-year | 30-year | Total | 30-year | Total | Cash | Switch | Total | Net issuance |
|
| 1995-96 | 11.1 | 5.1 | 17.0 | 10.5 | 5.0 | 48.7 | 1.0 | 49.7 | 0.0 | 49.7 | |||
| 1996-97 | 12.0 | 11.1 | 13.3 | 11.8 | 5.8 | 54.0 | 1.7 | 55.7 | 0.0 | 55.7 | |||
| 1997-98 | 14.0 | 9.9 | 9.3 | 5.0 | 38.2 | 1.7 | 39.9 | 0.0 | 39.9 | ||||
| 1998-99 | 14.0 | 9.8 | 9.2 | 3.3 | 36.3 | 1.6 | 37.9 | 0.0 | 37.9 | ||||
| 1999-00 | 14.2 | 14.0 | 12.9 | 3.7 | 44.8 | 1.3 | 46.0 | -2.7 | 0.0 | -2.7 | 43.3 | ||
| 2000-01 | 14.1 | 10.5 | 10.1 | 3.8 | 38.5 | 1.4 | 39.9 | -2.8 | 0.0 | -2.8 | 37.1 | ||
| 2001-02 | 14.0 | 10.0 | 9.9 | 6.3 | 40.2 | 1.4 | 41.6 | -5.3 | -0.4 | -5.6 | 35.9 | ||
| 2002-03 | 13.9 | 11.0 | 12.6 | 4.8 | 42.3 | 1.4 | 43.7 | -7.1 | -5.0 | -12.1 | 31.6 | ||
| 2003-04 | 13.0 | 10.7 | 11.5 | 4.2 | 39.4 | 1.4 | 40.8 | -5.2 | -5.0 | -10.2 | 30.7 | ||
| 2004-05 | 12.0 | 9.6 | 10.6 | 3.3 | 35.5 | 1.4 | 36.9 | -6.8 | -4.7 | -11.4 | 25.5 | ||
| 2005-06 | 10.0 | 9.2 | 10.0 | 3.2 | 32.4 | 1.5 | 33.9 | -5.3 | -3.3 | -8.6 | 25.3 | ||
| 2006-07 | 10.3 | 7.8 | 10.4 | 3.3 | 31.8 | 1.6 | 33.4 | -5.1 | -4.7 | -9.8 | 23.5 | ||
| 2007-08 | 11.7 | 6.3 | 10.7 | 3.4 | 32.0 | 2.3 | 34.3 | -4.3 | -2.4 | -6.7 | 27.6 | ||
| 2008-09 | 23.2 | 29.0 | 15.7 | 5.1 | 72.9 | 2.1 | 75.0 | -3.2 | -2.7 | -6.0 | 69.0 | ||
| 2009-10 | 31.5 | 20.1 | 24.0 | 17.4 | 7.0 | 100.0 | 2.2 | 102.2 | 0.0 | -2.1 | -2.1 | 100.1 | |
| 2010-11 | 36.3 | 18.8 | 21.2 | 12.0 | 5.0 | 93.3 | 2.2 | 95.5 | 0.0 | -4.4 | -4.4 | 91.2 | |
| 2011-12 | 44.0 | 18.0 | 21.0 | 10.0 | 4.7 | 97.7 | 2.2 | 99.9 | -3.0 | -3.0 | -5.9 | 94.0 | |
| 2012-13 | 35.9 | 13.9 | 20.4 | 16.5 | 6.7 | 93.4 | 2.2 | 95.6 | -0.4 | -1.1 | -1.5 | 94.1 | |
| 2013-14 | 32.4 | 13.5 | 20.4 | 14.0 | 5.0 | 85.3 | 2.2 | 87.5 | 0.0 | -1.0 | -1.0 | 86.5 | |
| 2014-15 | 38.4 | 16.2 | 20.4 | 13.3 | 4.6 | 92.9 | 2.2 | 95.1 | 0.0 | -0.5 | -0.5 | 94.6 | |
| 2015-16 | 50.2 | 26.8 | 10.0 | 3.2 | 90.2 | 2.2 | 92.4 | 0.0 | -0.4 | -0.4 | 92.0 | ||
| 2016-17 | 62.4 | 19.5 | 30.0 | 15.0 | 4.3 | 131.2 | 2.2 | 133.4 | 0.0 | -0.8 | -0.8 | 132.6 | |
| 2017-18 | 59.1 | 24.7 | 30.6 | 15.0 | 4.3 | 133.7 | 2.2 | 135.9 | 0.0 | -0.8 | -0.8 | 135.1 | |
| 2018-19 | 48.0 | 8.2 | 24.0 | 13.5 | 3.8 | 97.5 | 2.2 | 99.7 | 0.0 | -0.8 | -0.8 | 98.9 | |
| 2019-20 | 53.0 | 19.7 | 33.5 | 13.5 | 5.5 | 125.2 | 1.8 | 127.0 | 0.0 | -2.8 | -2.8 | 124.2 | |
| 2020-21 | 129.0 | 56.5 | 77.5 | 73.5 | 32.0 | 368.5 | 1.4 | 369.9 | 0.0 | 0.0 | 0.0 | 369.9 | |
|
1 Including nominal issuance through switch buyback operations. |
|||||||||||||
Maturity date |
Amount ($ millions) |
Coupon rate (%) |
|---|---|---|
| 1-May-2021 | 10,767 | 1.75 |
| 1-Jun-2021 | 11,175 | 3.25 |
| 1-Jun-2021 | 286 | 9.75 |
| 1-Aug-2021 | 11,967 | 1.50 |
| 1-Sep-2021 | 19,065 | 0.75 |
| 1-Nov-2021 | 12,000 | 1.25 |
| 1-Feb-2022 | 12,000 | 1.50 |
| 1-Mar-2022 | 19,000 | 0.50 |
| 1-May-2022 | 20,000 | 1.50 |
| 1-Jun-2022 | 12,700 | 2.75 |
| 1-Jun-2022 | 206 | 9.25 |
| 1-Aug-2022 | 30,000 | 0.25 |
| 1-Sep-2022 | 25,200 | 1.00 |
| 1-Nov-2022 | 37,000 | 0.25 |
| 1-Feb-2023 | 32,000 | 0.25 |
| 1-Mar-2023 | 24,600 | 1.75 |
| 1-May-2023 | 24,000 | 0.25 |
| 1-Jun-2023 | 14,200 | 1.50 |
| 1-Jun-2023 | 2,359 | 8.00 |
| 1-Sep-2023 | 40,500 | 2.00 |
| 1-Mar-2024 | 11,908 | 2.25 |
| 1-Apr-2024 | 28,000 | 0.25 |
| 1-Jun-2024 | 13,700 | 2.50 |
| 1-Sep-2024 | 16,065 | 1.50 |
| 1-Mar-2025 | 17,300 | 1.25 |
| 1-Jun-2025 | 13,100 | 2.25 |
| 1-Jun-2025 | 2,134 | 9.00 |
| 1-Sep-2025 | 47,500 | 0.50 |
| 1-Mar-2026 | 30,000 | 0.25 |
| 1-Jun-2026 | 13,472 | 1.50 |
| 1-Jun-2027 | 14,740 | 1.00 |
| 1-Jun-2027 | 3,621 | 8.00 |
| 1-Jun-2028 | 13,500 | 2.00 |
| 1-Jun-2029 | 12,300 | 2.25 |
| 1-Jun-2029 | 10,599 | 5.75 |
| 1-Jun-2030 | 44,200 | 1.25 |
| 1-Dec-2030 | 40,000 | 0.50 |
| 1-Jun-2033 | 11,989 | 5.75 |
| 1-Jun-2037 | 11,731 | 5.00 |
| 1-Jun-2041 | 13,838 | 4.00 |
| 1-Dec-2045 | 16,300 | 3.50 |
| 1-Dec-2048 | 14,900 | 2.75 |
| 1-Dec-2051 | 42,817 | 2.00 |
| 1-Dec-2064 | 4,750 | 2.75 |
| Fixed-coupon bonds—total | 807,487 |
| Maturity date | Amount ($ millions) |
Coupon rate (%) |
Inflation adjustment ($ millions) |
Outstanding amount ($ millions) |
|---|---|---|---|---|
| 1-Dec-2021 | 5,175 | 4.25 | 3,432 | 8,607 |
| 1-Dec-2026 | 5,250 | 4.25 | 3,010 | 8,260 |
| 1-Dec-2031 | 5,800 | 4.00 | 2,970 | 8,770 |
| 1-Dec-2036 | 5,850 | 3.00 | 1,998 | 7,848 |
| 1-Dec-2041 | 6,550 | 2.00 | 1,588 | 8,138 |
| 1-Dec-2044 | 7,700 | 1.50 | 1,504 | 9,204 |
| 1-Dec-2047 | 7,700 | 1.25 | 930 | 8,630 |
| 1-Dec-2050 | 7,600 | 0.50 | 480 | 8,080 |
| Real Return Bonds—total | 51,625 | 15,911 | 67,536 | |
|
Note: Outstanding bond amounts reported in this table are in accordance with Bank of Canada reports, which may vary slightly with Government of Canada amounts due to differences in classification methods. |
||||
| Swaps of domestic obligations | |||||
|---|---|---|---|---|---|
| Maturity date | USD | EUR | JPY | GBP | Total |
| 2021 | 1,086 | 4,634 | 0 | 0 | 5,721 |
| 2022 | 5,049 | 486 | 533 | 0 | 6,069 |
| 2023 | 7,097 | 516 | 2,088 | 147 | 9,848 |
| 2024 | 4,205 | 1,908 | 1,305 | 225 | 7,644 |
| 2025 | 3,204 | 280 | 1,543 | 4,147 | 9,175 |
| 2026 | 6,761 | 626 | 0 | 806 | 8,193 |
| 2027 | 2,670 | 1,768 | 0 | 2,443 | 6,881 |
| 2028 | 8,451 | 1,179 | 0 | 0 | 9,630 |
| 2029 | 4,273 | 2,390 | 0 | 0 | 6,663 |
| 2030 | 2,513 | 4,060 | 0 | 0 | 6,573 |
| Total | 45,310 | 17,848 | 5,470 | 7,768 | 76,395 |
|
Note: Foreign currency swaps converted to Canadian dollars using Bank of Canada closing exchange rates as of March 31, 2021. Includes cross-currency swaps related to IMF transactions. Table does not include $4,191 million in foreign exchange forwards and $454 million in foreign exchange swaps that were outstanding as at March 31, 2021. Totals may not add due to rounding. |
|||||
| Borrowings from the market | 2011 | 2012 | 2013 | 2014 | 2015 | 2016 | 2017 | 2018 | 2019 | 2020 | 2021 |
|---|---|---|---|---|---|---|---|---|---|---|---|
| Export Development Canada | 22,033 | 24,141 | 26,613 | 36,393 | 41,985 | 46,687 | 49,226 | 55,470 | 55,217 | 63,249 | 47,532 |
| Business Development Bank of Canada | 897 | 658 | 648 | 507 | 305 | 253 | 163 | 139 | 137 | 142 | 128 |
| Farm Credit Canada | 1,293 | 913 | 691 | 615 | 669 | 762 | 815 | 833 | 818 | 833 | 852 |
| Canada Mortgage and Housing Corporation | 3,039 | 2,221 | 1,870 | 1,465 | 1,429 | 282 | 0 | 0 | 0 | 0 | 0 |
| Canada Housing Trust1 | 199,238 | 213,251 | 212,639 | 205,113 | 207,544 | 217,392 | 225,306 | 233,981 | 237,516 | 244,643 | 265,191 |
| Canada Post Corporation | 1,051 | 1,051 | 1,051 | 1,051 | 1,051 | 997 | 997 | 997 | 997 | 997 | 997 |
| Other | 204 | 106 | 106 | 128 | 137 | 109 | 52 | 48 | 49 | 45 | 27 |
| Total | 227,755 | 242,341 | 243,617 | 245,272 | 253,120 | 266,482 | 276,559 | 291,469 | 294,734 | 309,909 | 314,727 |
|
1 Canada Housing Trust has been included in the government reporting entity effective April 1, 2005 as a result of the application of a new accountingstandard. |
|||||||||||
| 2011 | 2012 | 2013 | 2014 | 2015 | 2016 | 2017 | 2018 | 2019 | 2020 | 2021 | |
|---|---|---|---|---|---|---|---|---|---|---|---|
| Business Development Bank of Canada |
13,223 | 12,561 | 13,214 | 14,320 | 15,676 | 16,942 | 18,811 | 20,470 | 22,235 | 23,405 | 18,226 |
| Canada Mortgage and Housing Corporation1 | 69,569 | 66,595 | 63,123 | 21,173 | 10,708 | 10,531 | 9,811 | 8,687 | 8,095 | 14,377 | 15,284 |
| Farm Credit Canada | 17,558 | 19,326 | 21,174 | 22,029 | 22,691 | 23,438 | 25,684 | 28,009 | 29,862 | 32,654 | 34,342 |
| Other | 122 | 92 | 90 | 149 | 333 | 340 | 455 | 468 | 5,2442 | 6,6872 | 10,4192 |
| Total | 100,472 | 98,574 | 97,602 | 57,670 | 49,408 | 51,251 | 54,761 | 57,633 | 65,436 | 77,122 | 78,271 |
|
1 Includes outstanding lending related to the Insured Mortgage Purchase Program for 2009 to 2014. |
|||||||||||